this is a bar graph and this bar graph does not have a name and its wield the graph has education
listed health is listed and people who have HIV/AIDS
This graph seems to be showing how aid is distributed. It seems that more aid goes toward
education than sanitation. Water and sanitation is ranked lowest in matters of support.
I'm not exactly sure what the graph is about but it seems like a graph that shows which industries
pay the most to have their water to be clean/drinkable.
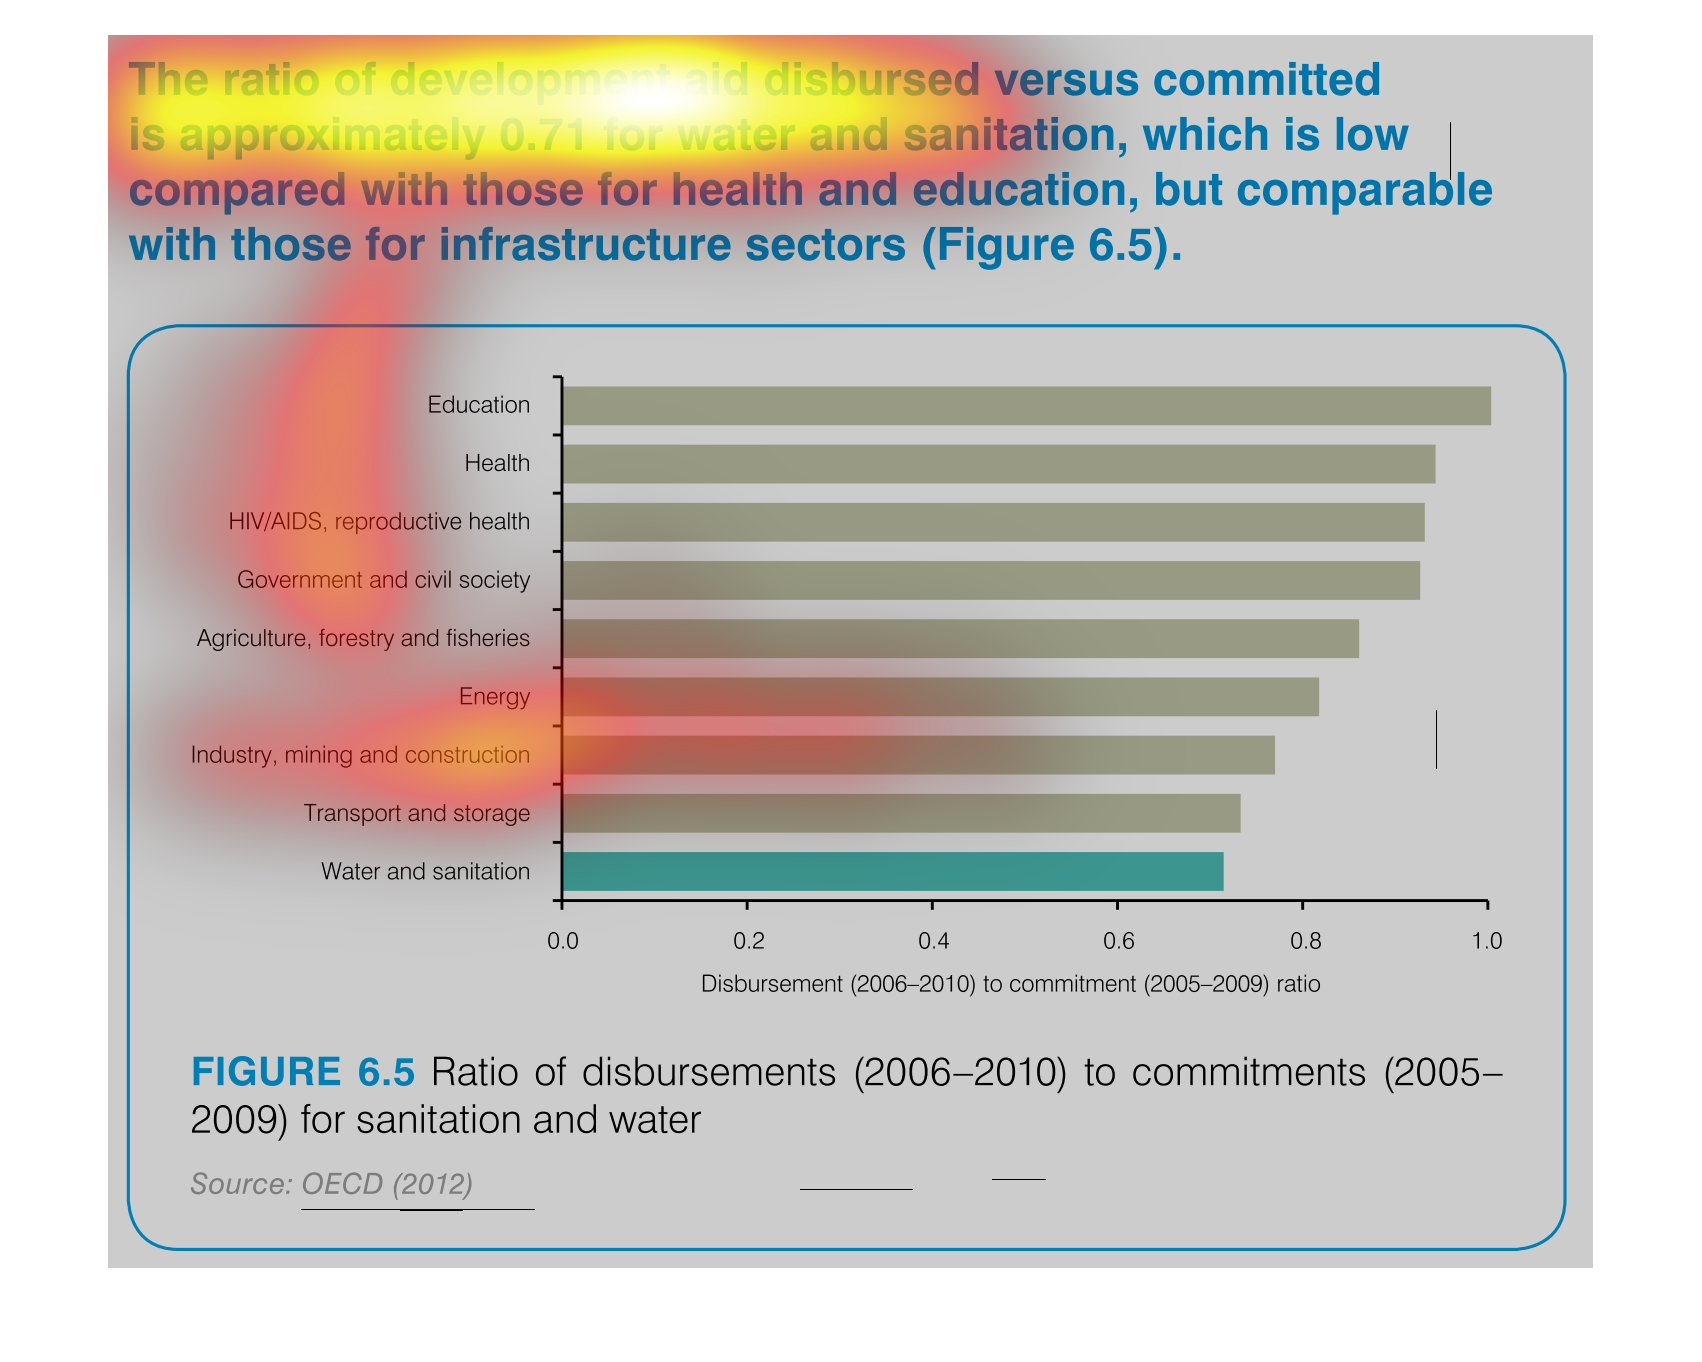
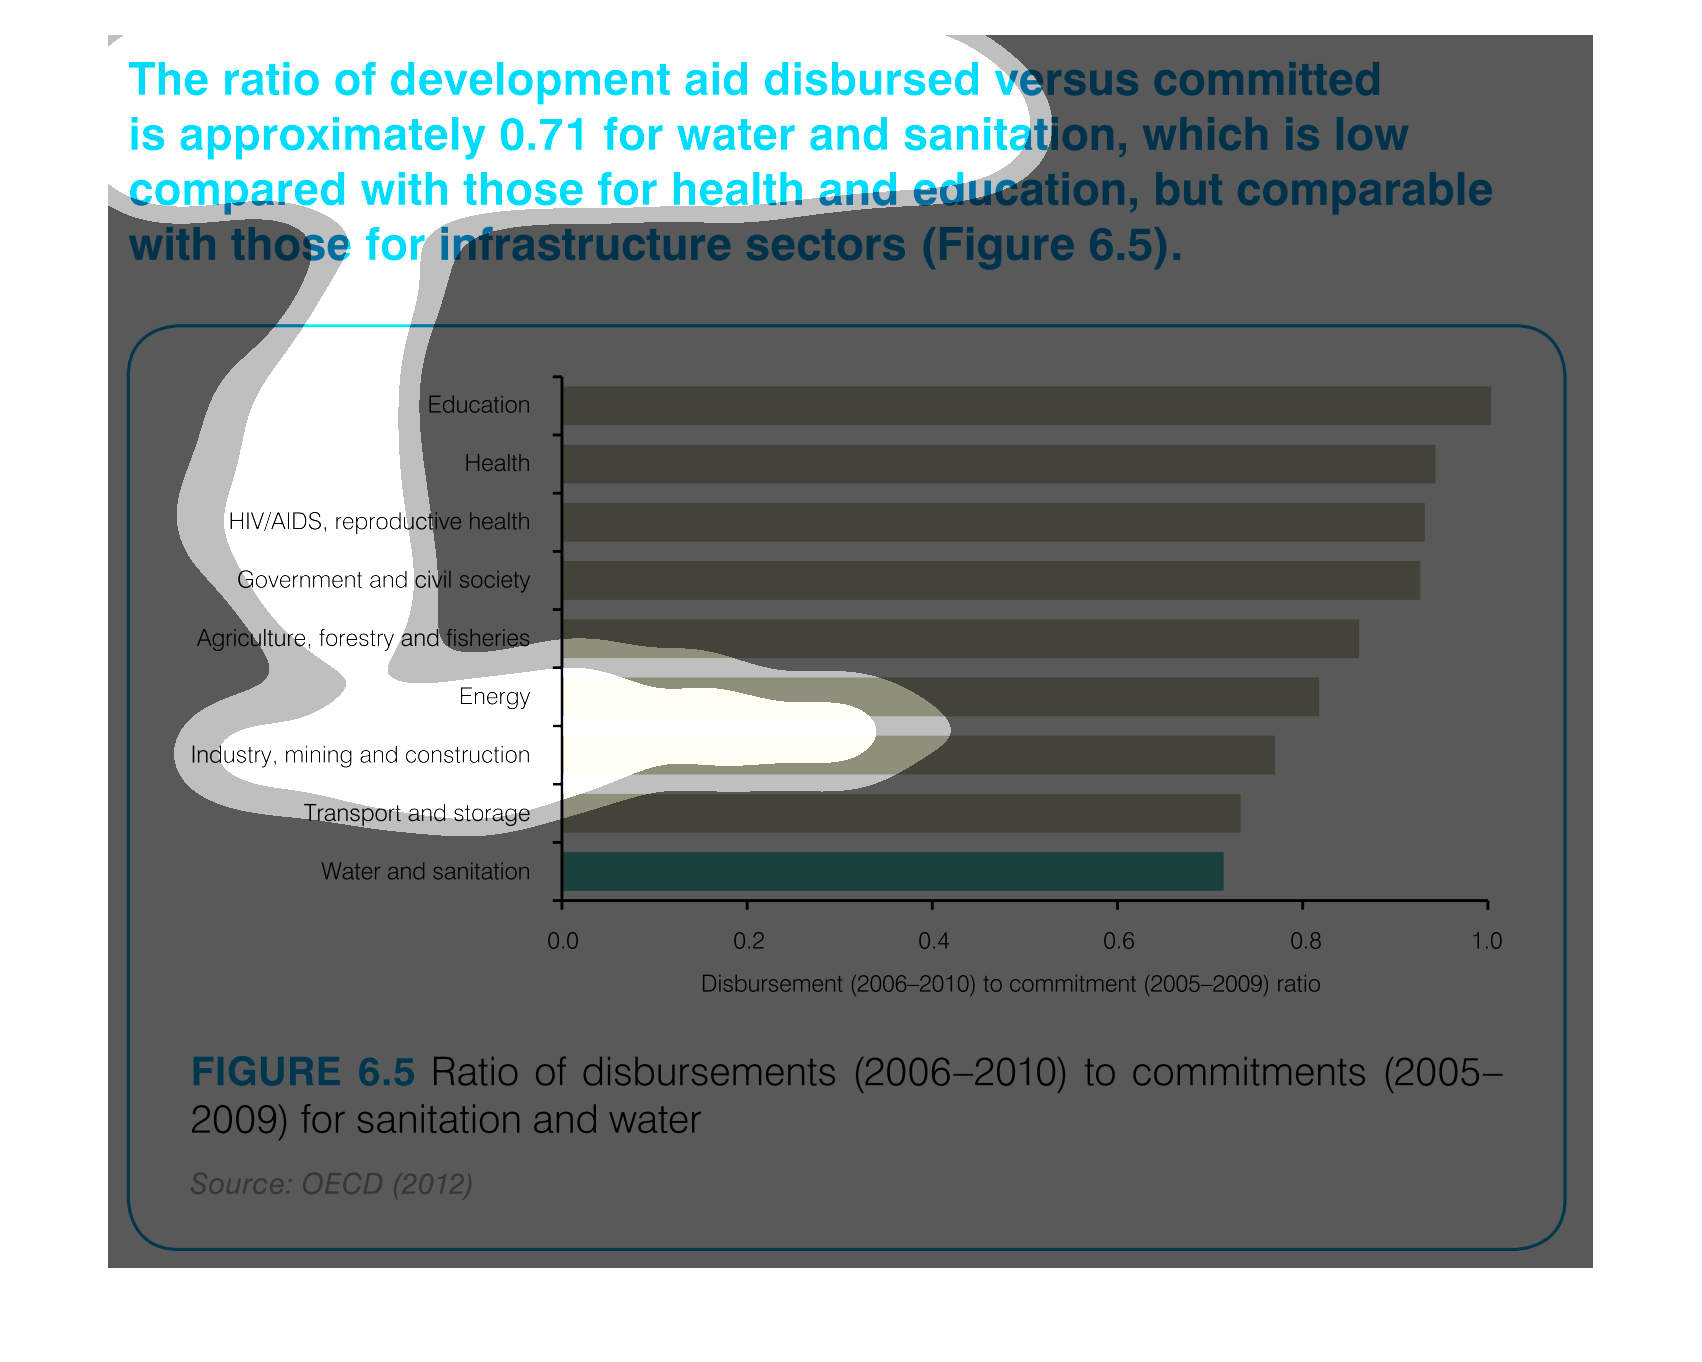
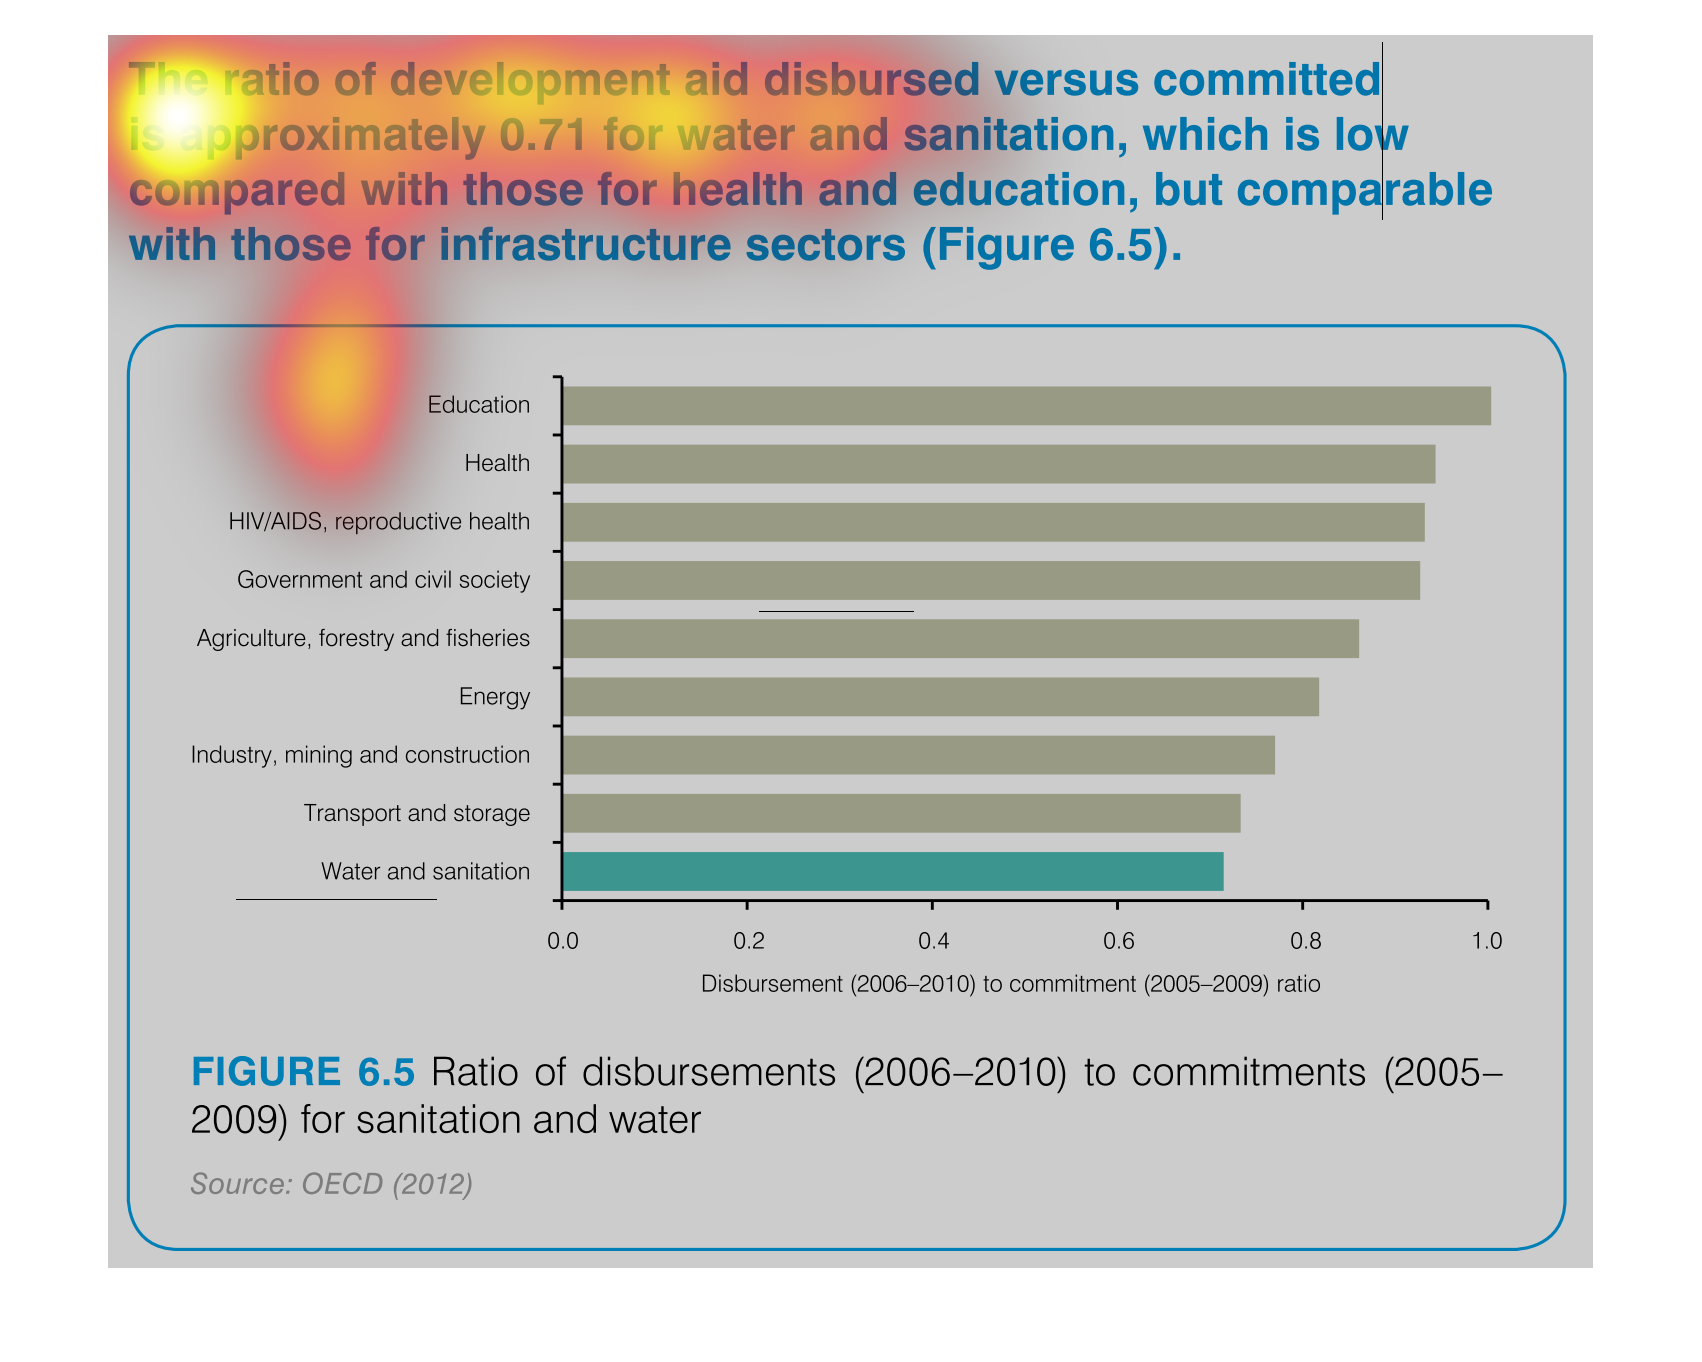
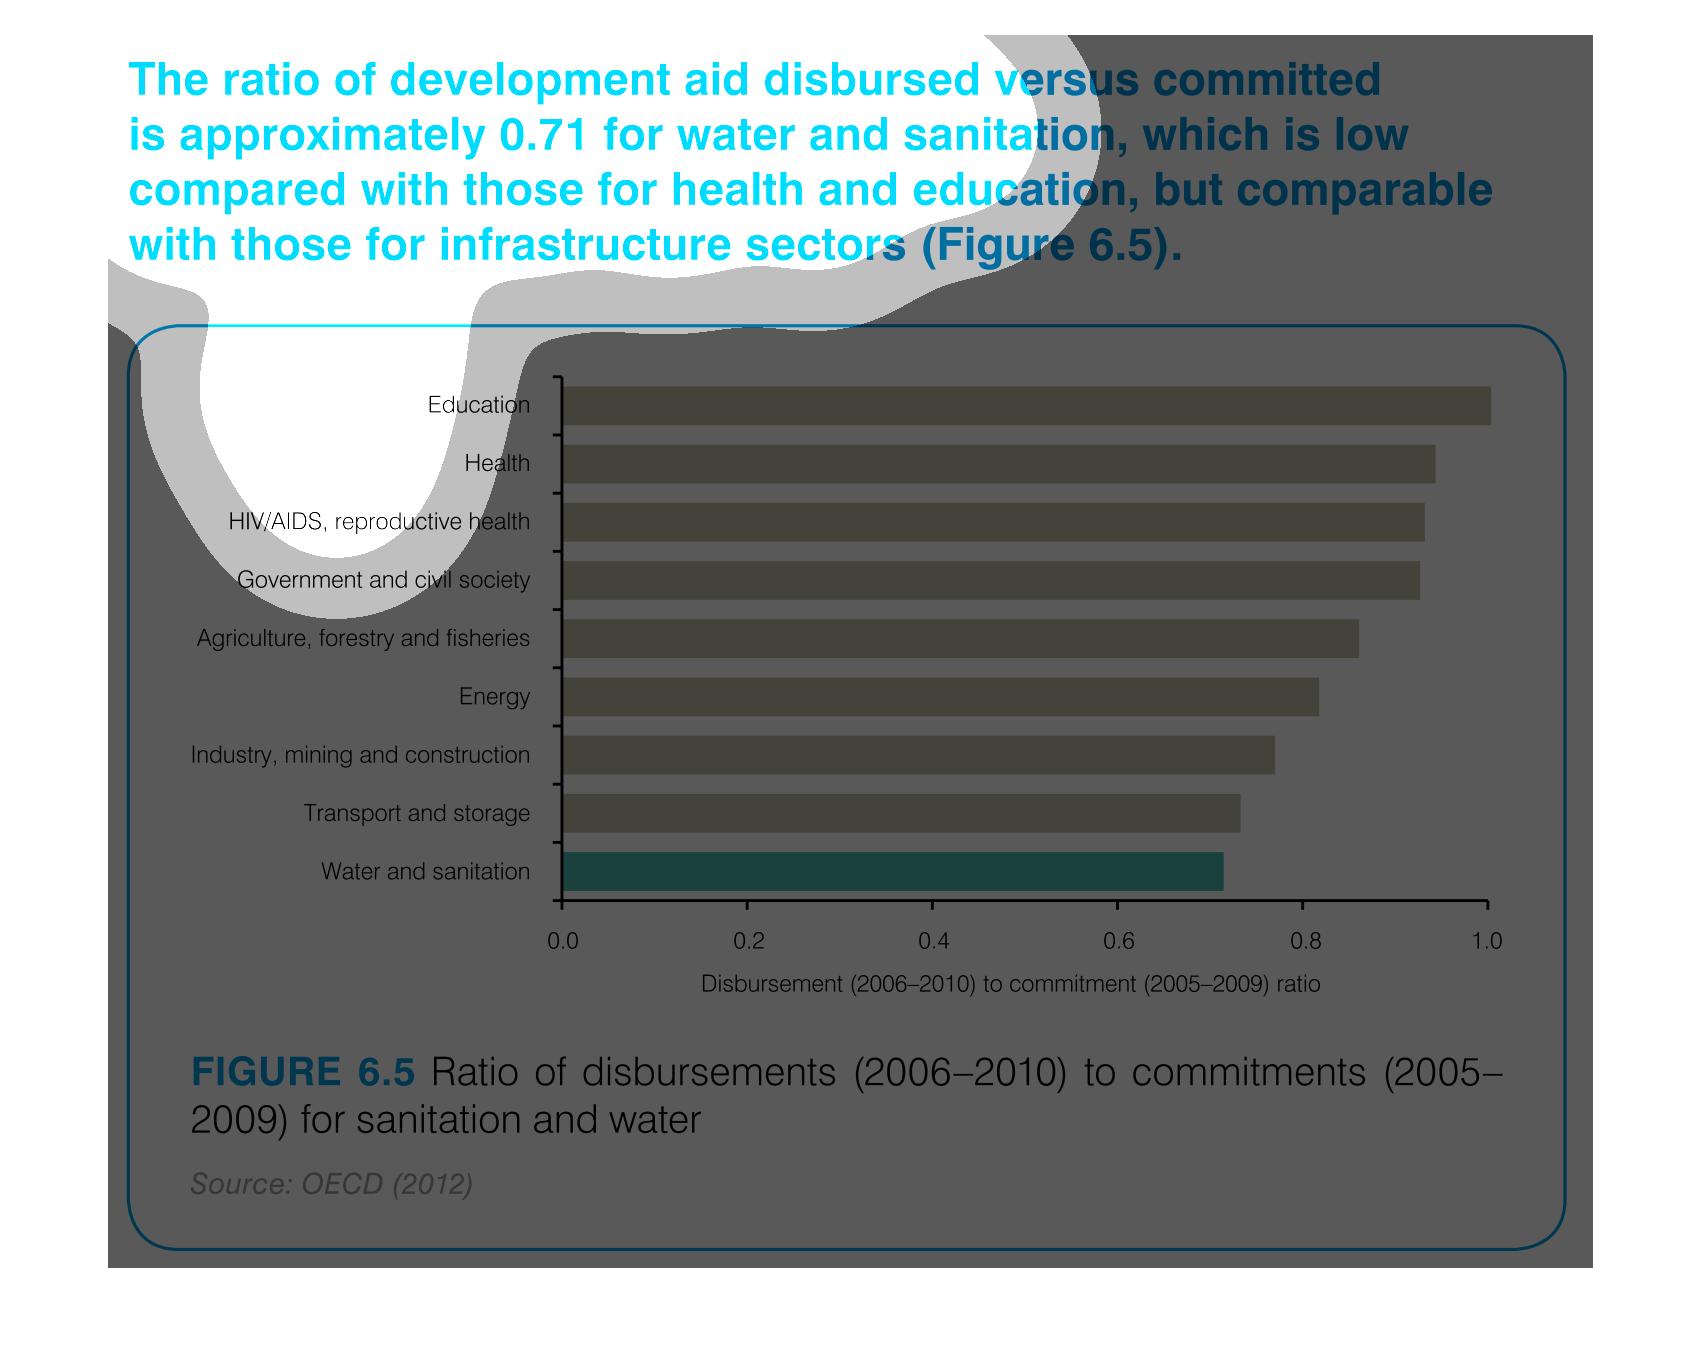
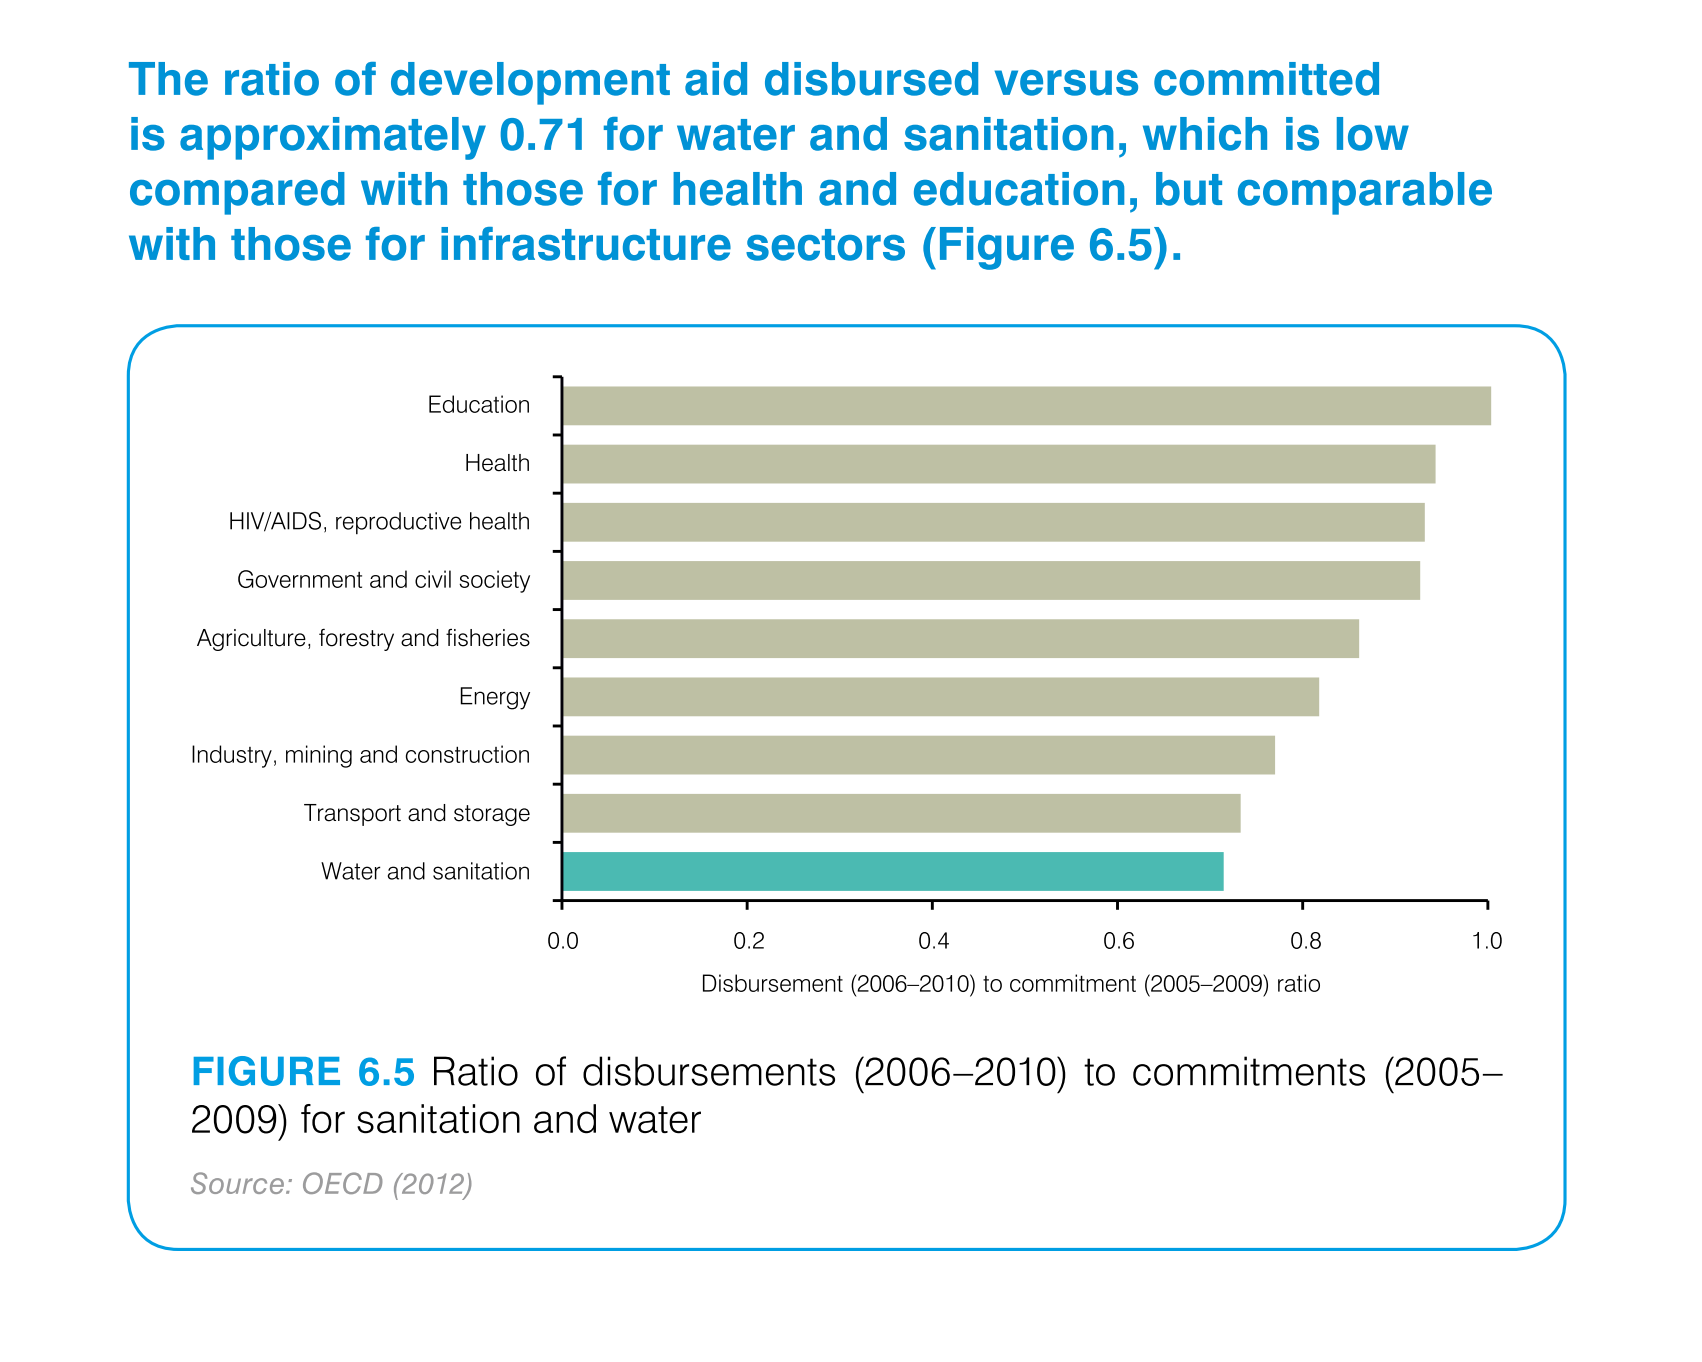
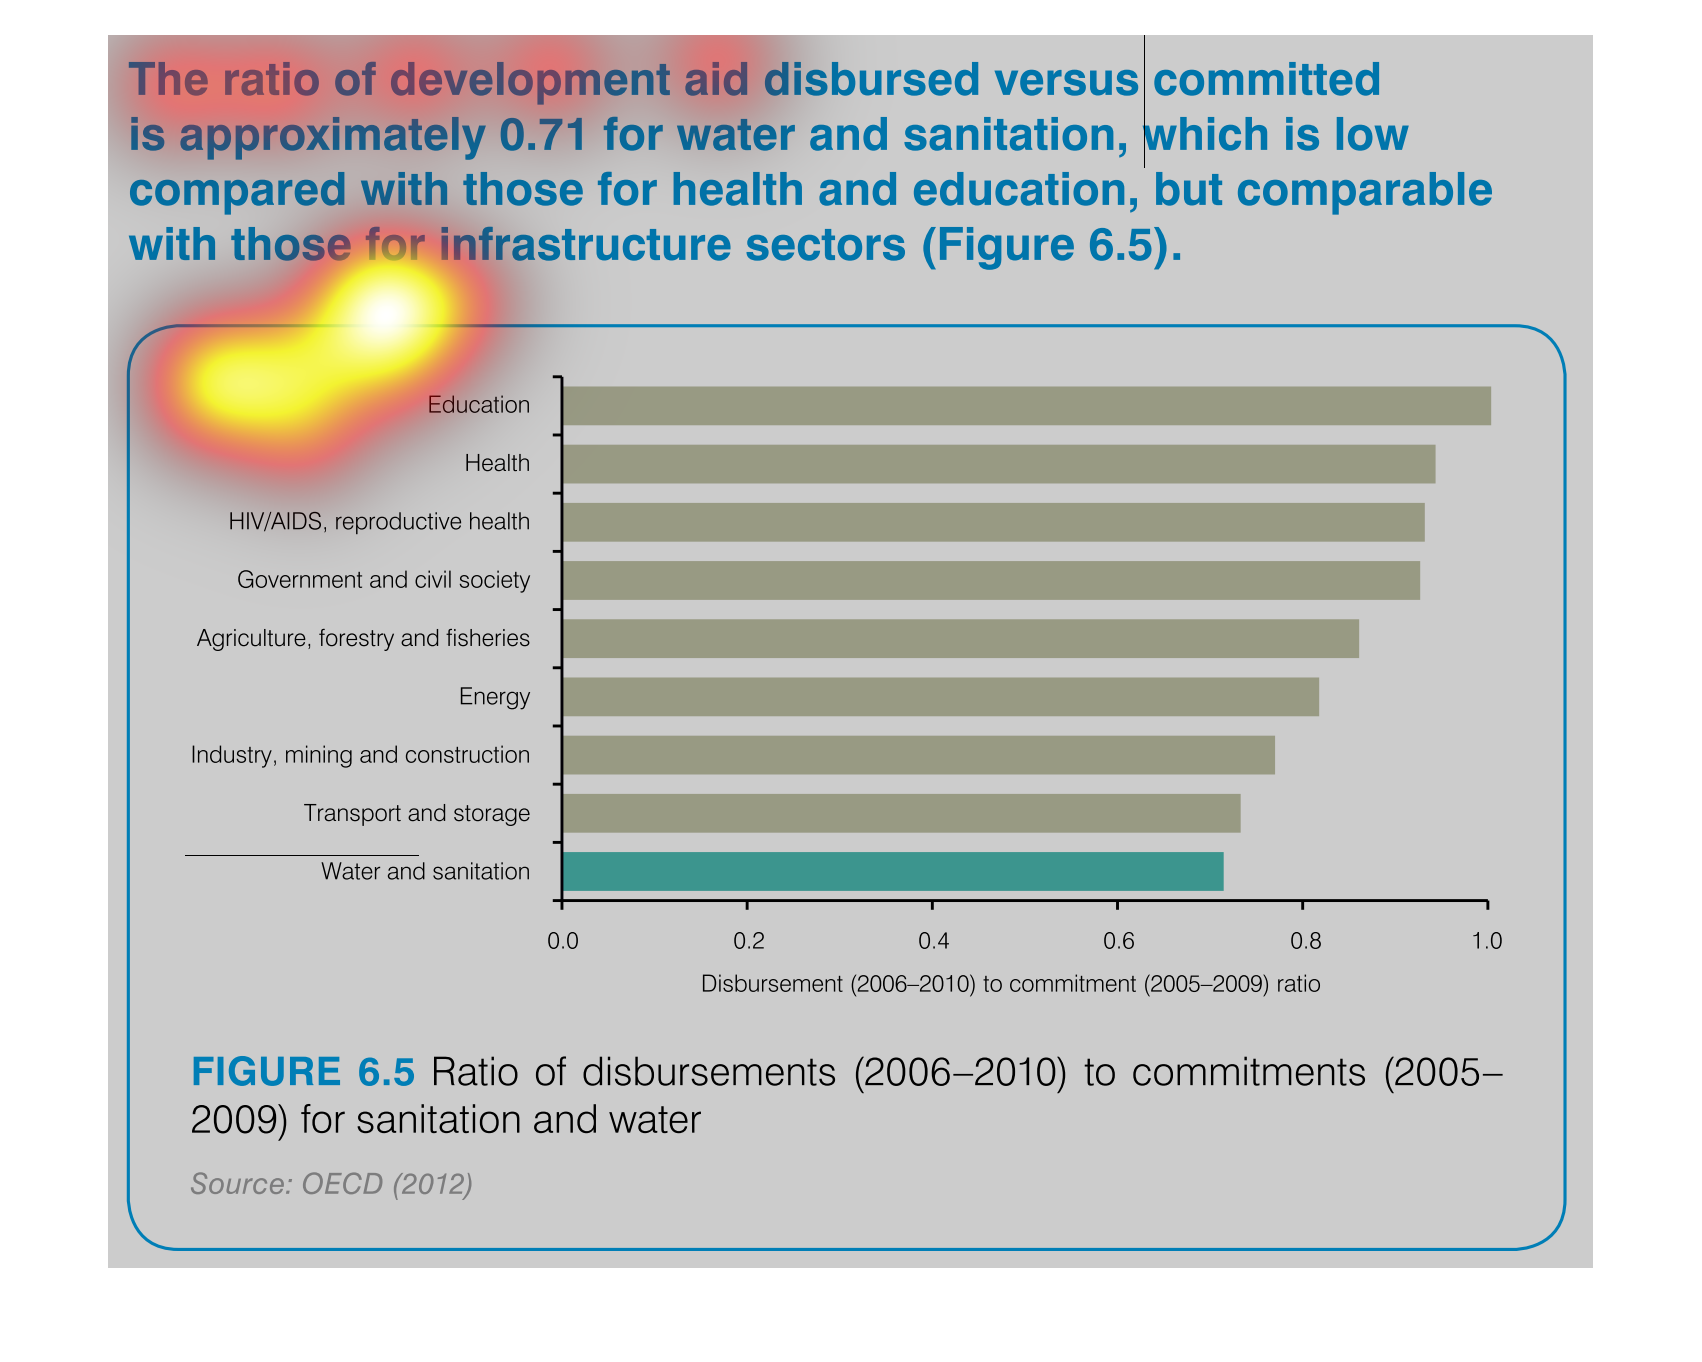
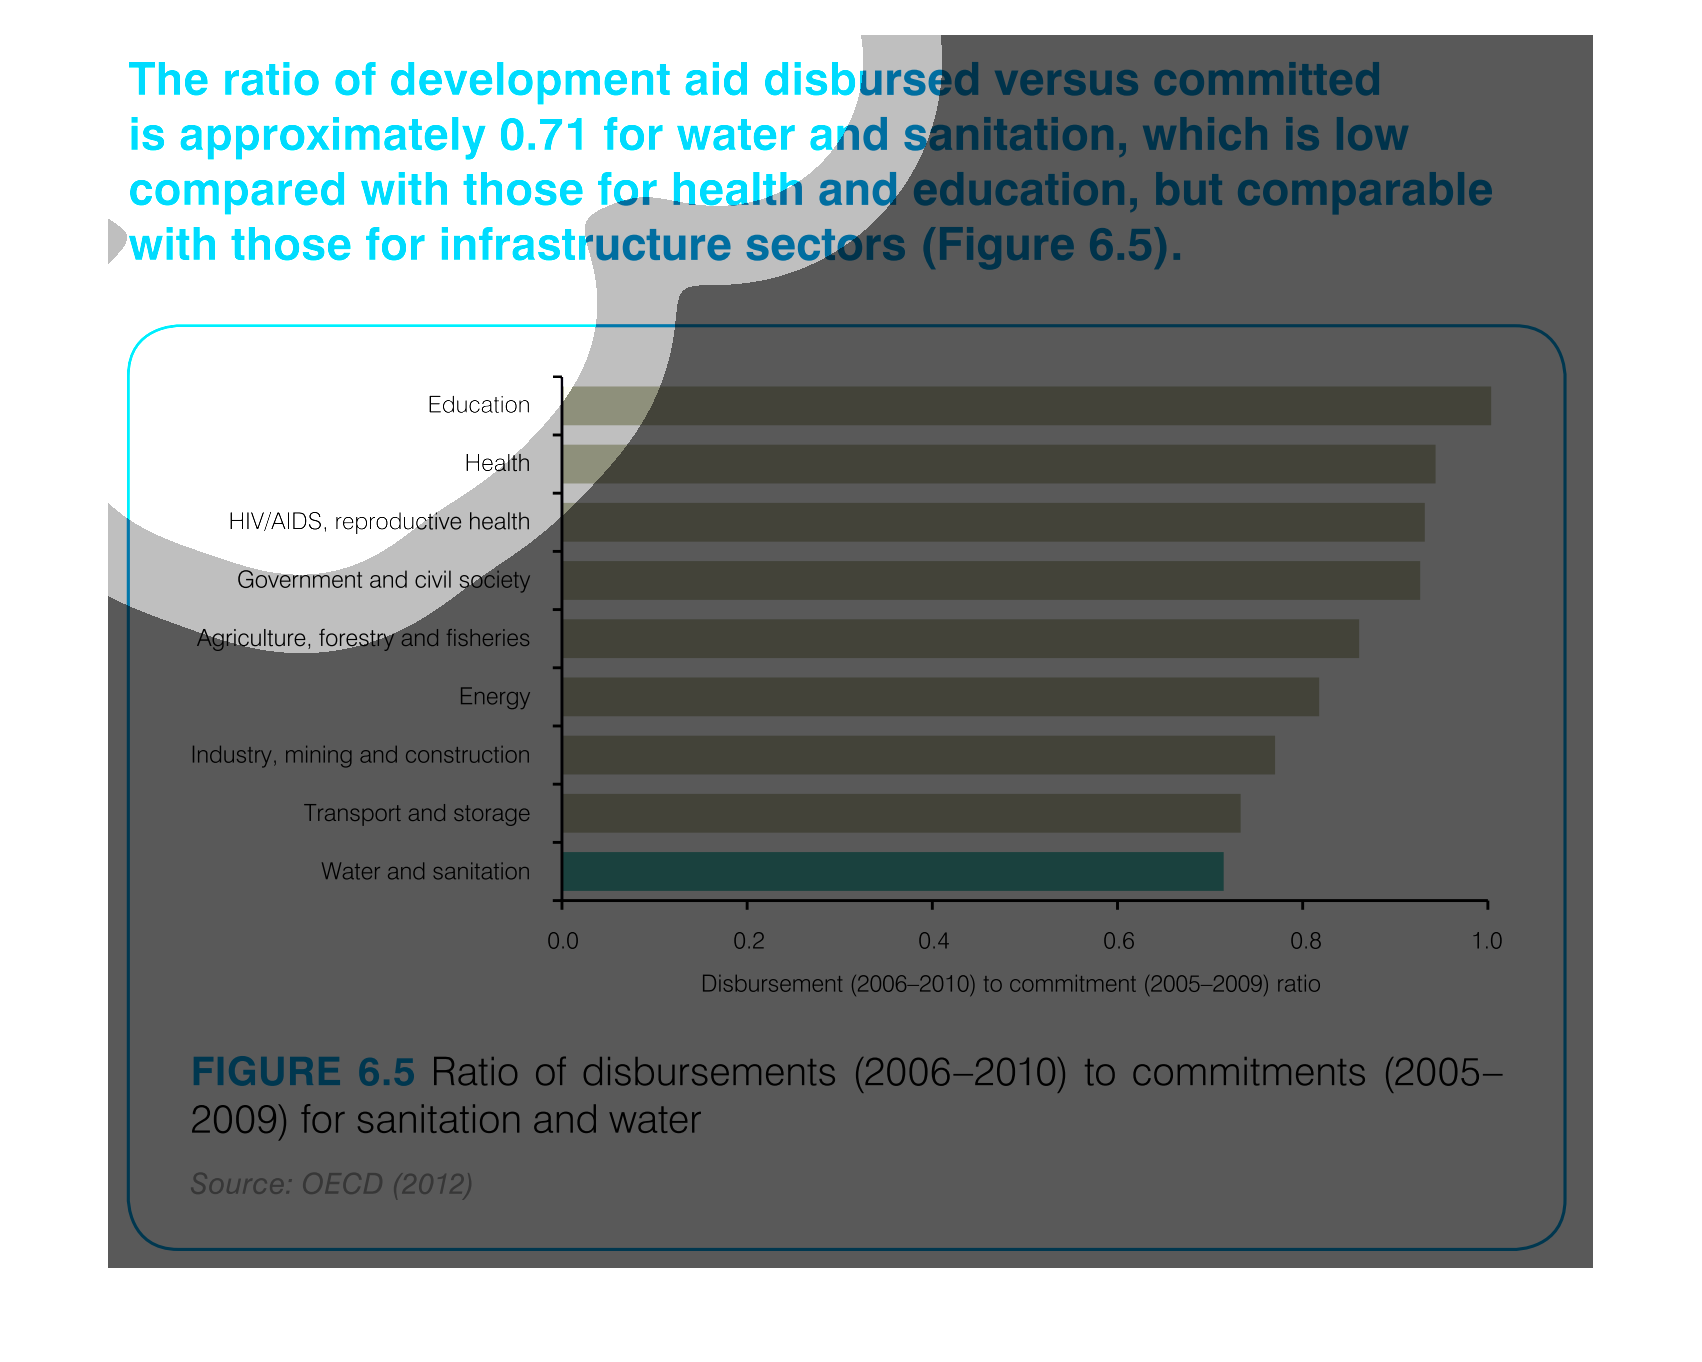
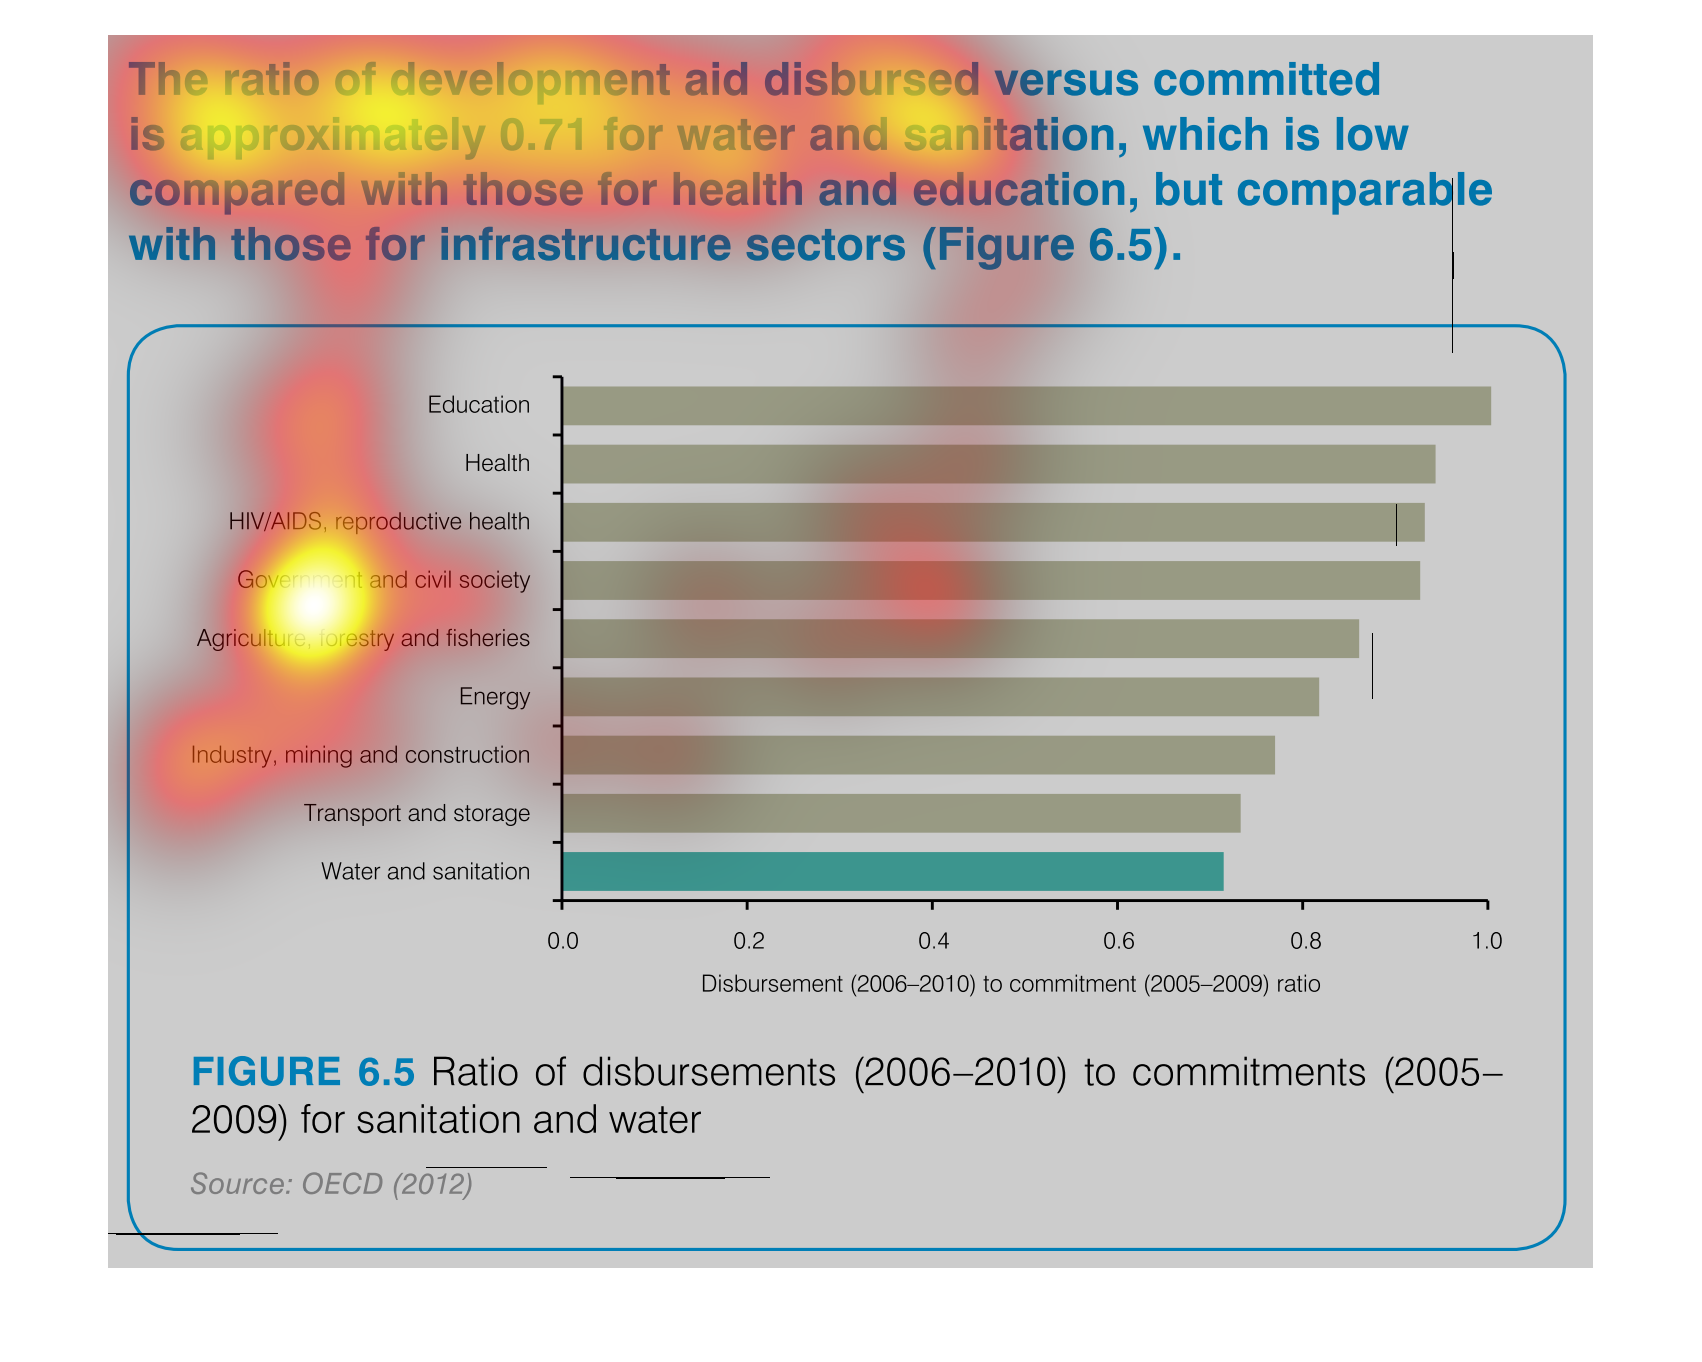
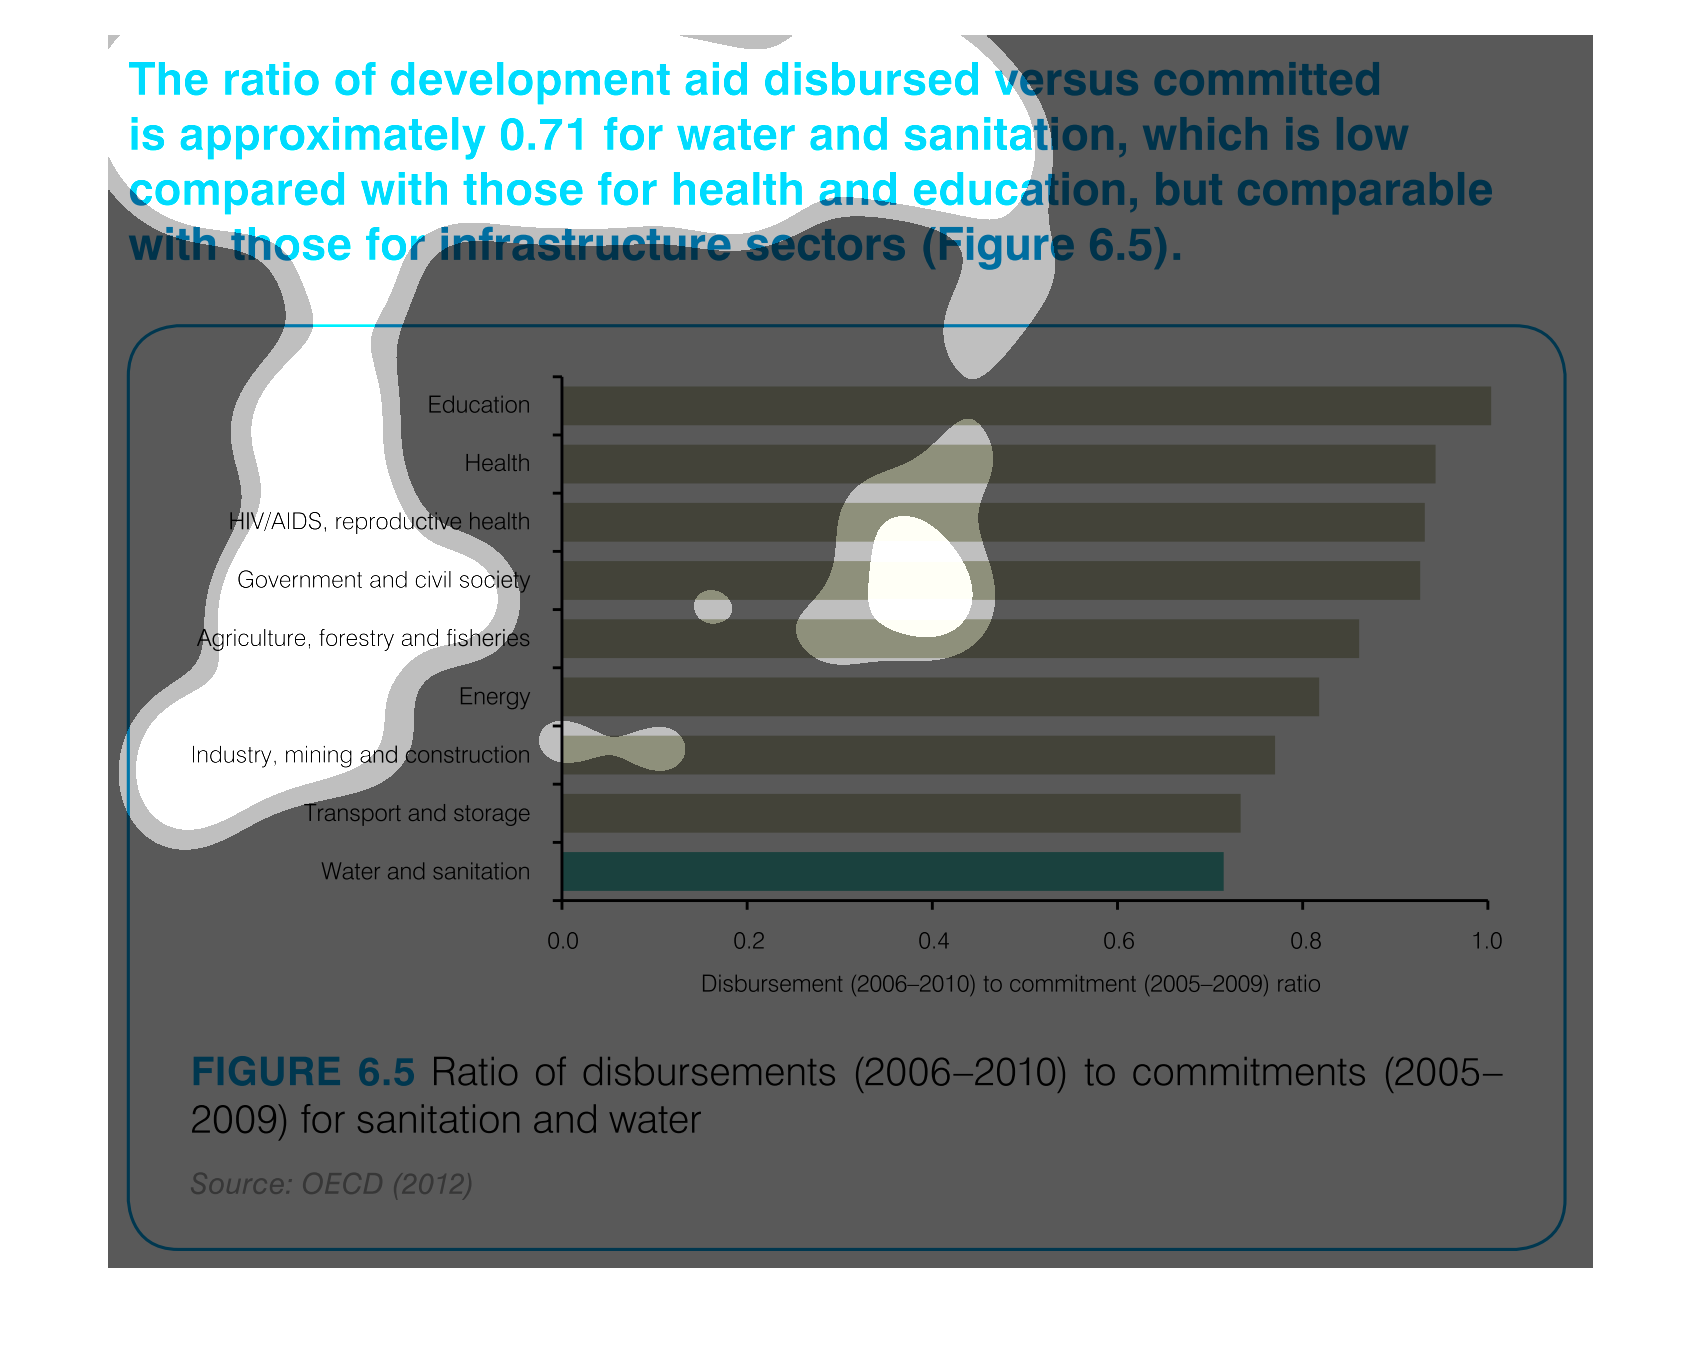
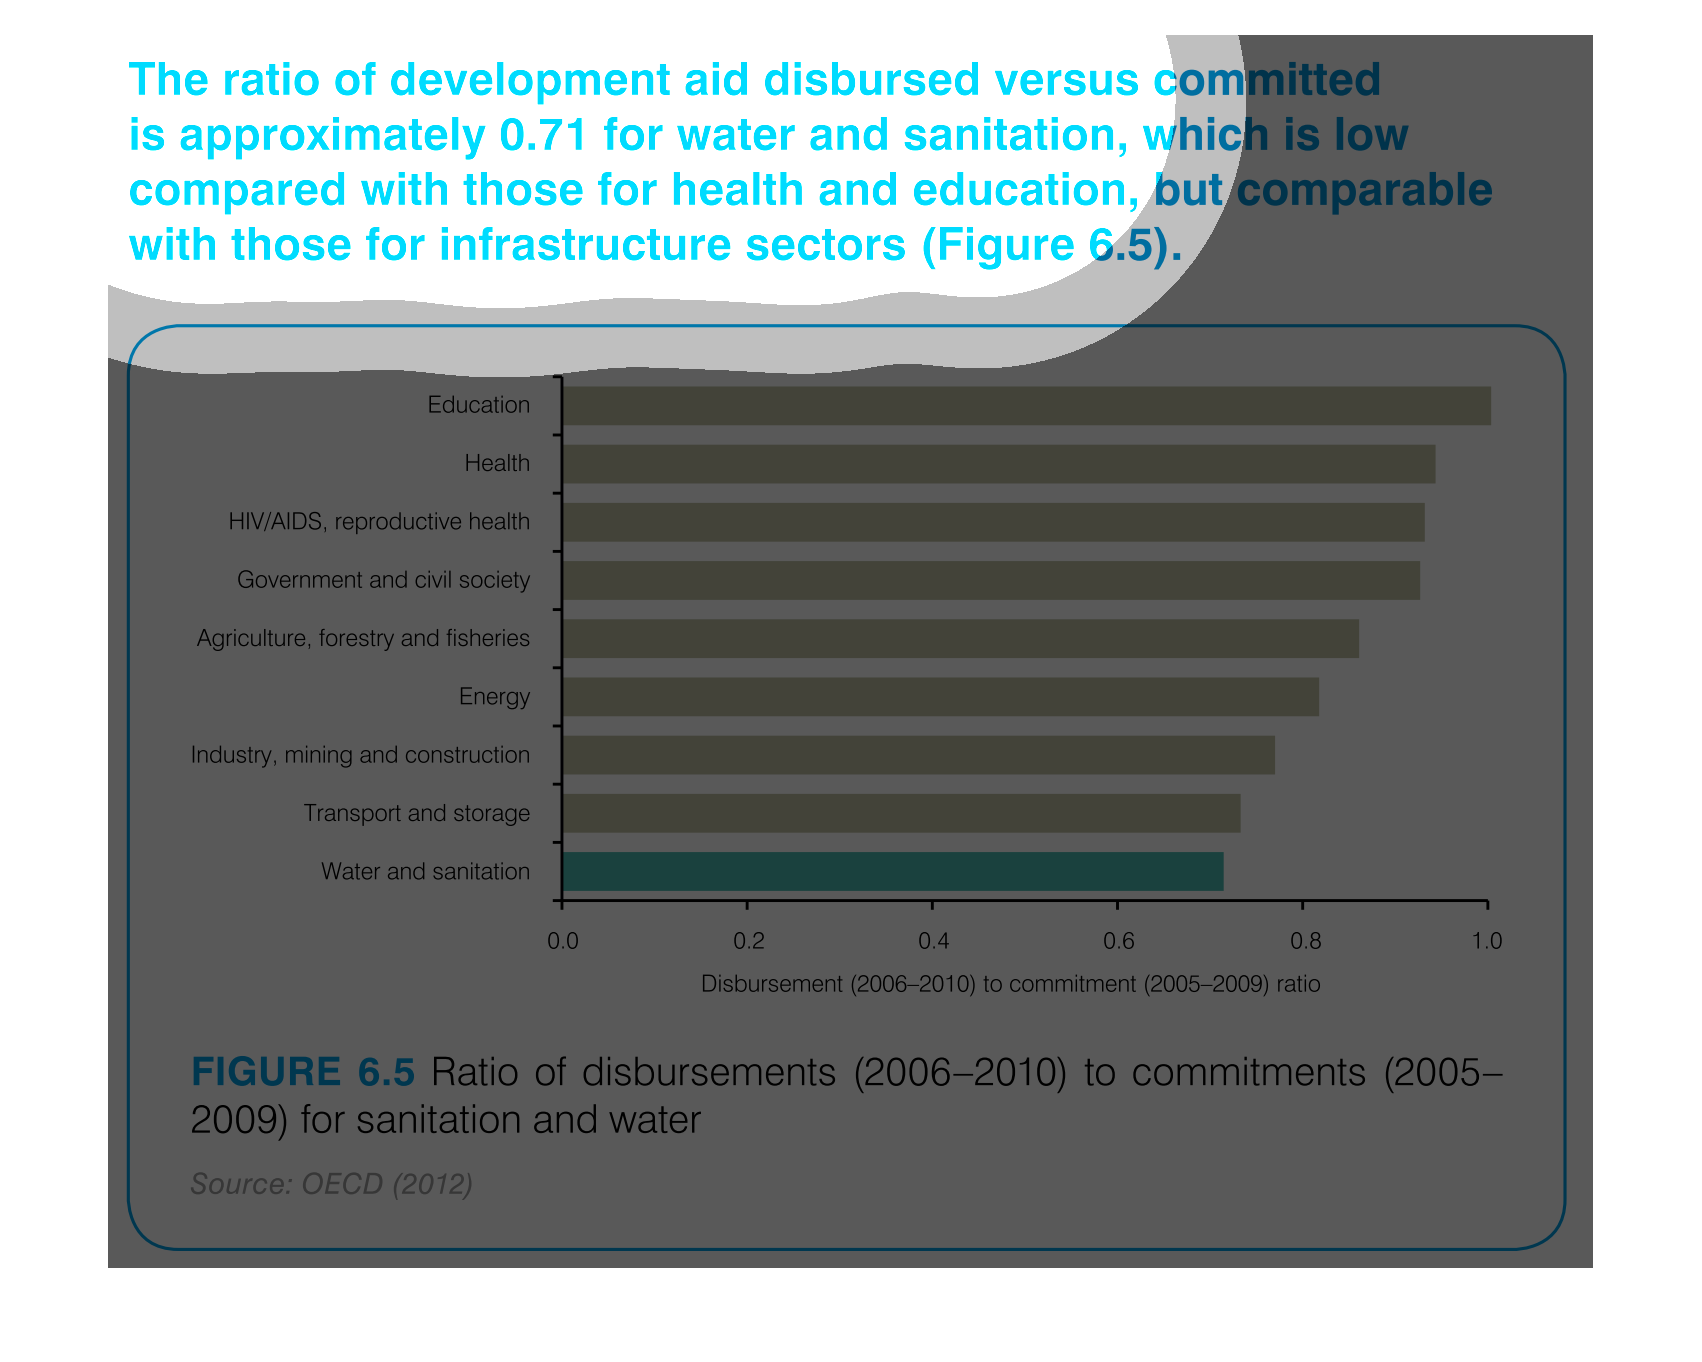
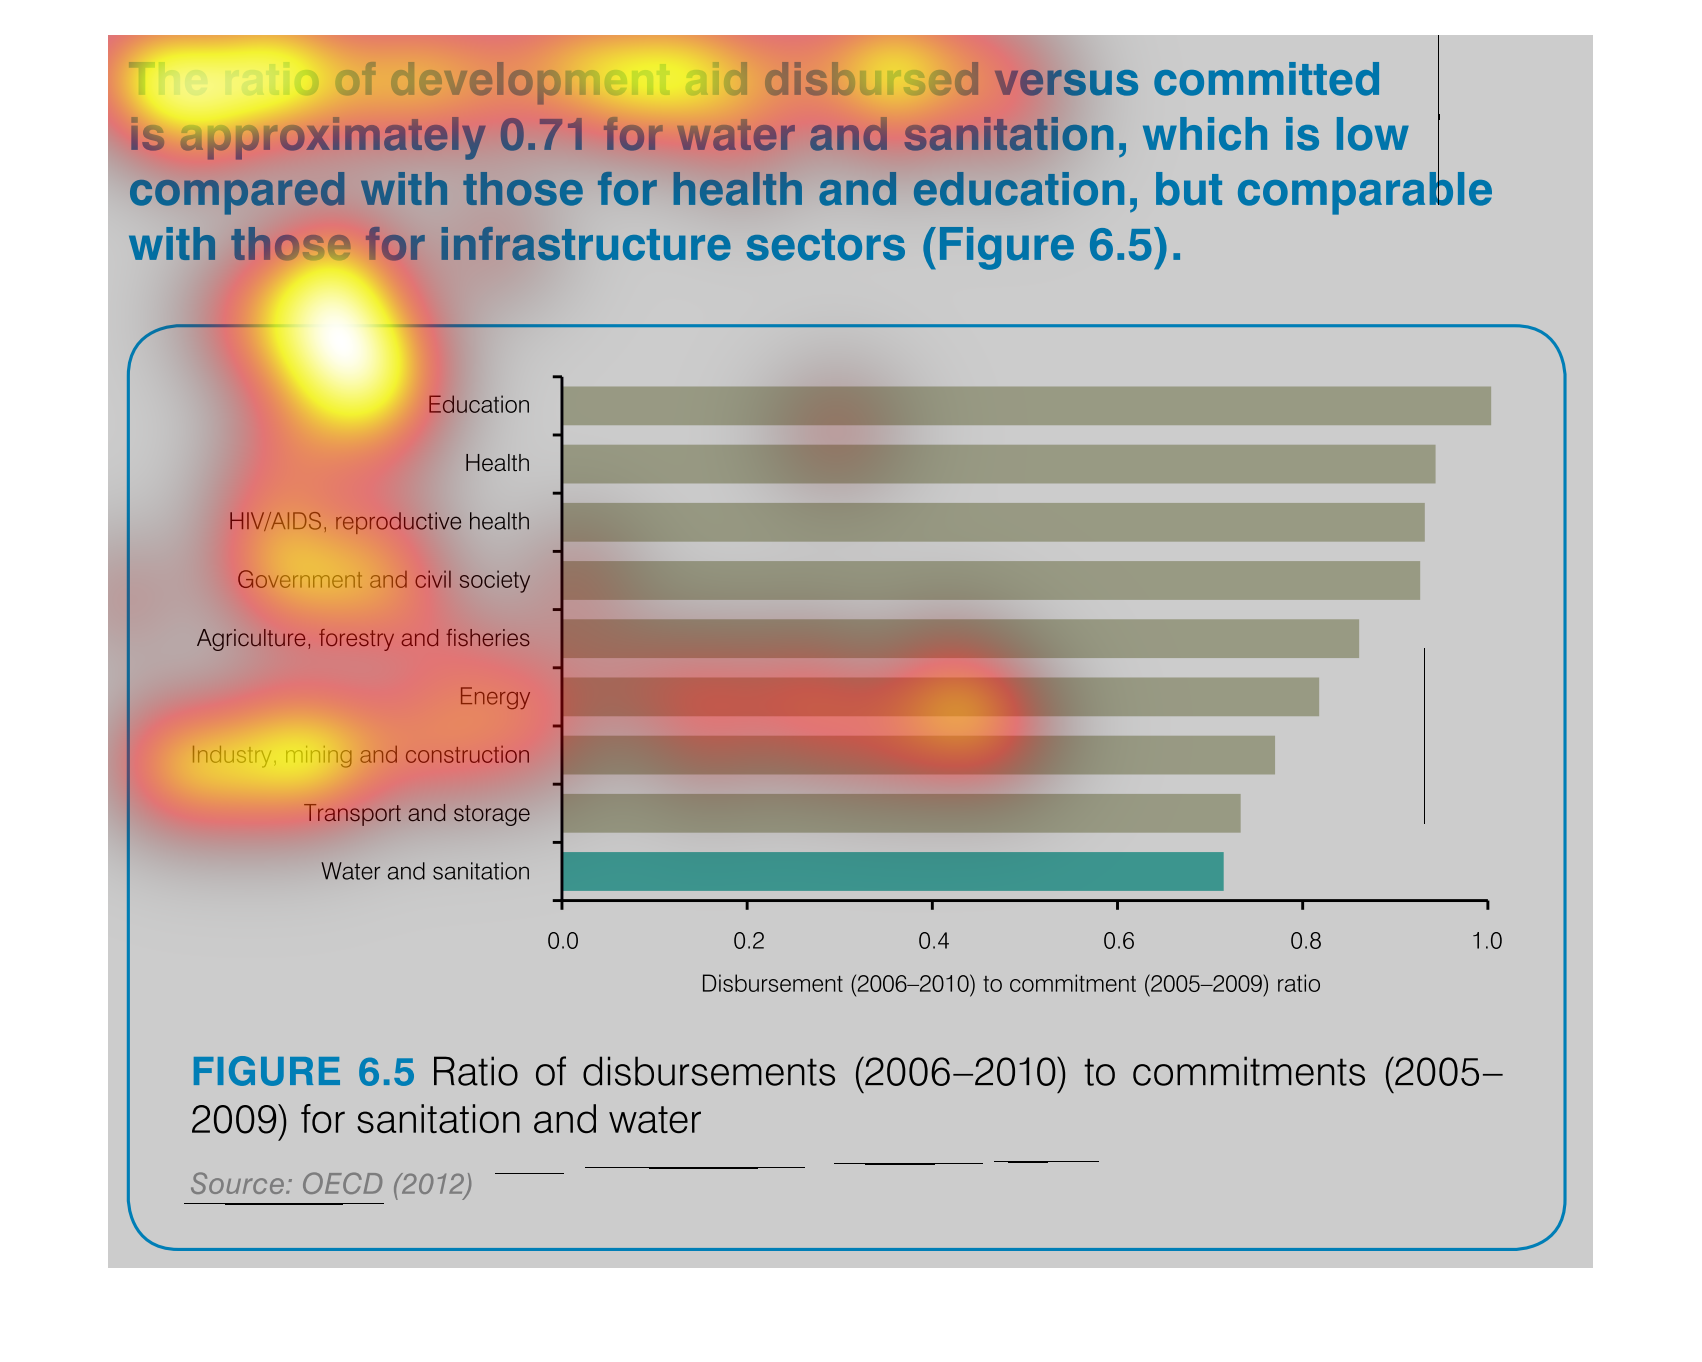
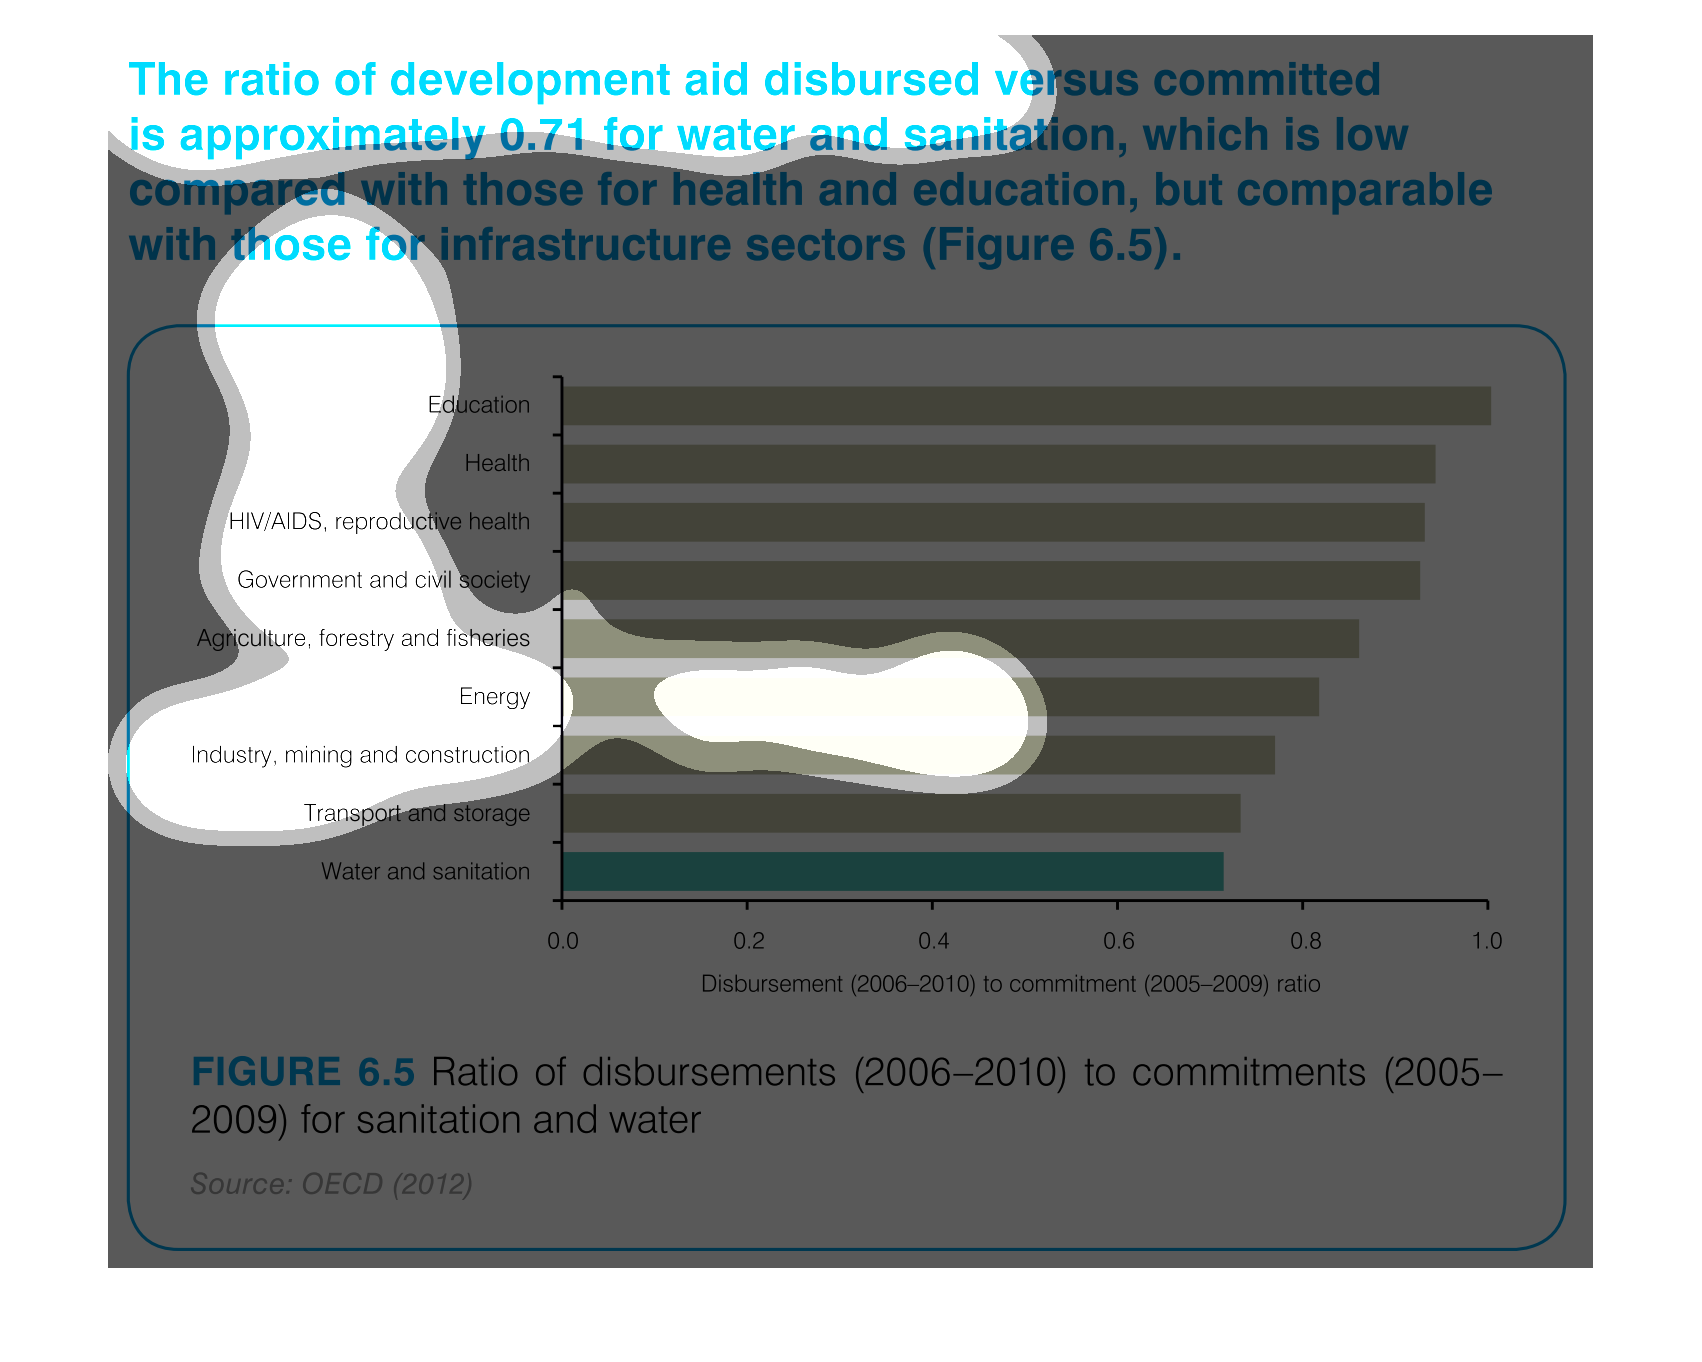
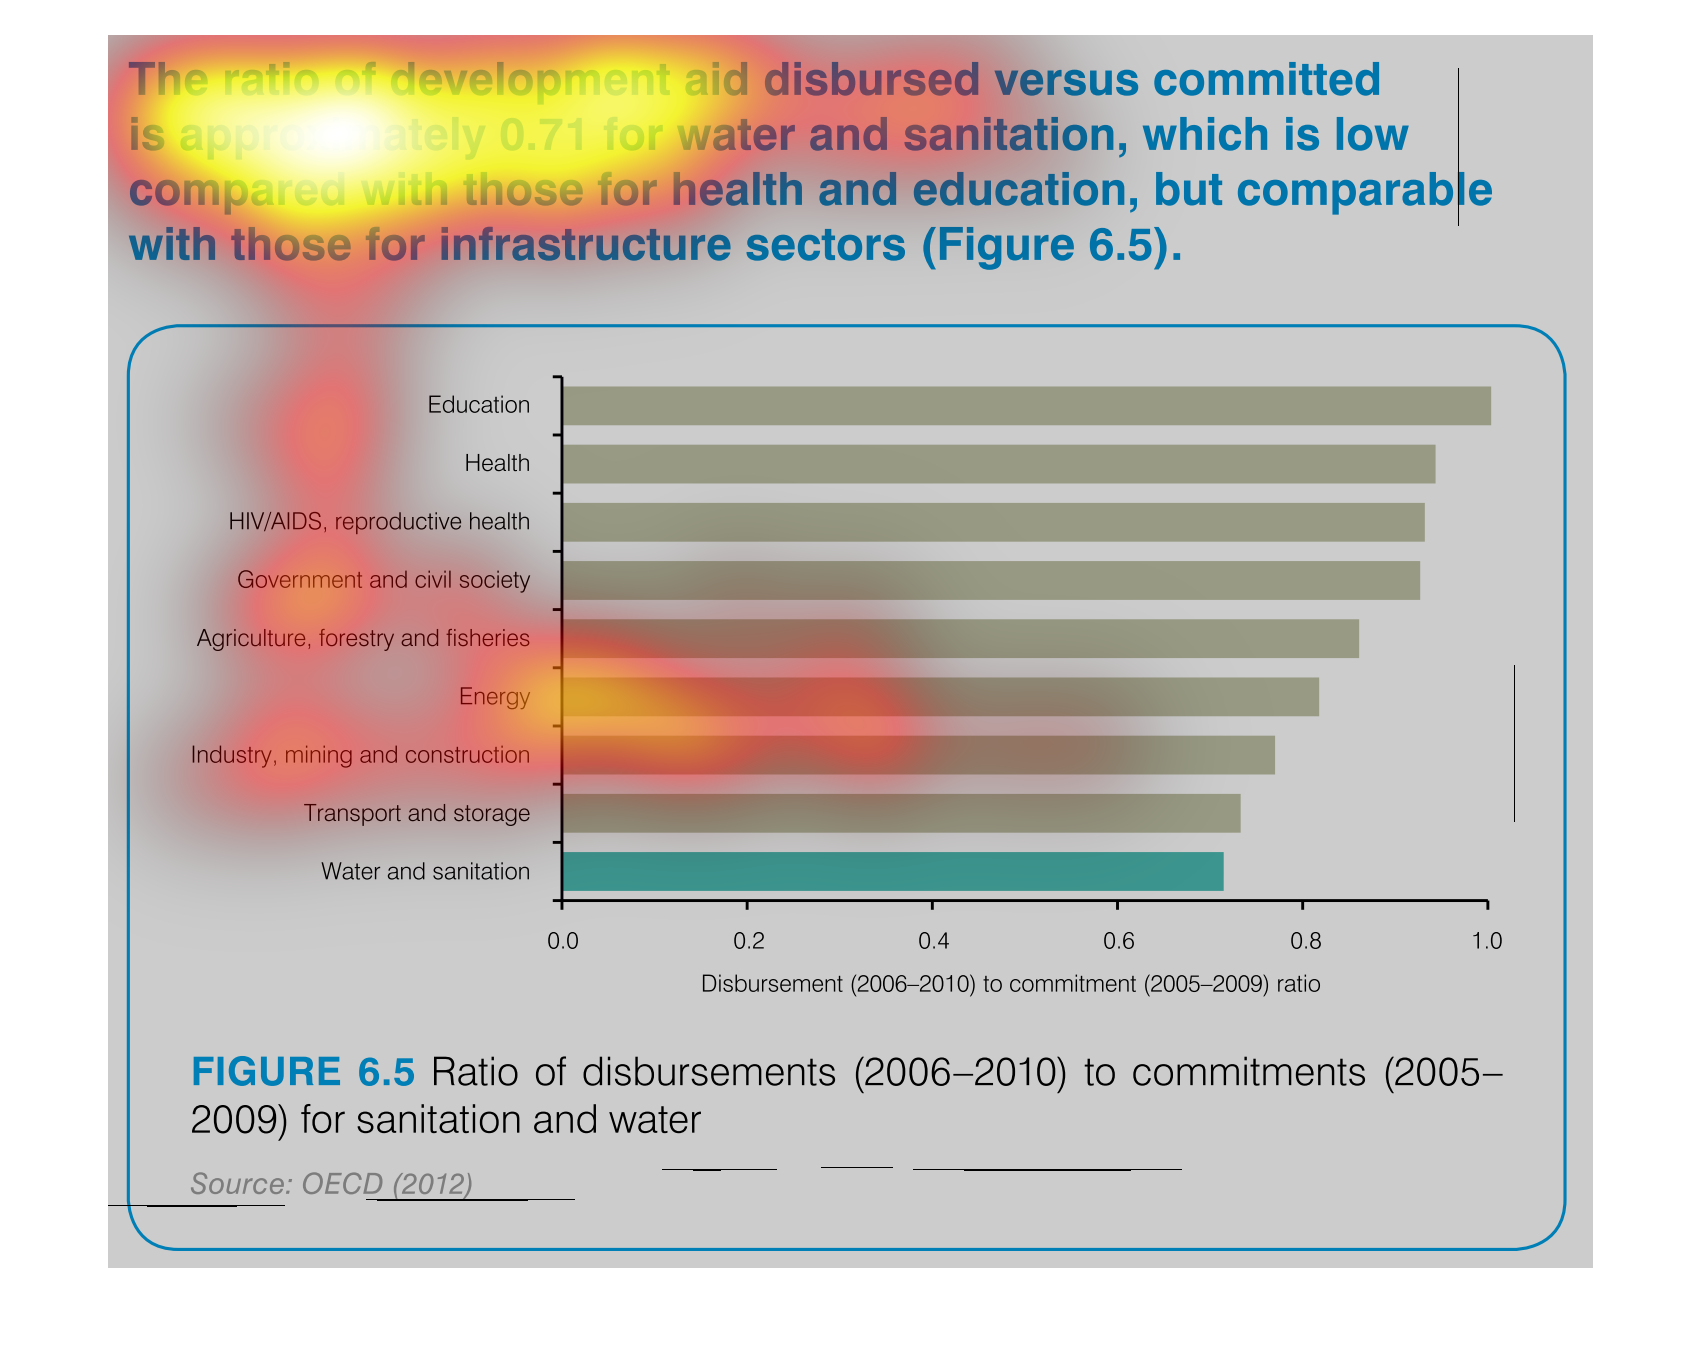
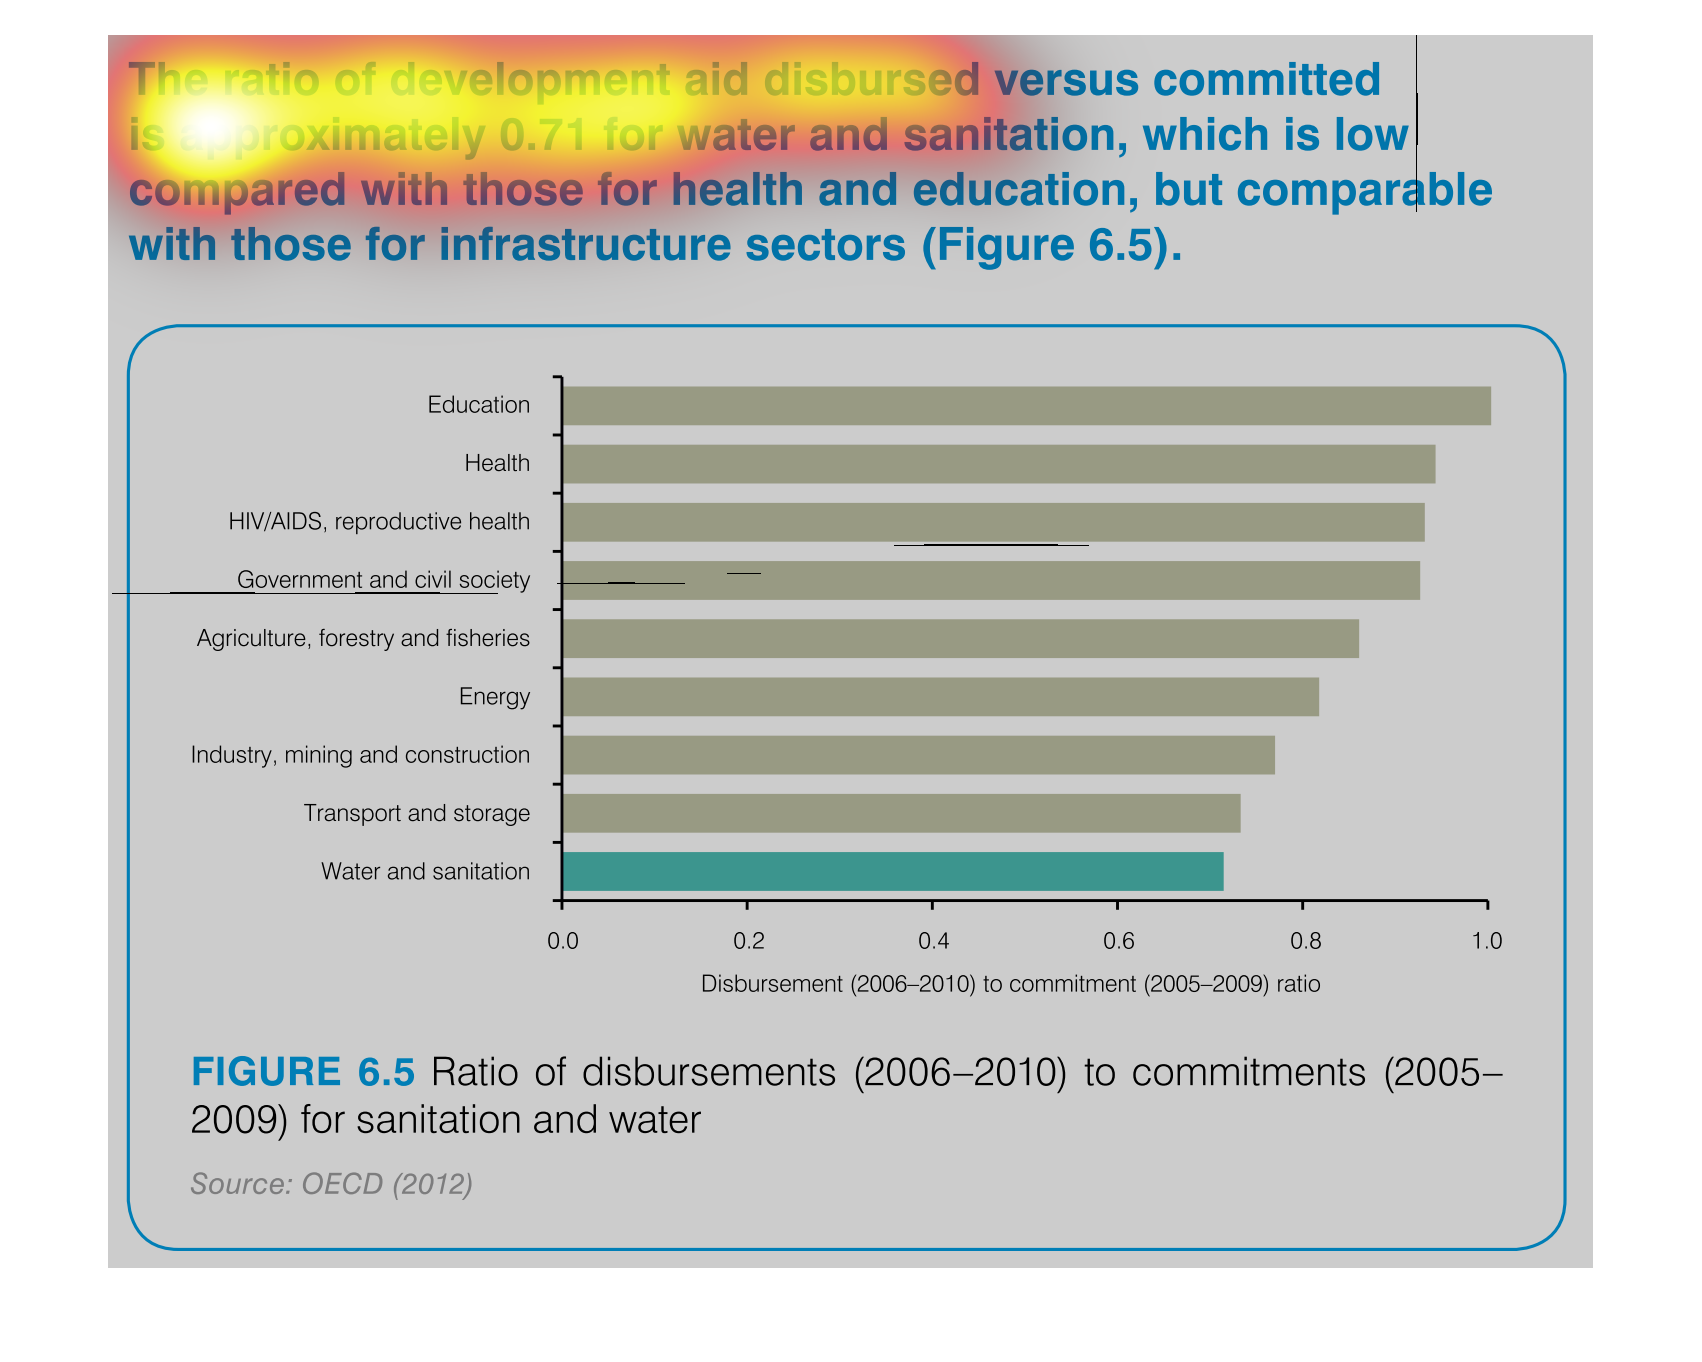
This chart describes the ratio of development aid disbursed, versus committed is approximately
0.71 for water and sanitation, which is low compared with those for health and education.
The figure presented is titled The ratio of development aid disbursed versus committed is
approximately 0.71 for water and sanitation.  The figure has data on aid.
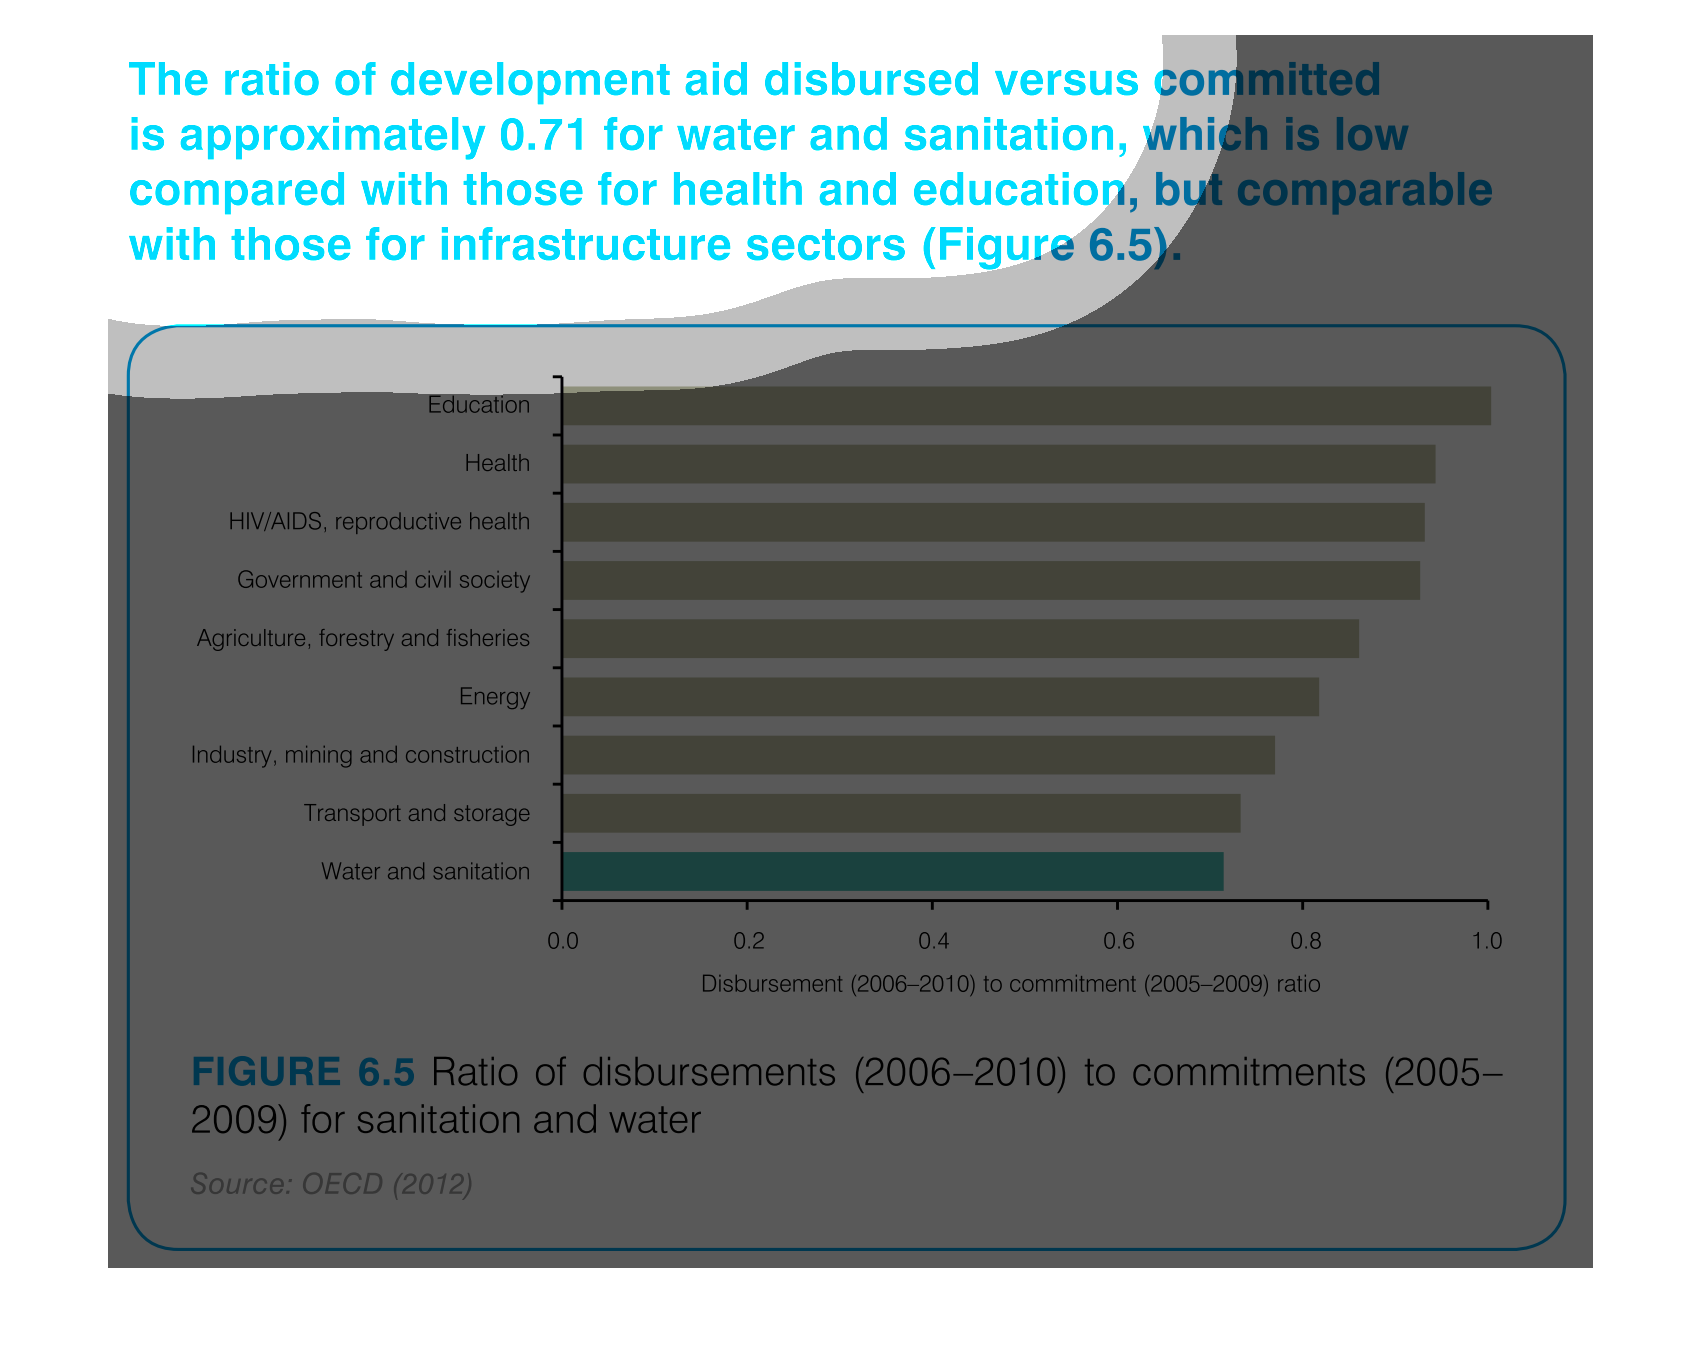
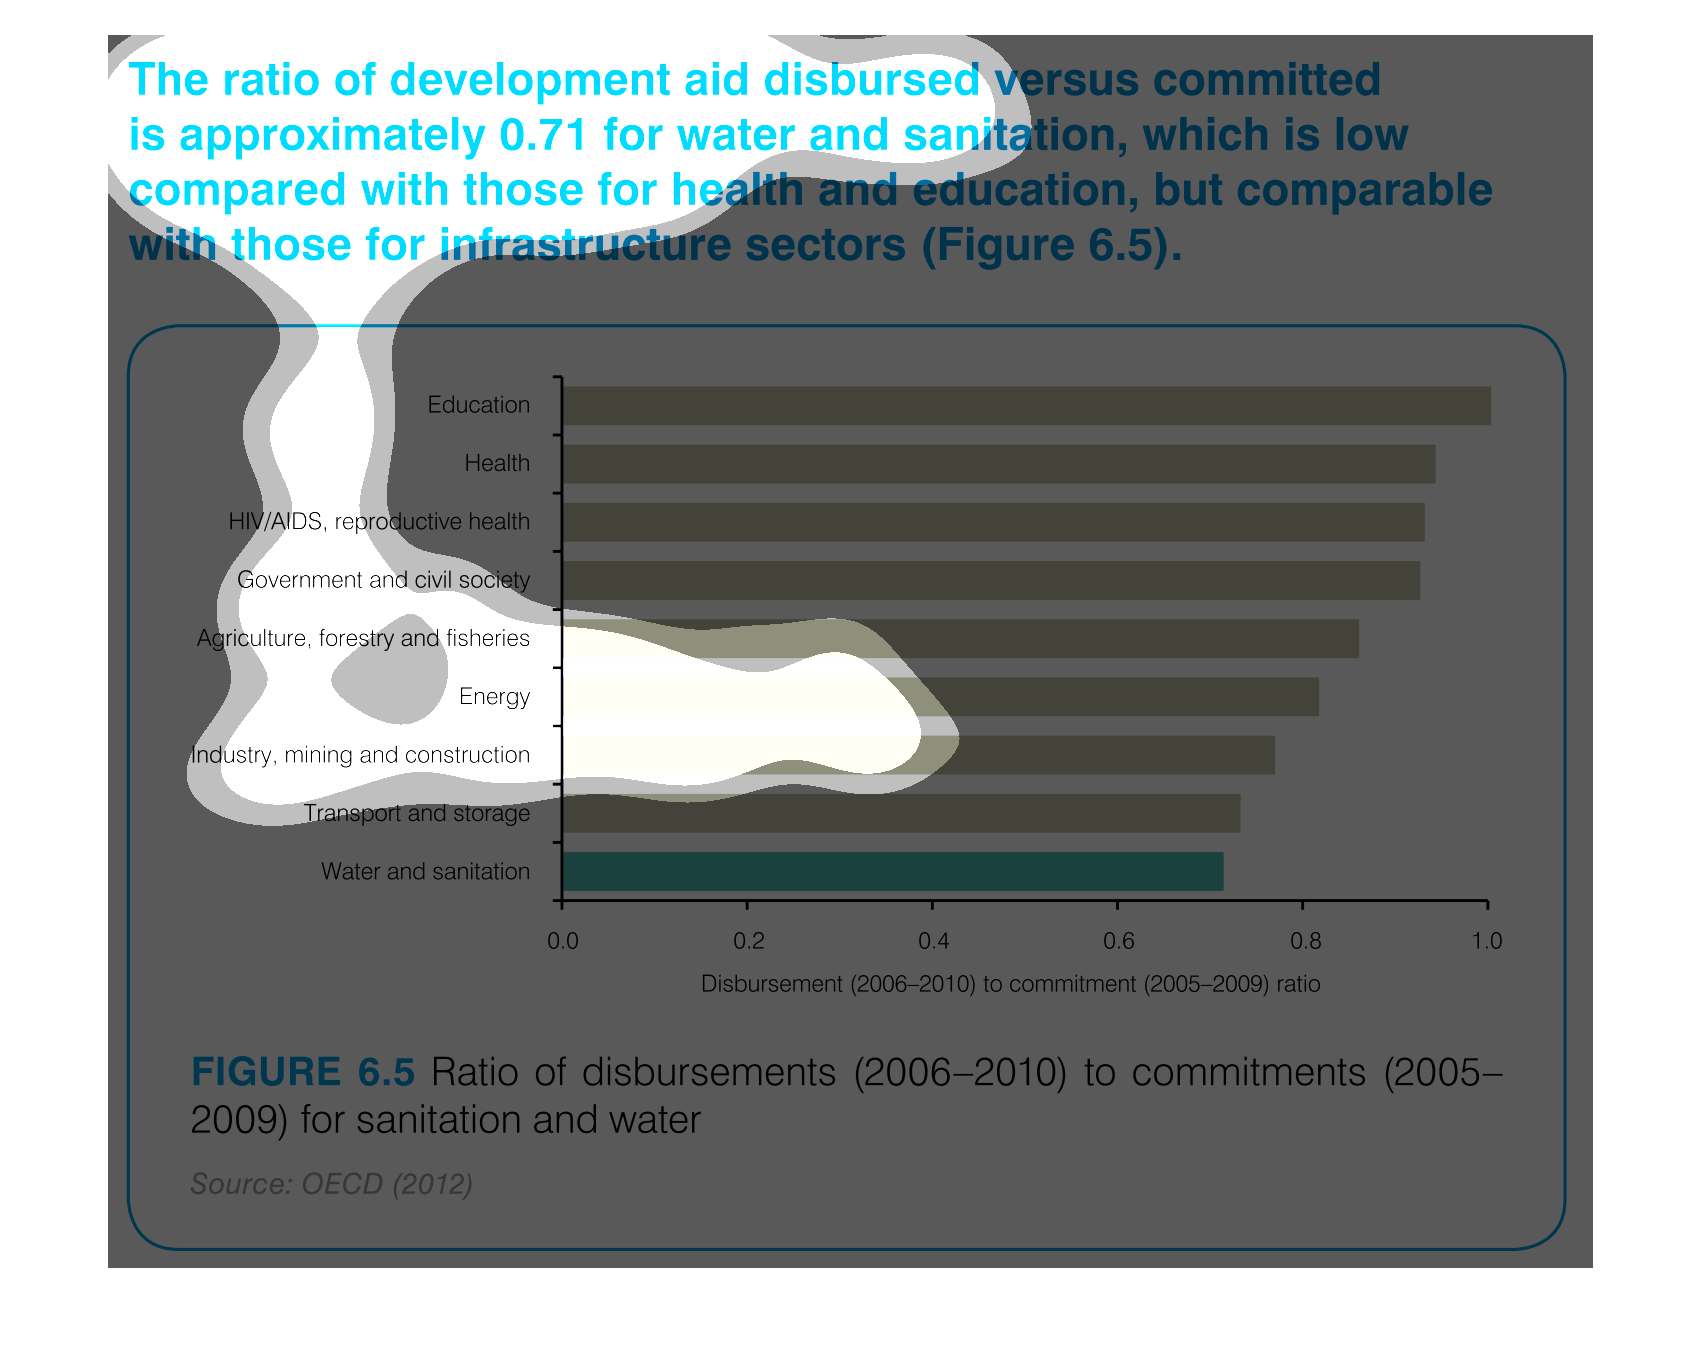
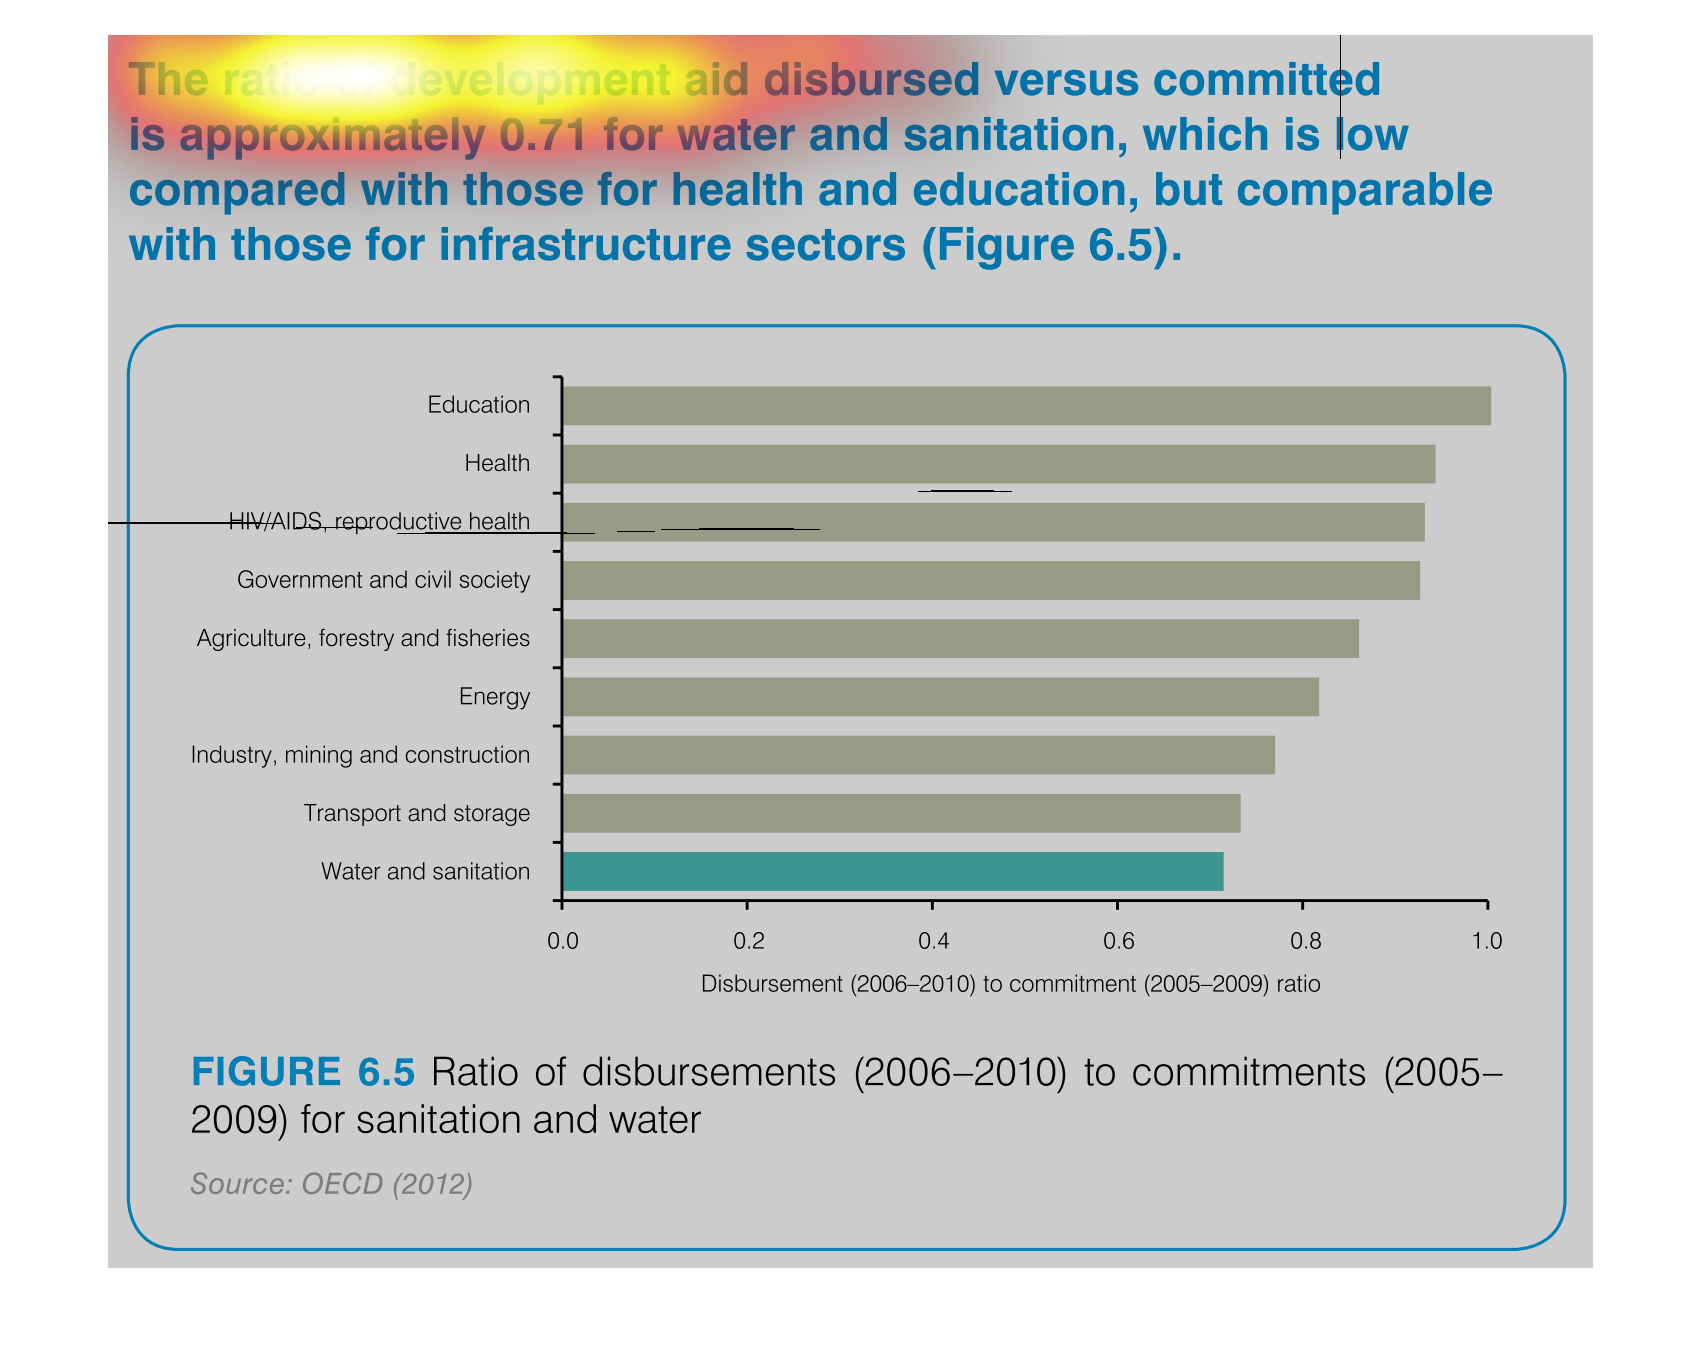
This is a series of bar graphs depicting the ratios of development aid disbursed versus committed
is approximately 0.71 for water and sanitation, which is low compared with those for health
and education.
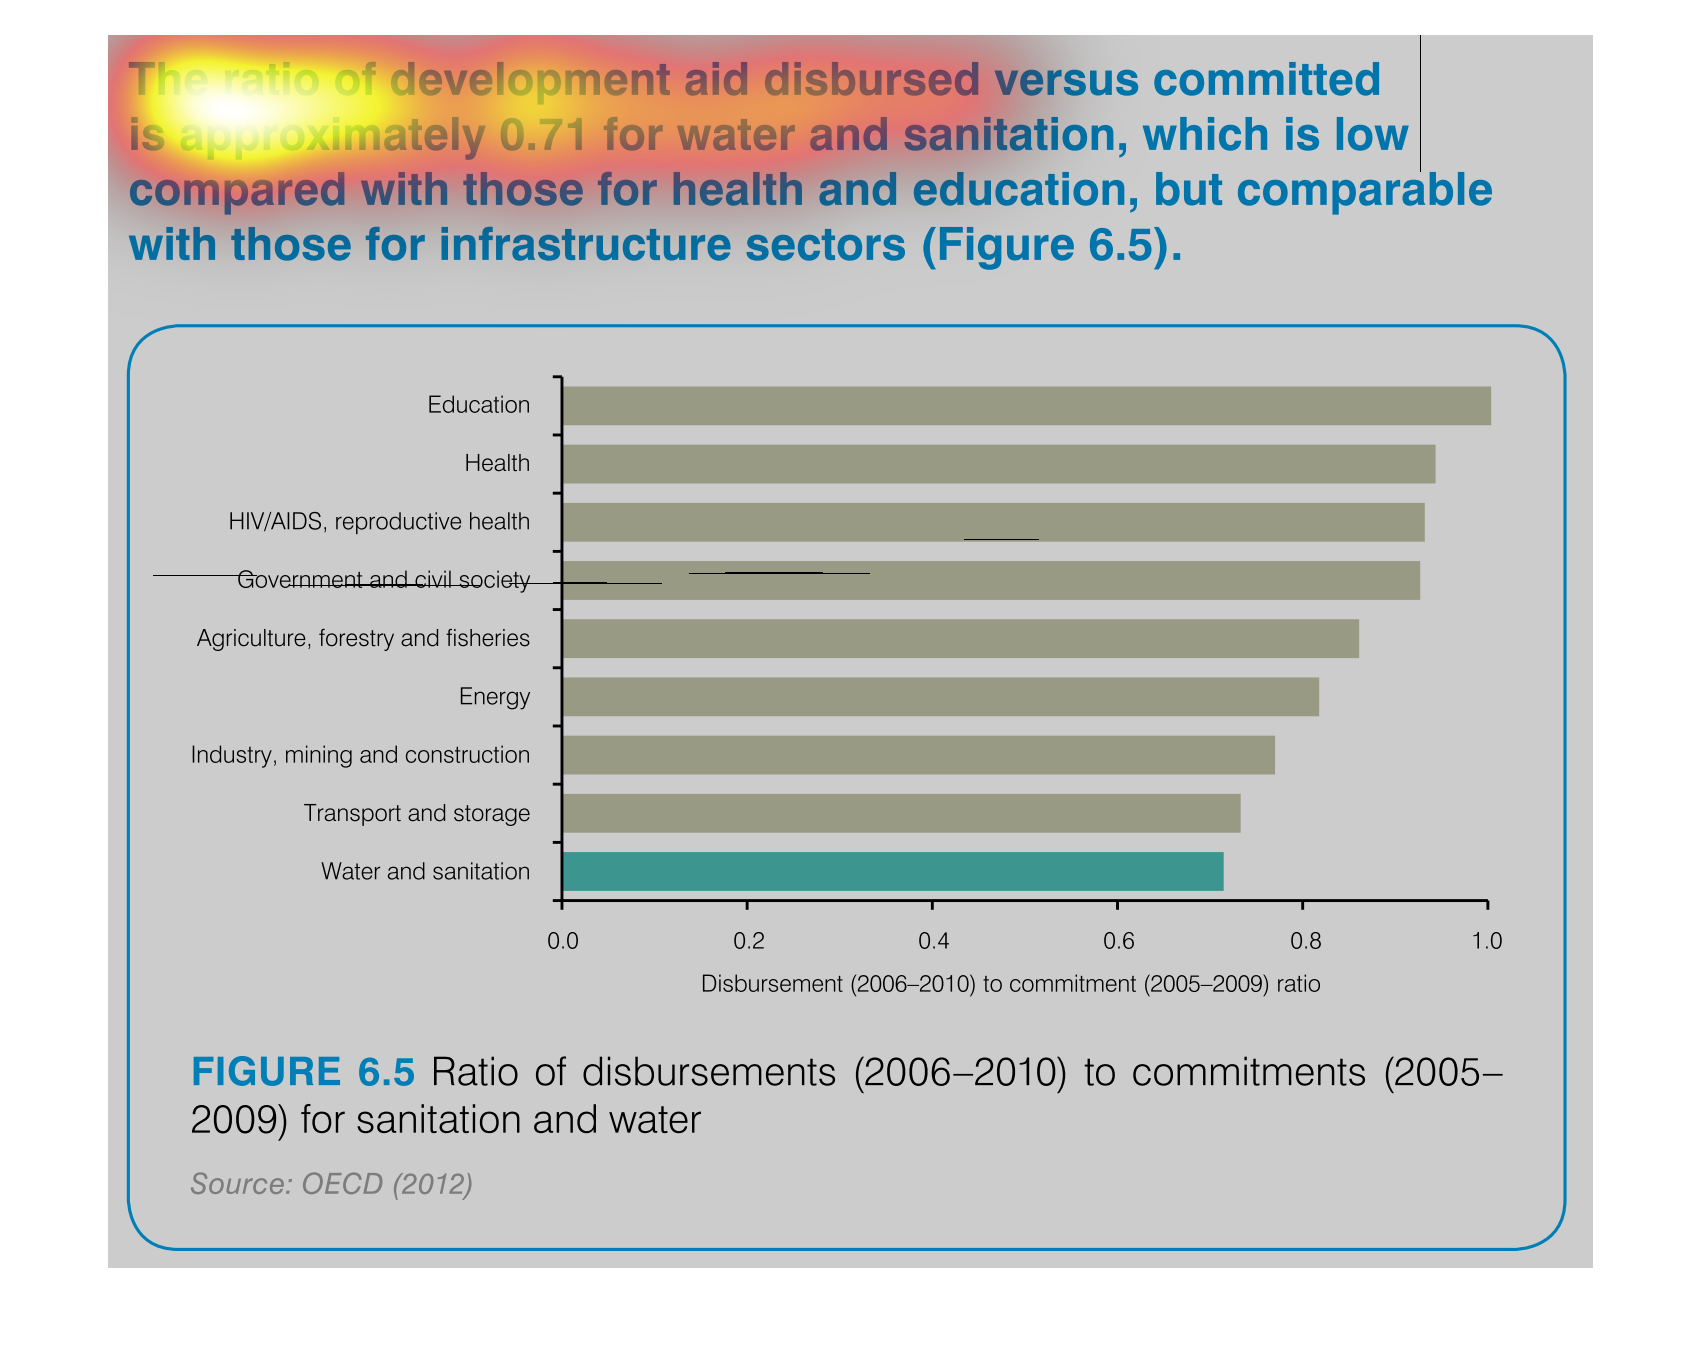

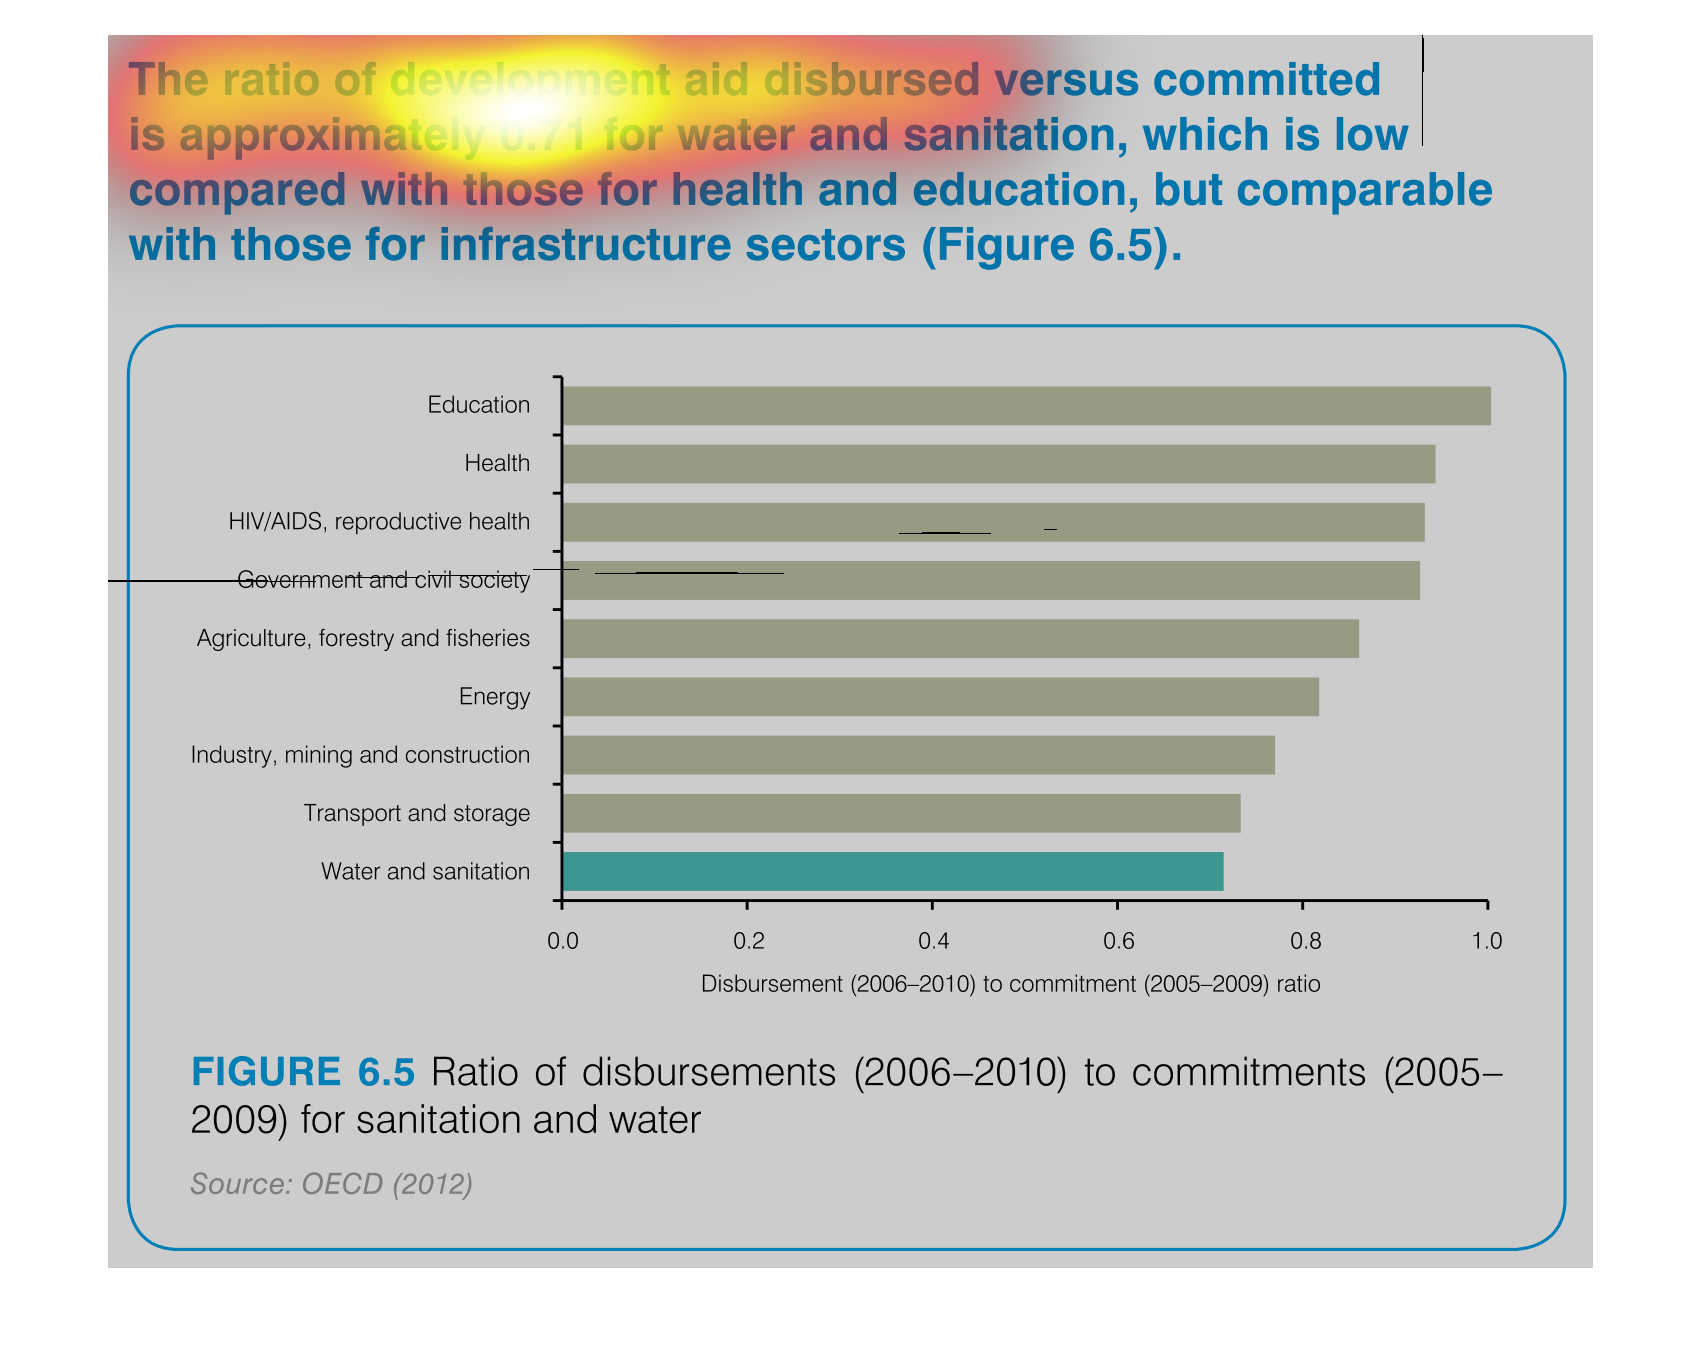
The chart describes the percent of disbursements to commitments from 2005 through 2009.  It
is a bar chart representing water and sanitation. The ratio is most increased in the area
of education followed closely by health.
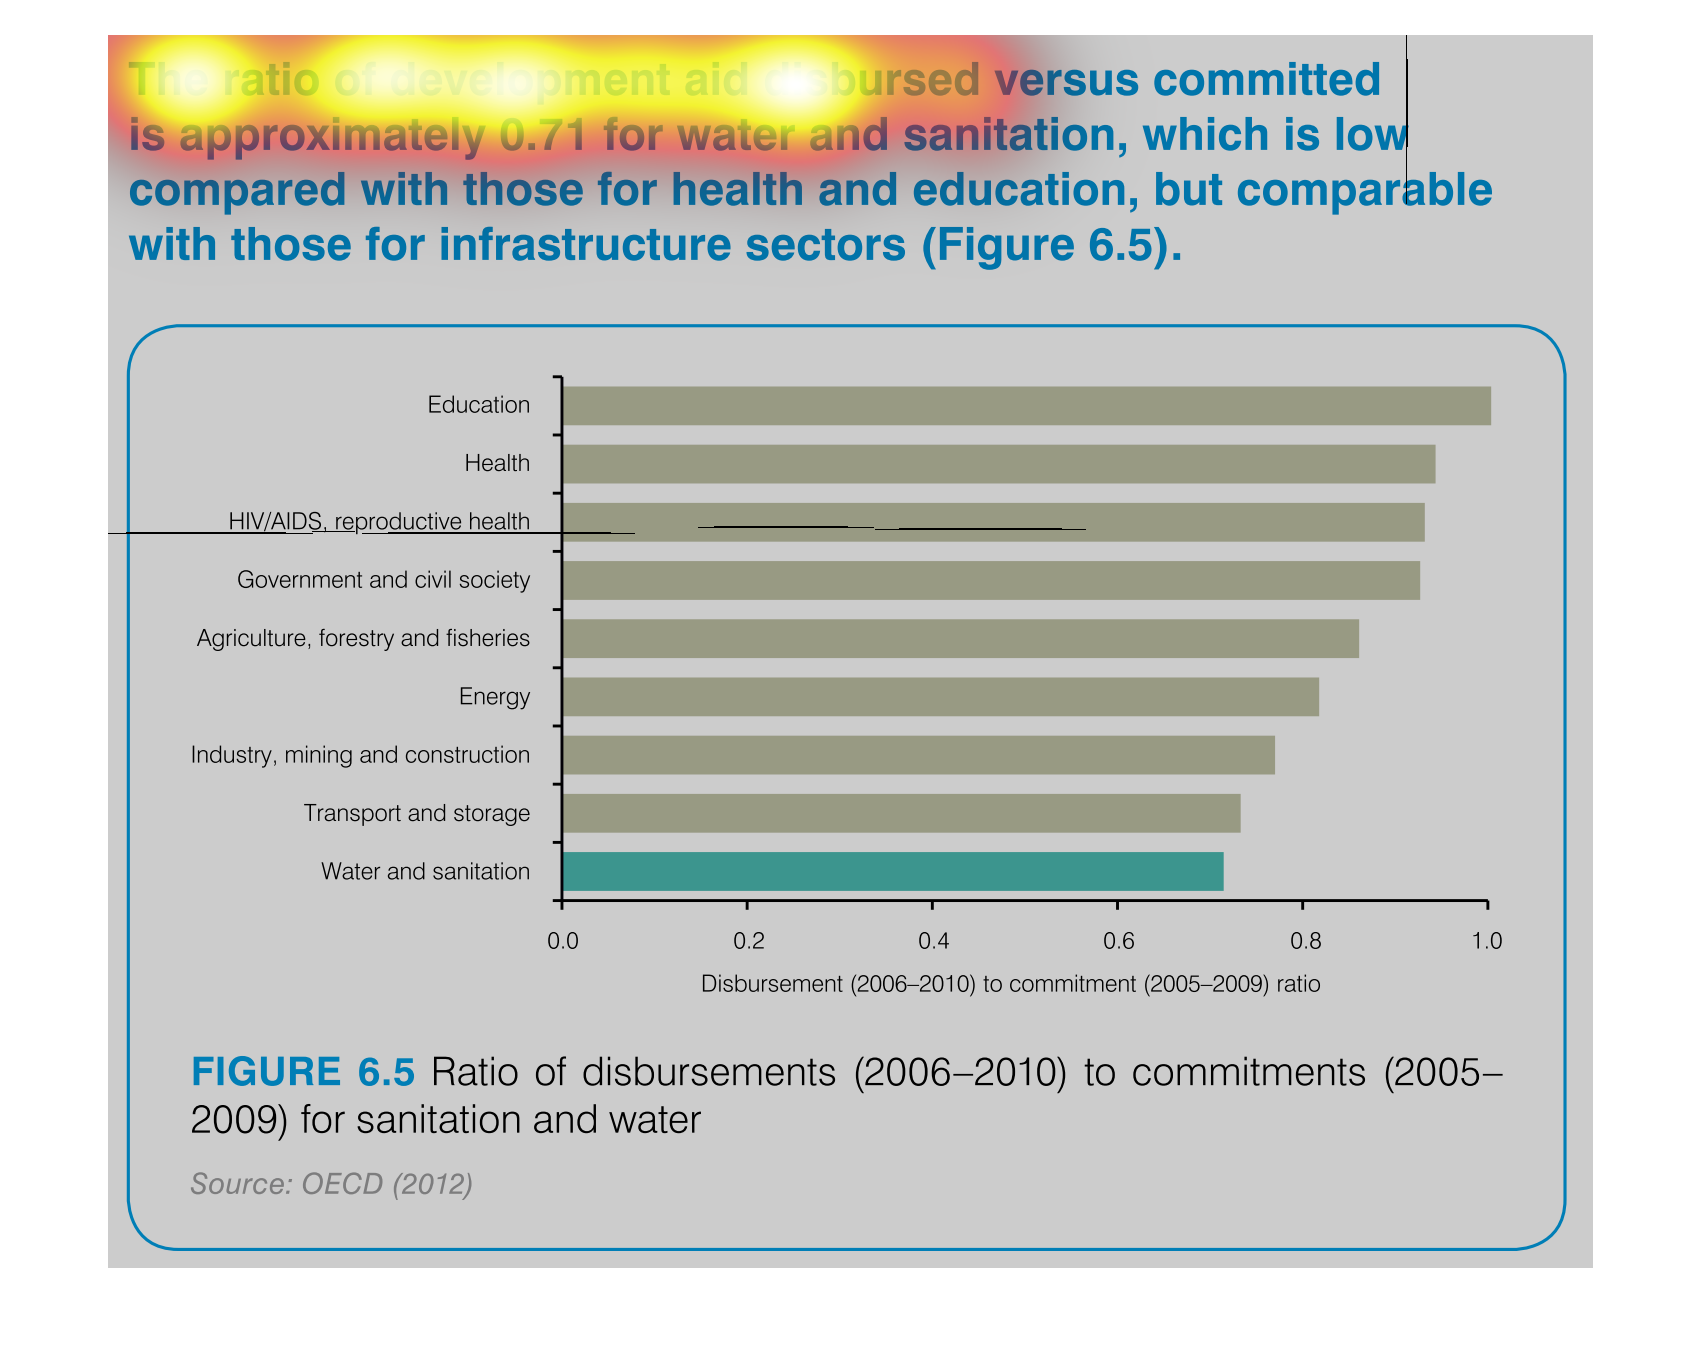
This graph illustrates factors that influence the development of sanitation and clean drinking
water such as education, health, and reproductive health,
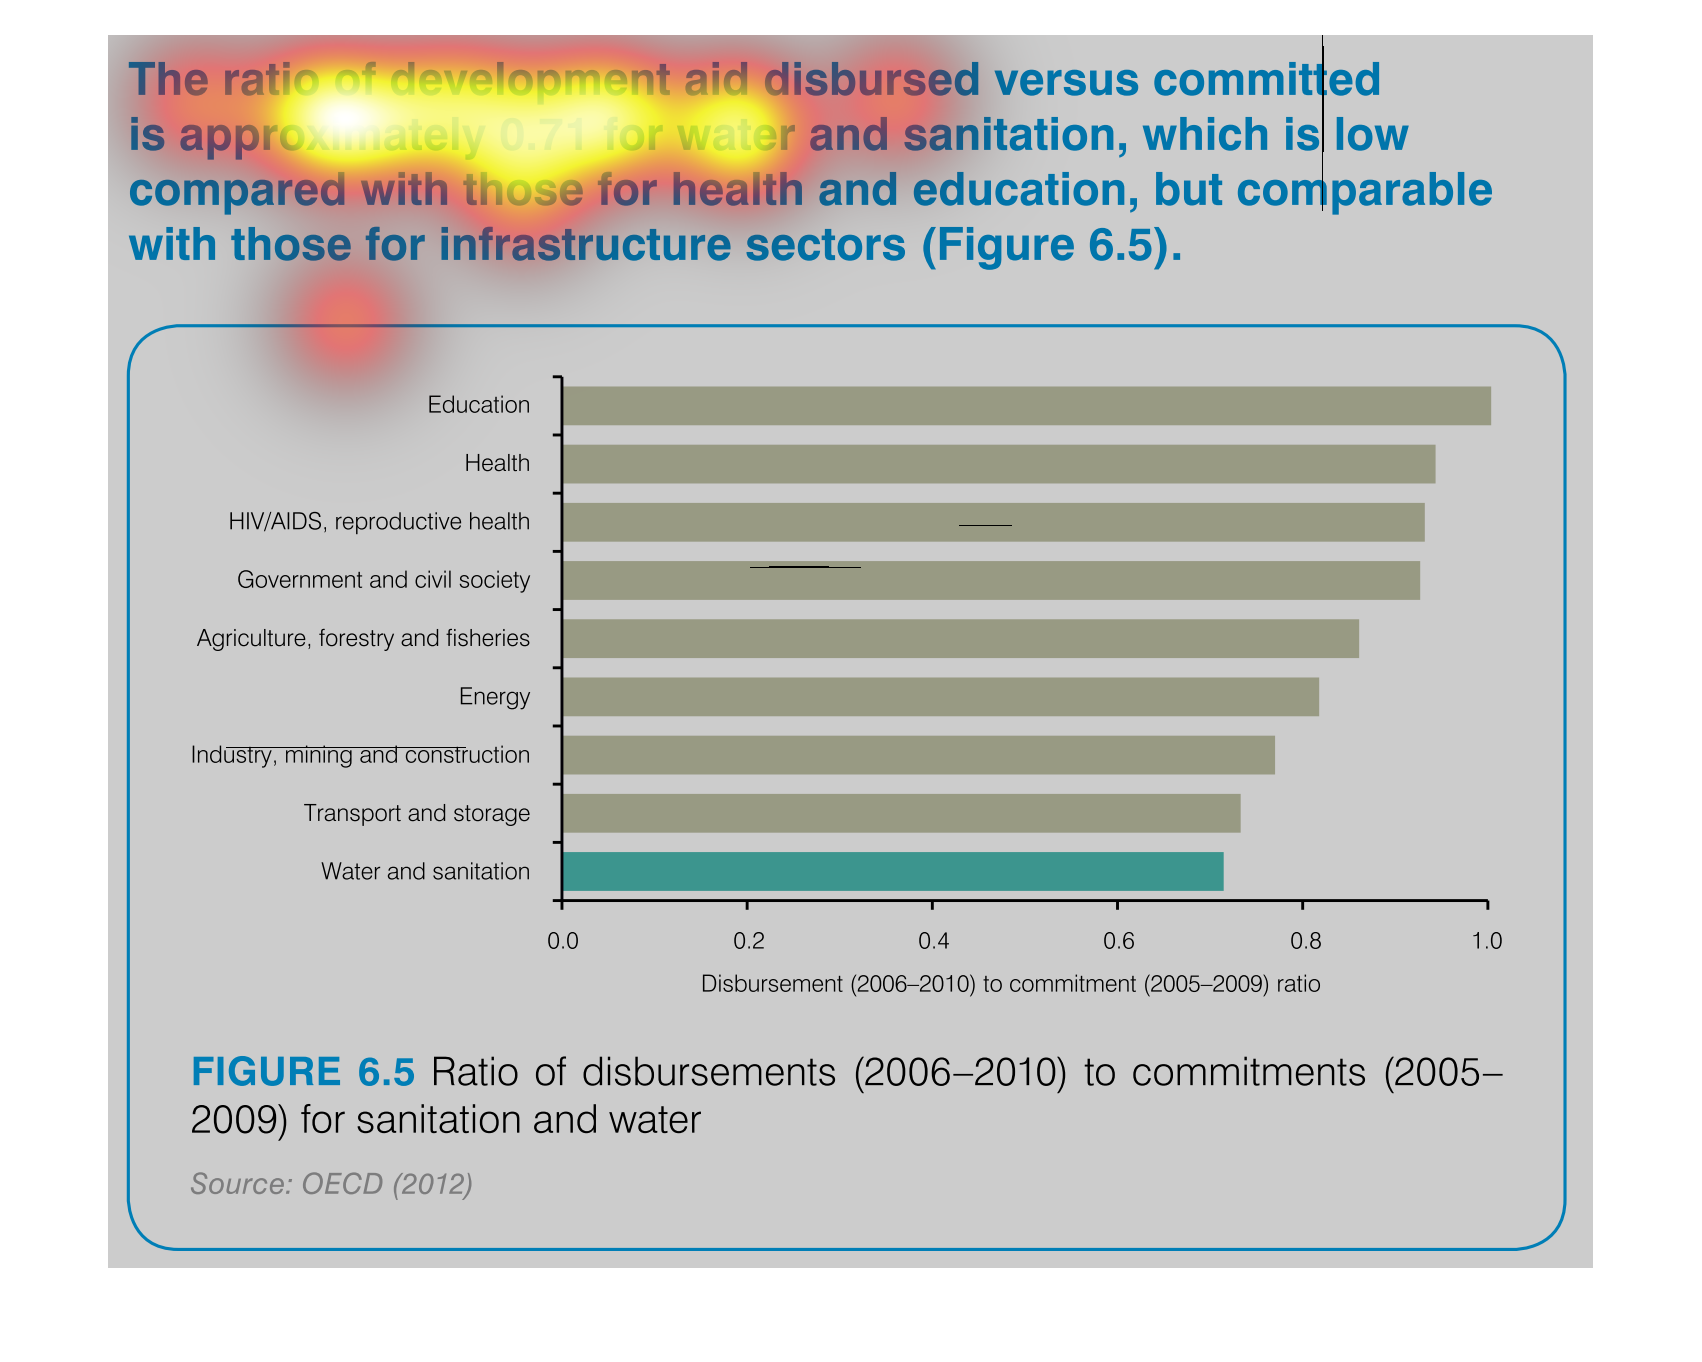
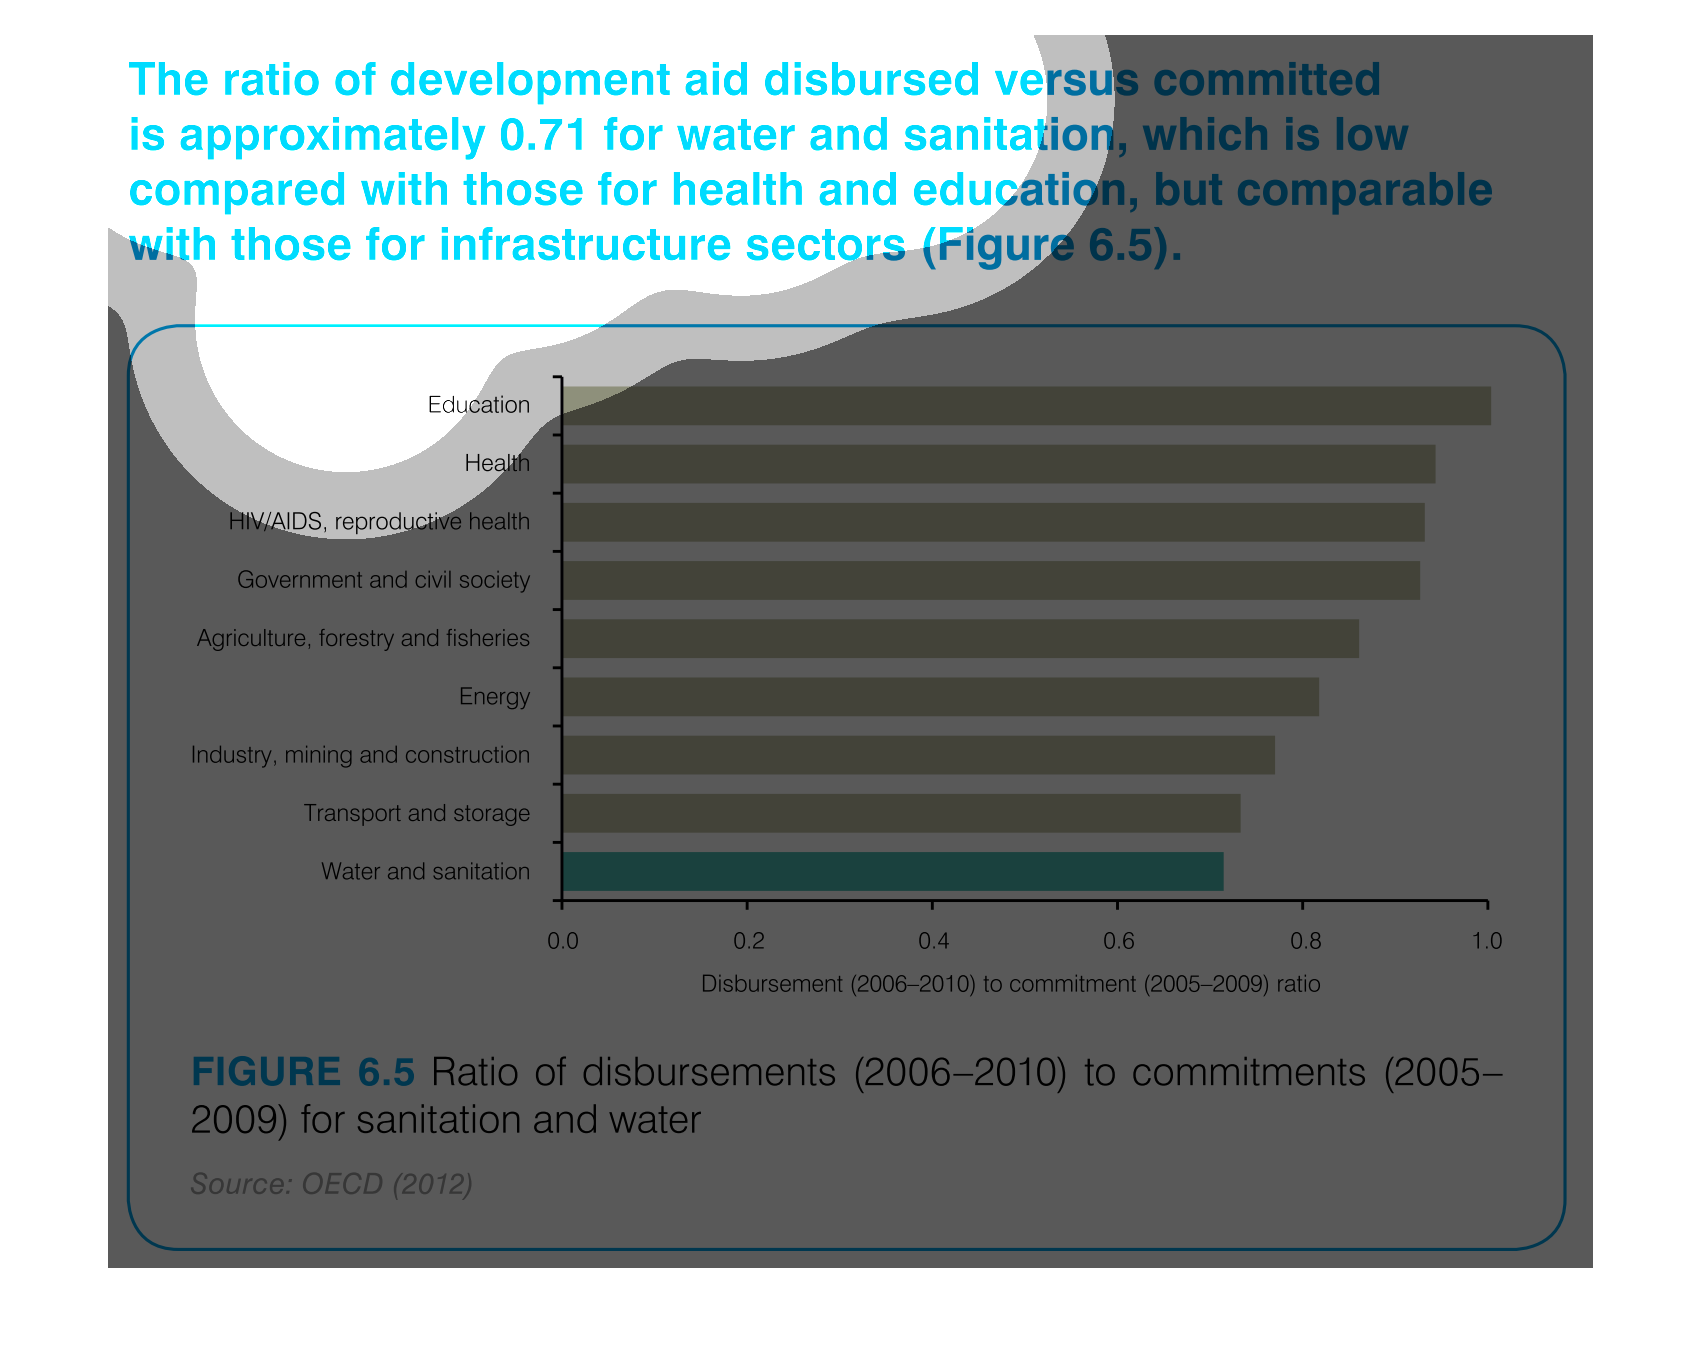
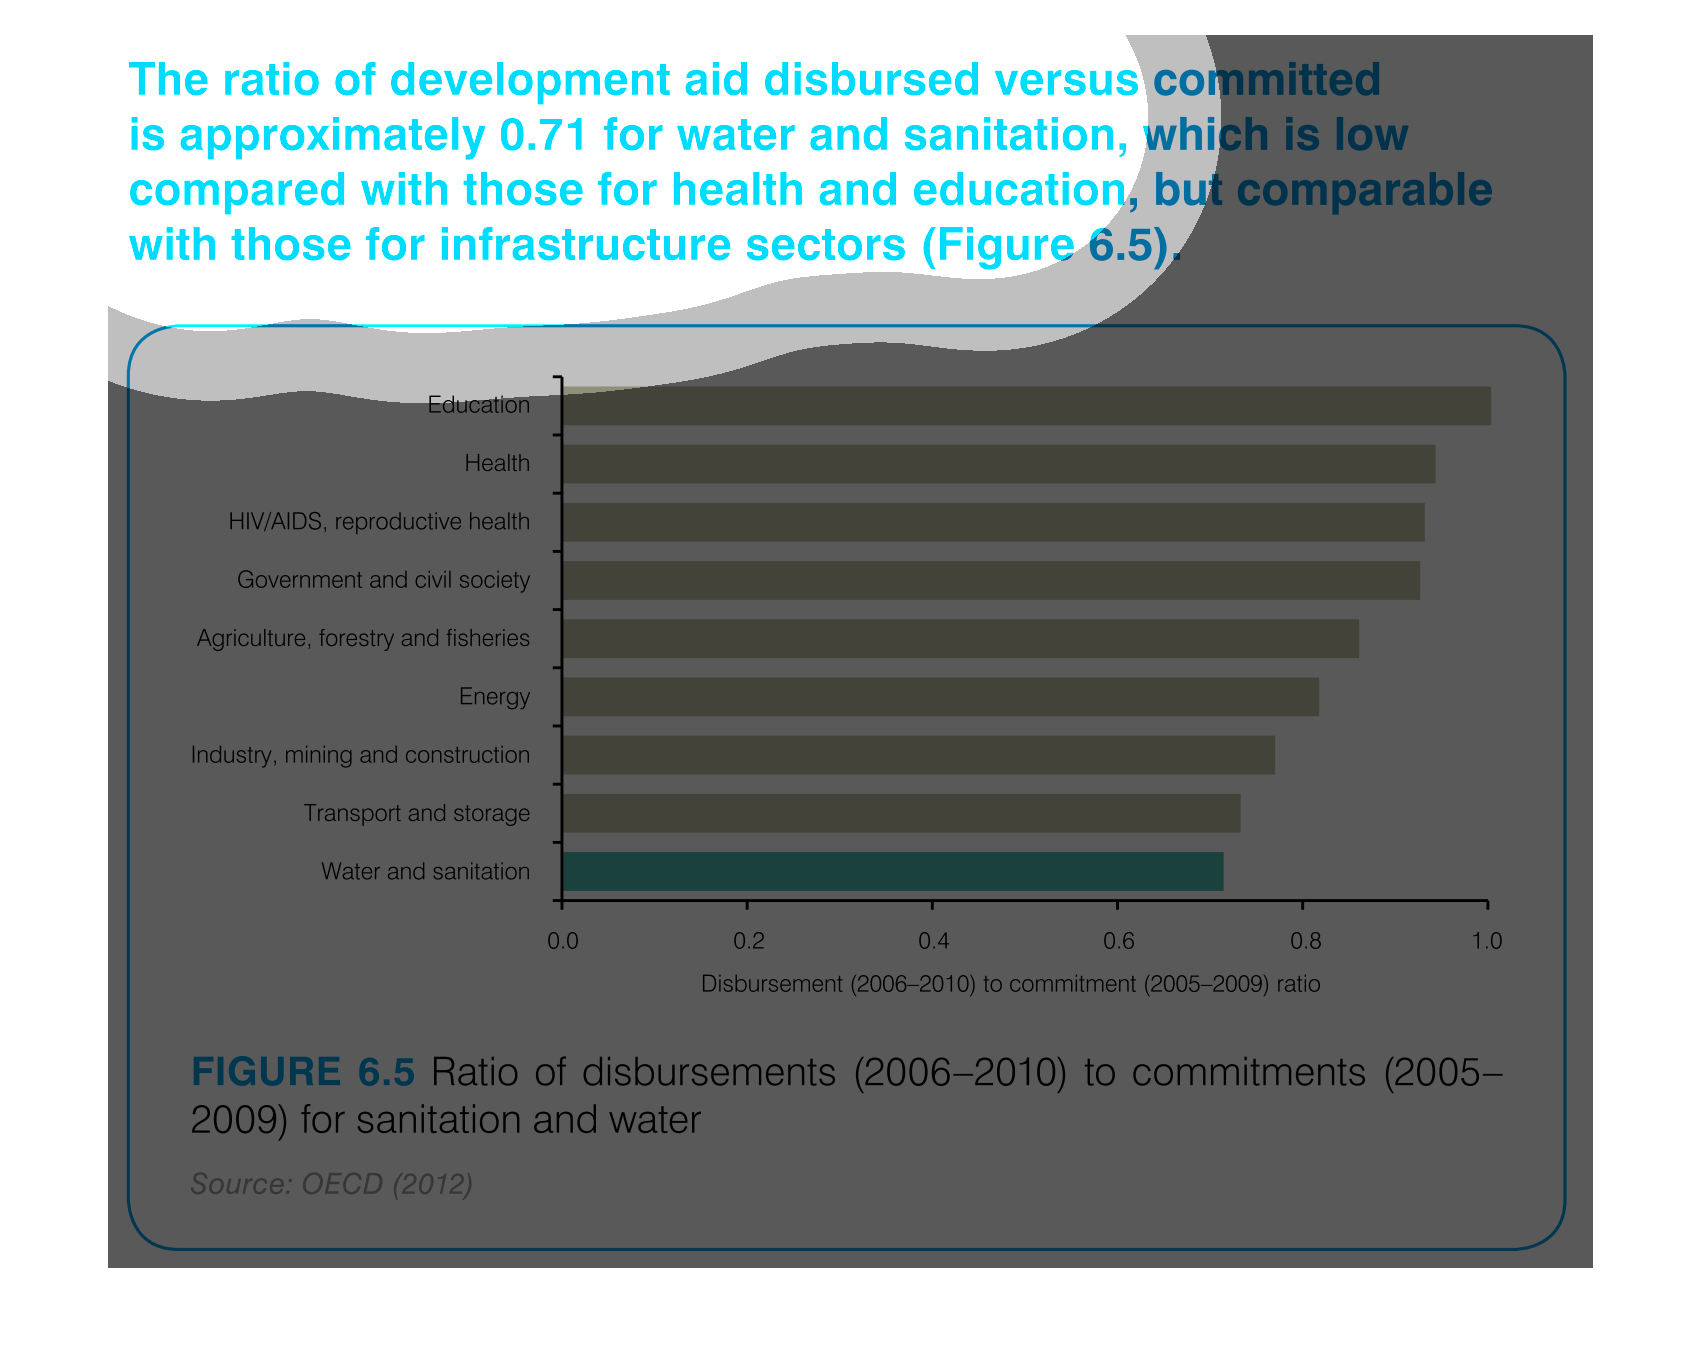
This is a bar graph detailing aid to third world countries. It seems to be comparing actual
disbursement against commitment for the years between 2006 and 2010 for sanitation and water.
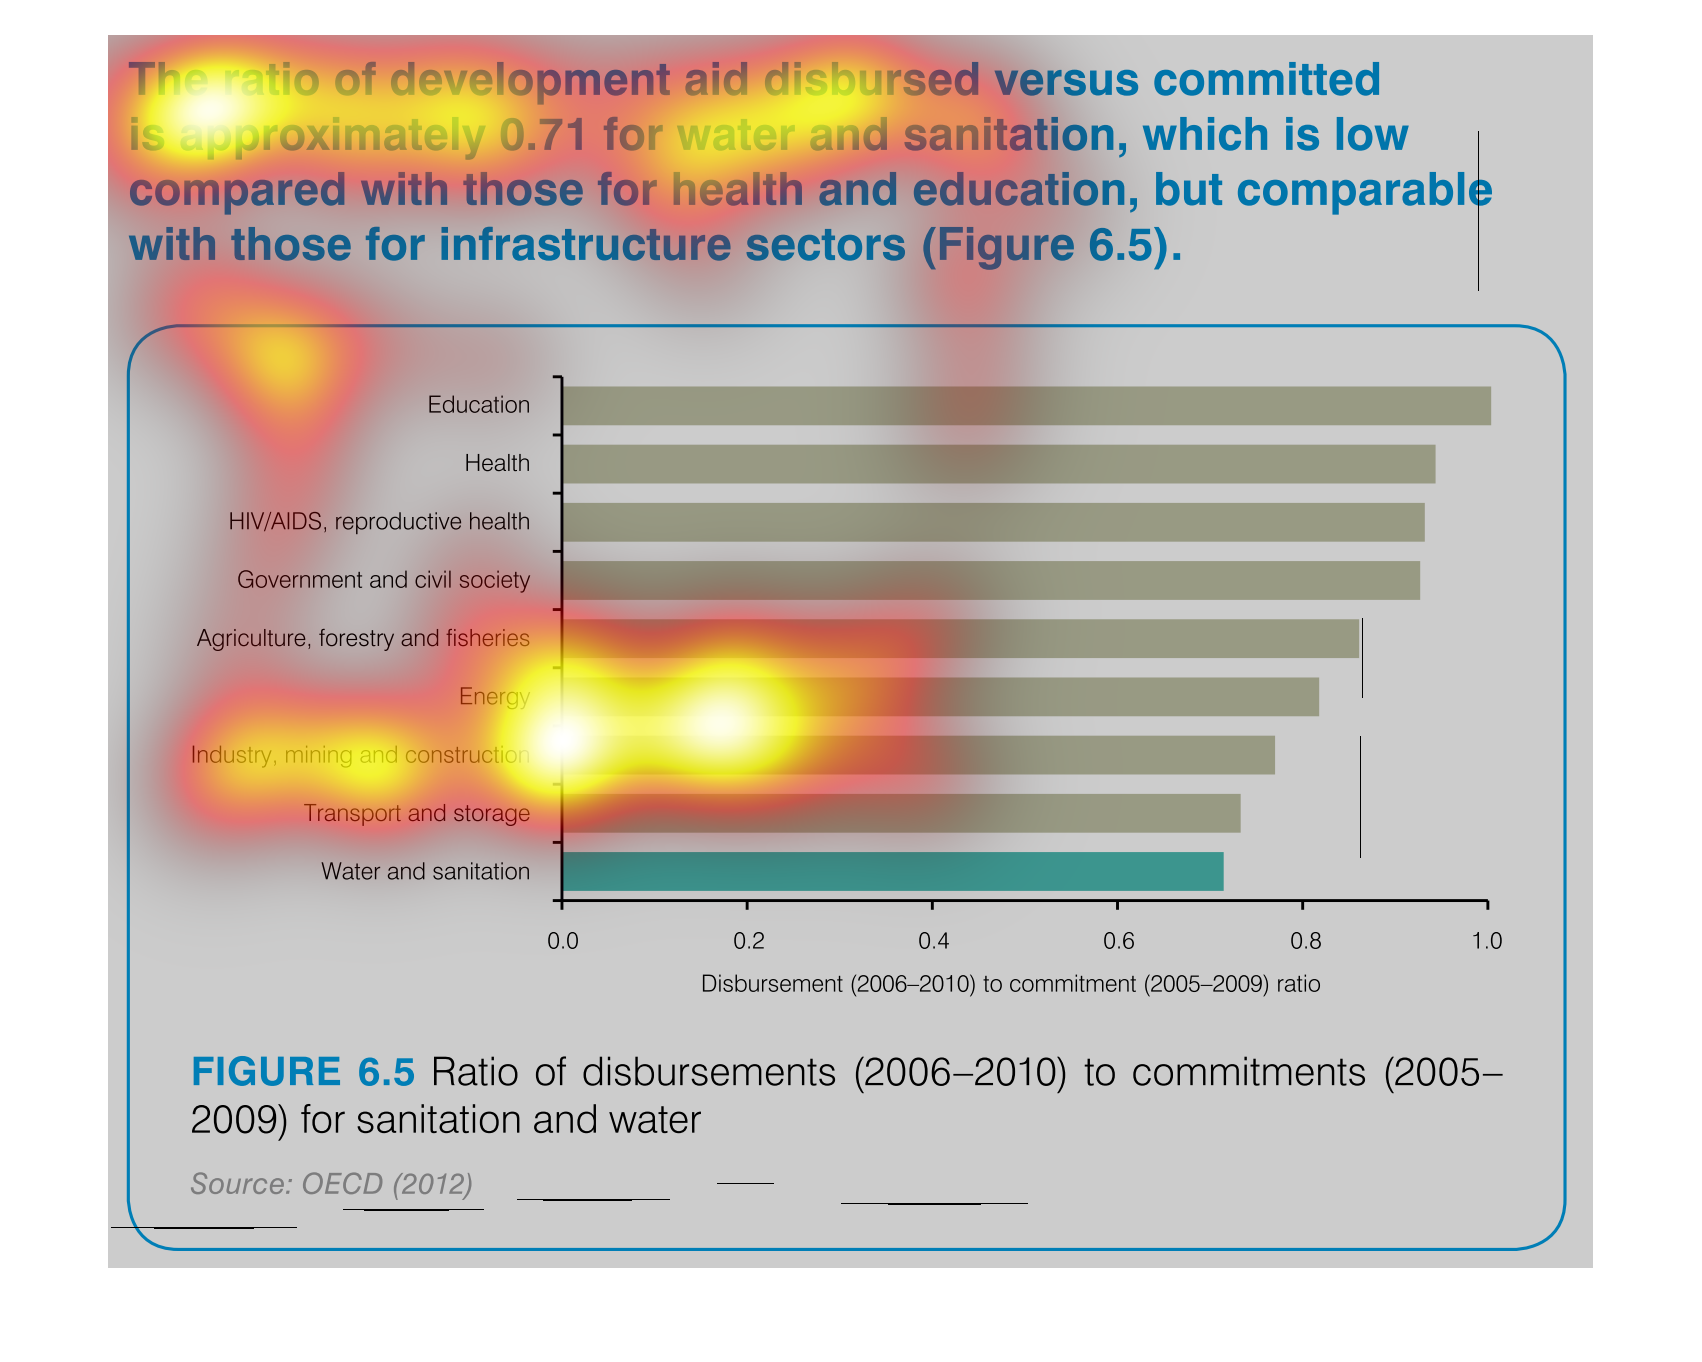
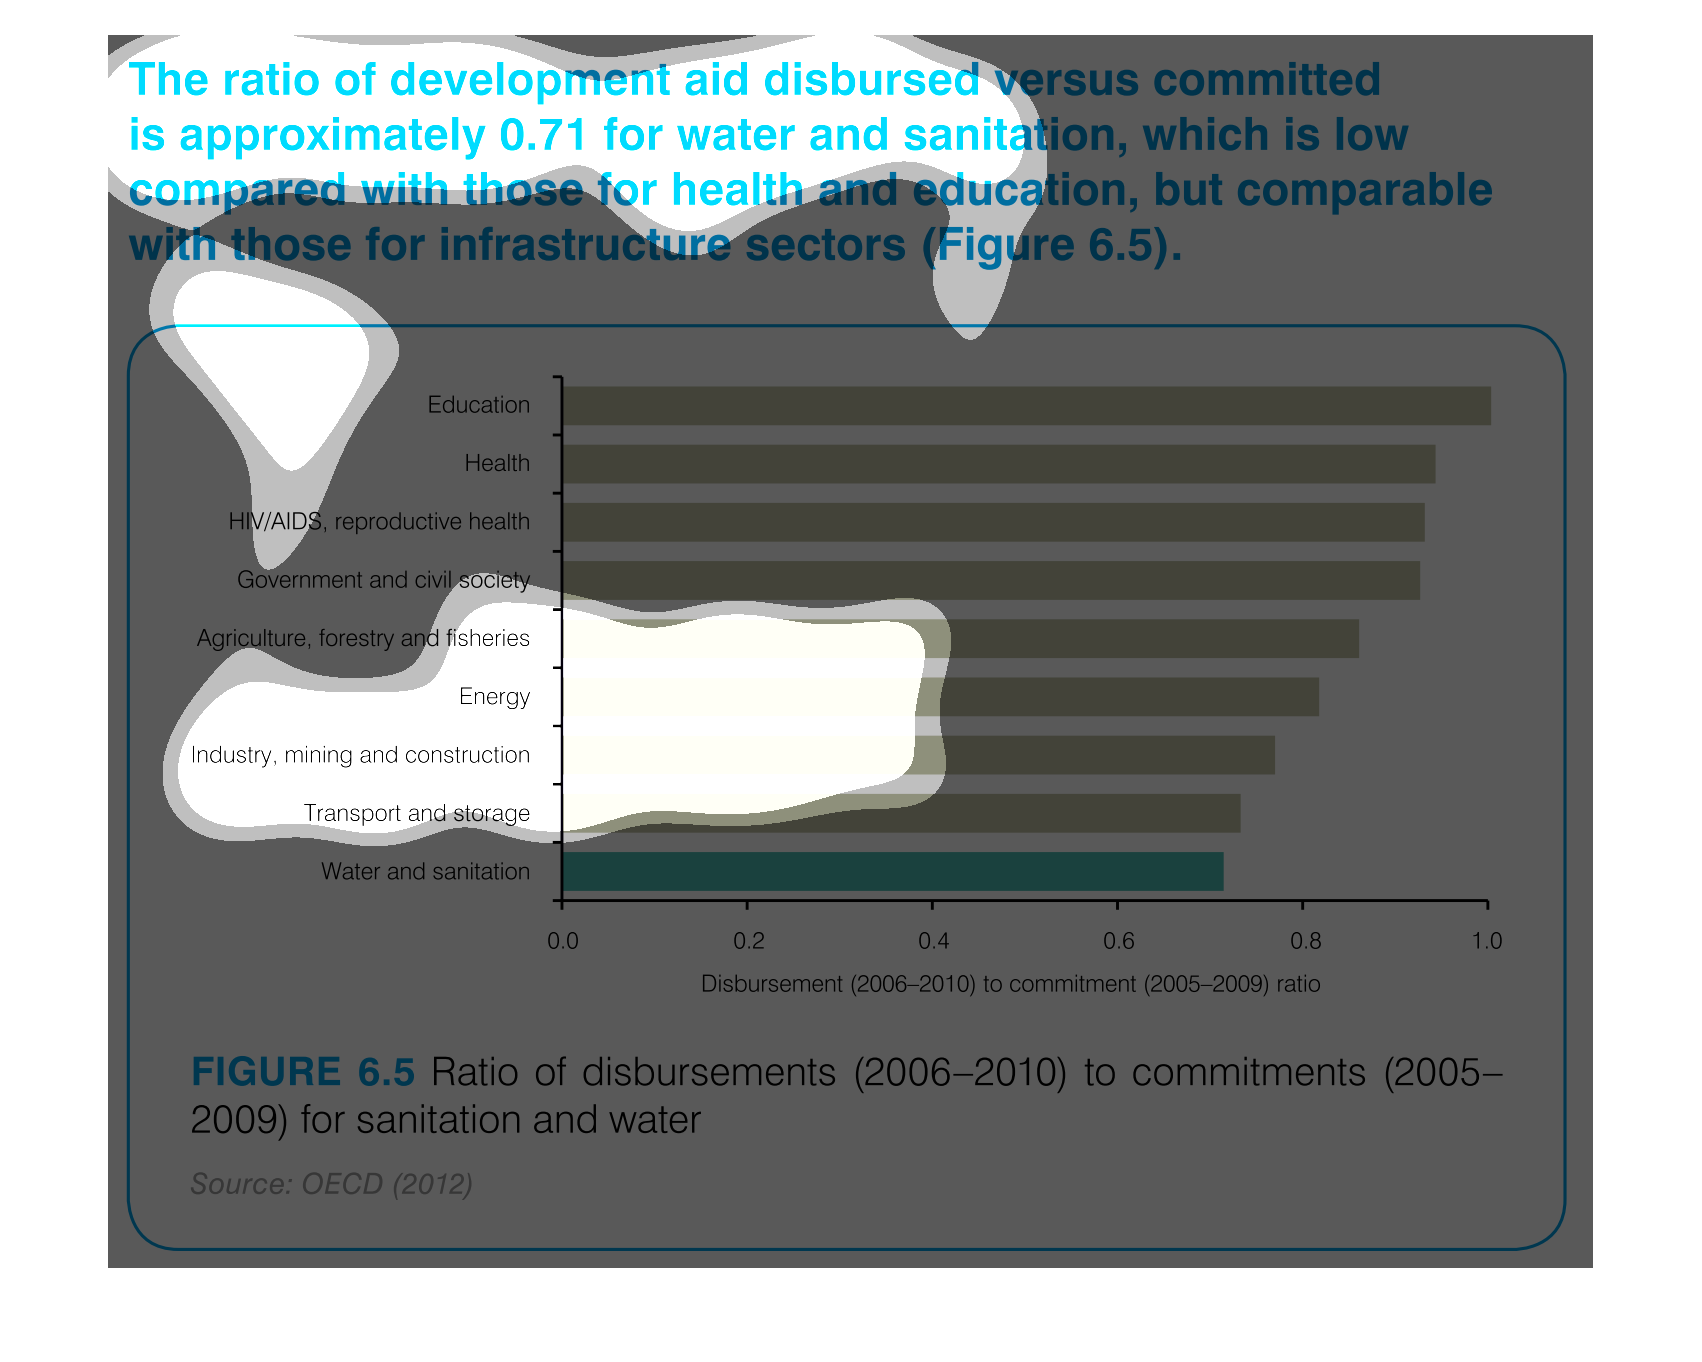
The image depicts the ratio of development aid disbursed versus committed is approximately
0.71 for water and sanitation which is low for health and education, but comparable for infrastructure
sectors. Water and sanitation appears to be the least disbursed of any listed aid.
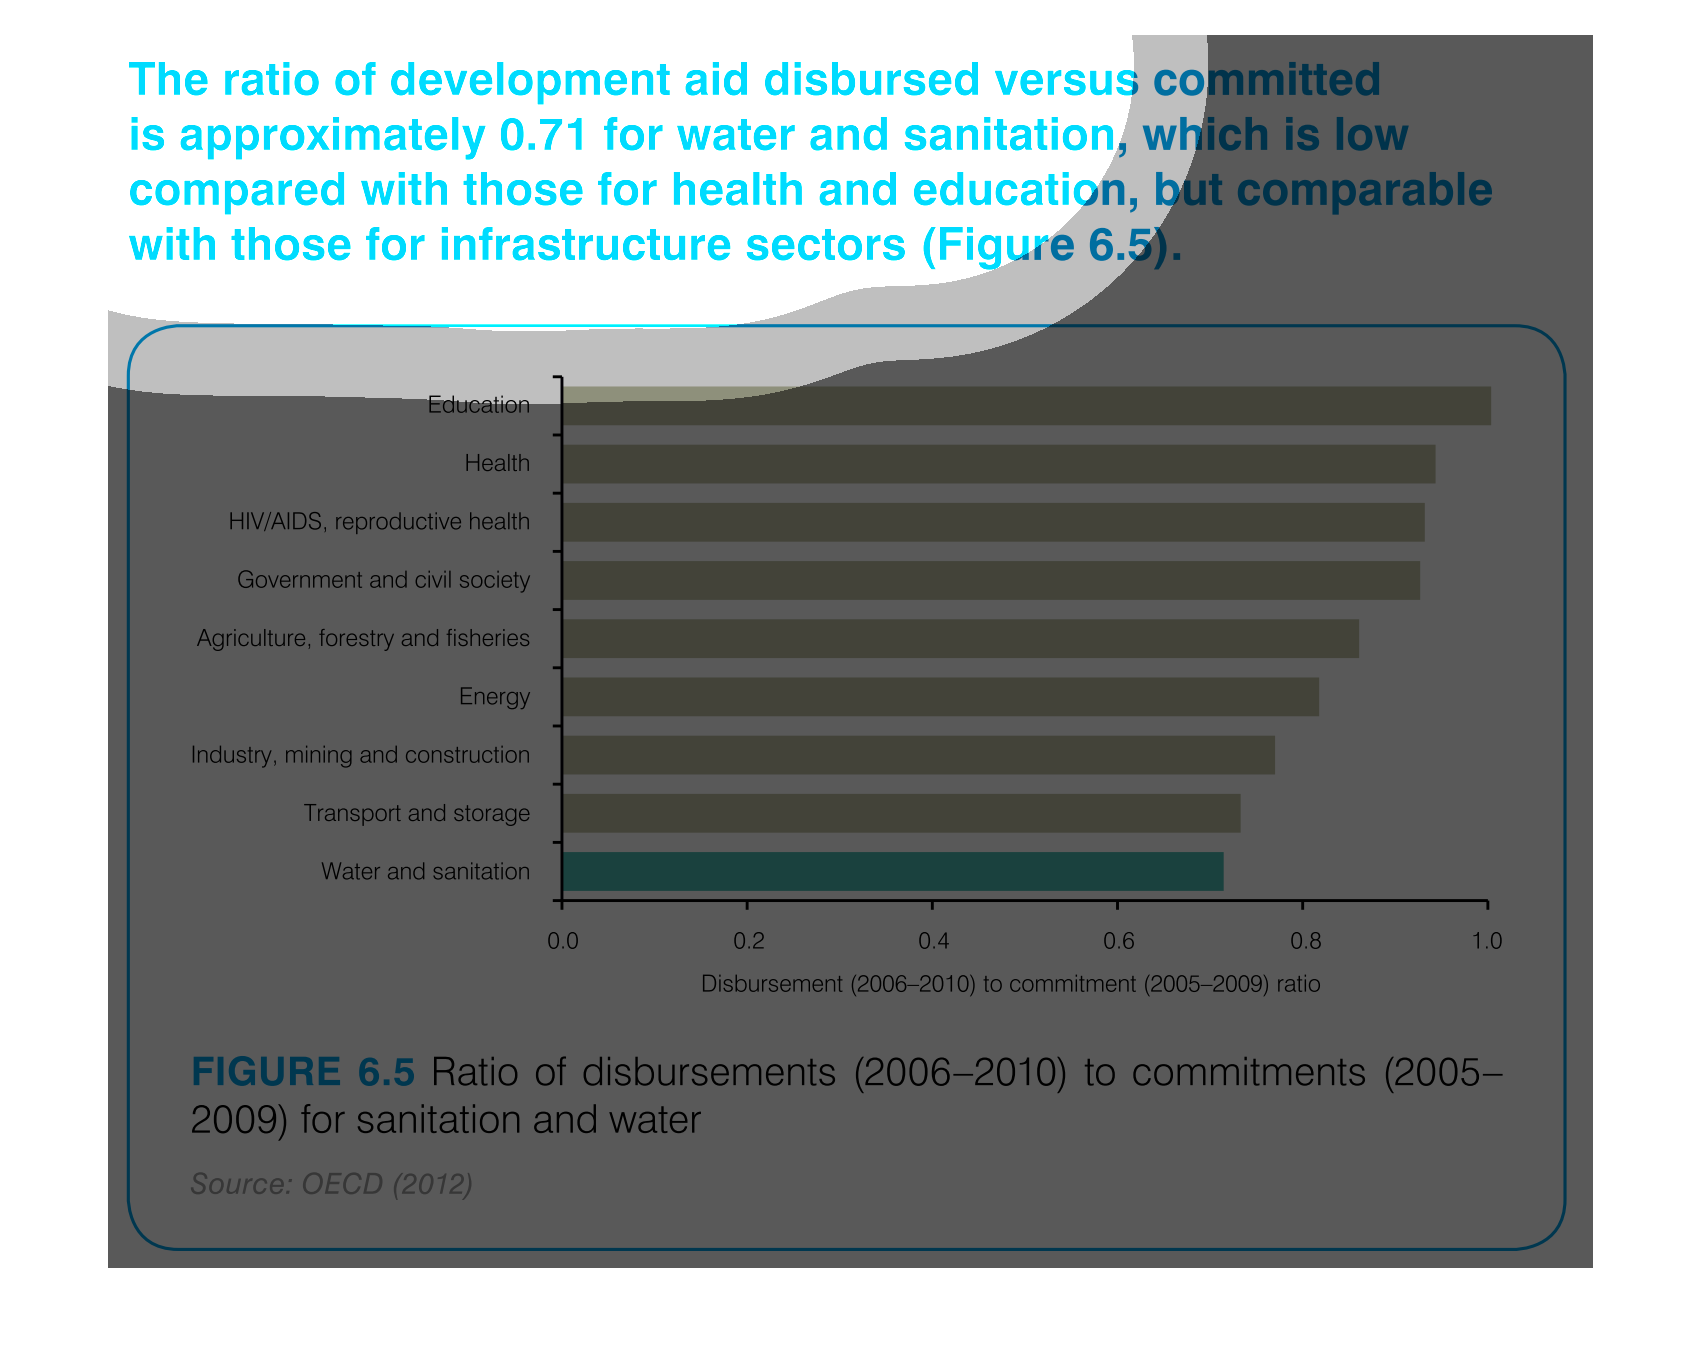
Water and sanitation are two very important things that one cannot be without. In order for
a nation to prosper, it needs those rudimentary things to make things happen. In this chart
we see how the disbursement of funds affects the educational, governmental, and other facets
of a countries existence.
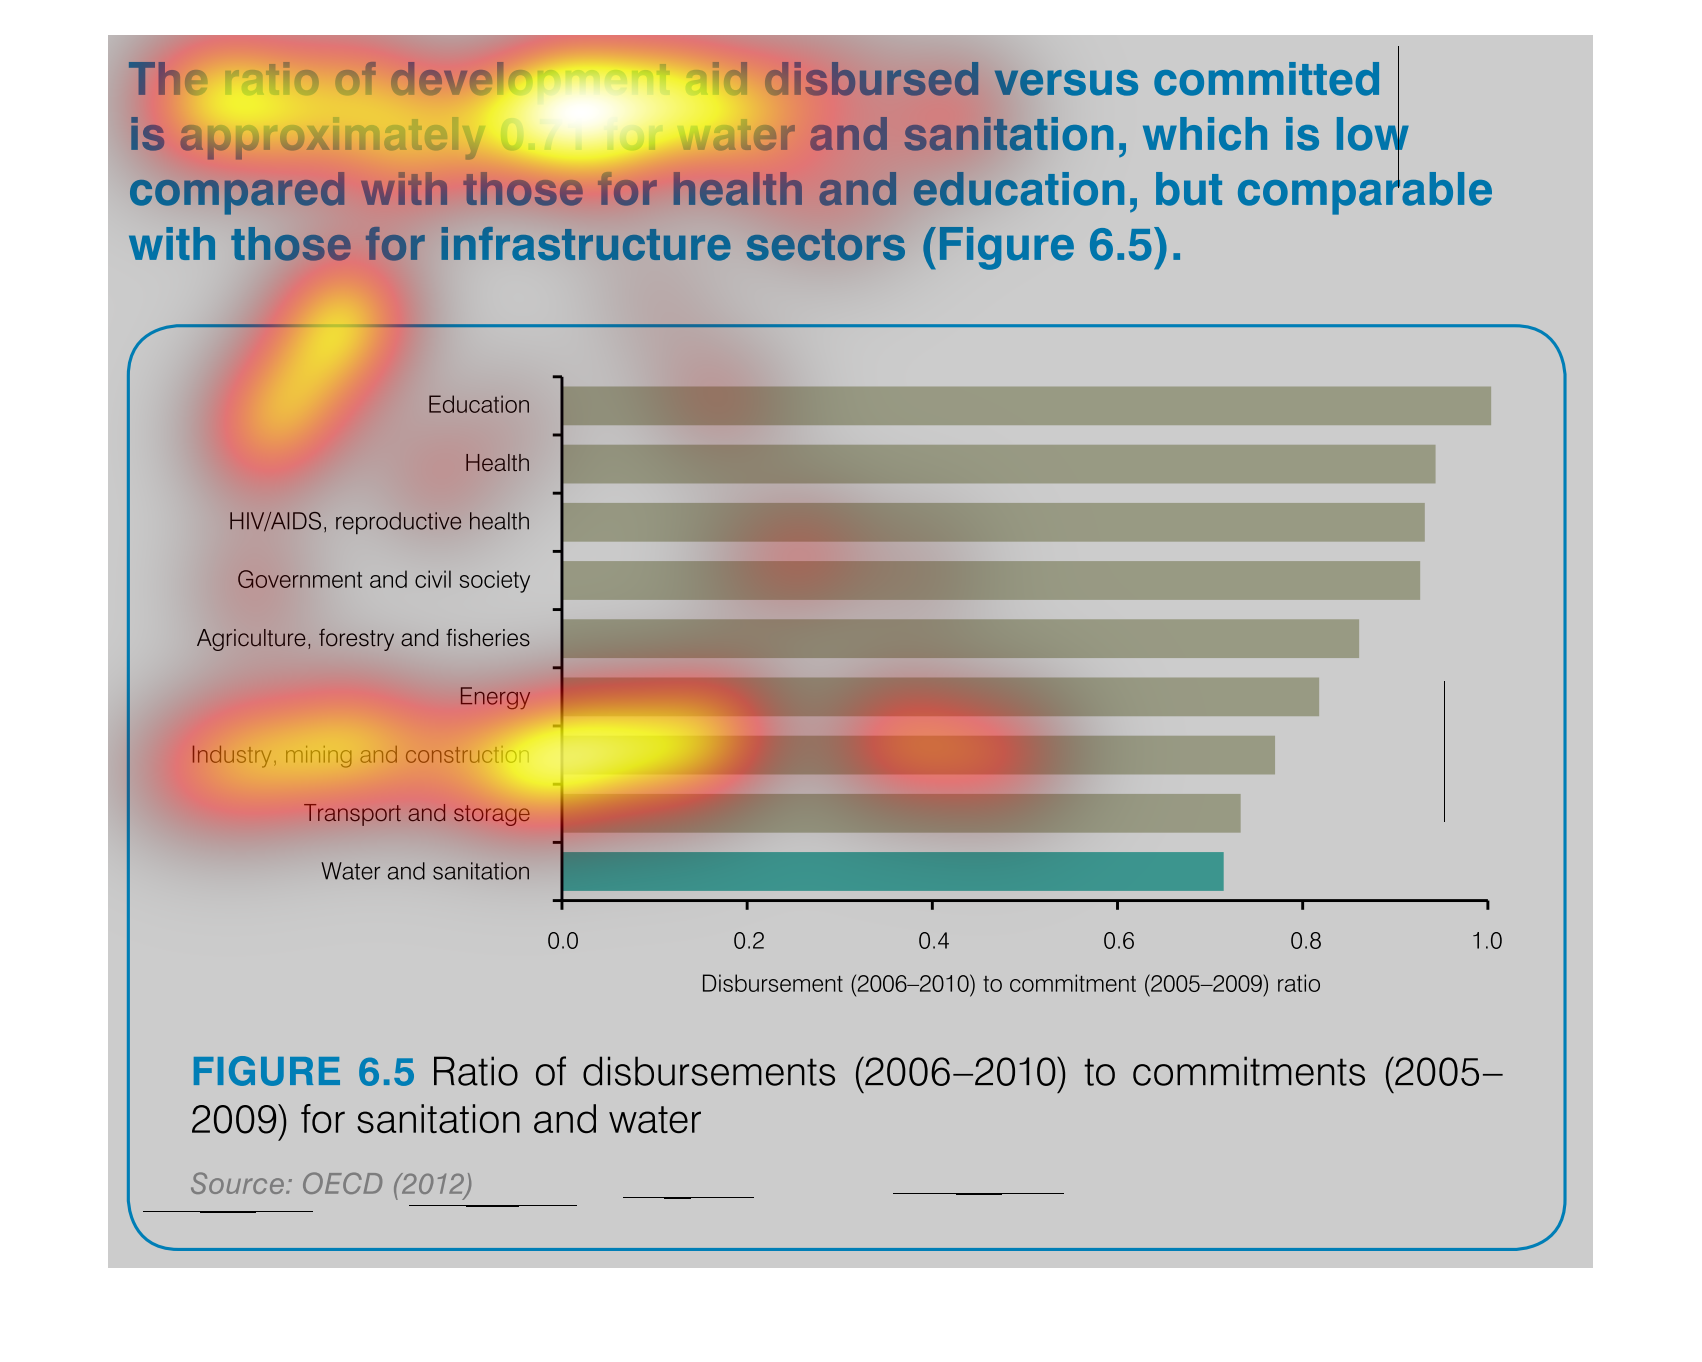
This chart describes the ratio of development aid disbursed versus committed is approximately
0.71 for water and sanitation, which is low compared with those for health and education.
This is a graph that illustrates the ration of development aid that is actually disbursed
verses what was actually committed. It shows this ratio is 0.71 for water and sanitation issues.
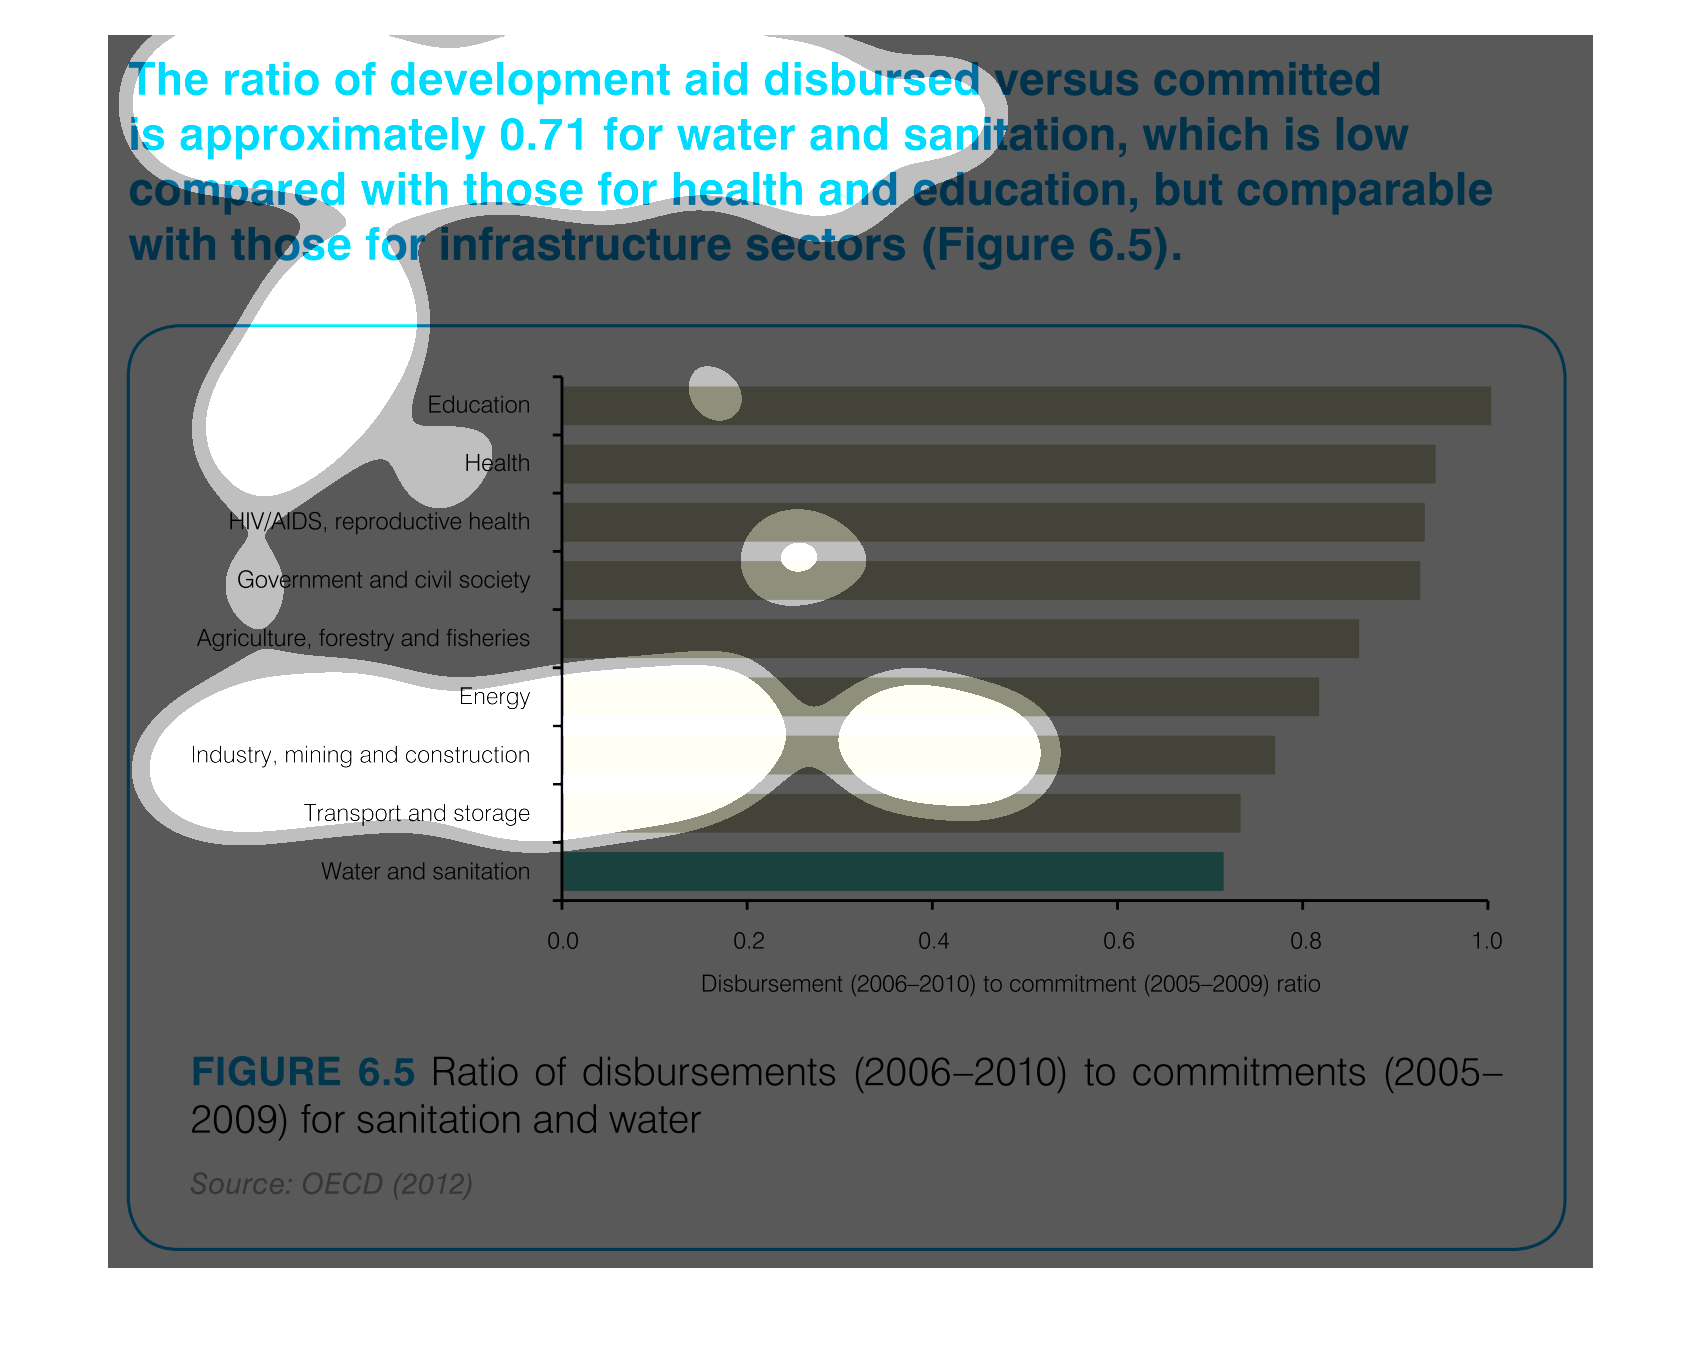
the ratio of development aid disbursed versus commited is approximately 0.71 for water and
sanitation which is low compared with those for health and education but comparable with those
for infrastructure sectors (figure 6.5)