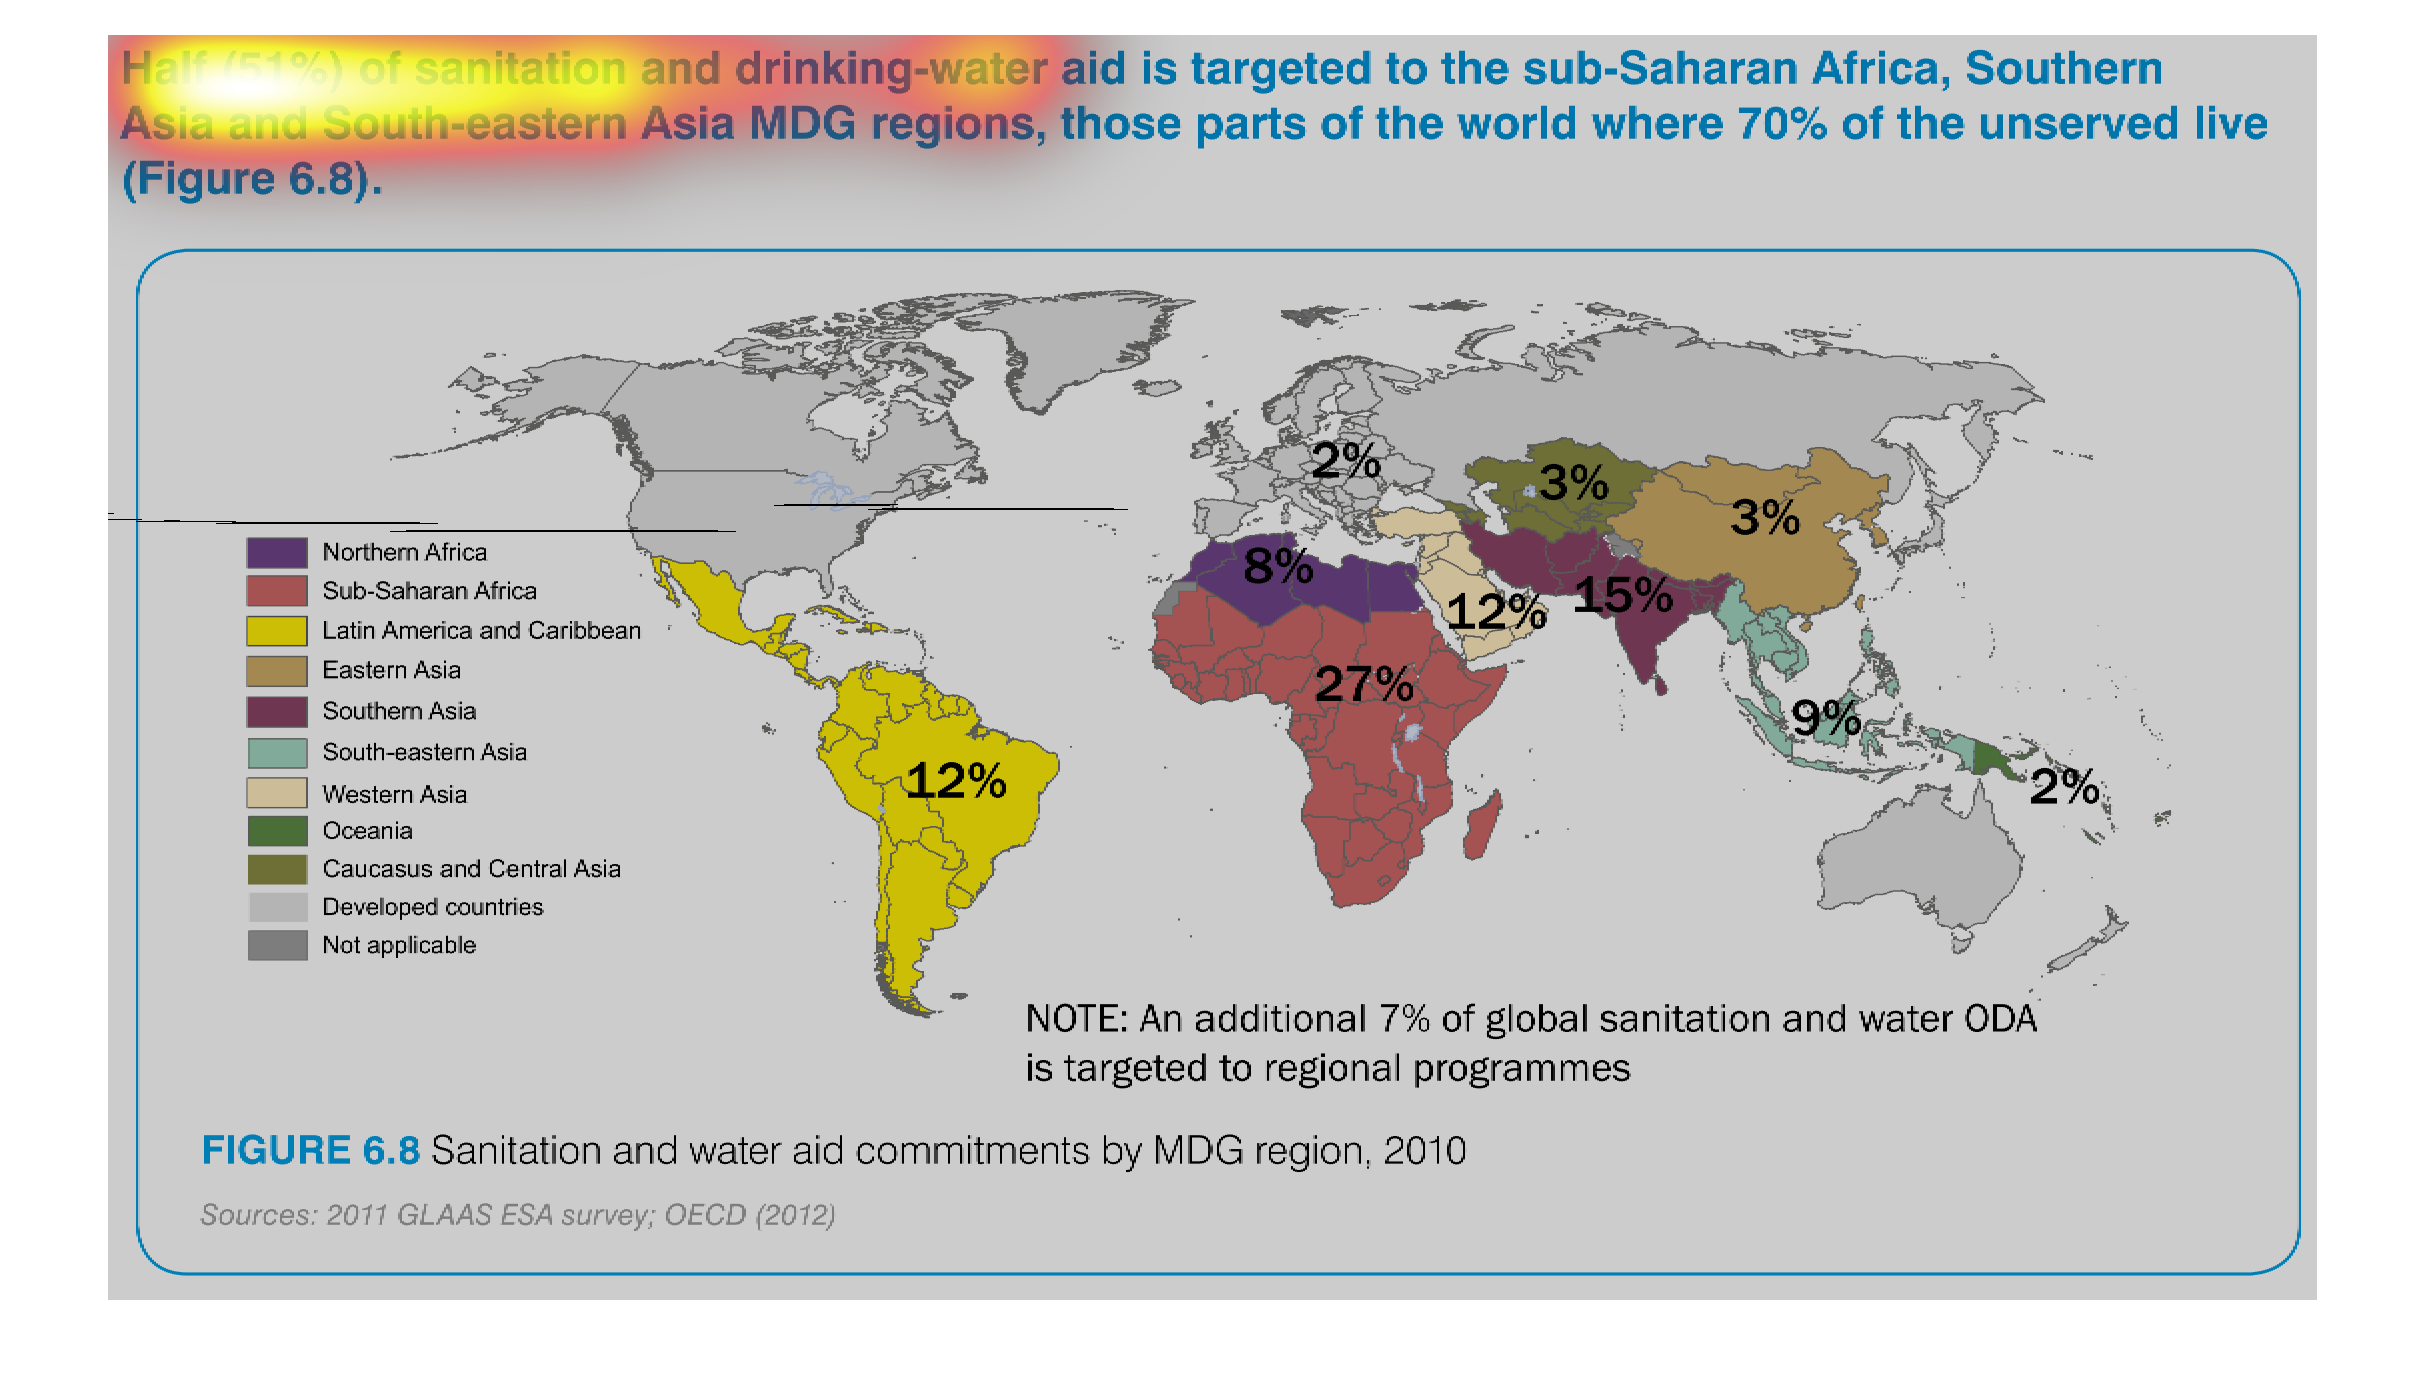
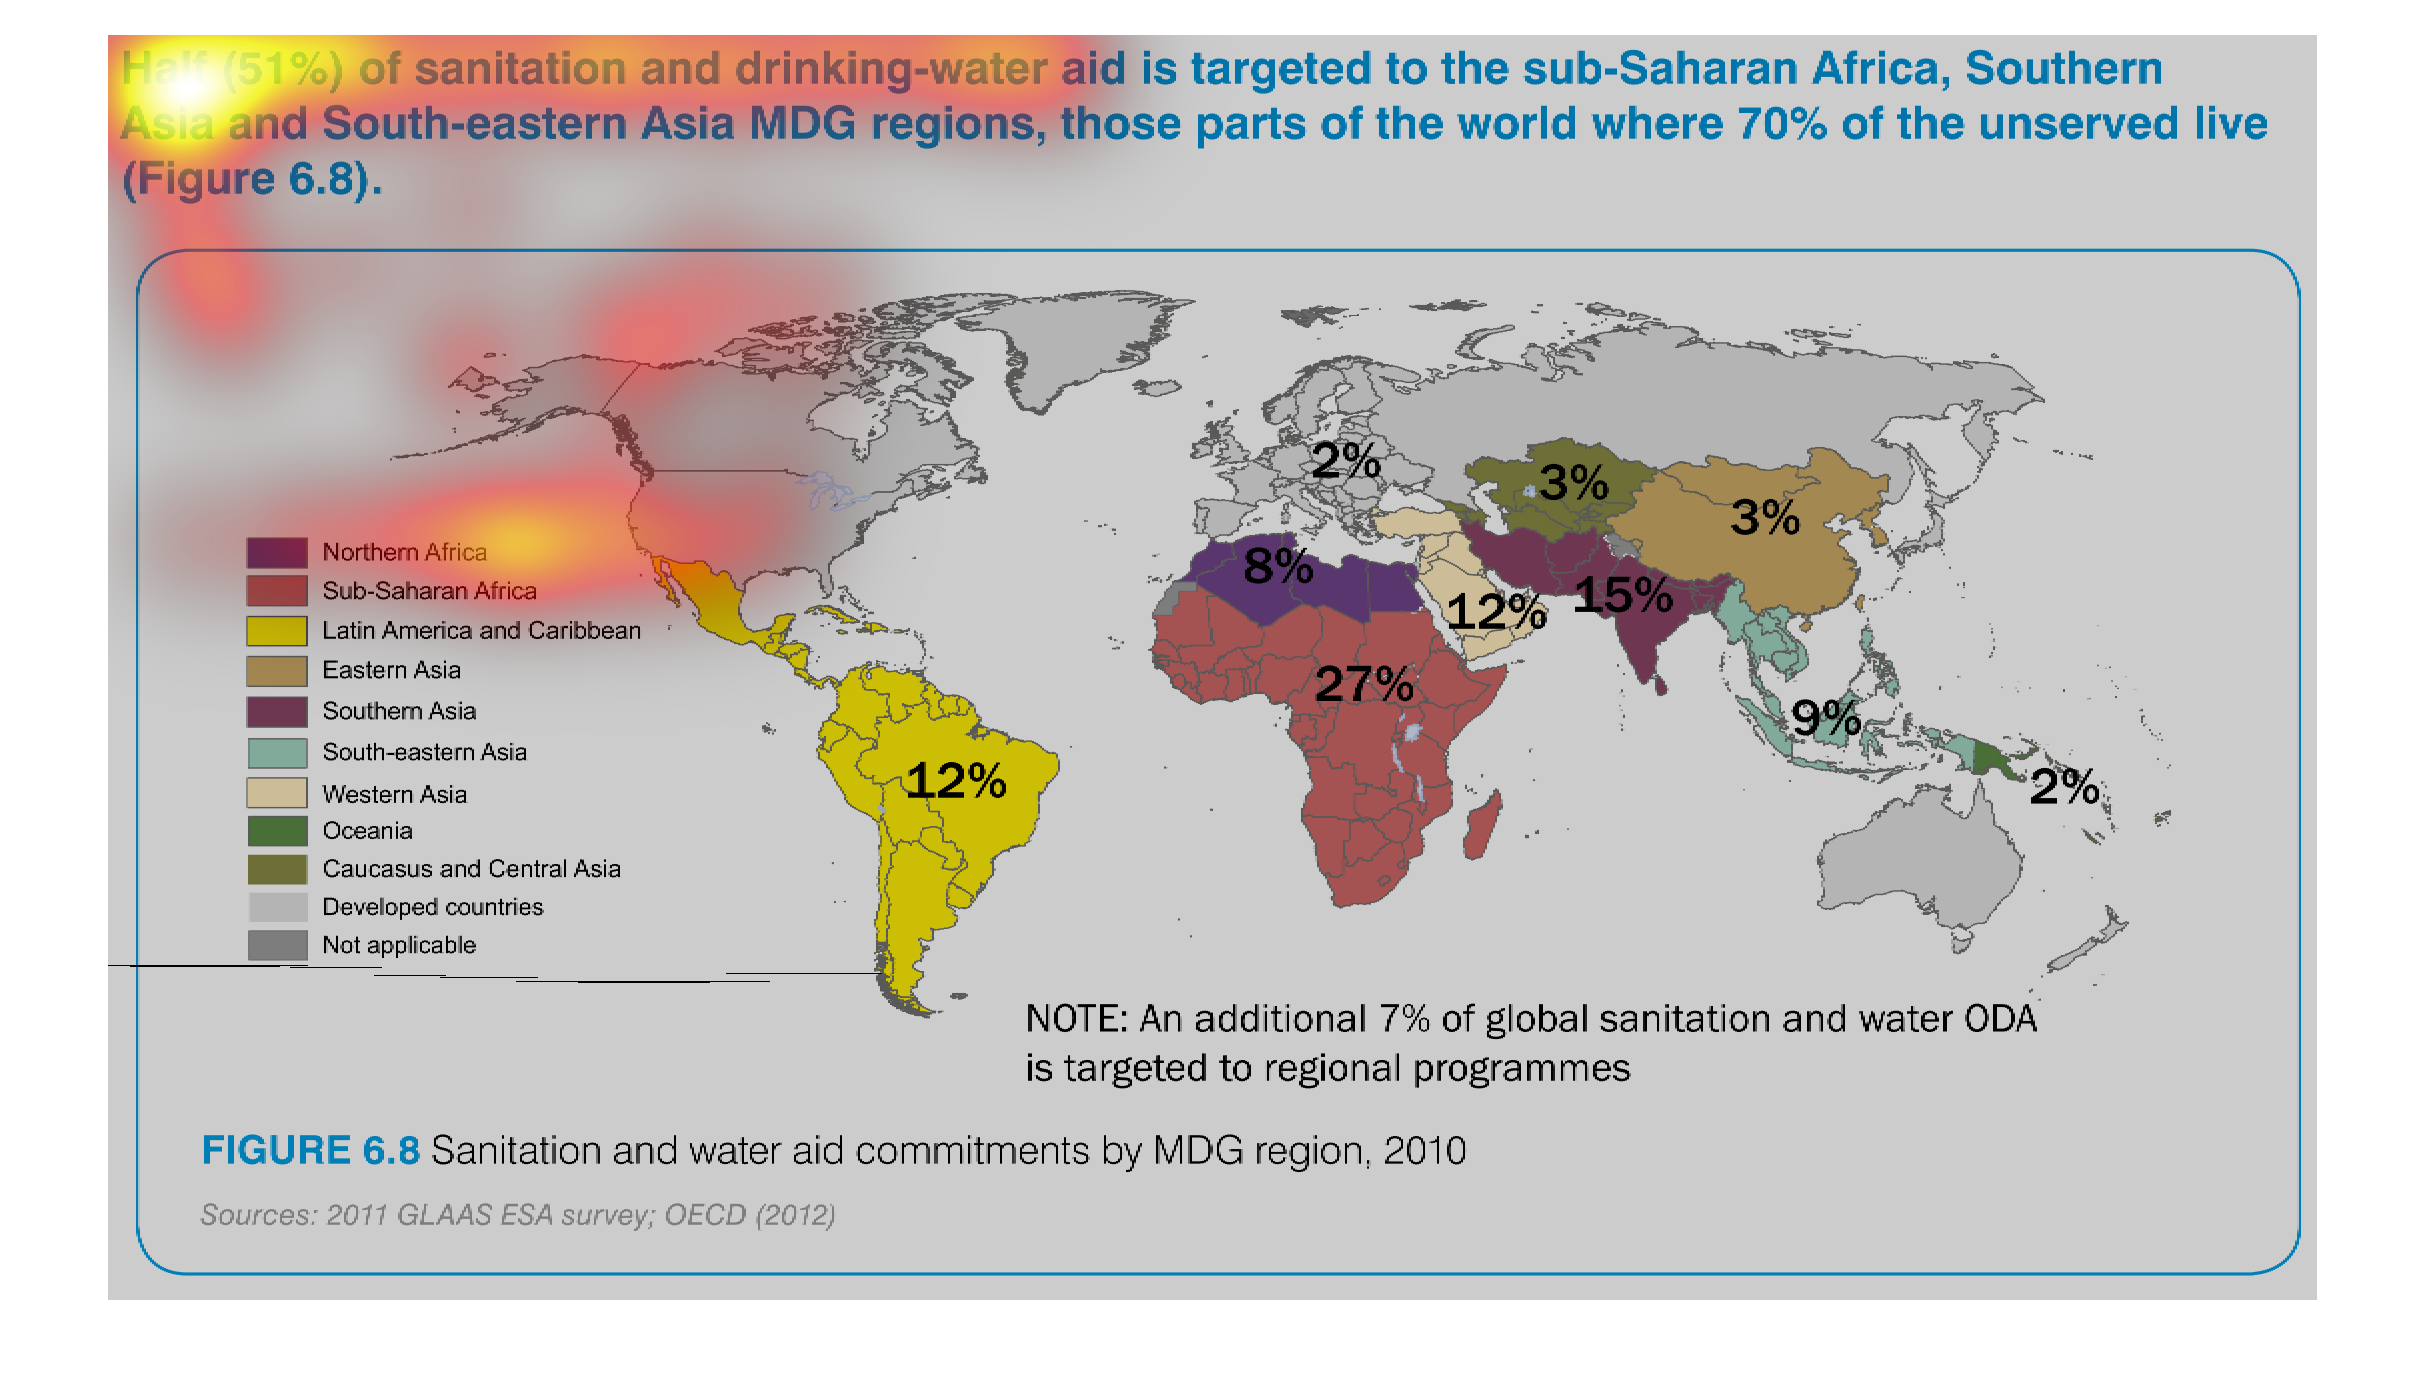
The image is a world map with different colors representing different regions and Percentages
listed of the total for the world as to where sanitation and drinking water aid have been
provided.  The largest is to Sub Saharan Africa.

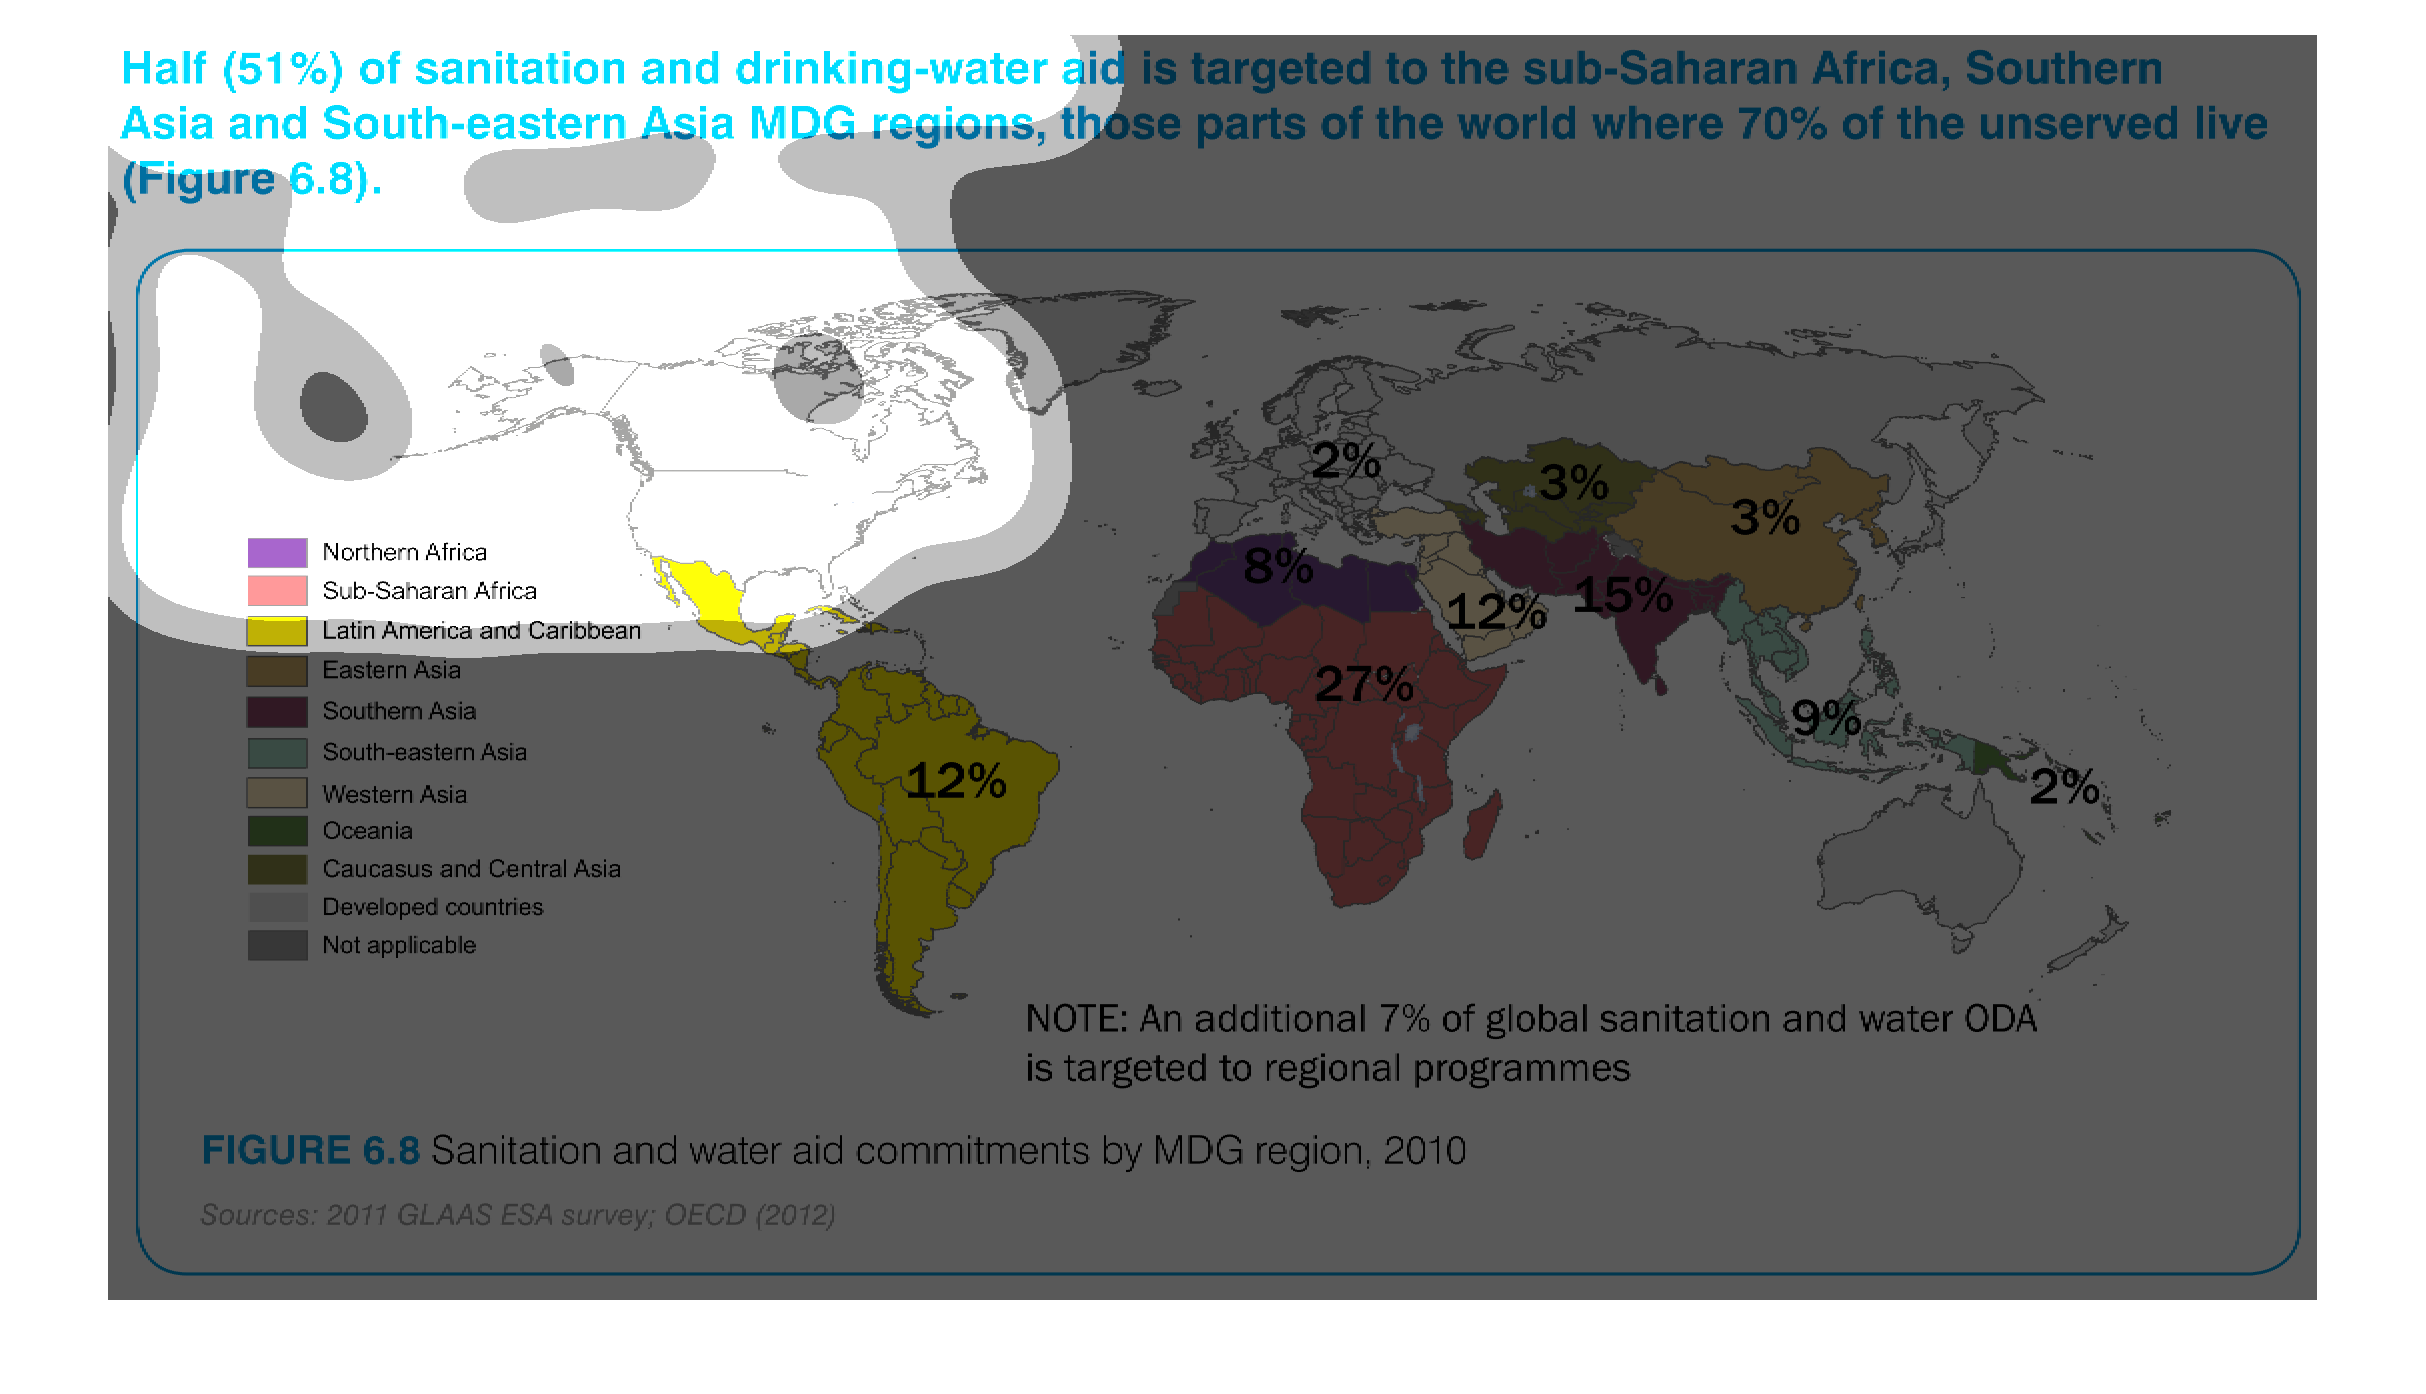
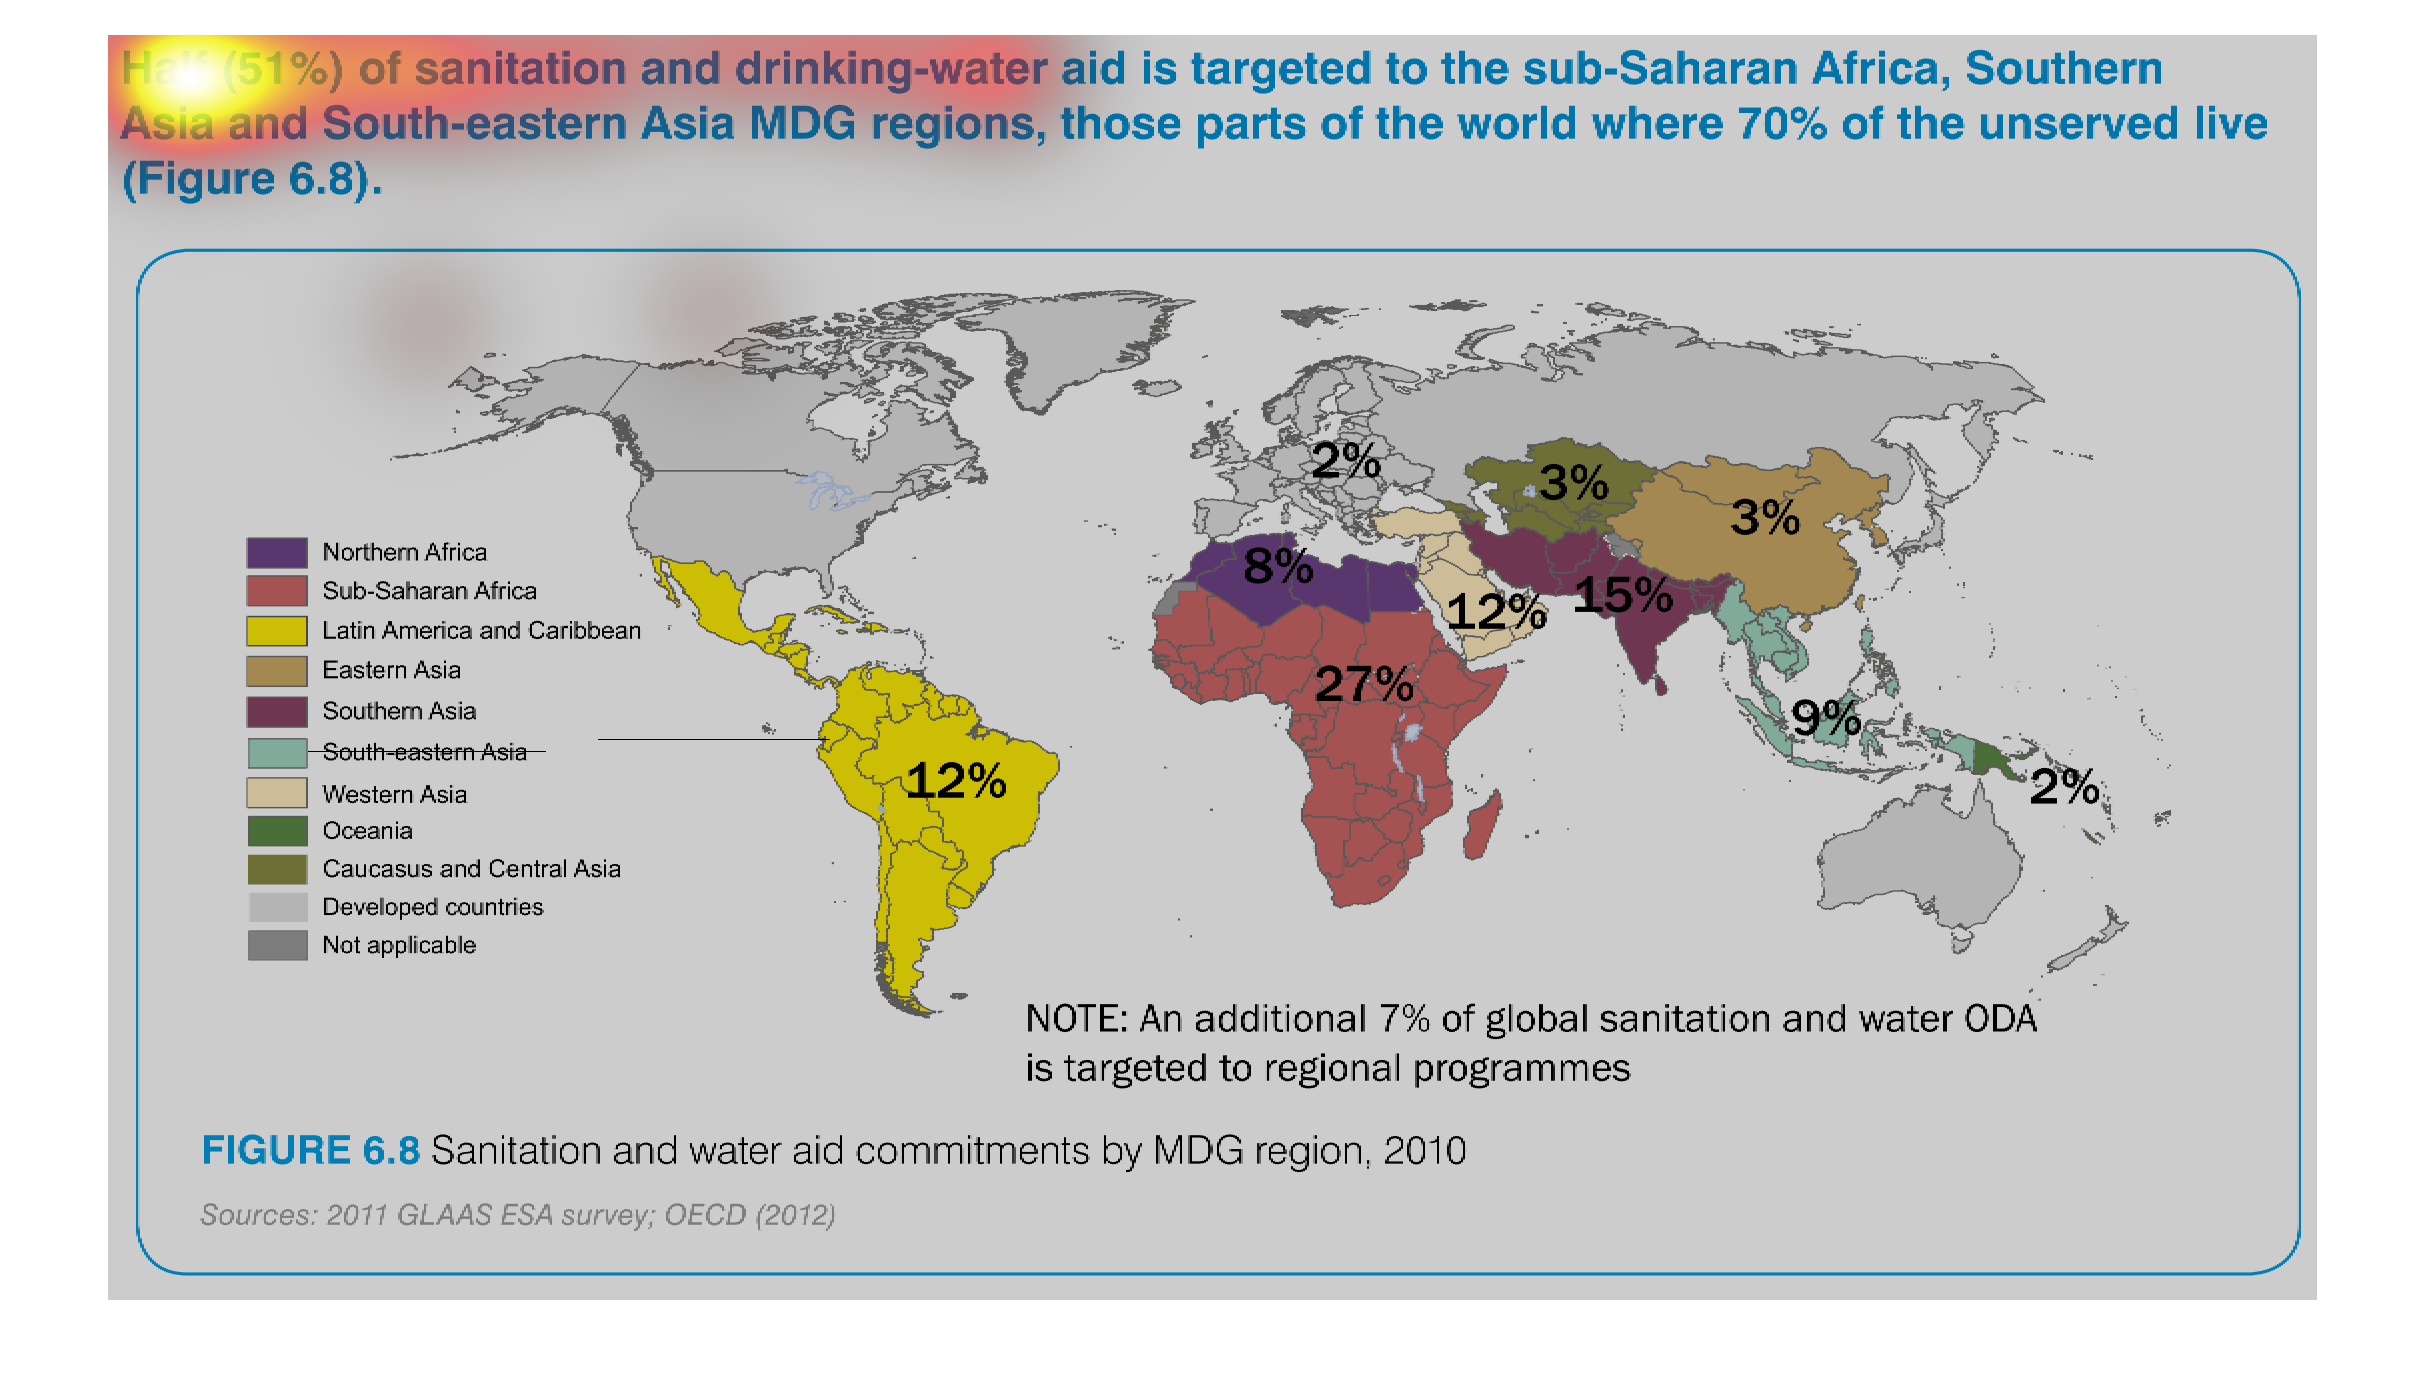
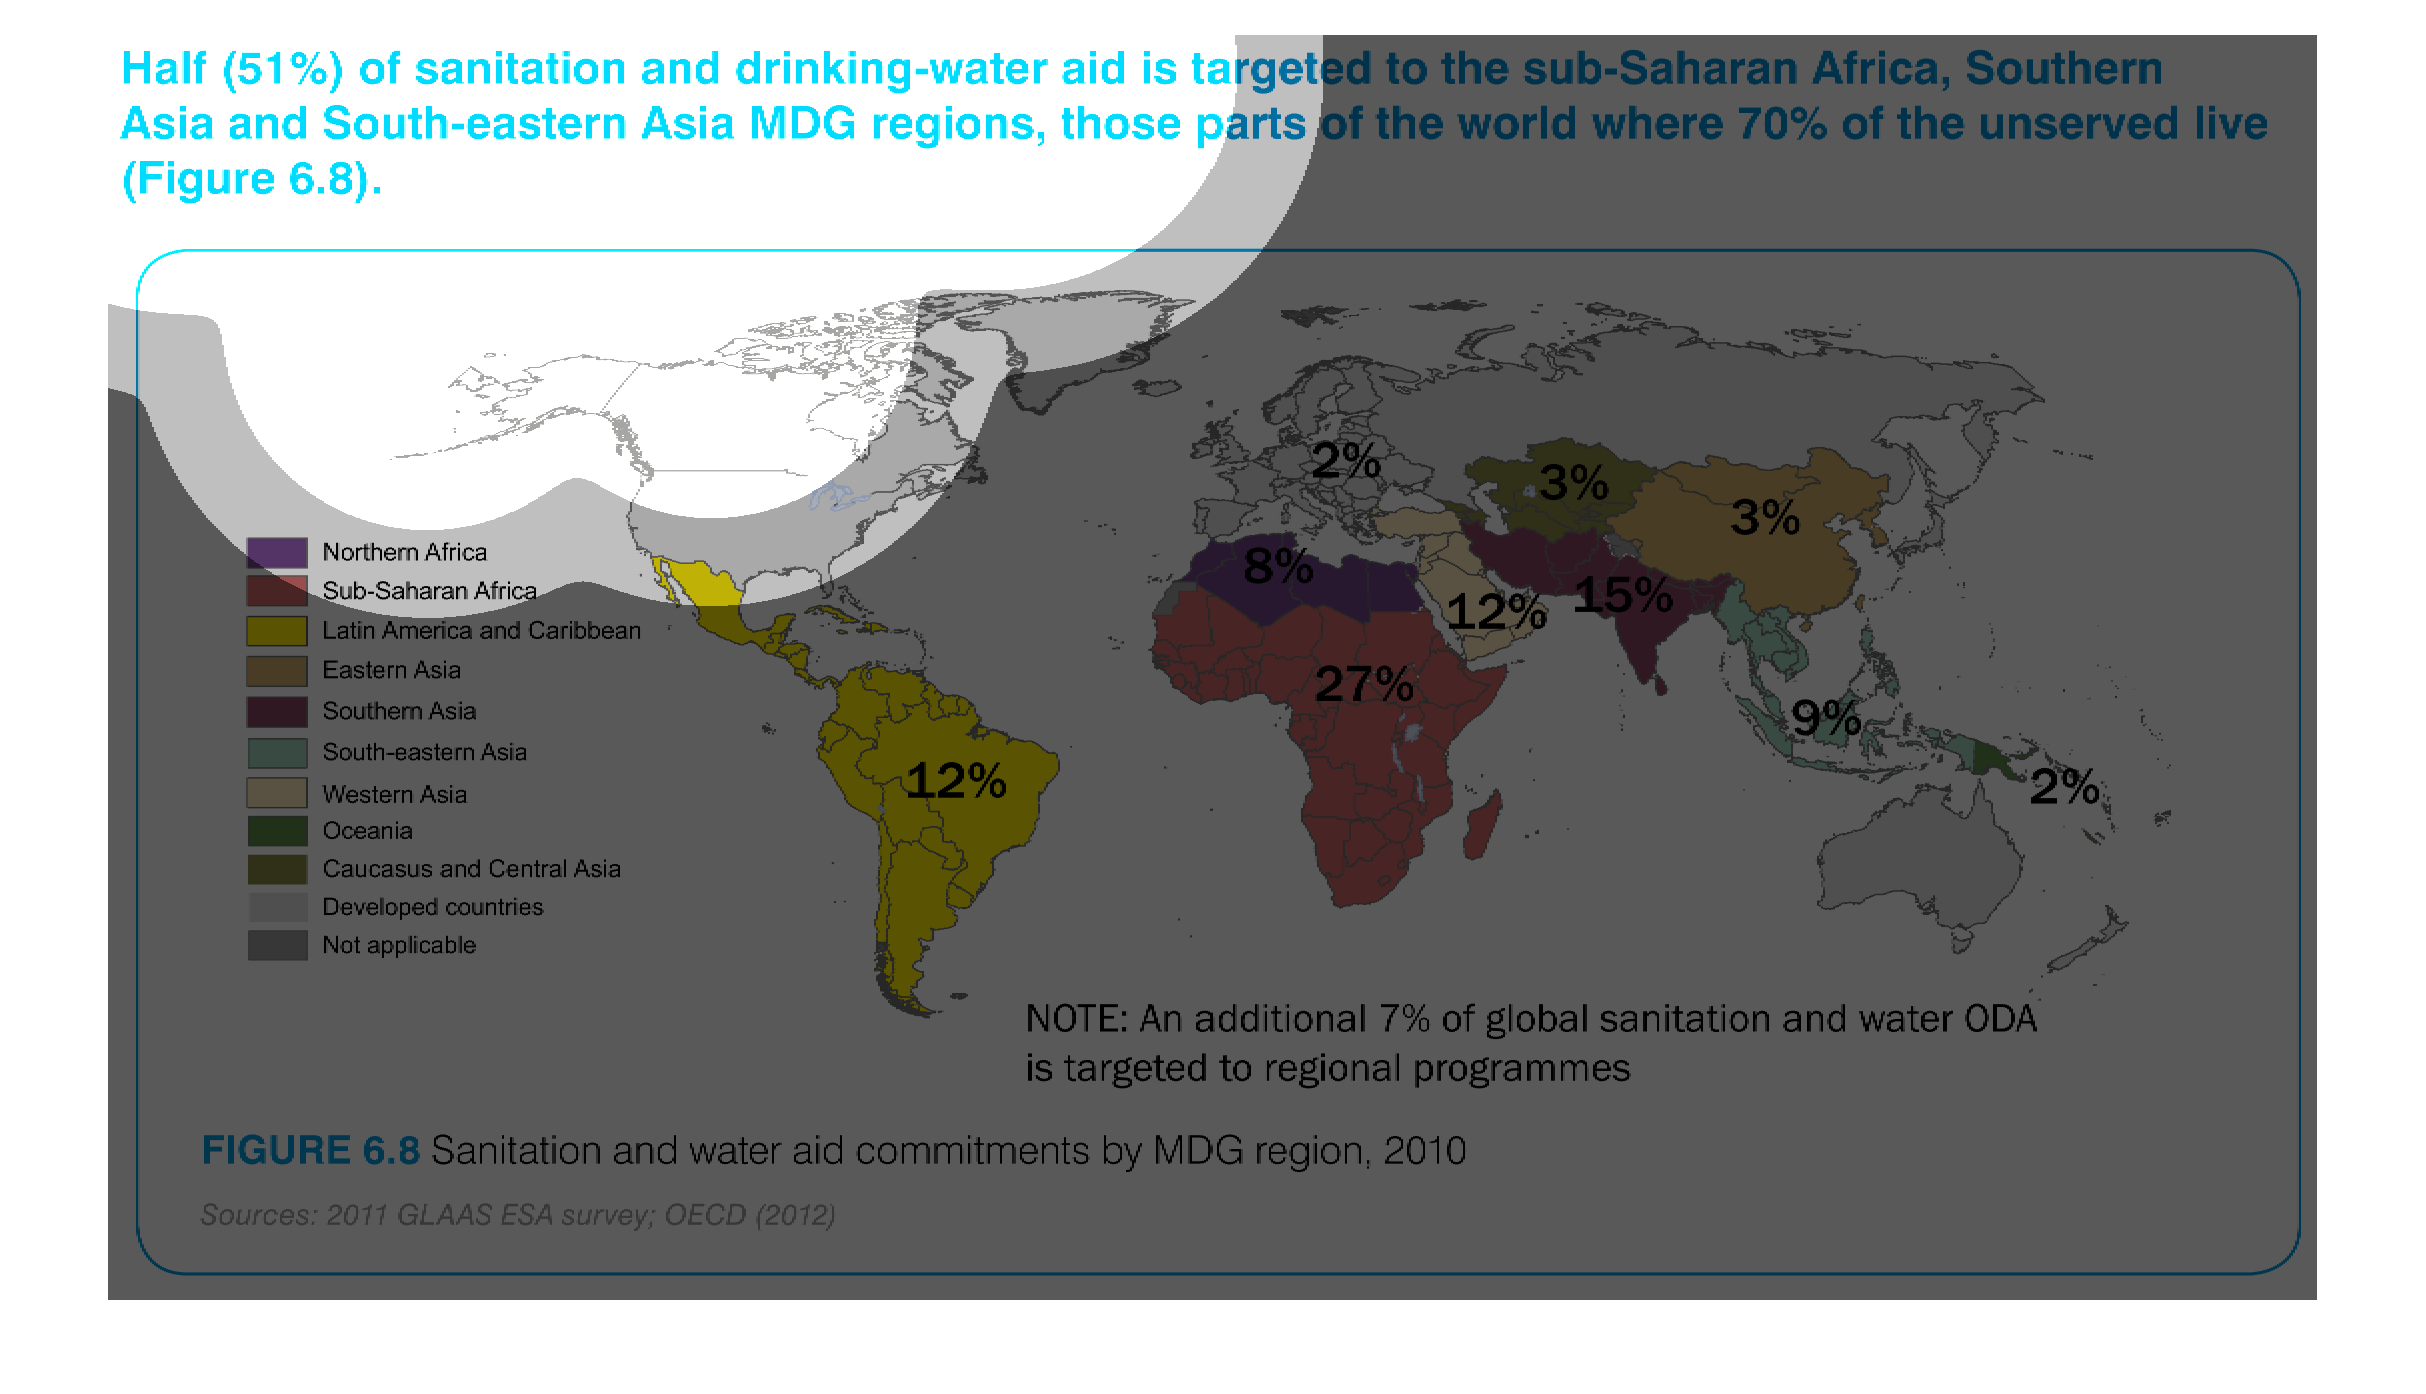
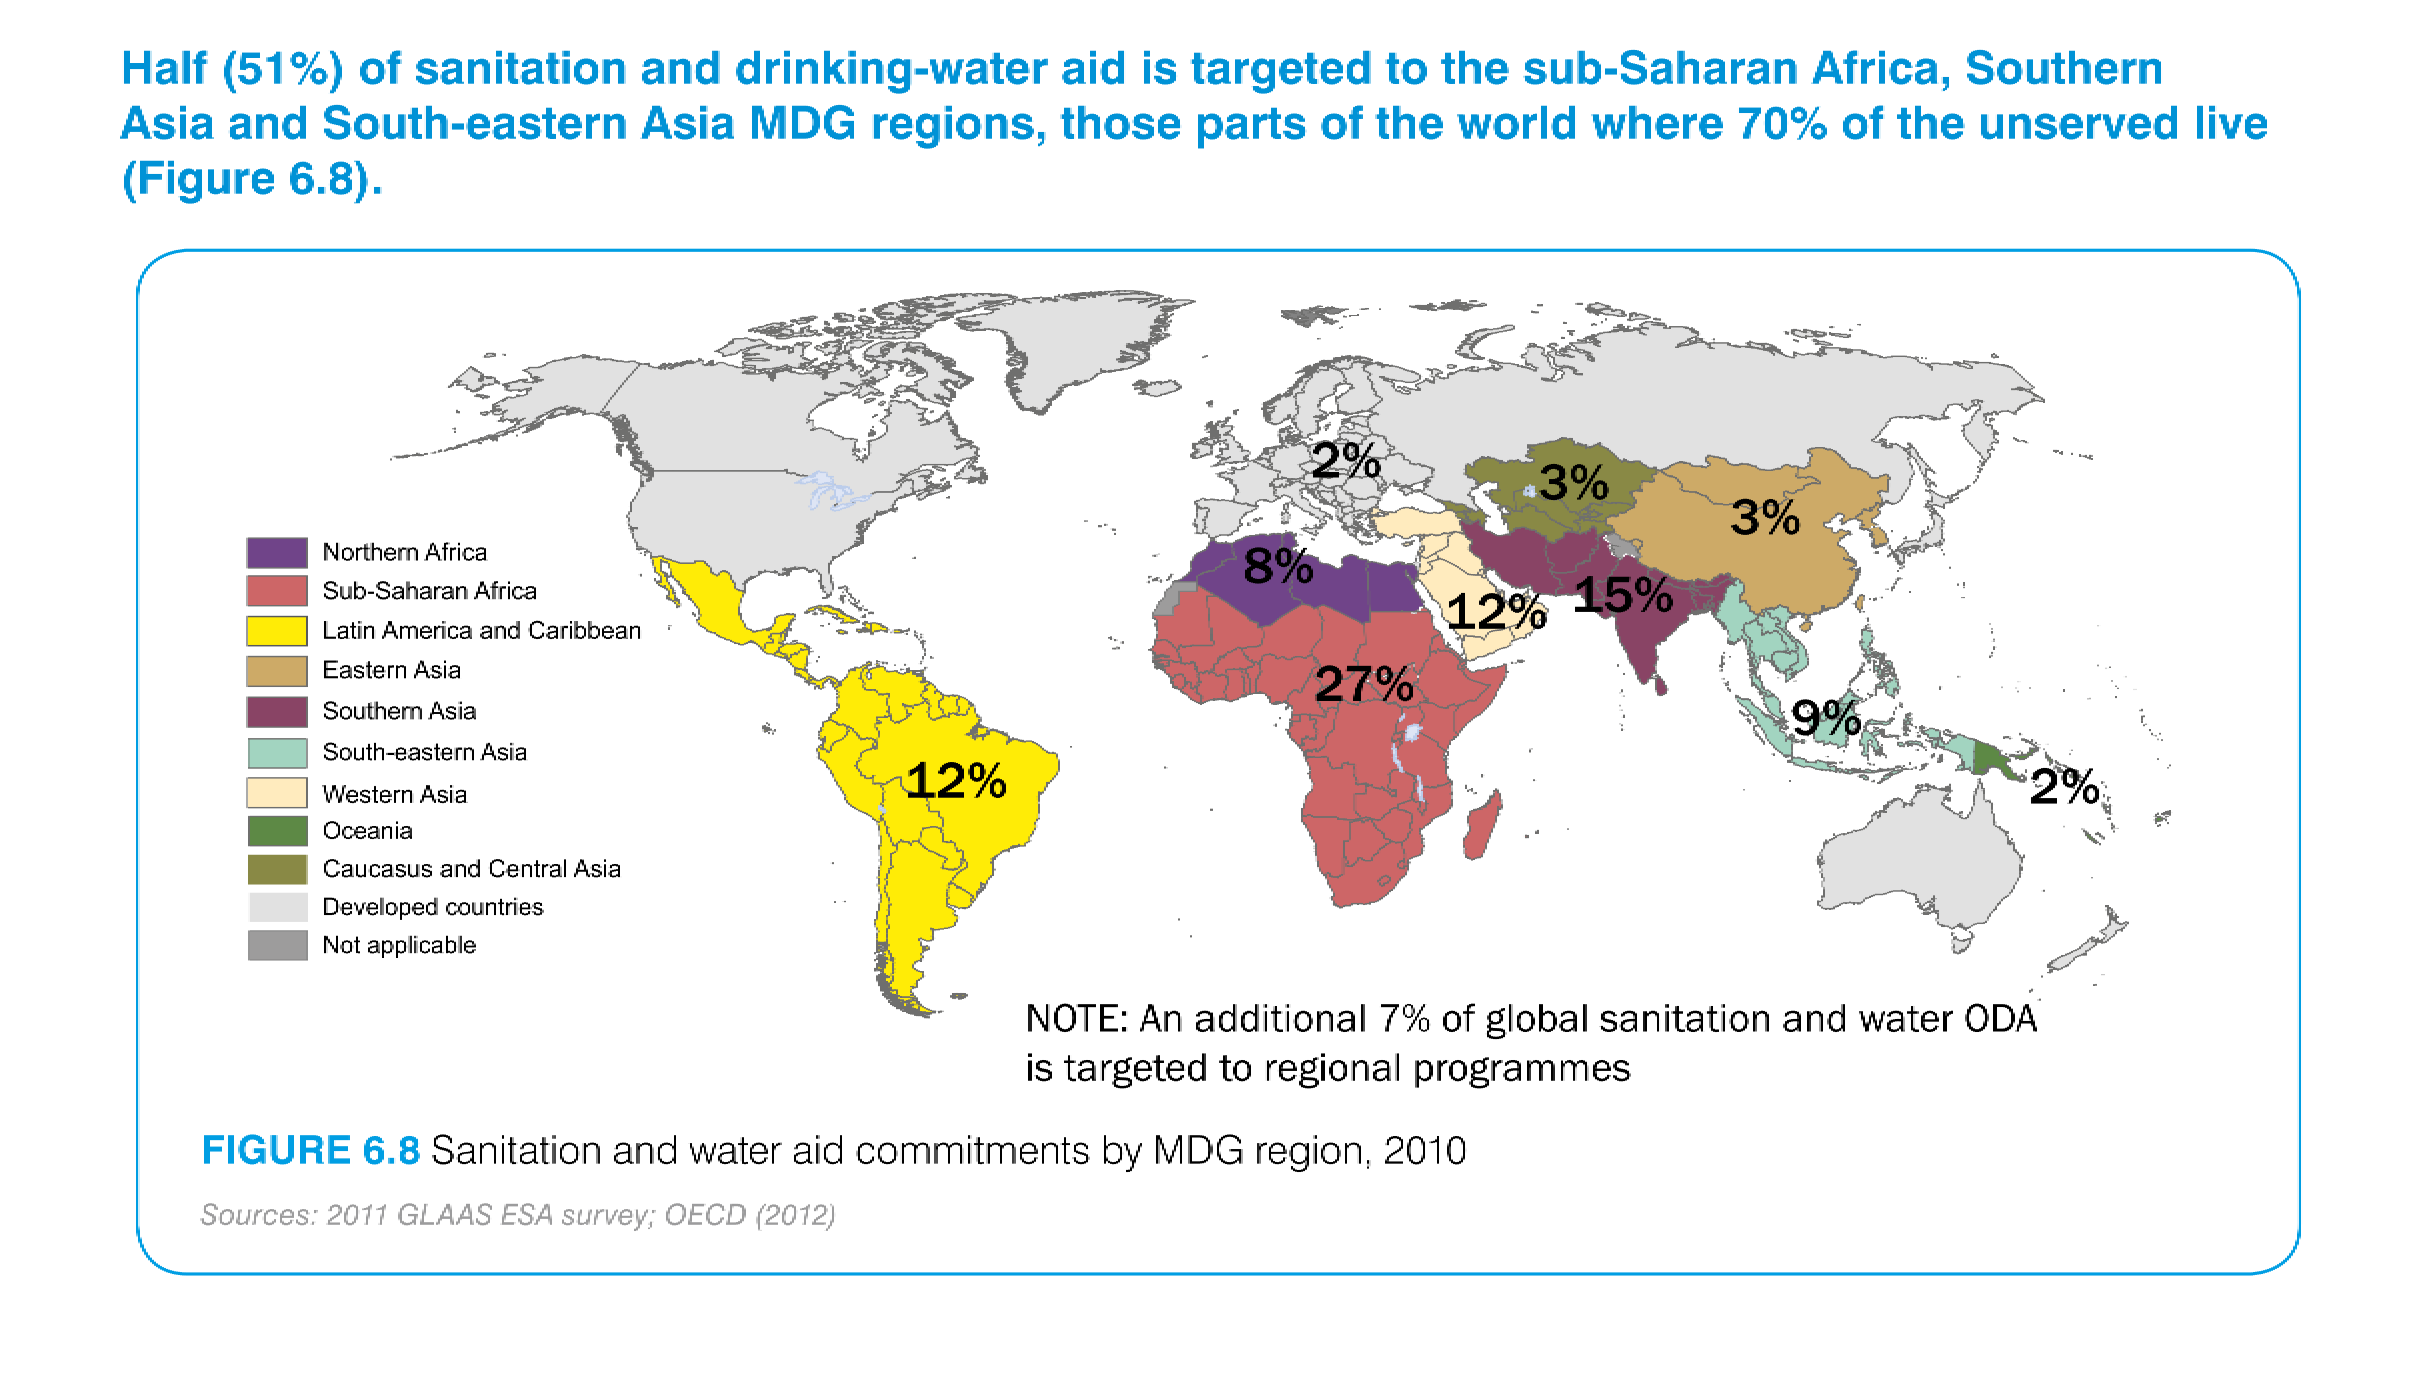
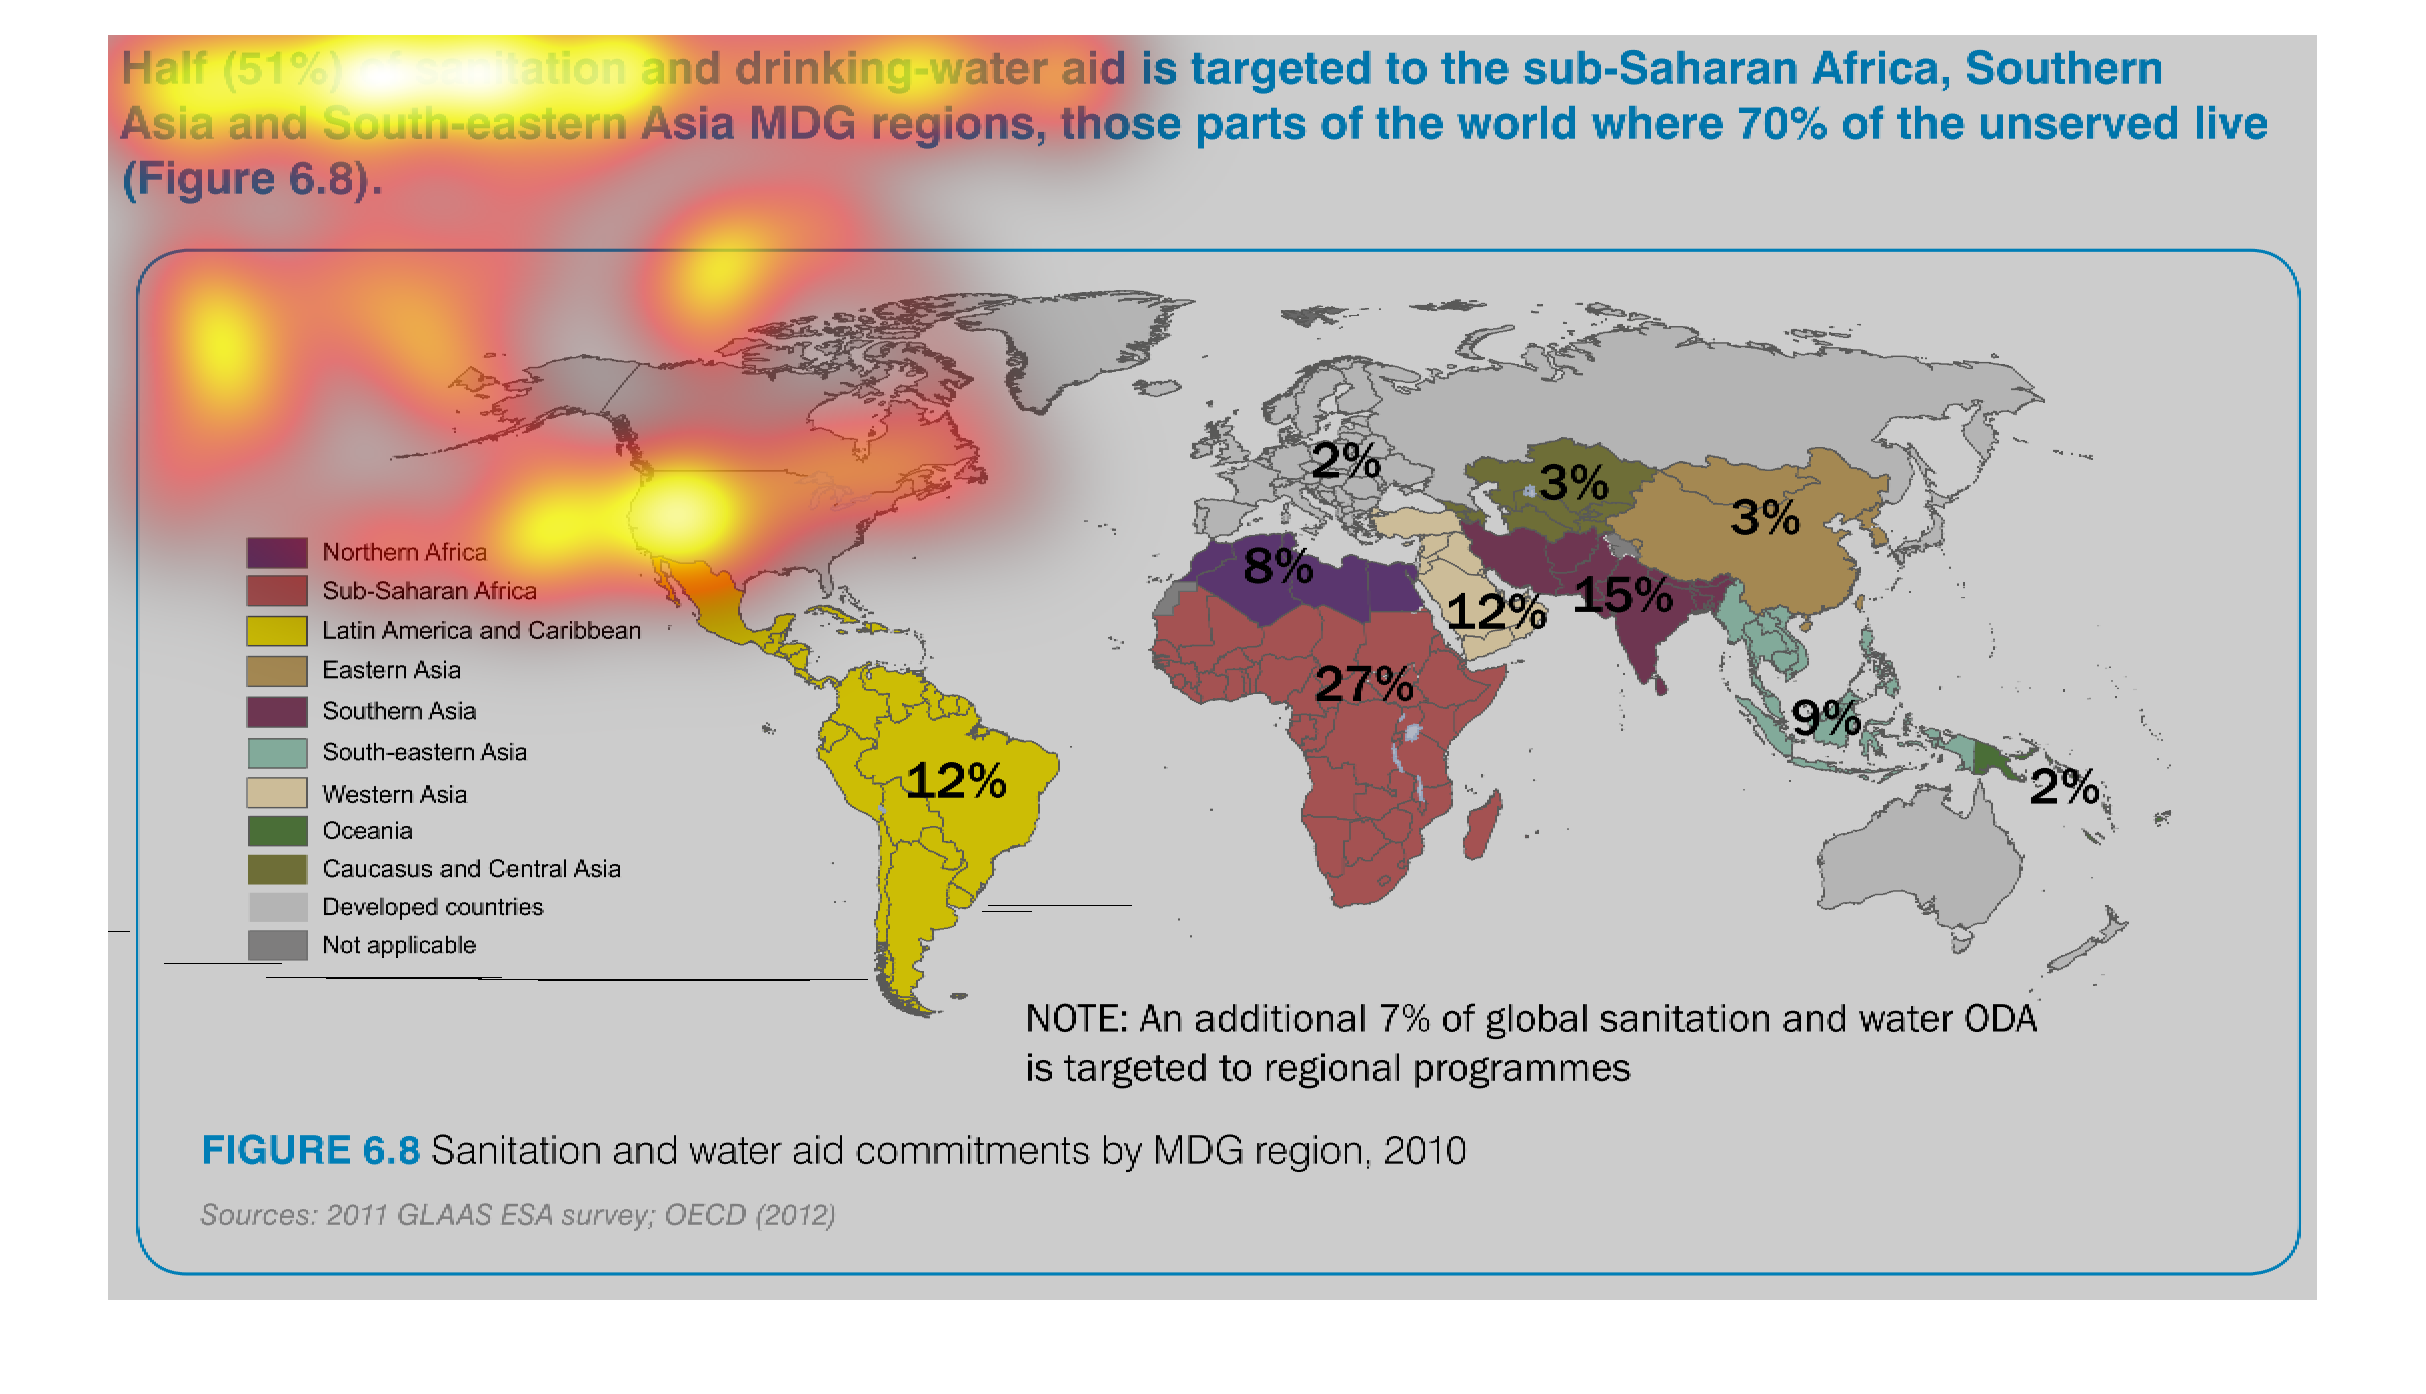
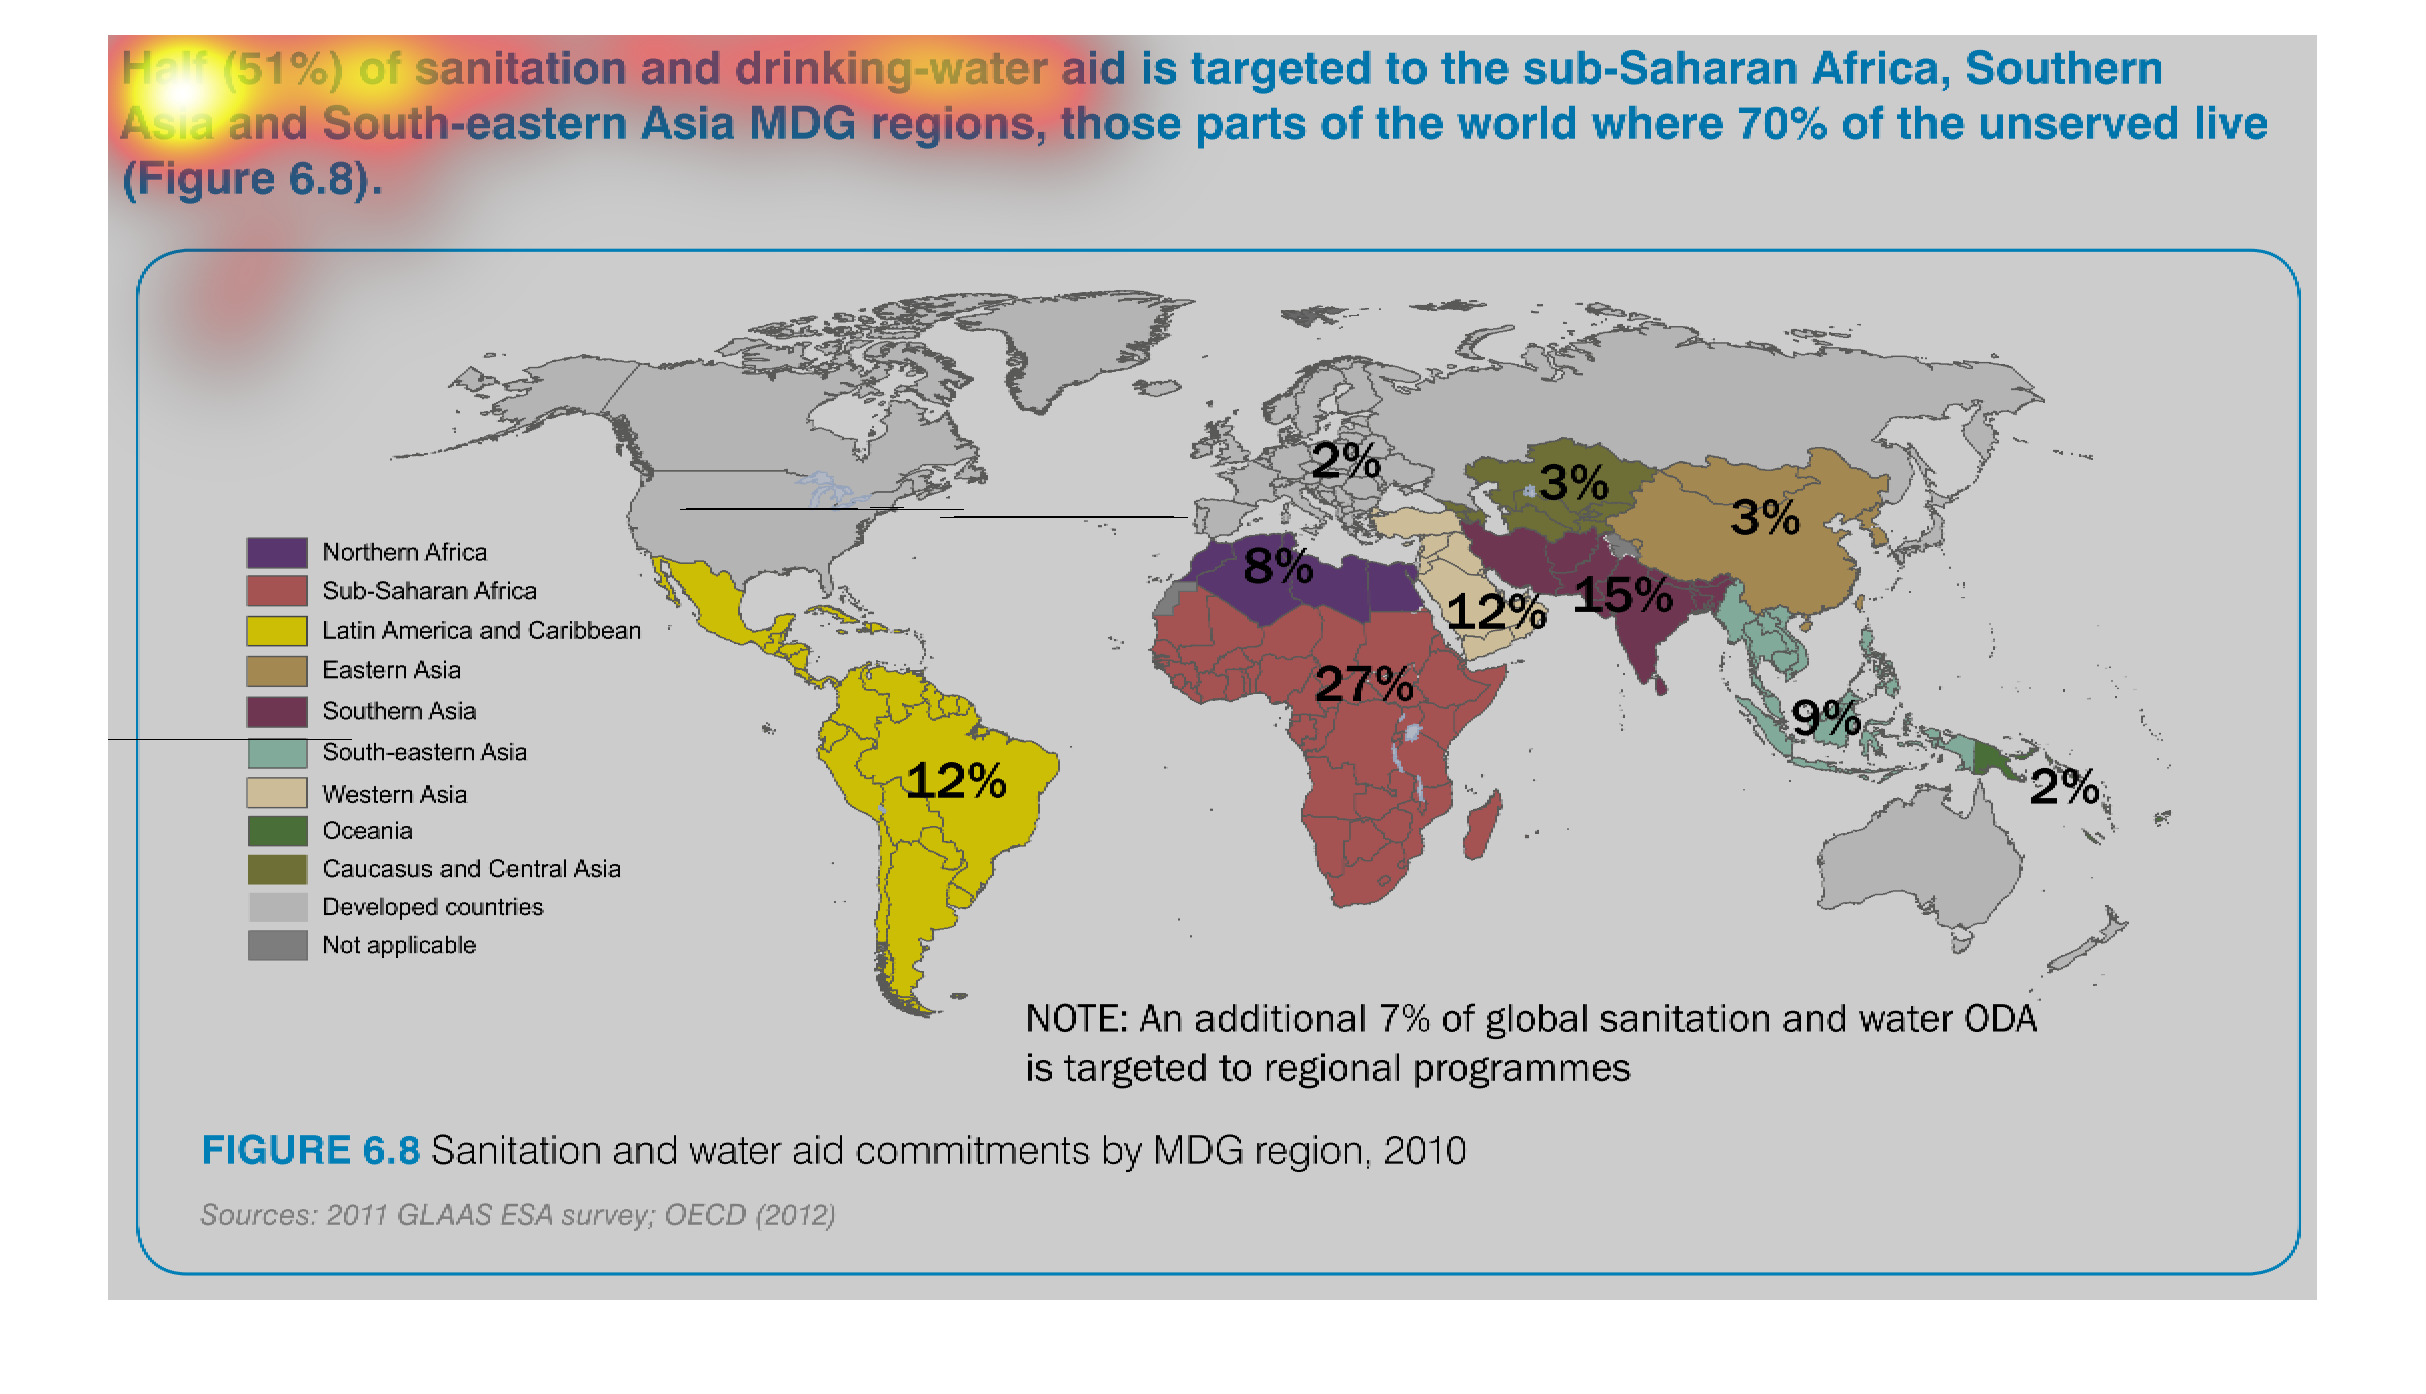
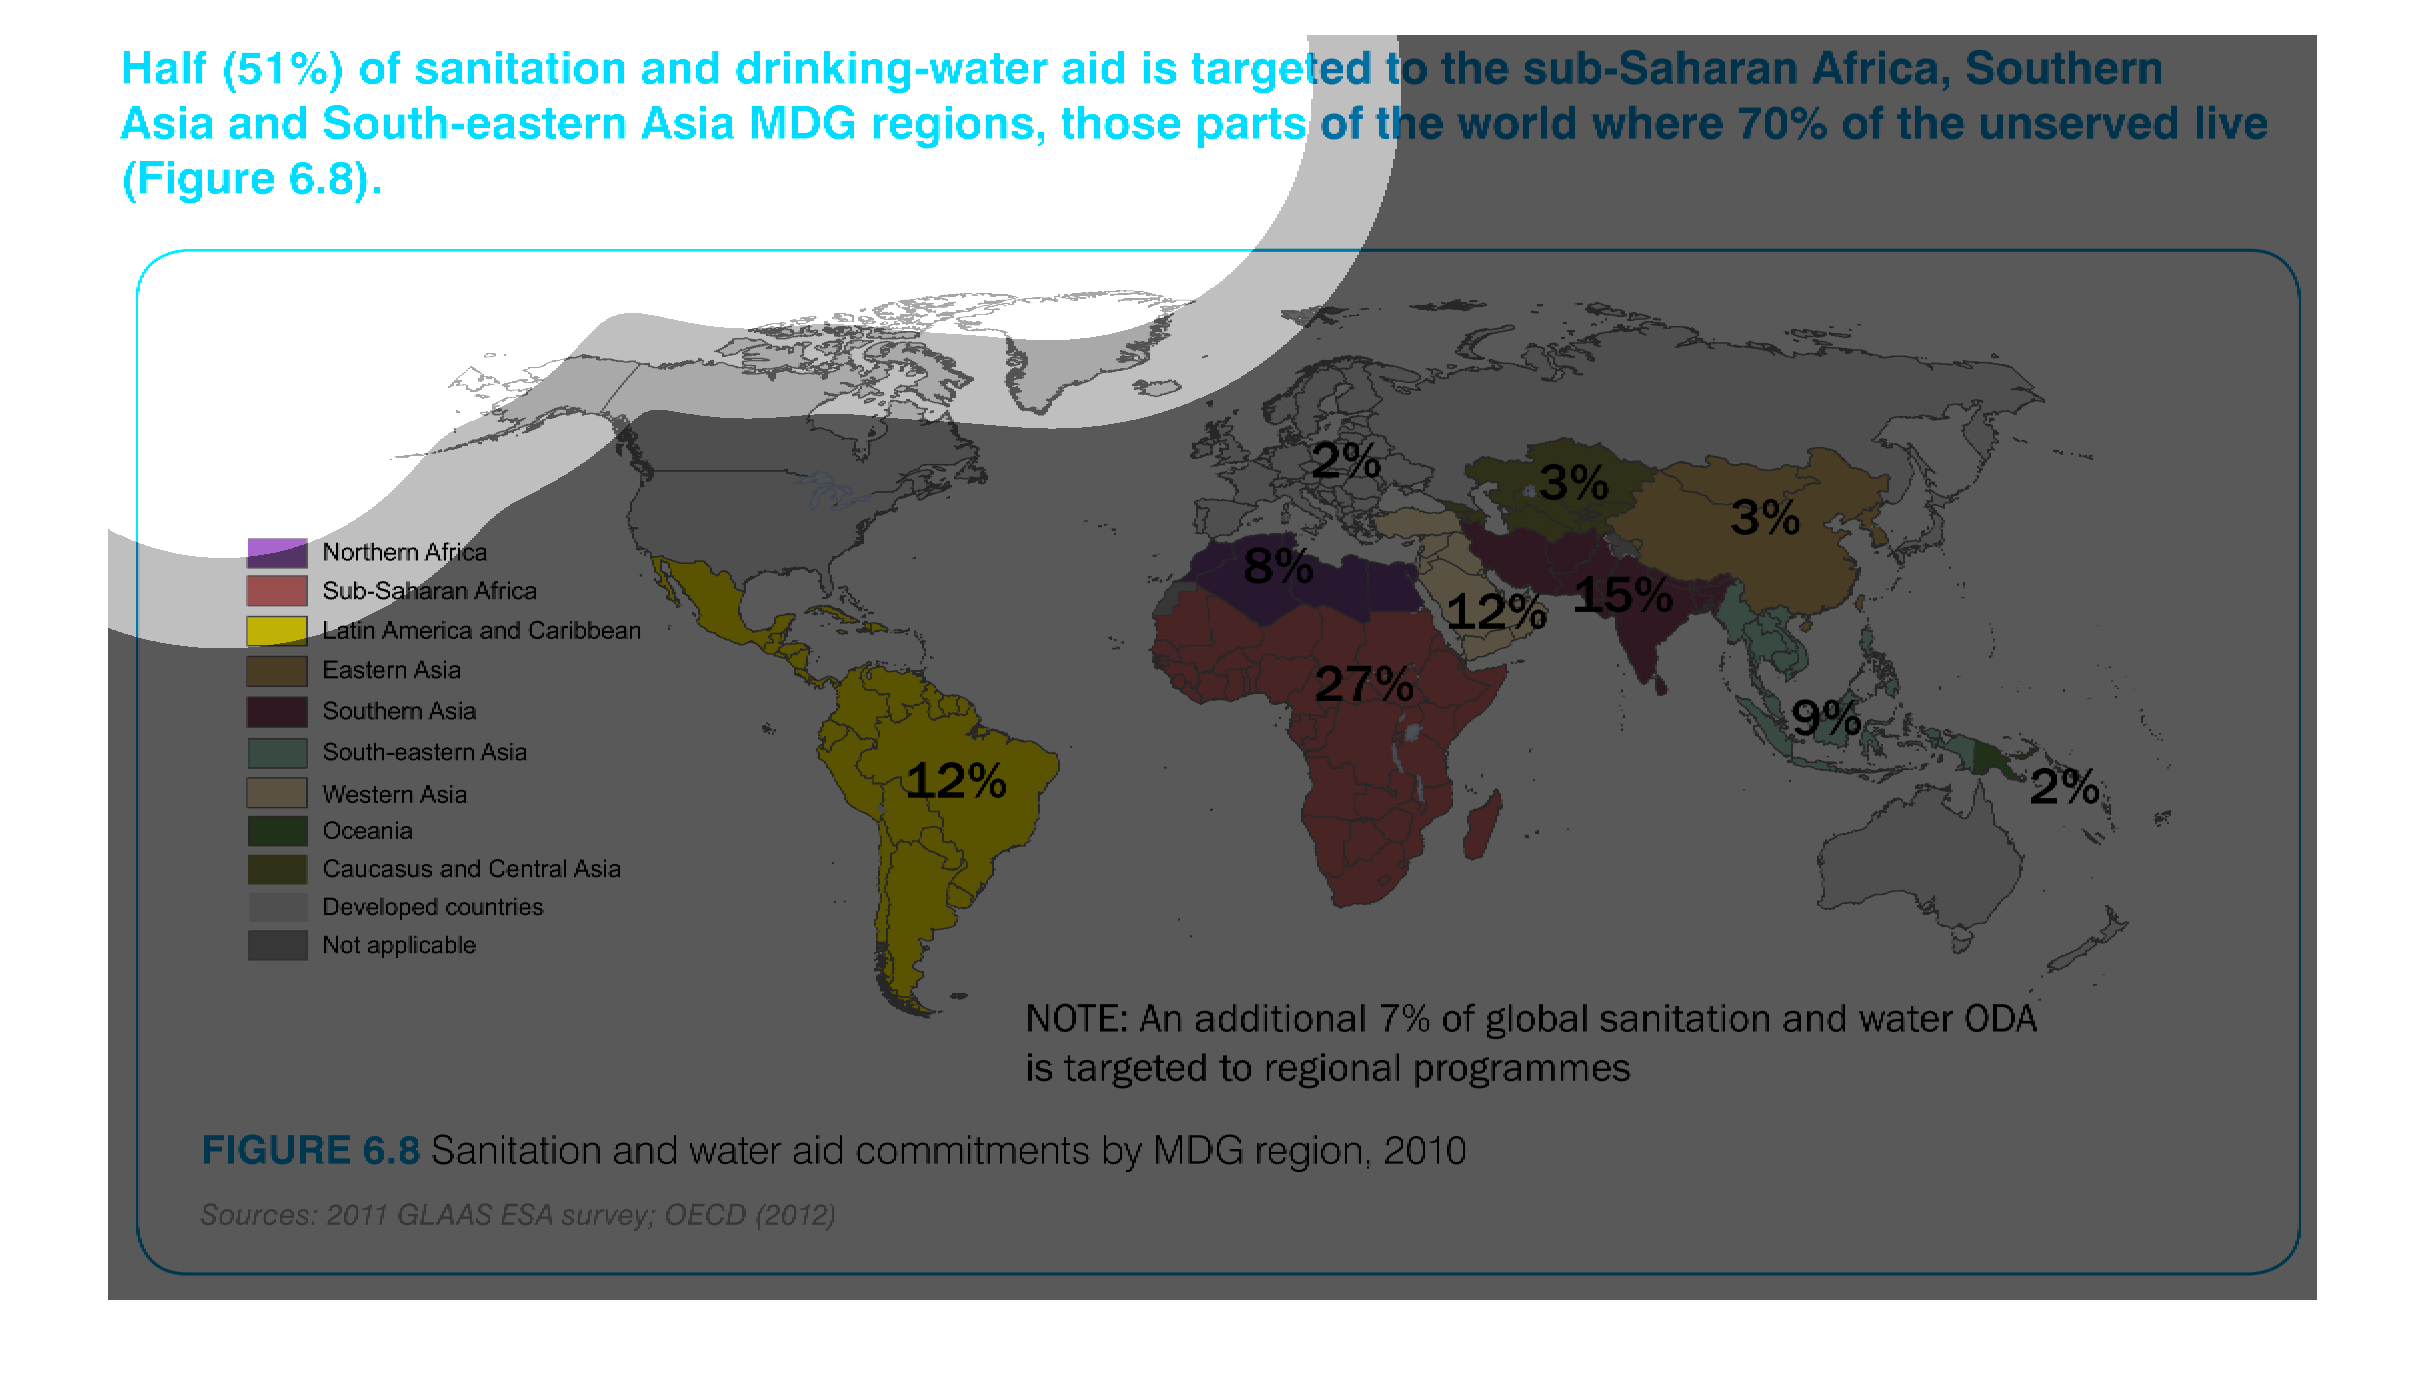
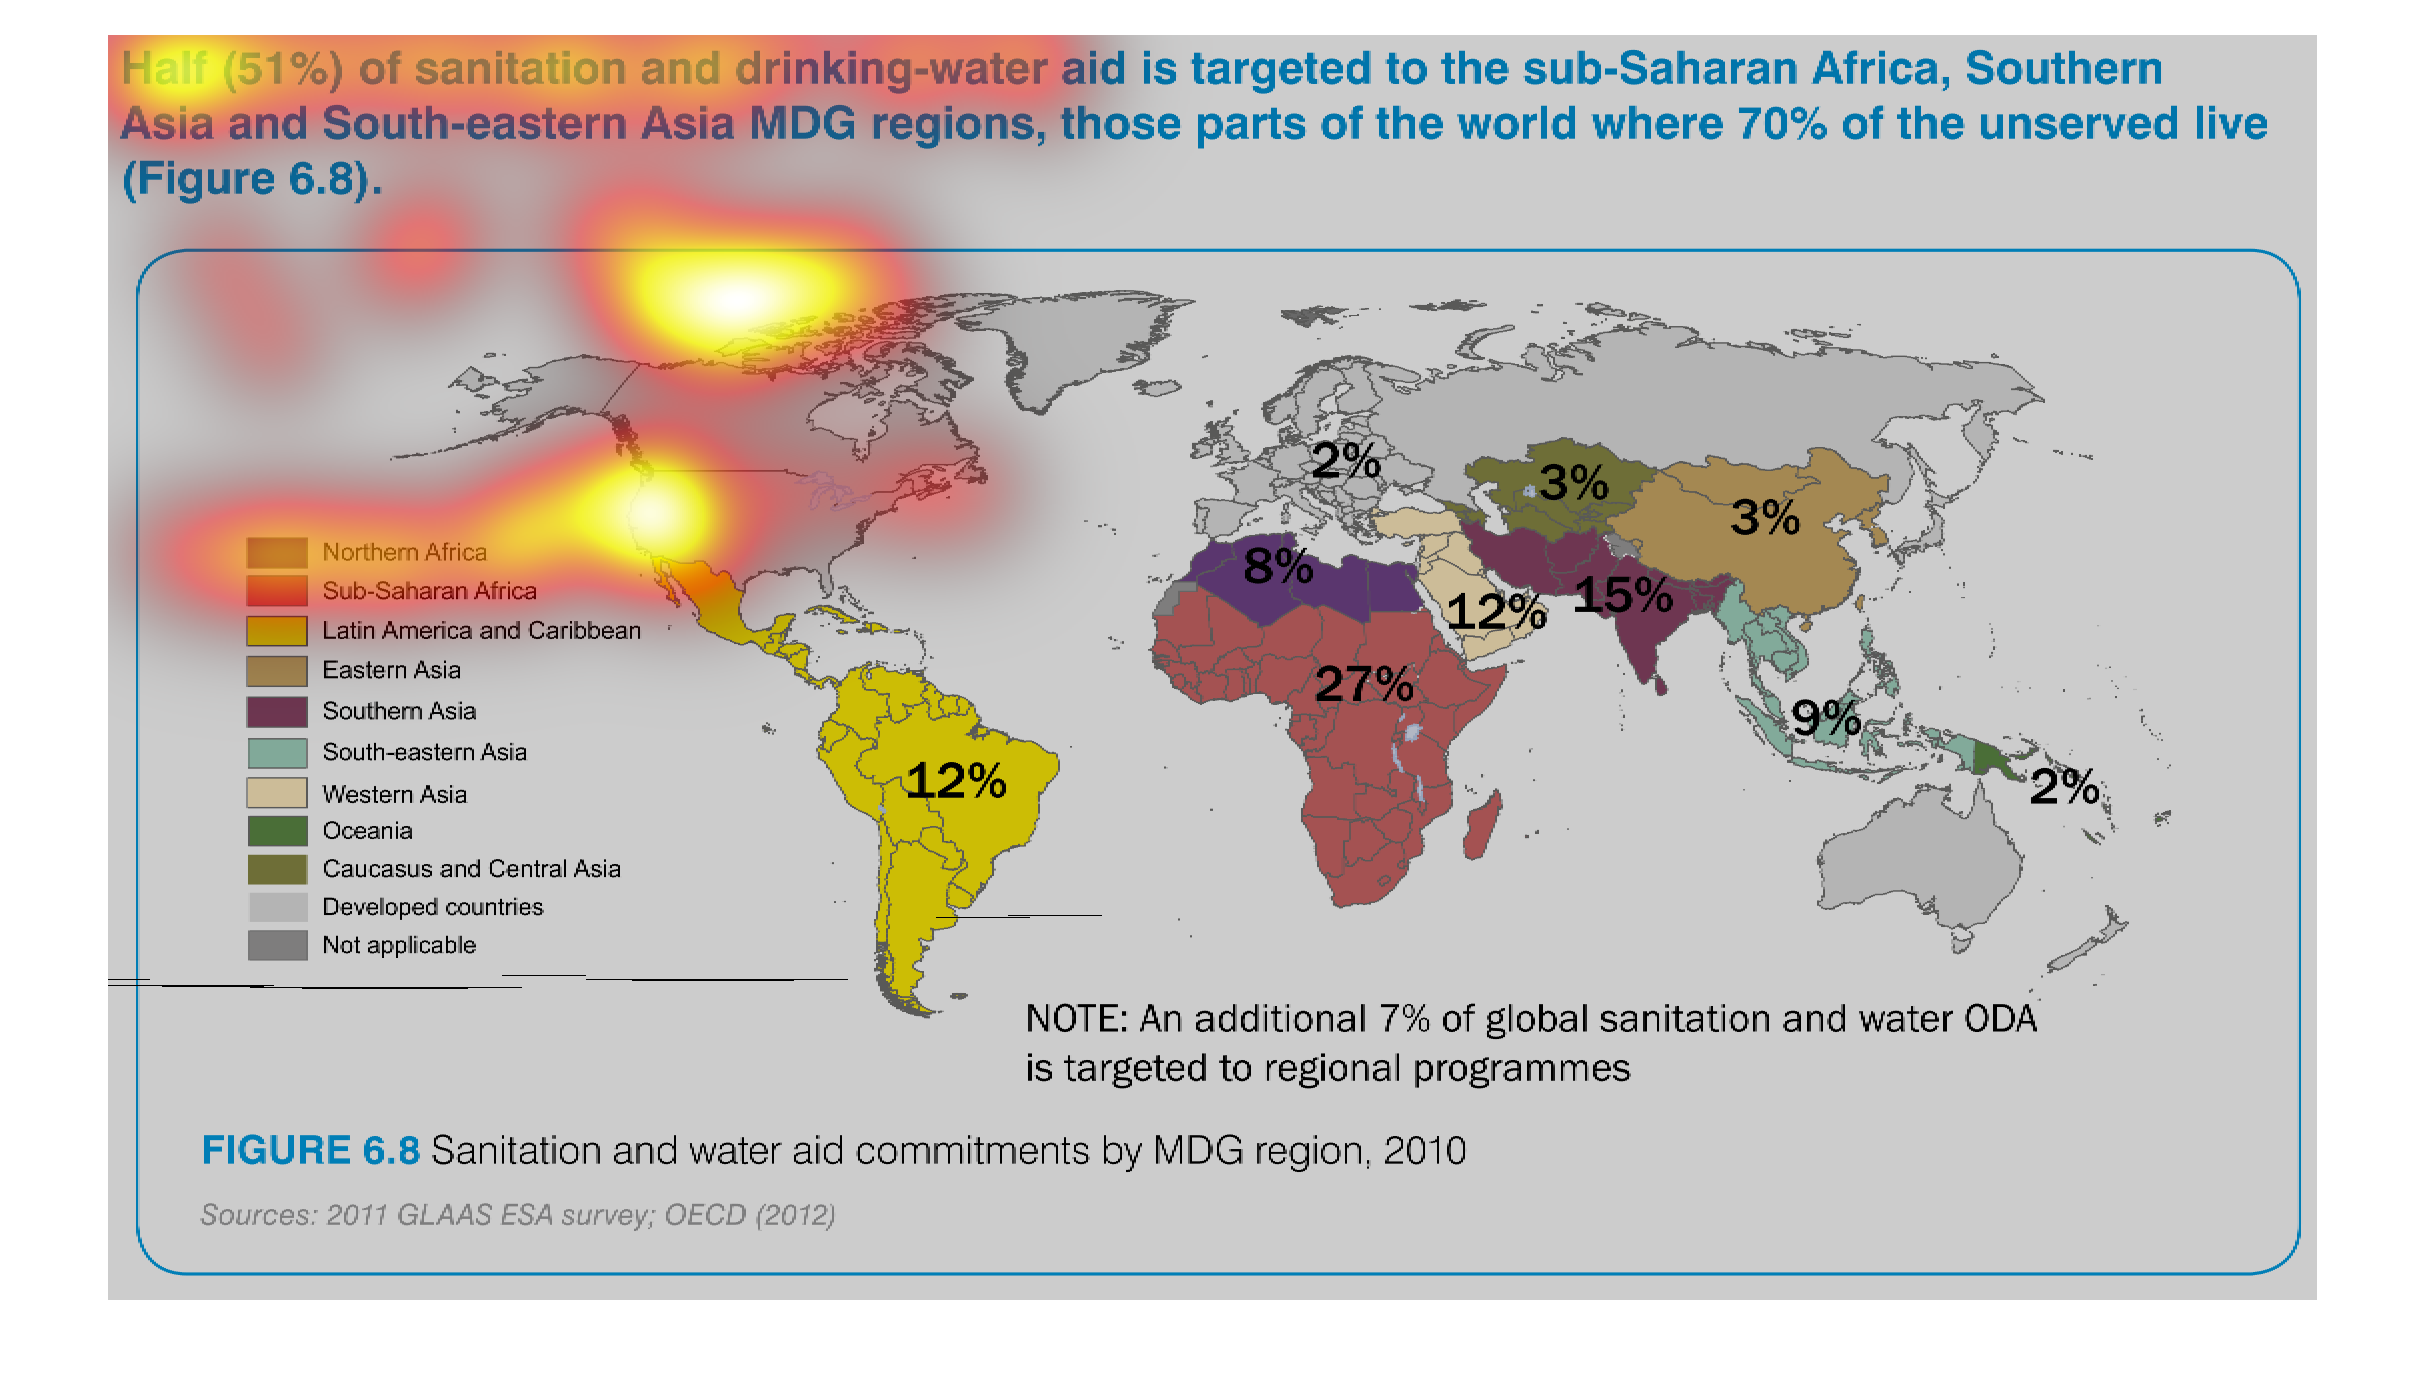
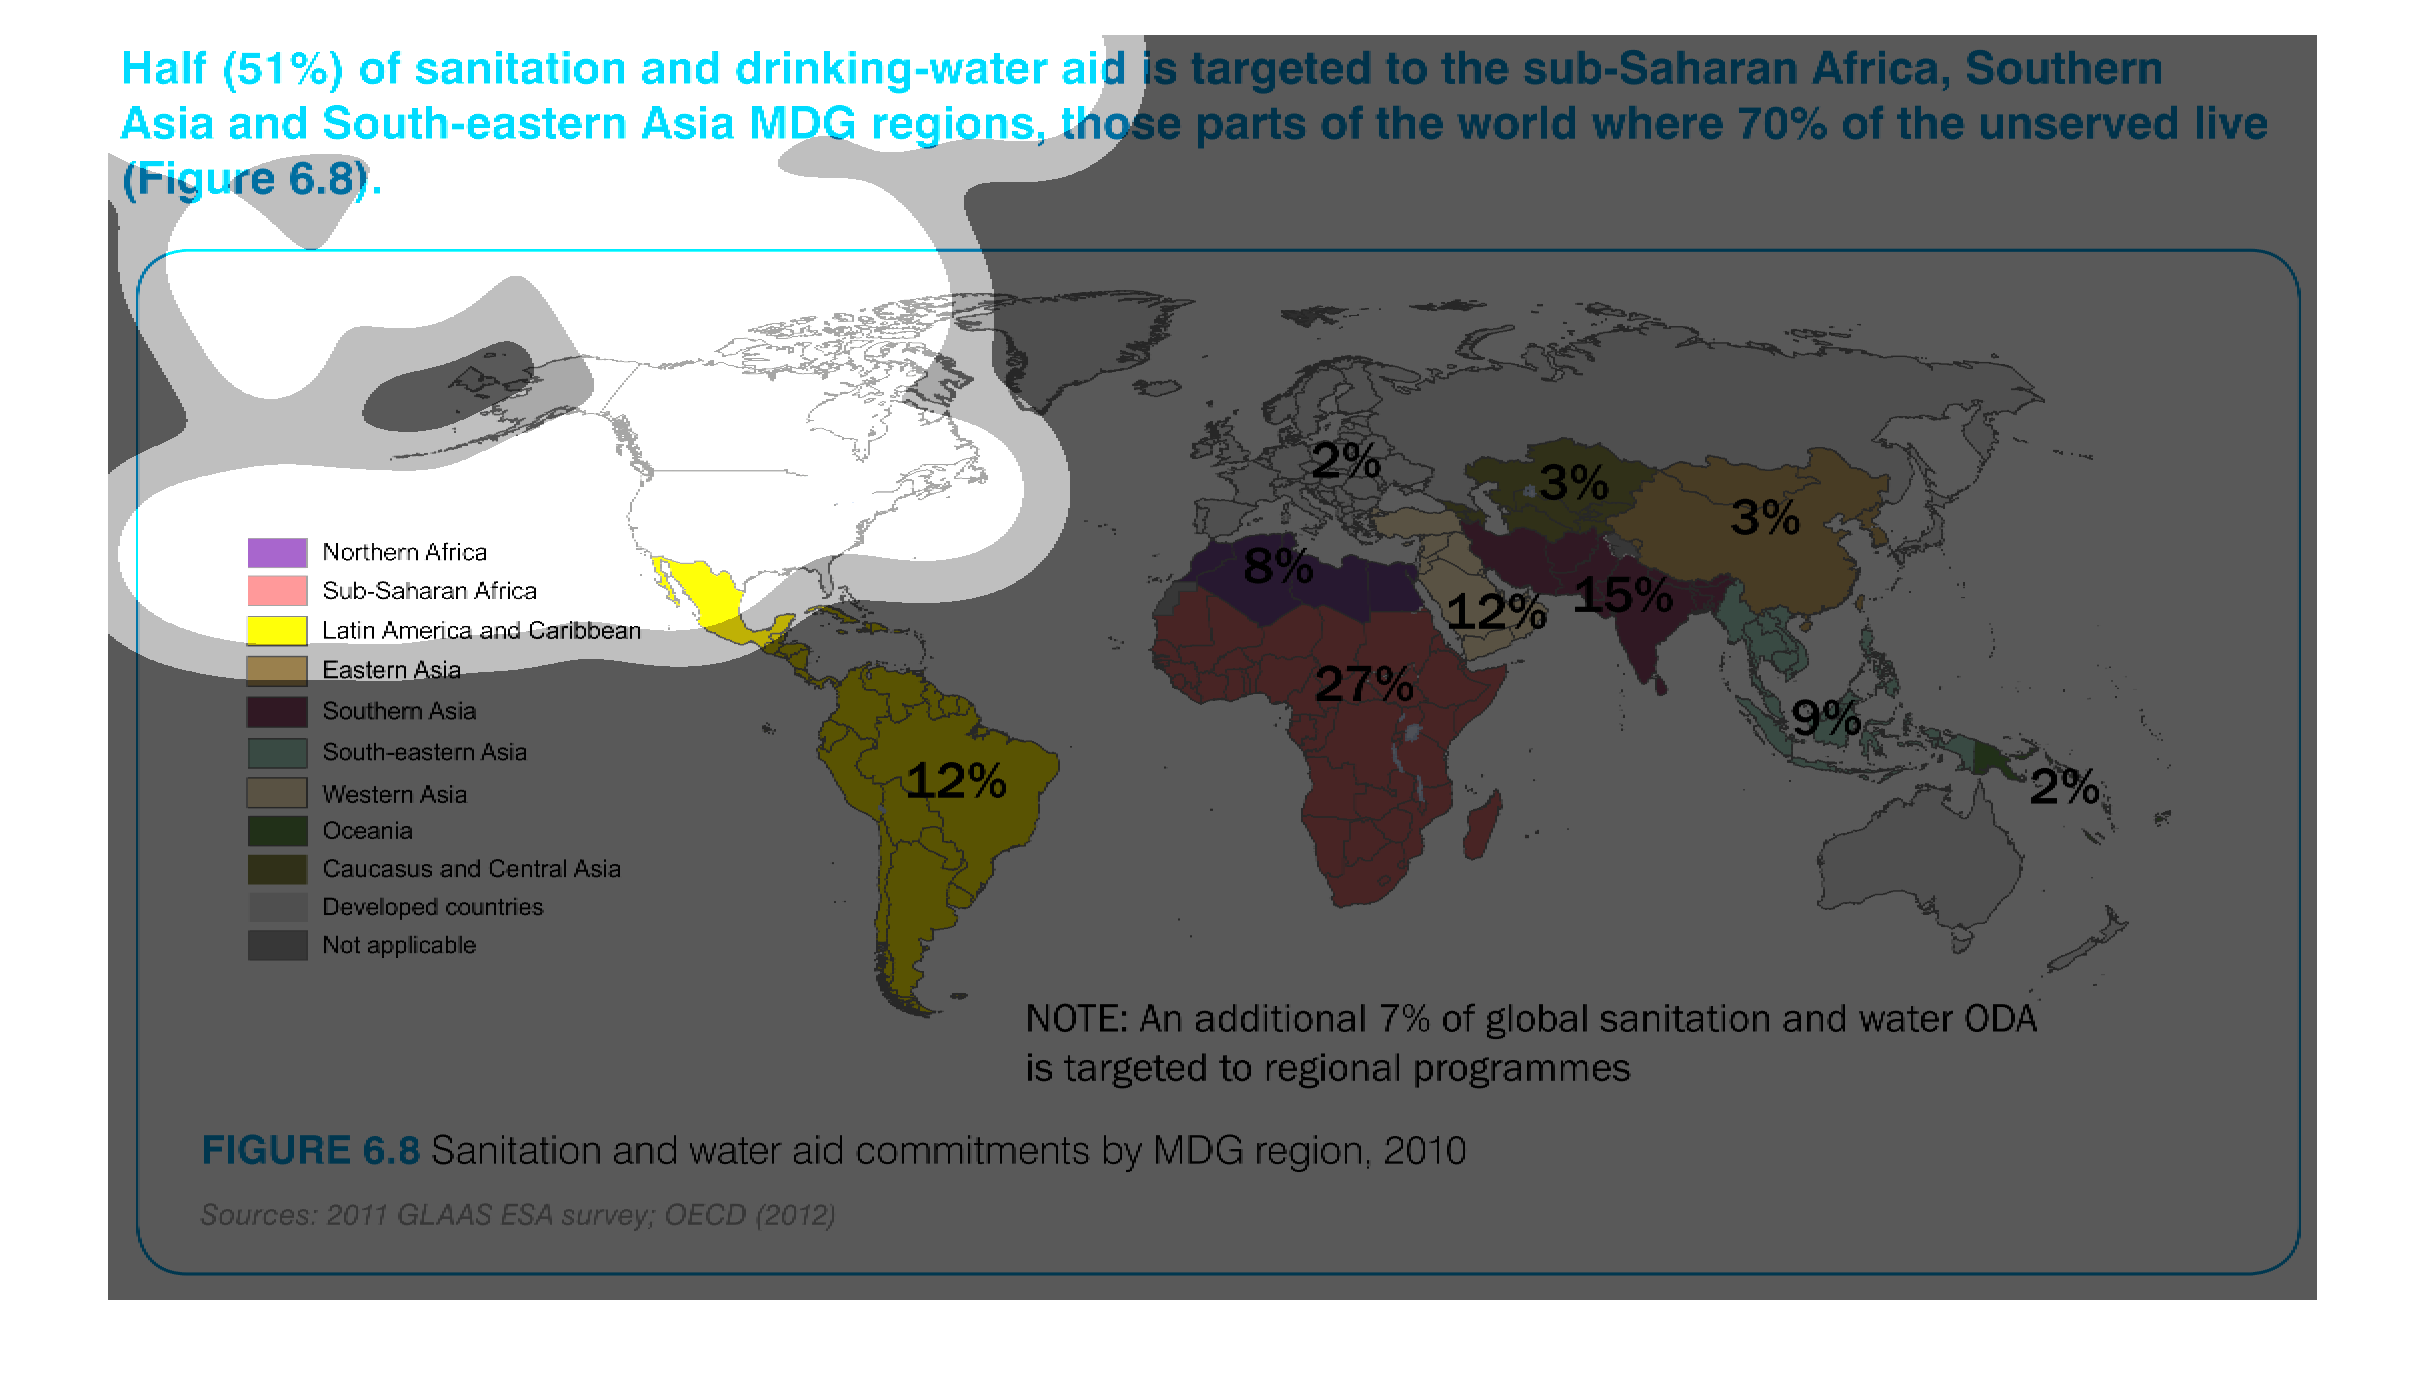
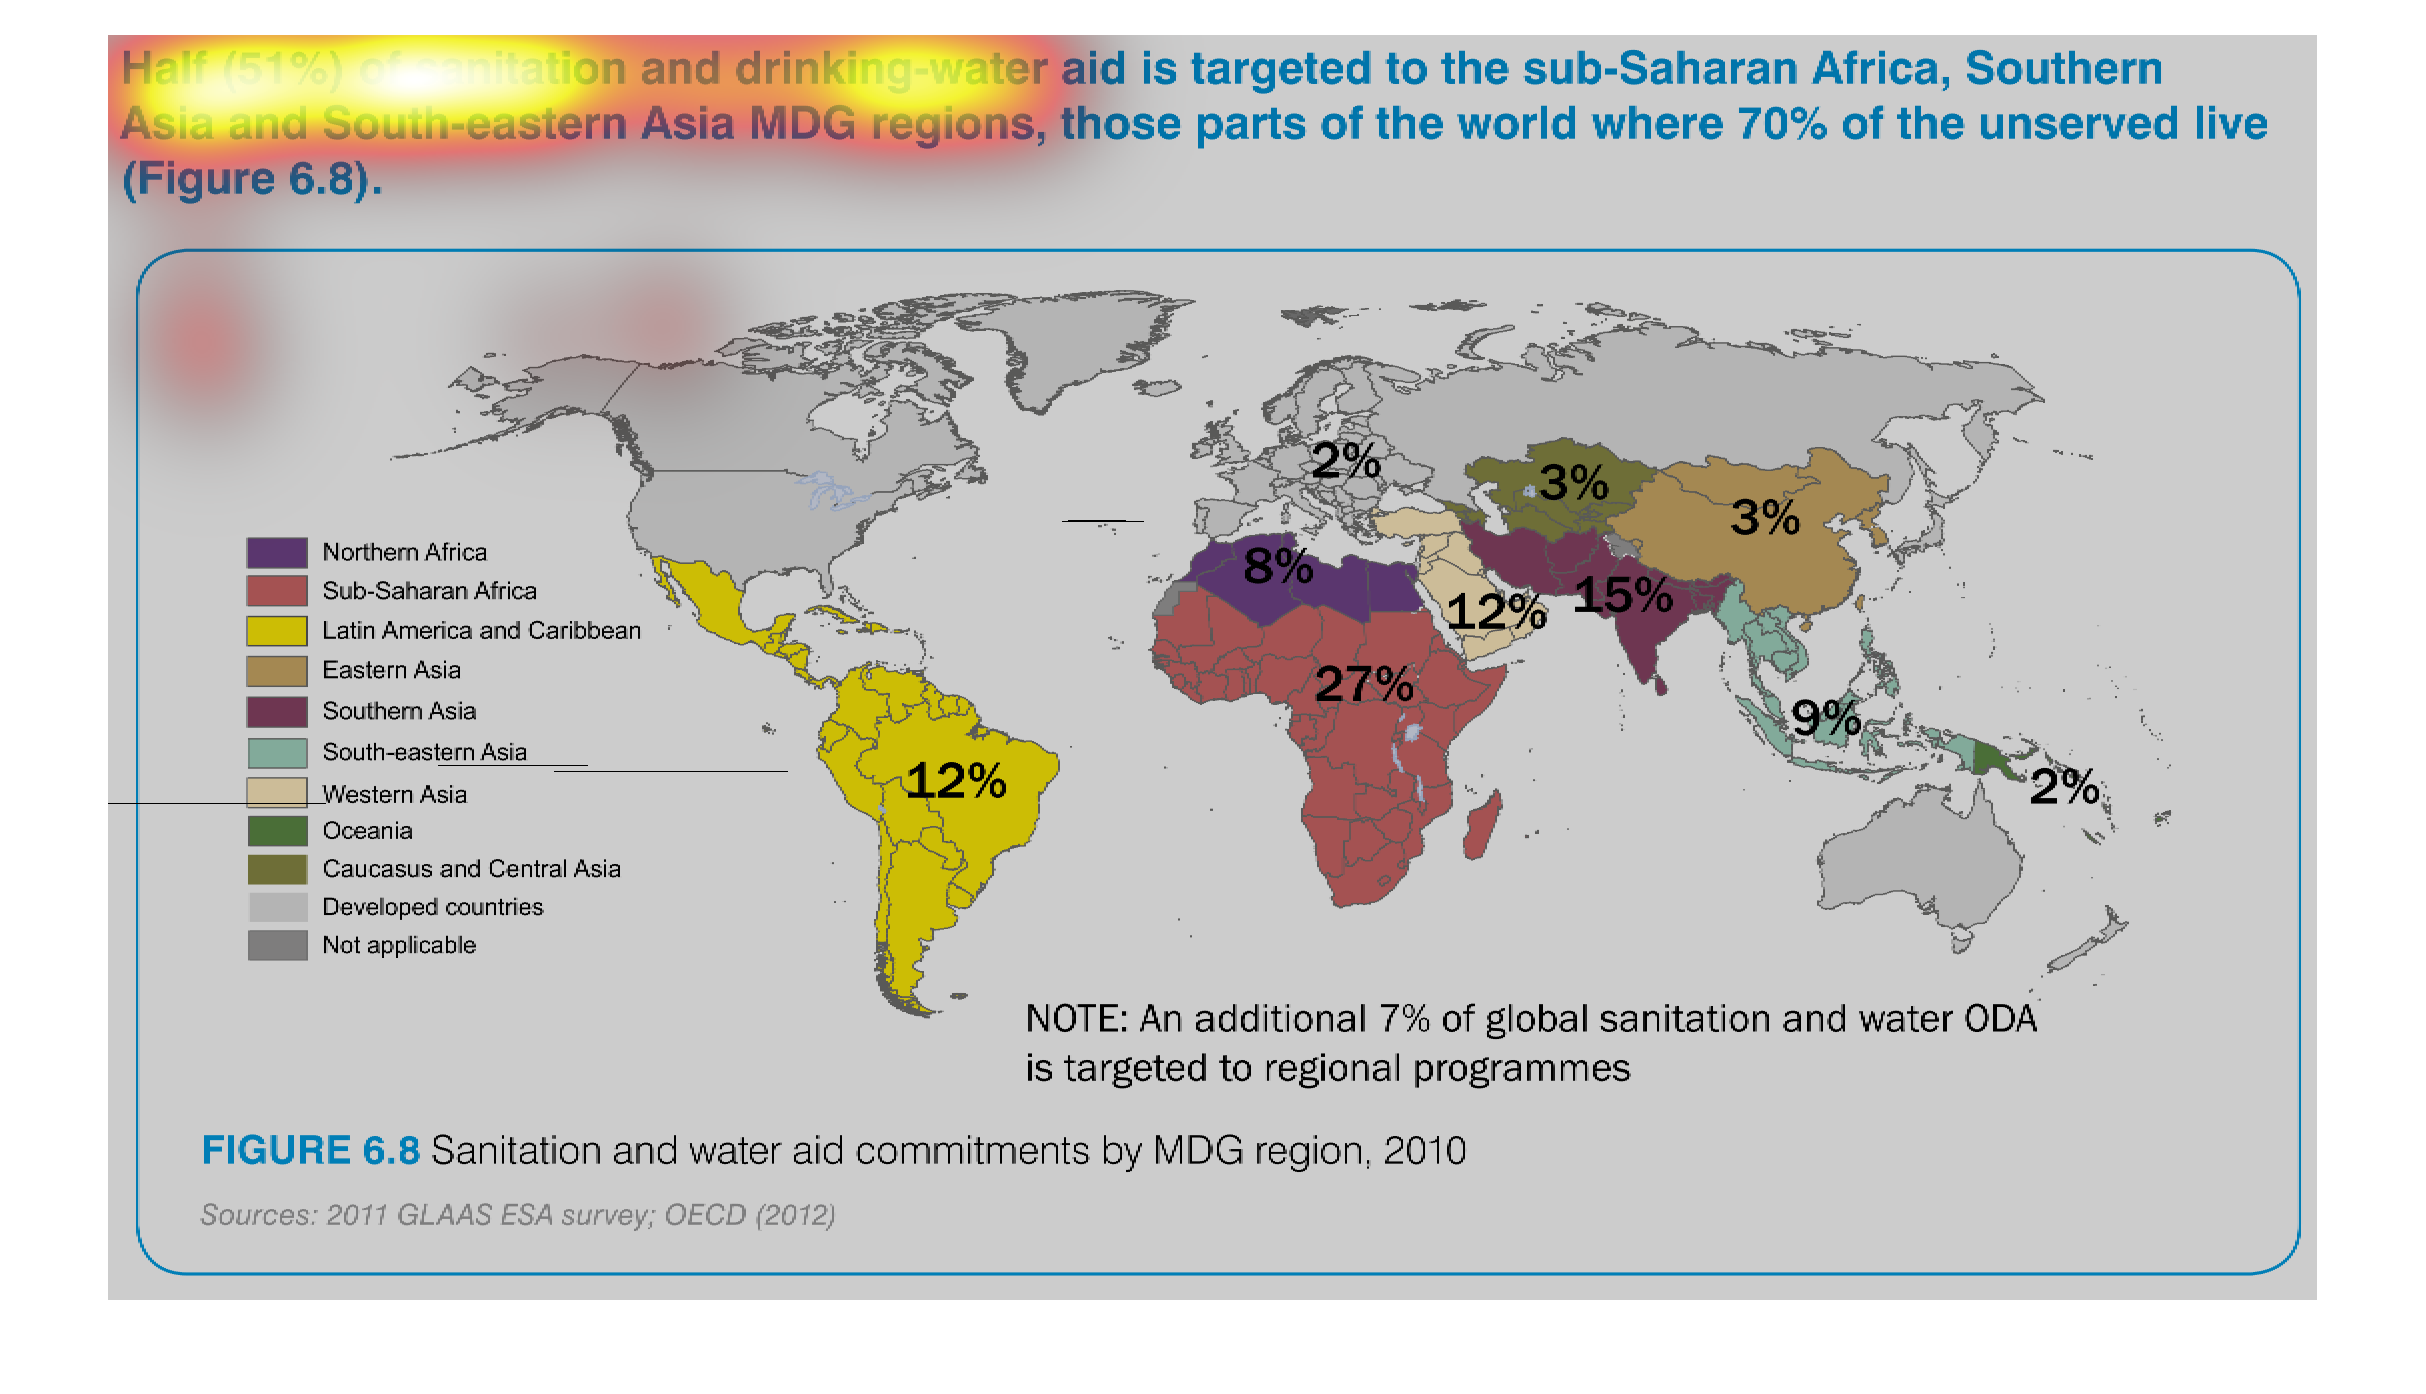
This chart describes that half of sanitation and drinking water aid is targeted to the sub-Saharan
Africa, and Southern Asia and South-eastern Asia MDG regions.
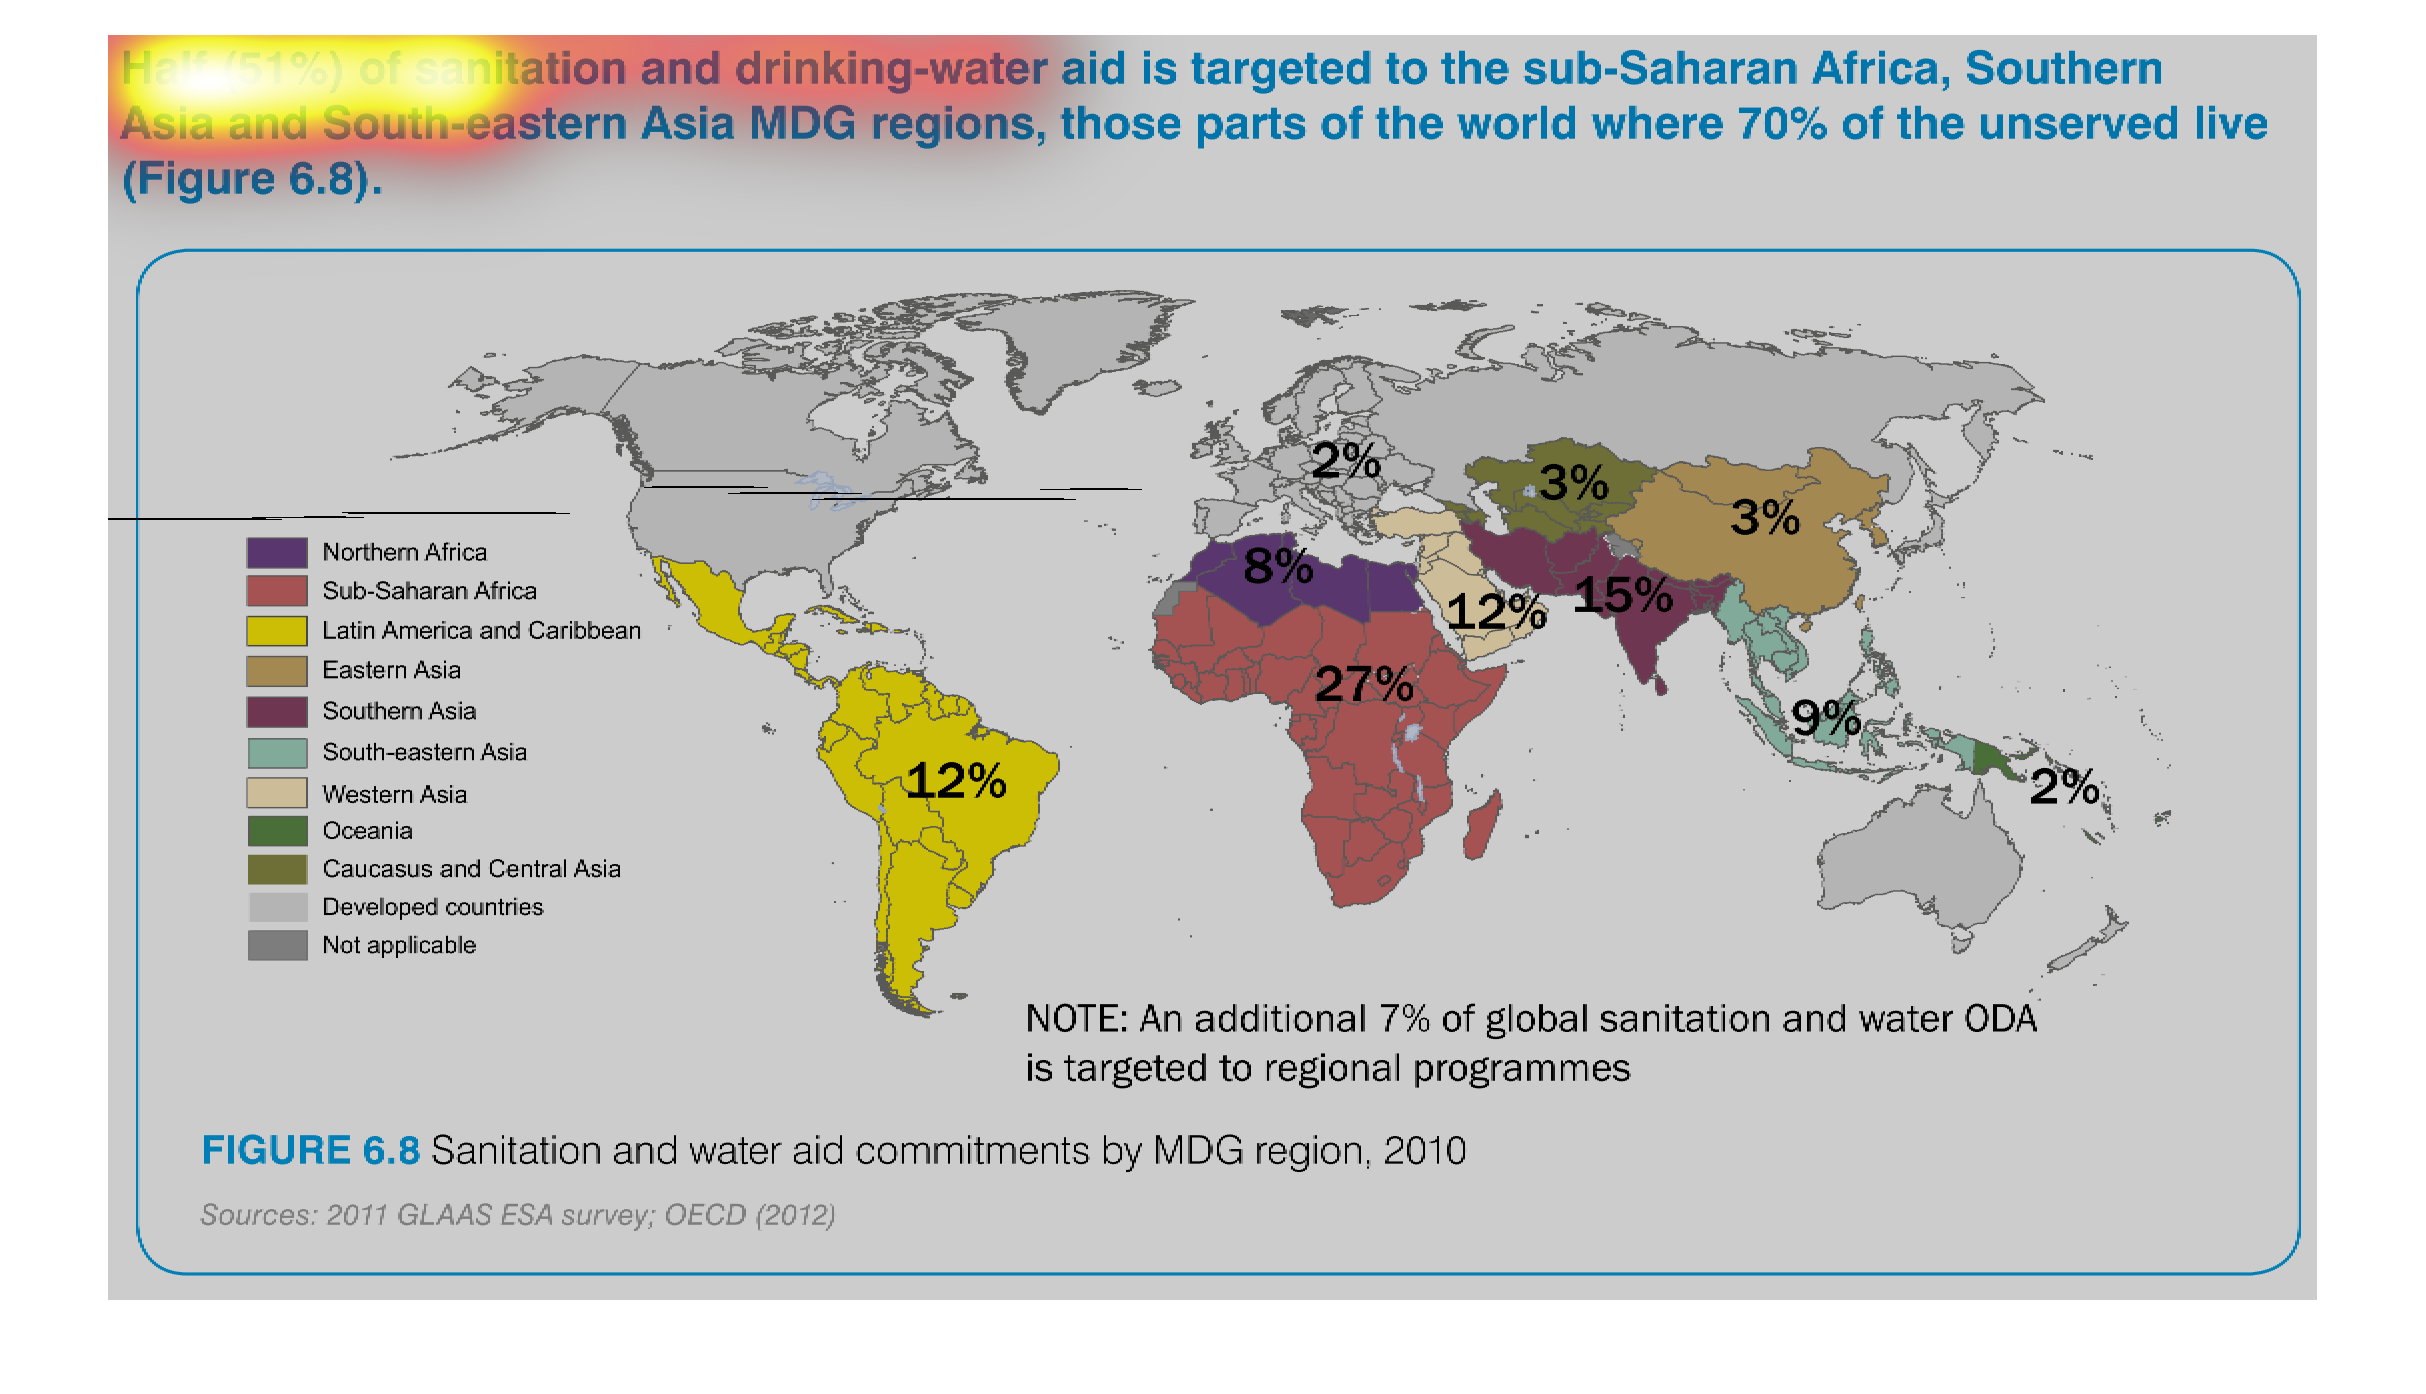
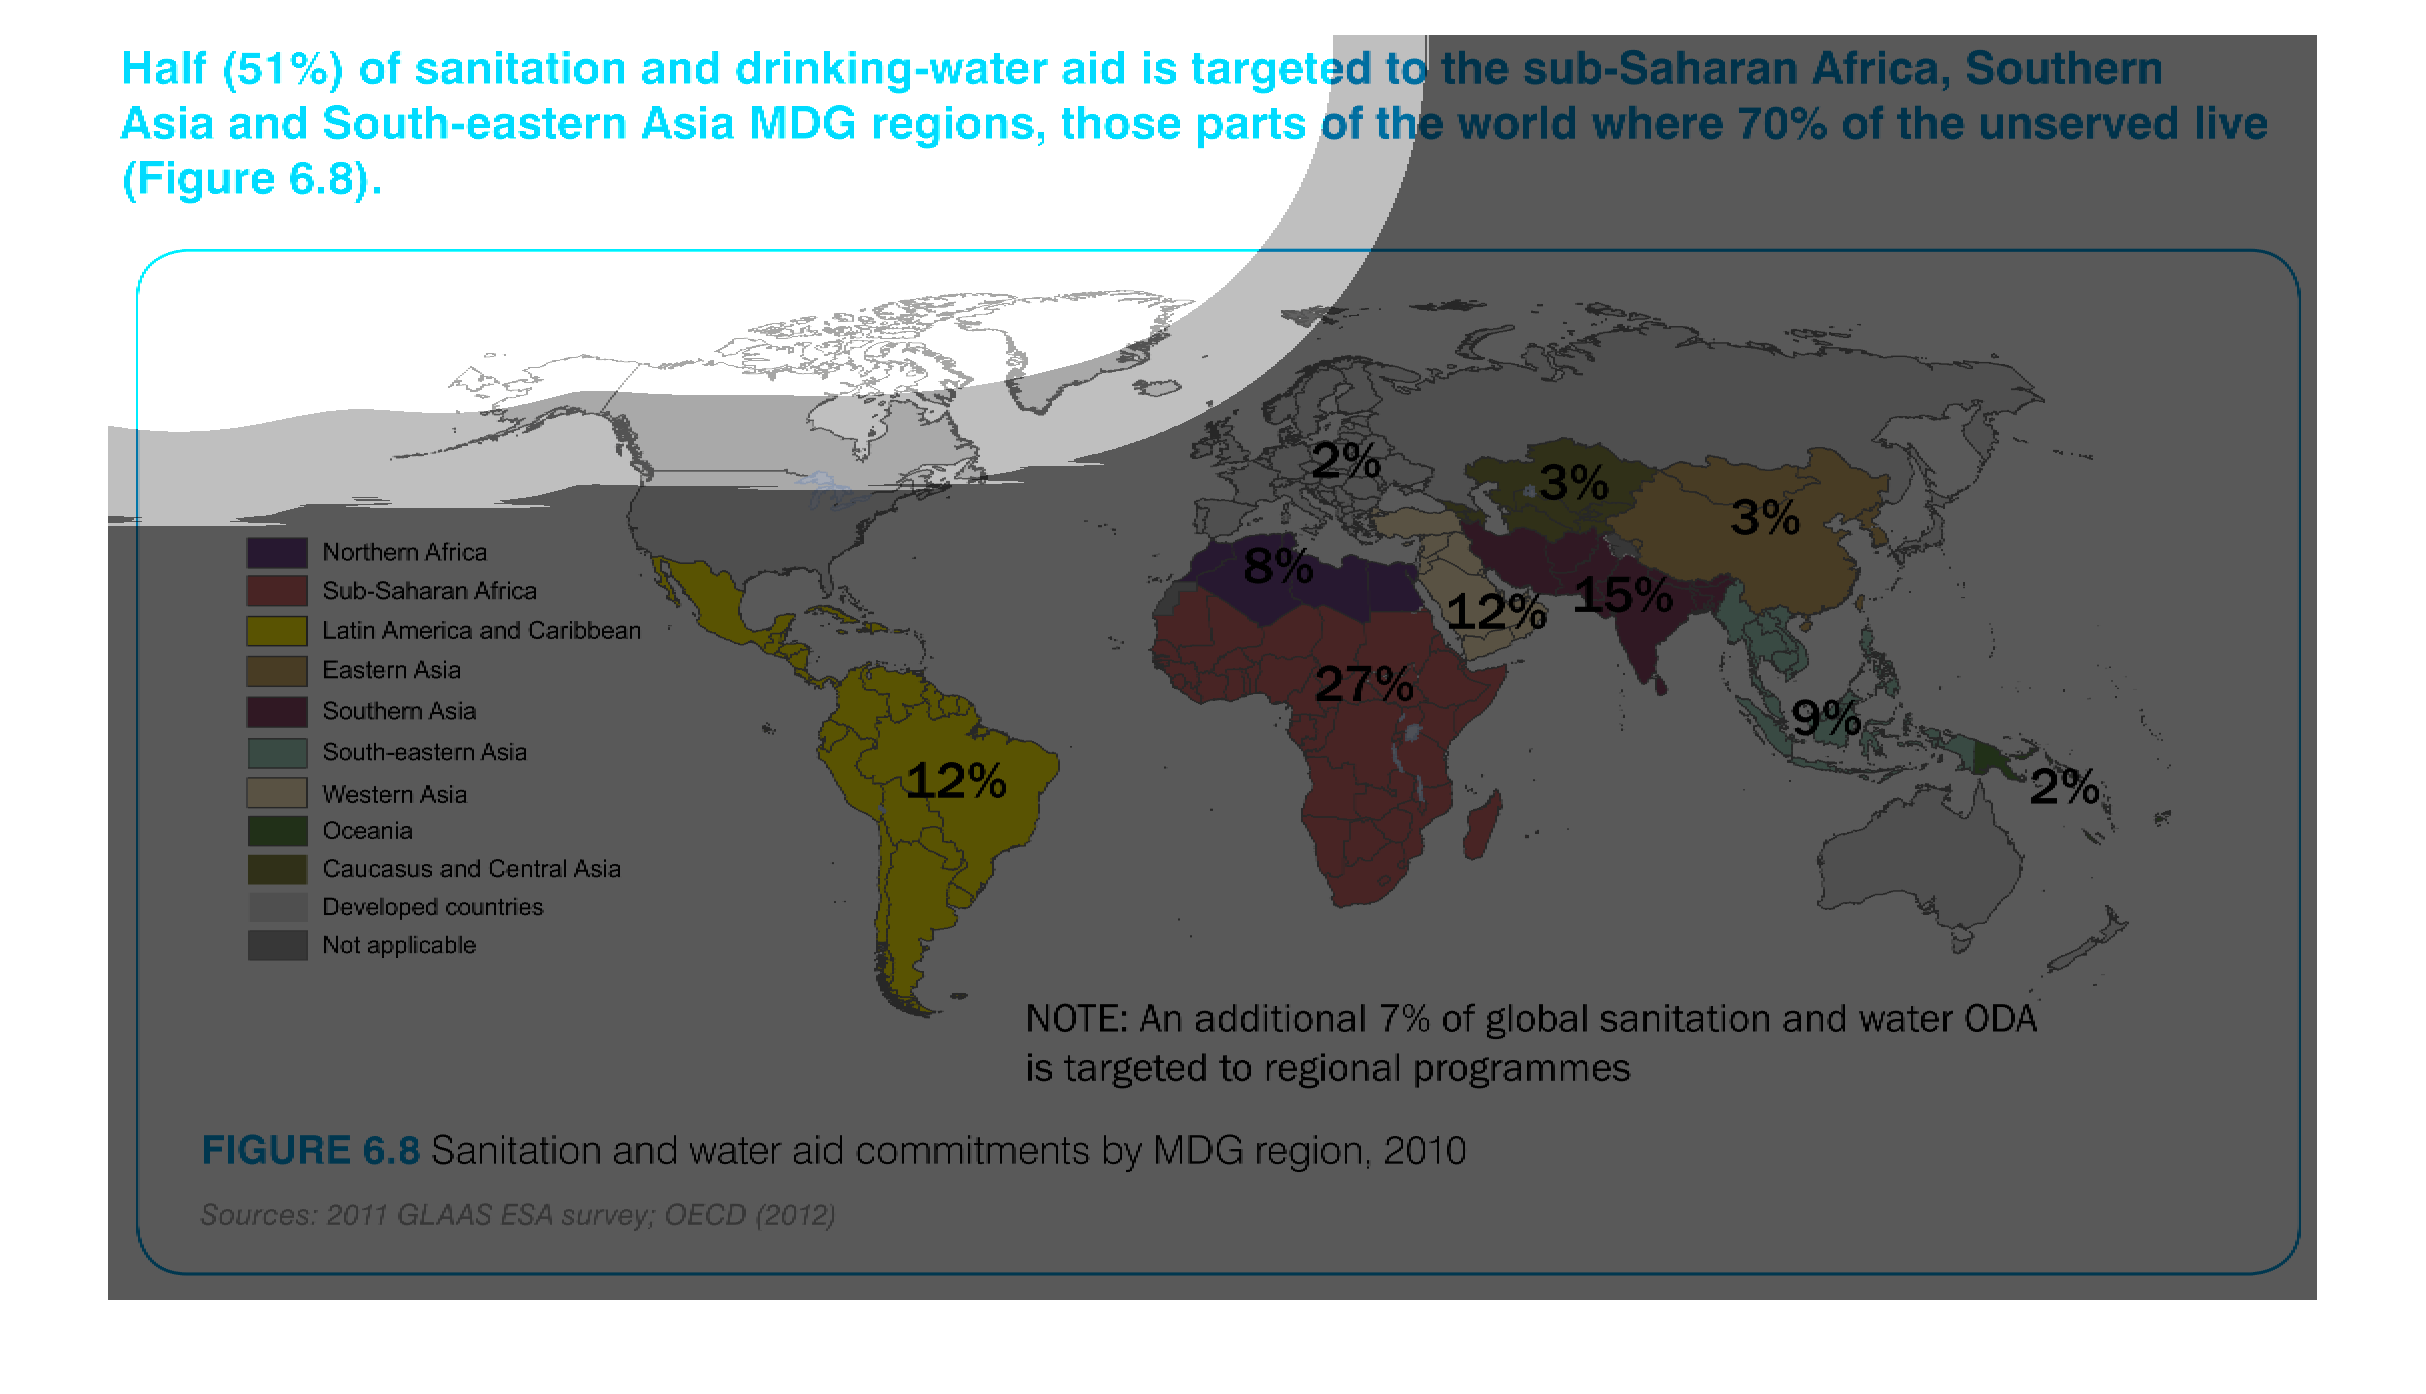
This is a map of the world that shows the sanitation and contamination by MDG reported by
region in 2010. The numbers are mostly low but rise to 12% in South America and 27% in Africa.
This chart describes half, 51%, sanitation and drinking-water aid is targeted to the sub-Saharan
Africa, Southern Asia and South Eastern Asia MDG region.
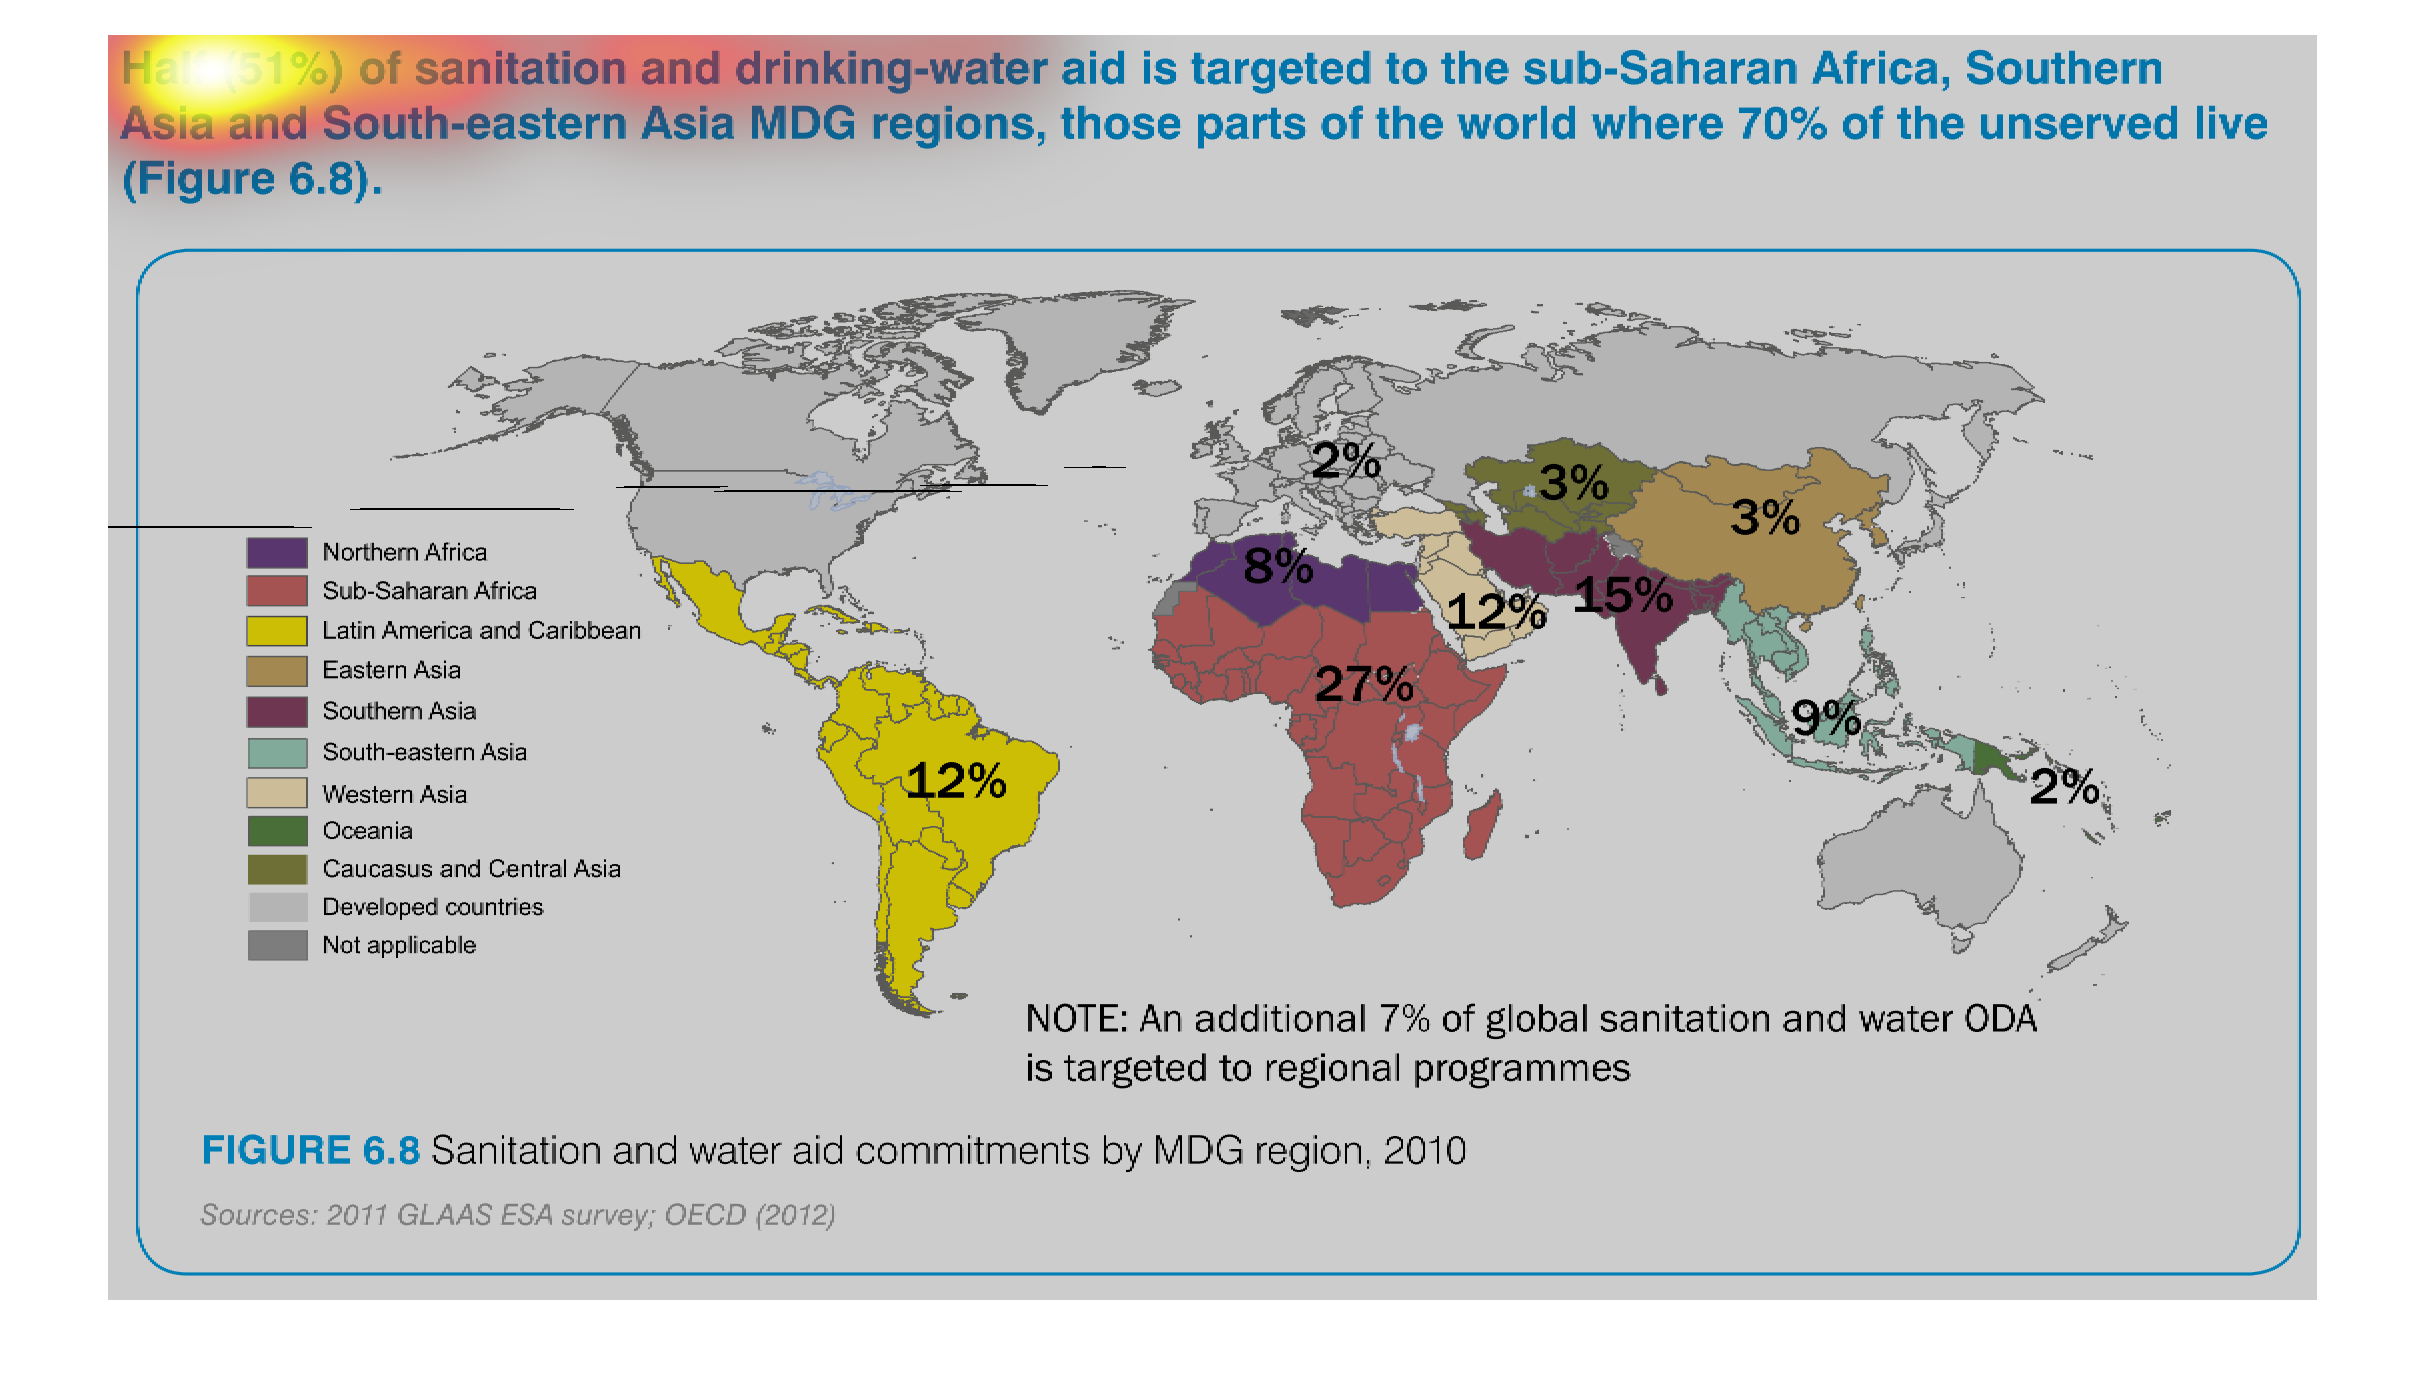
The pictorial shows that 51% of the sanitation and drinking water aid is targeted to the sub-Saharan
Africa, Southern Asia and Southeast Asia MDG regions.  70% of the unserved population live
in these areas.   This data is from 2010.
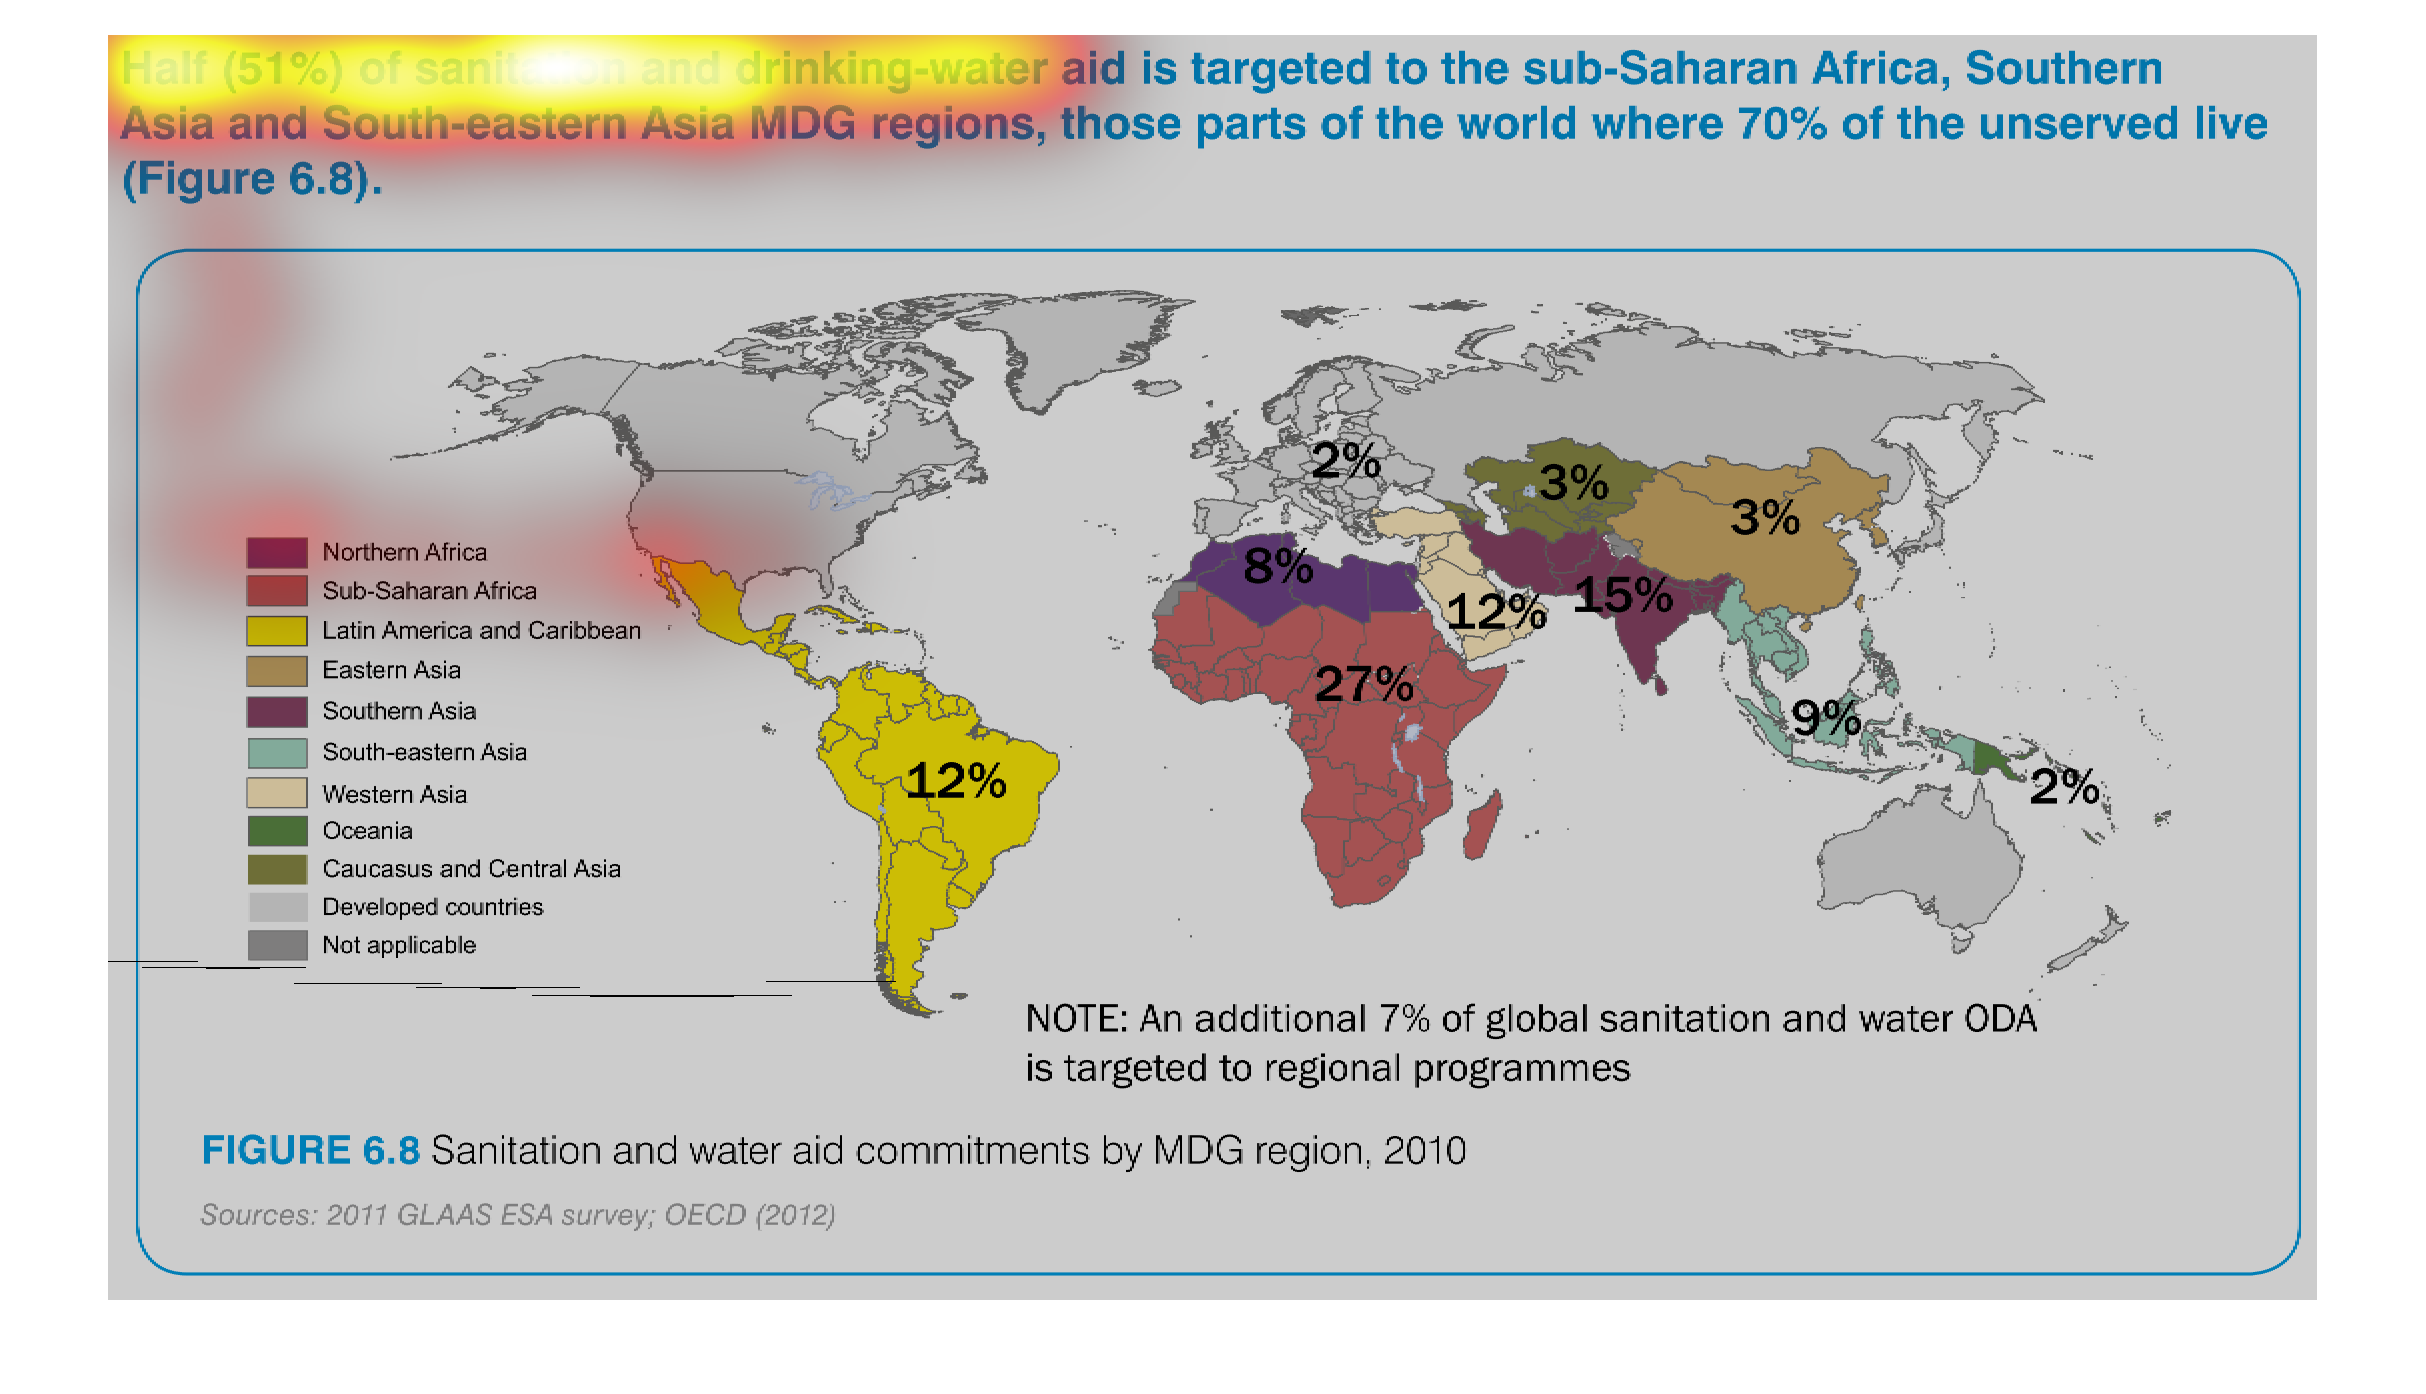
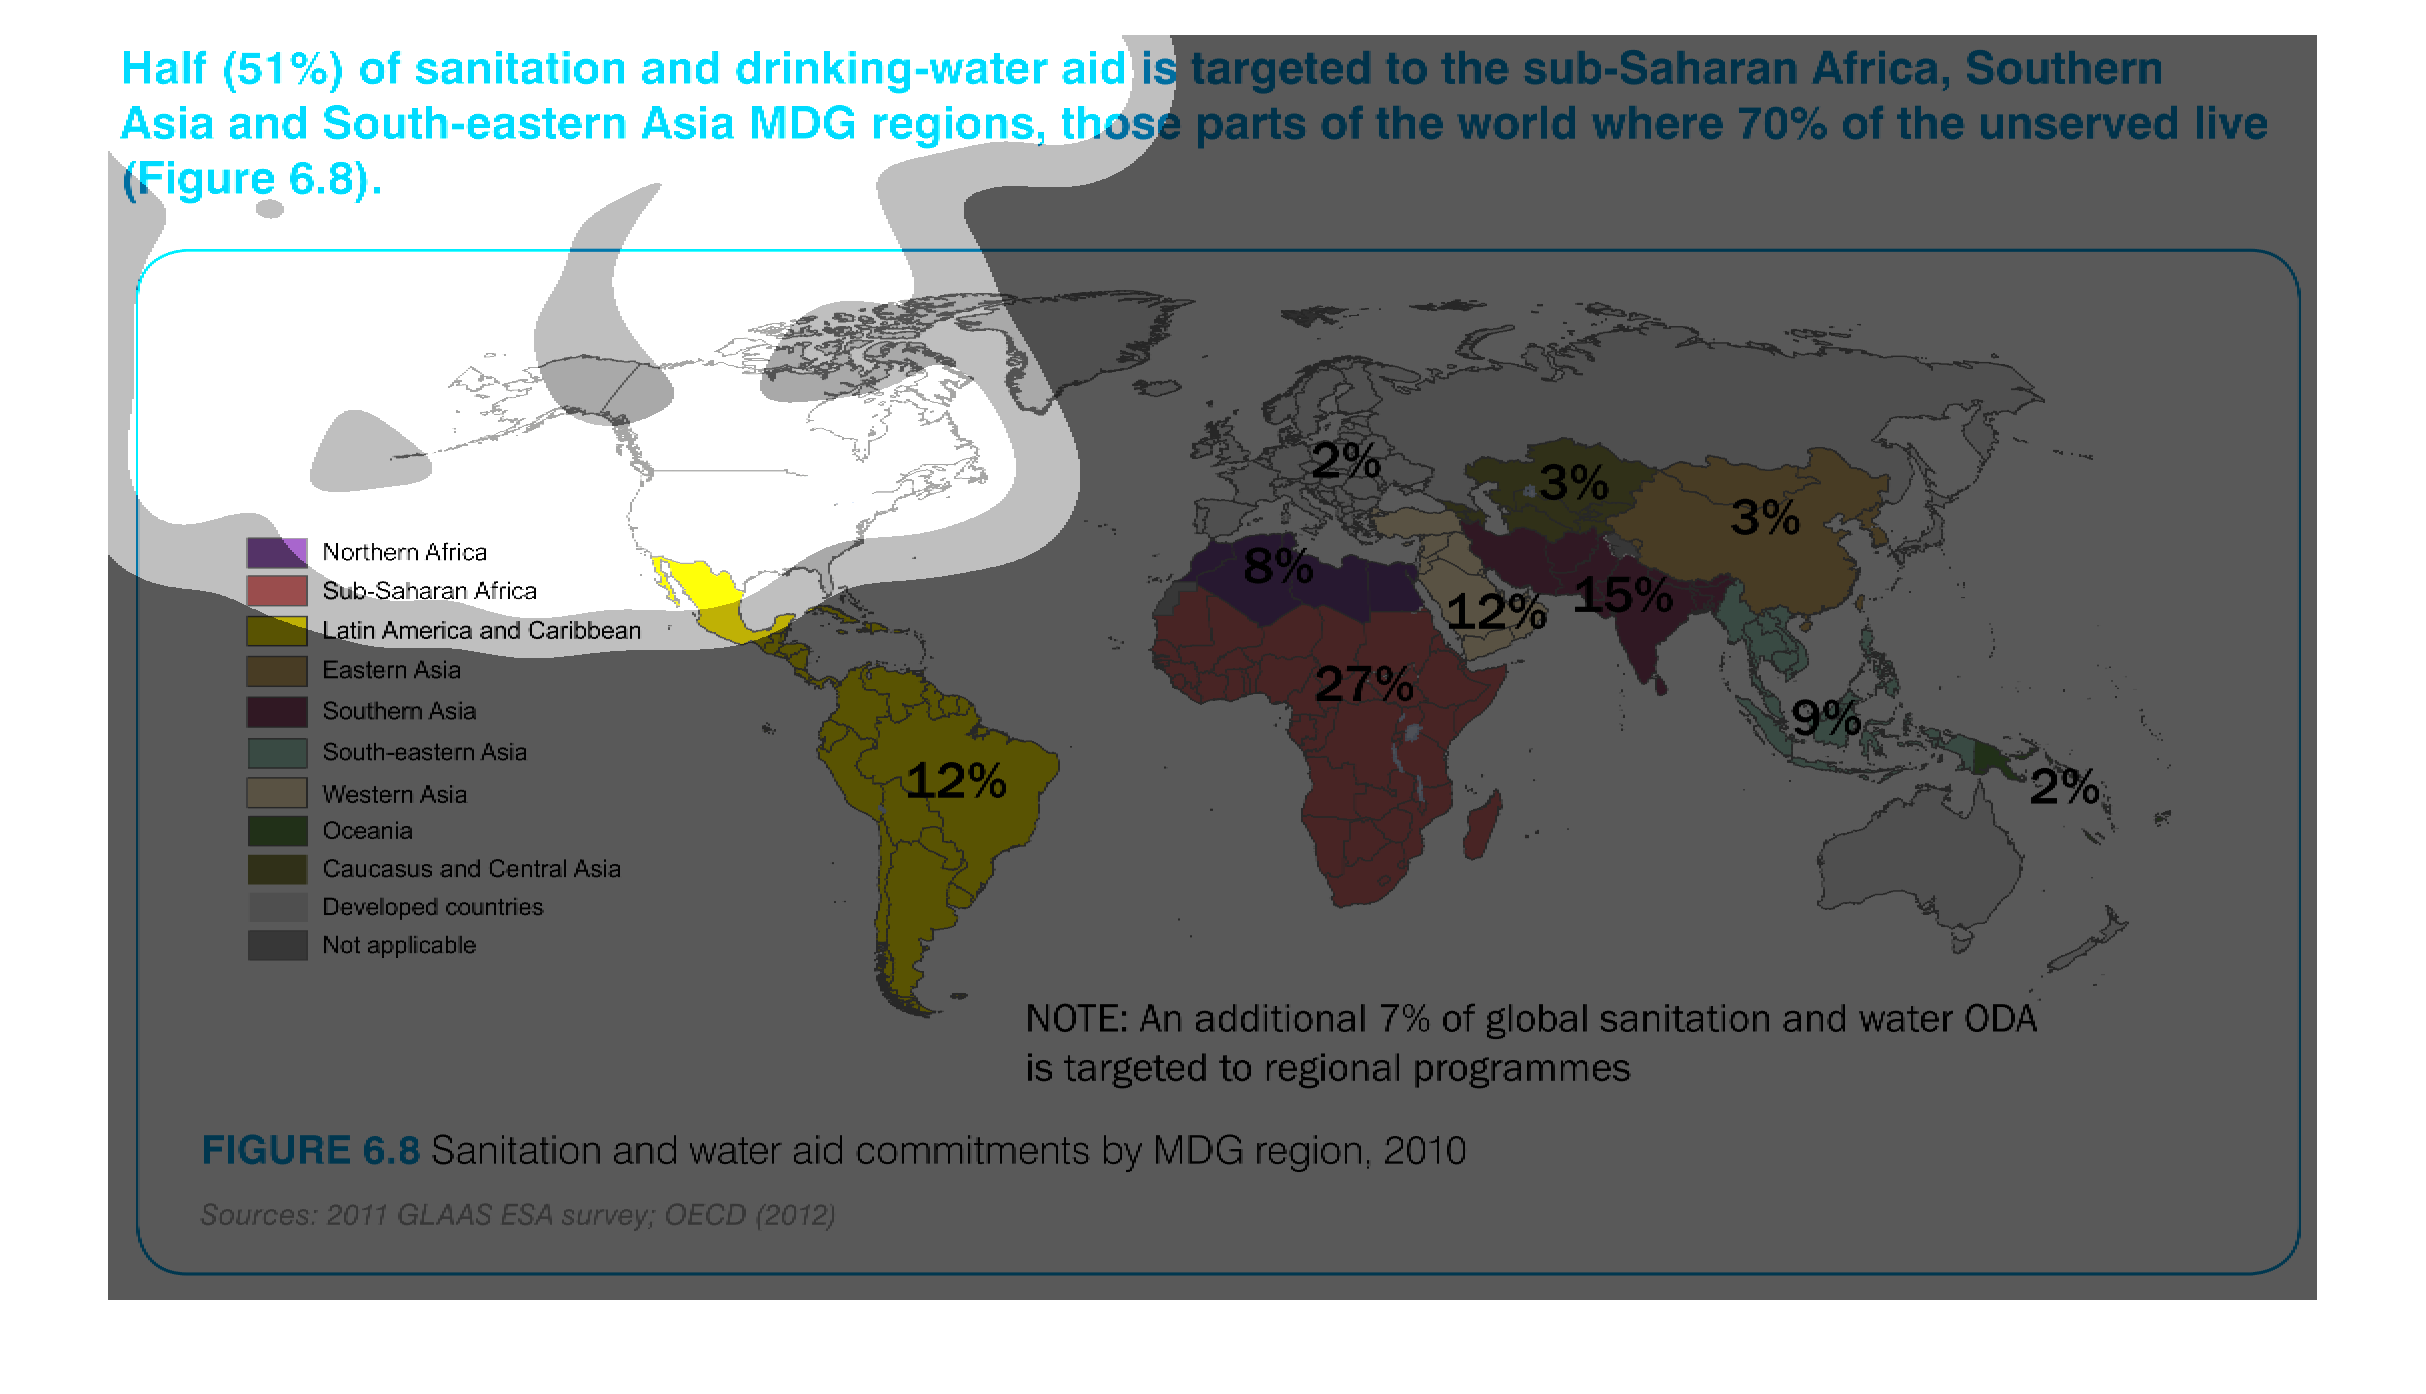
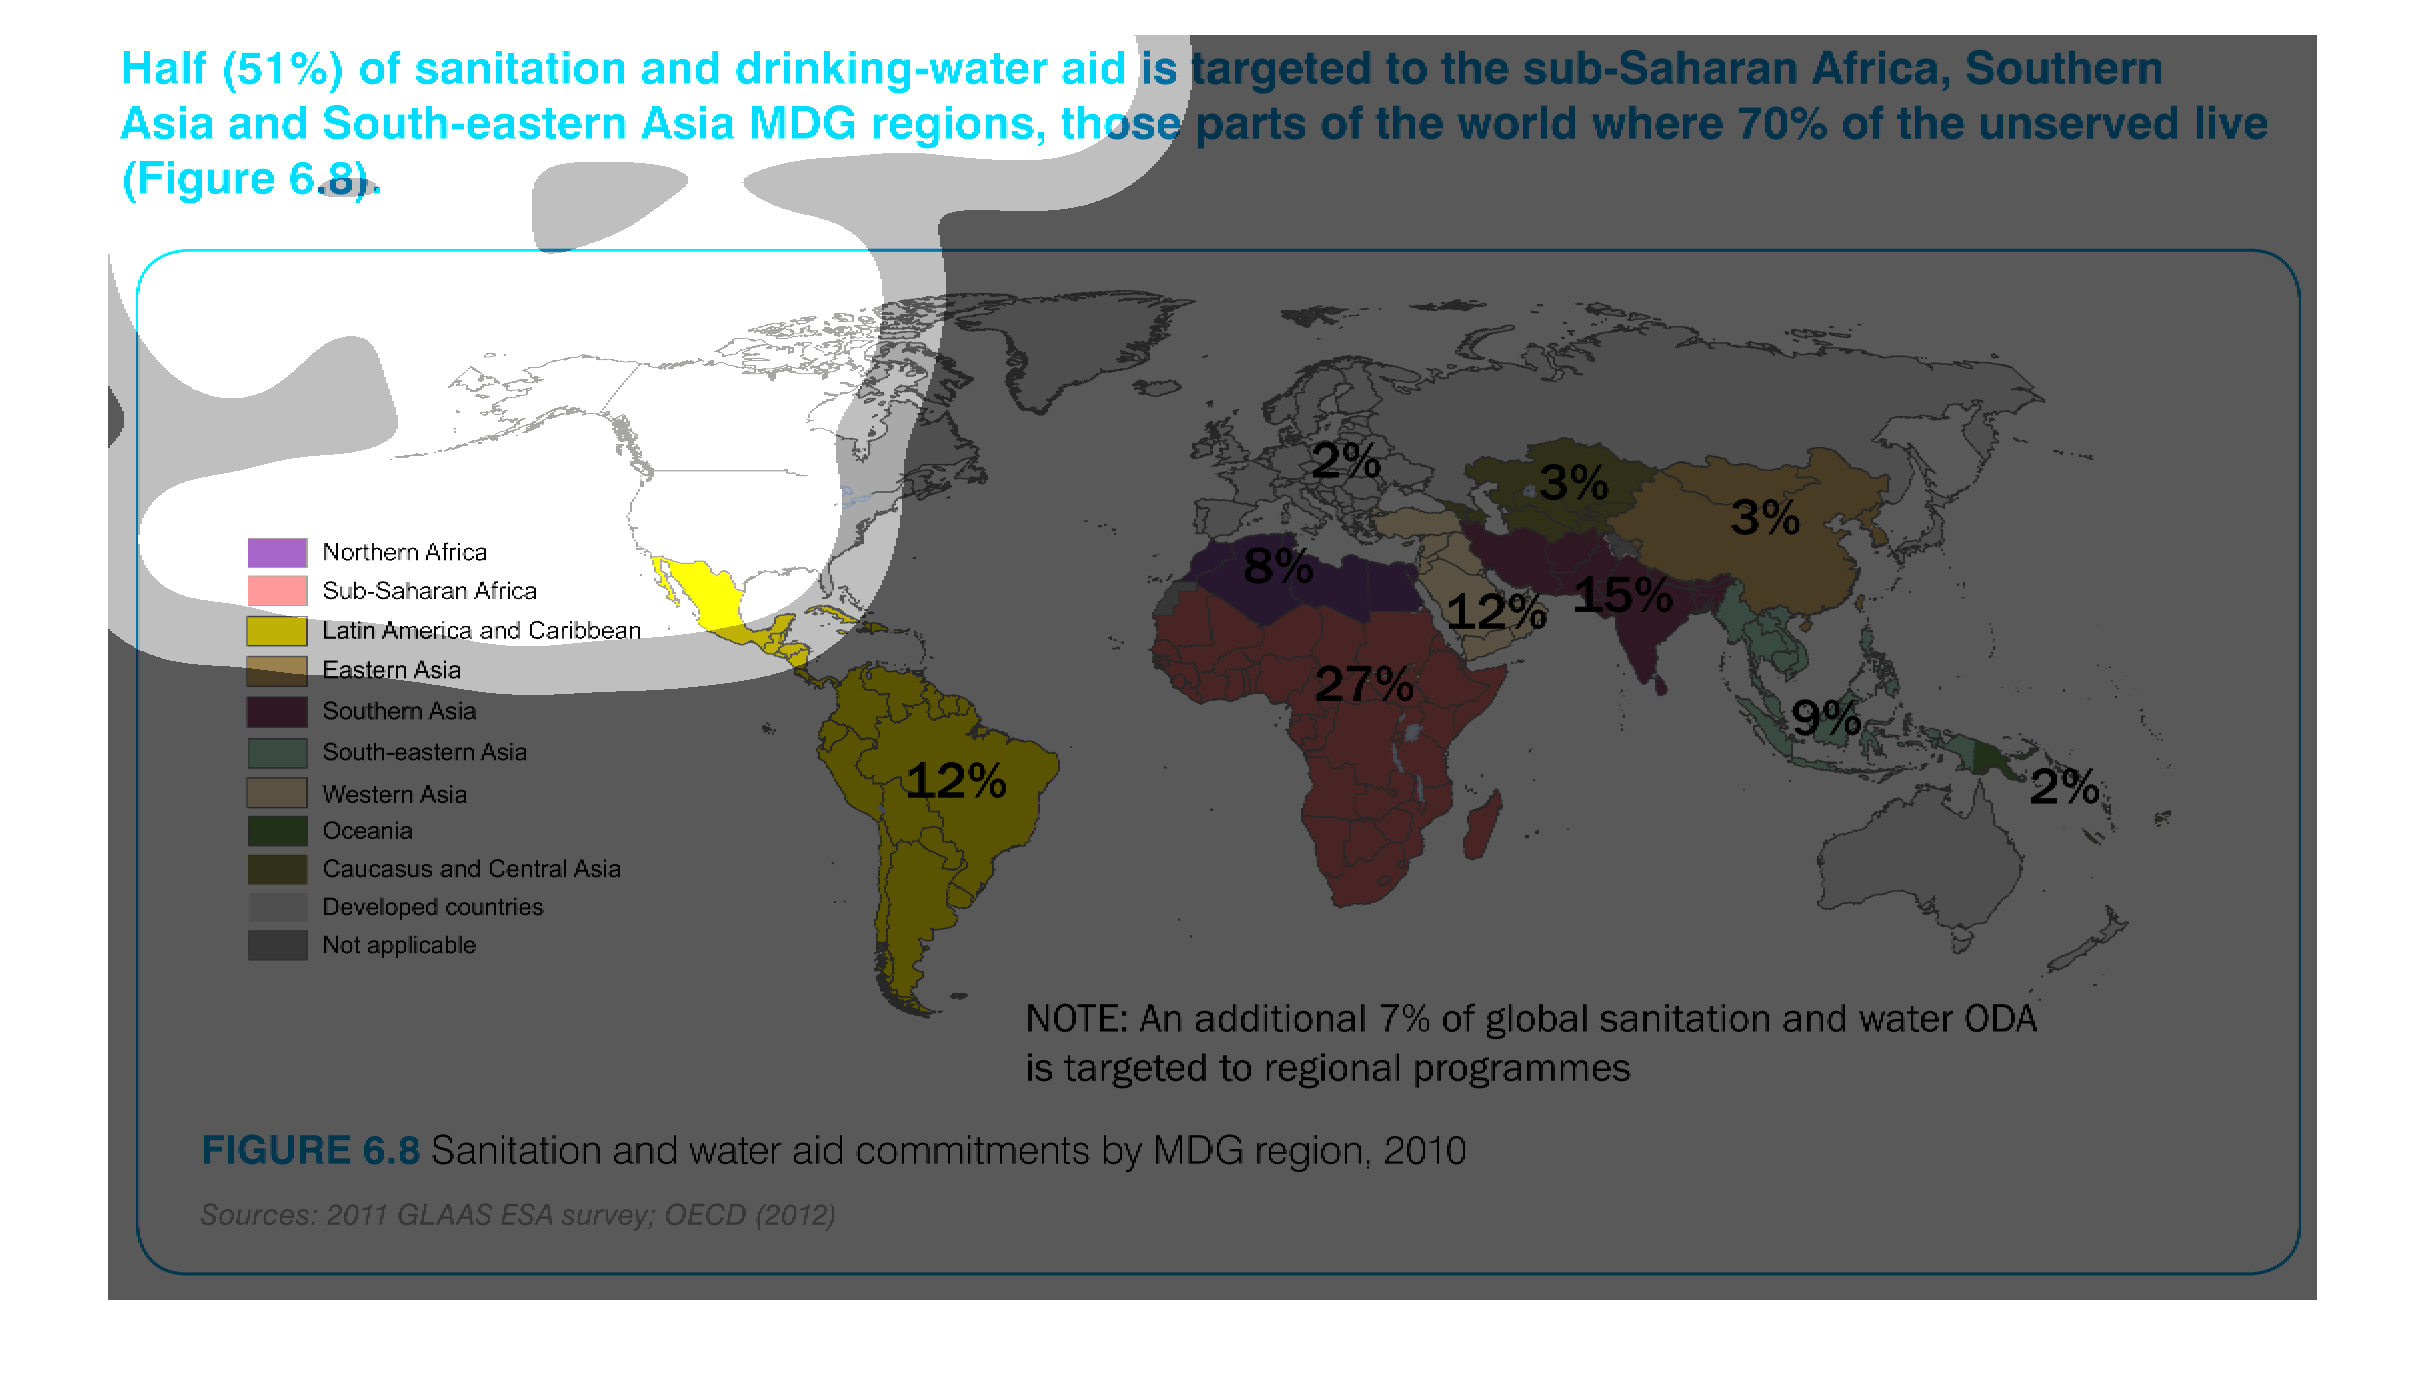
The chart depicts the maps of the world with different colored countries. The countries are
colored by the level of aid that the country receives for improved drinking water purposes.
The greatest amount of aid is distributed to sub-saharan Africa and southern/south-east Asia.
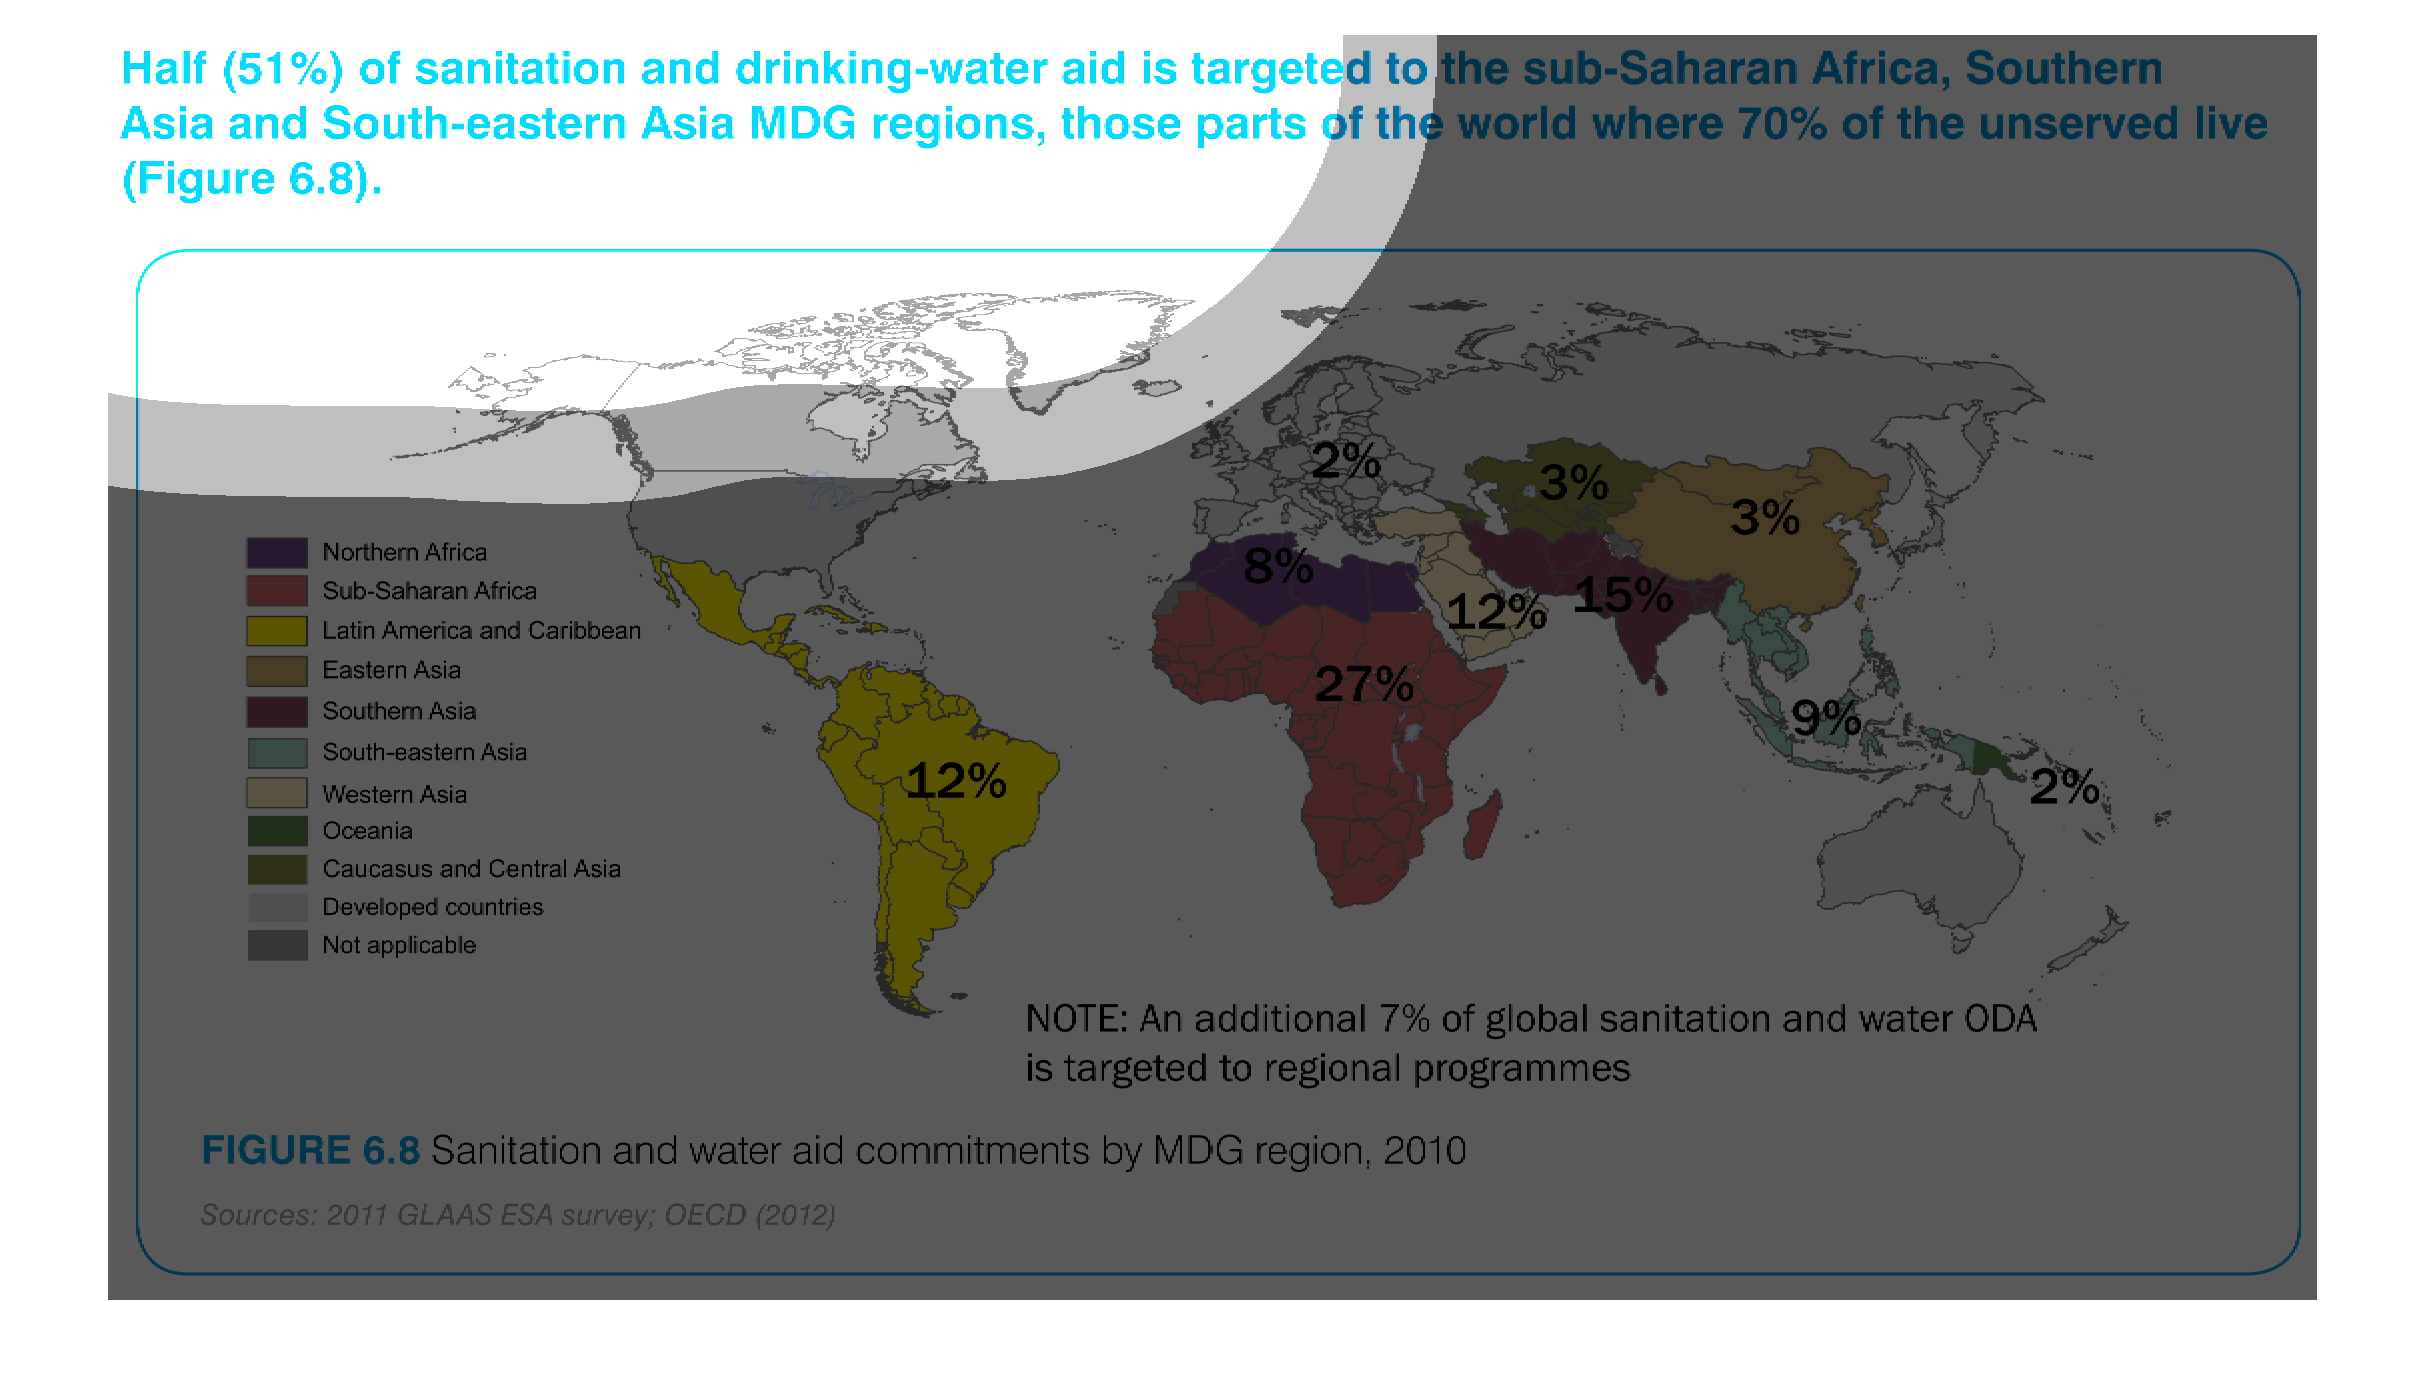
The graph shows where global assistance for countries that need drinking water is centered.
The graph shows that sub-saharan Africa is the epicenter of this sort of aid.
MDC provides sanitation and water-based aid to various countries/continents.  The graph displays
the percentage of the MDC aid by continent.  The continents are further broken down by region.
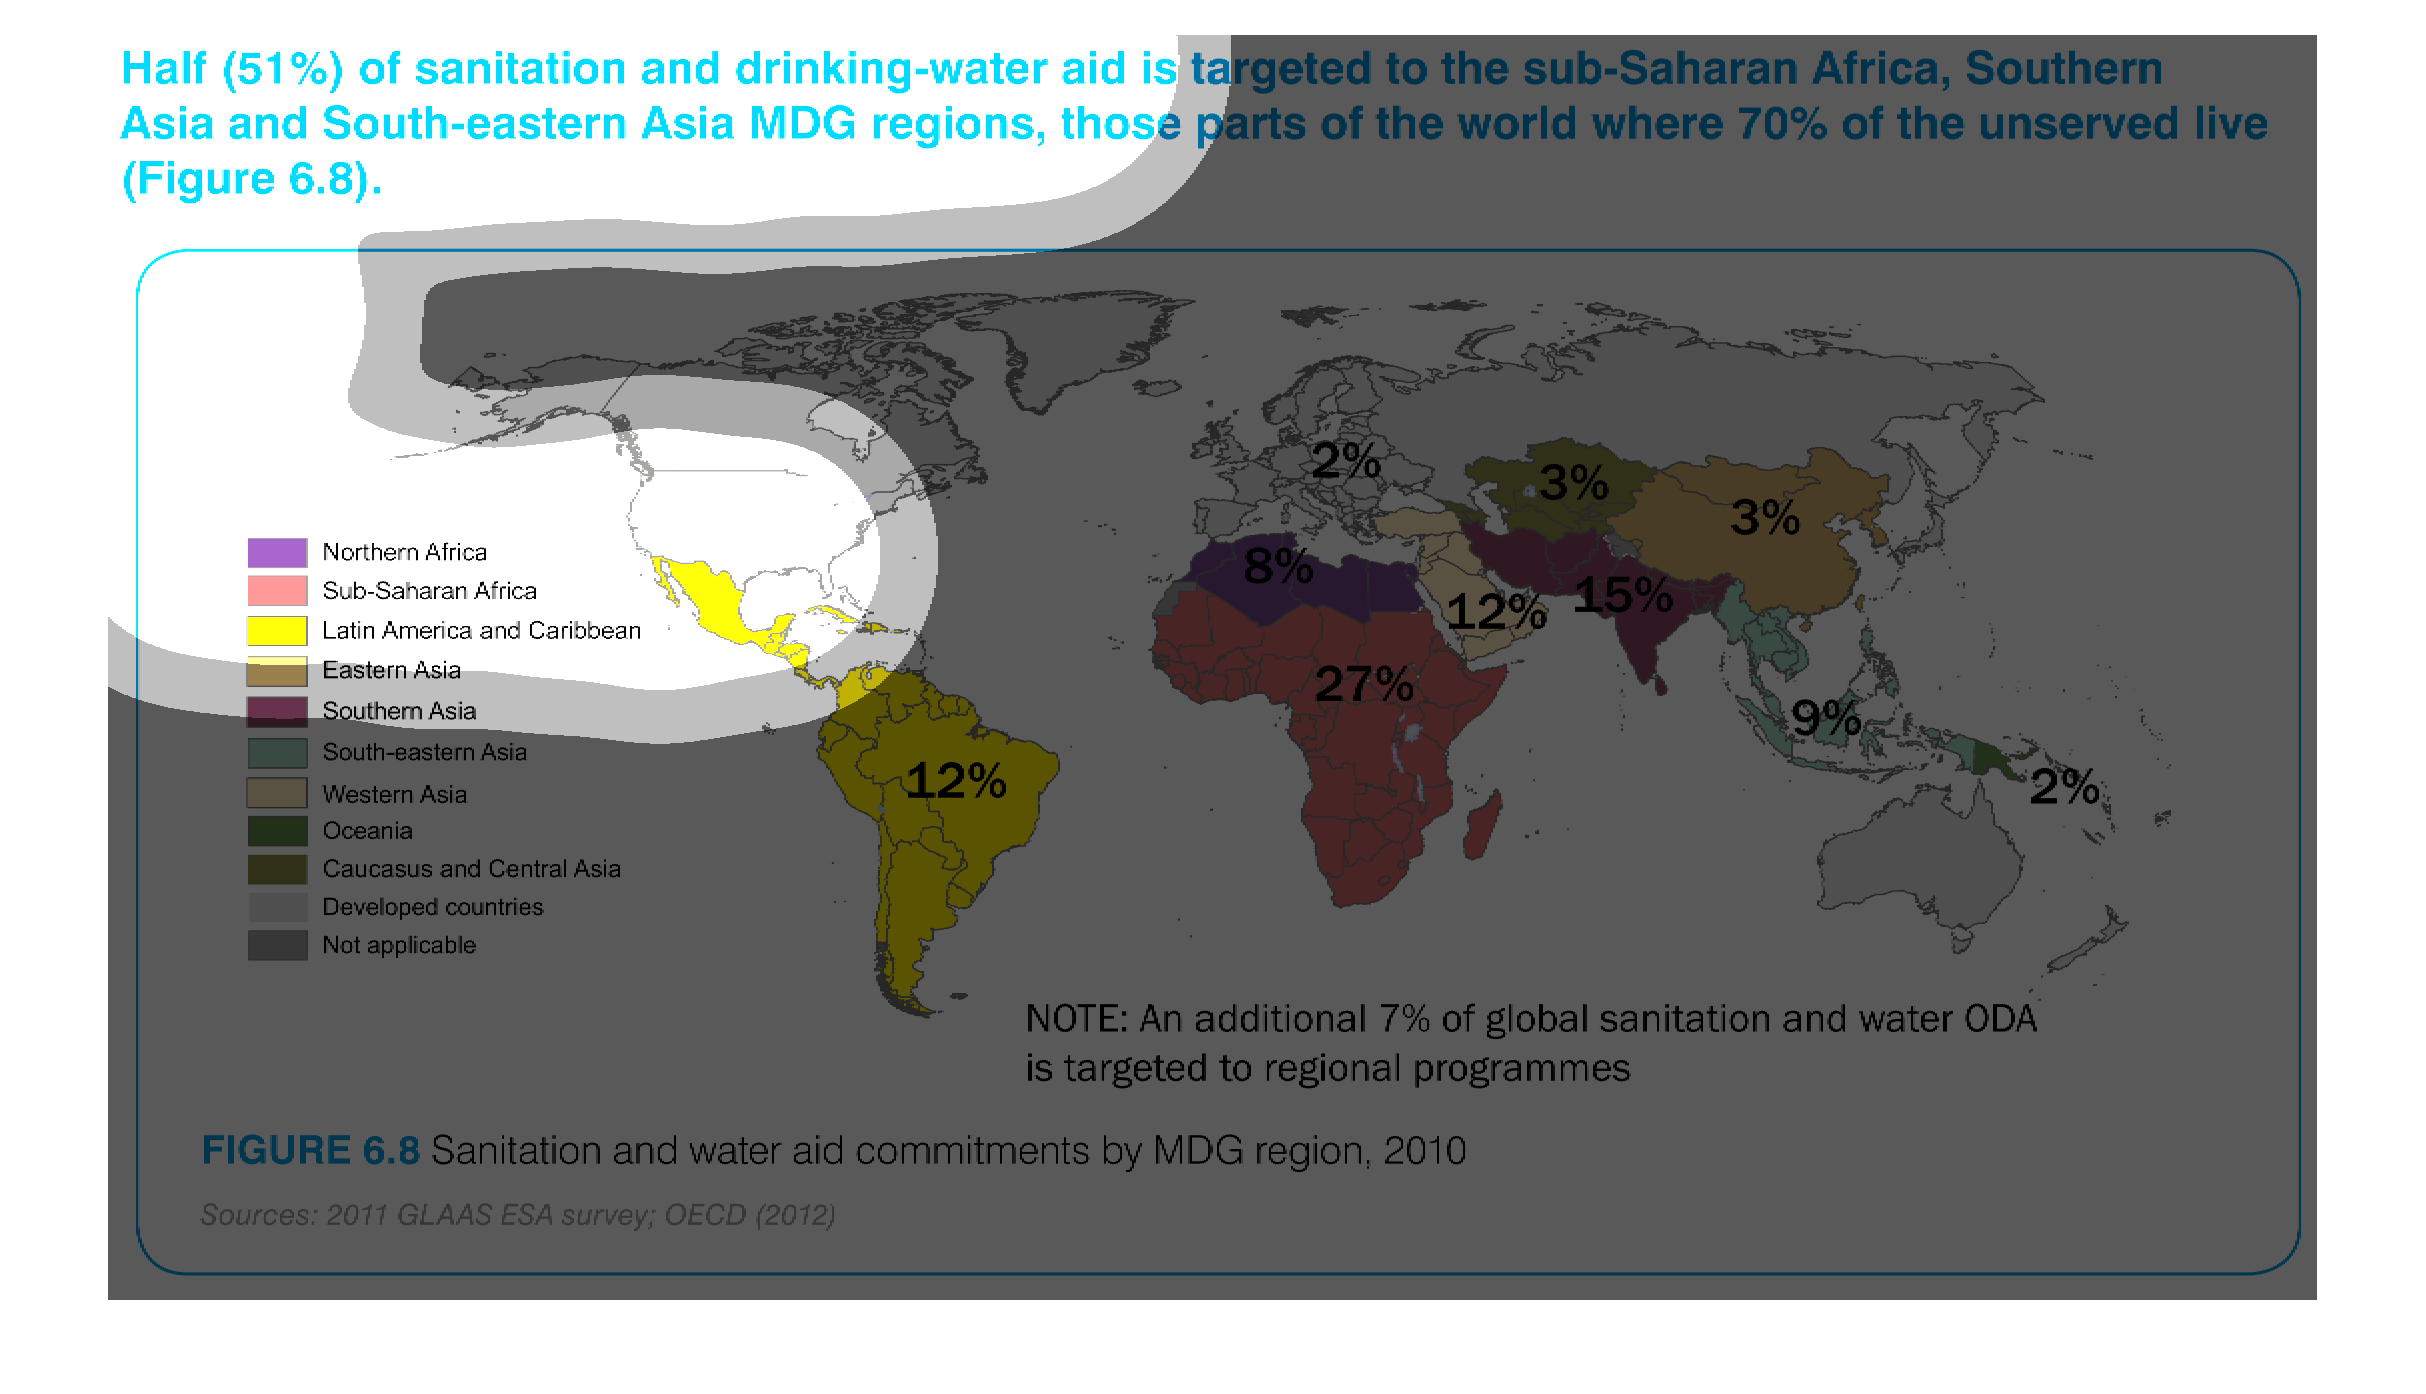
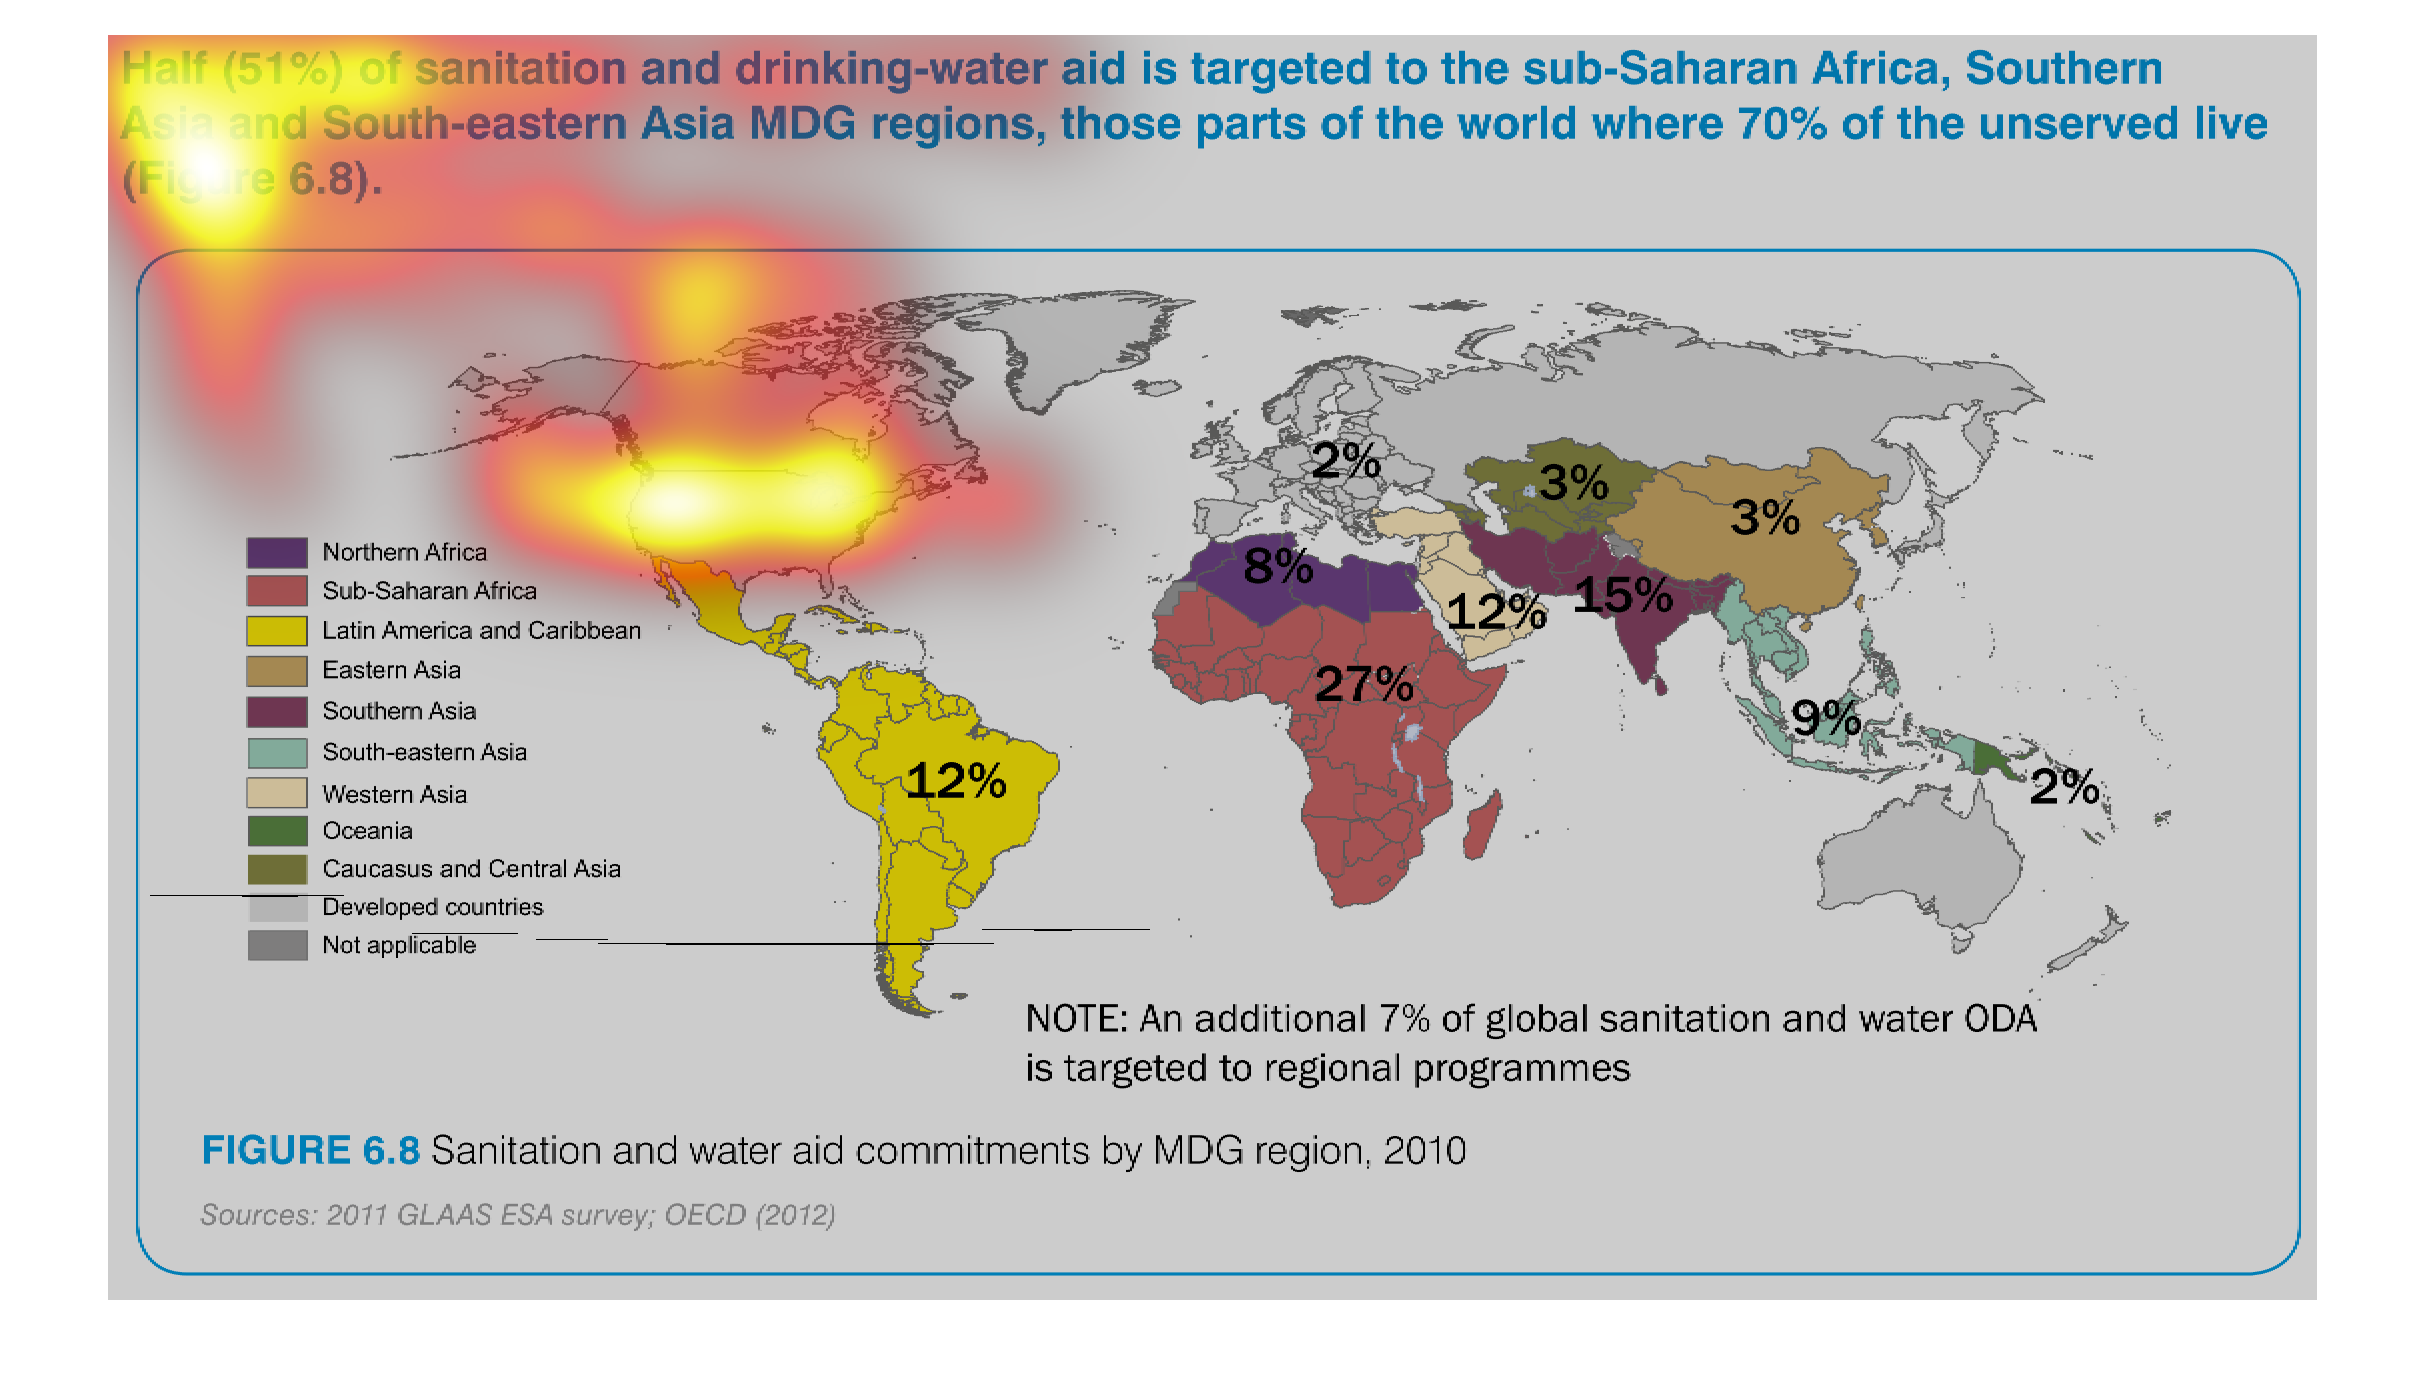
The figure presented is titled Half of sanitation and drinking water aid is targeted to the
Sub-Saharan Africa, Southern Asia and South Eastern Asia. The figure is a map.
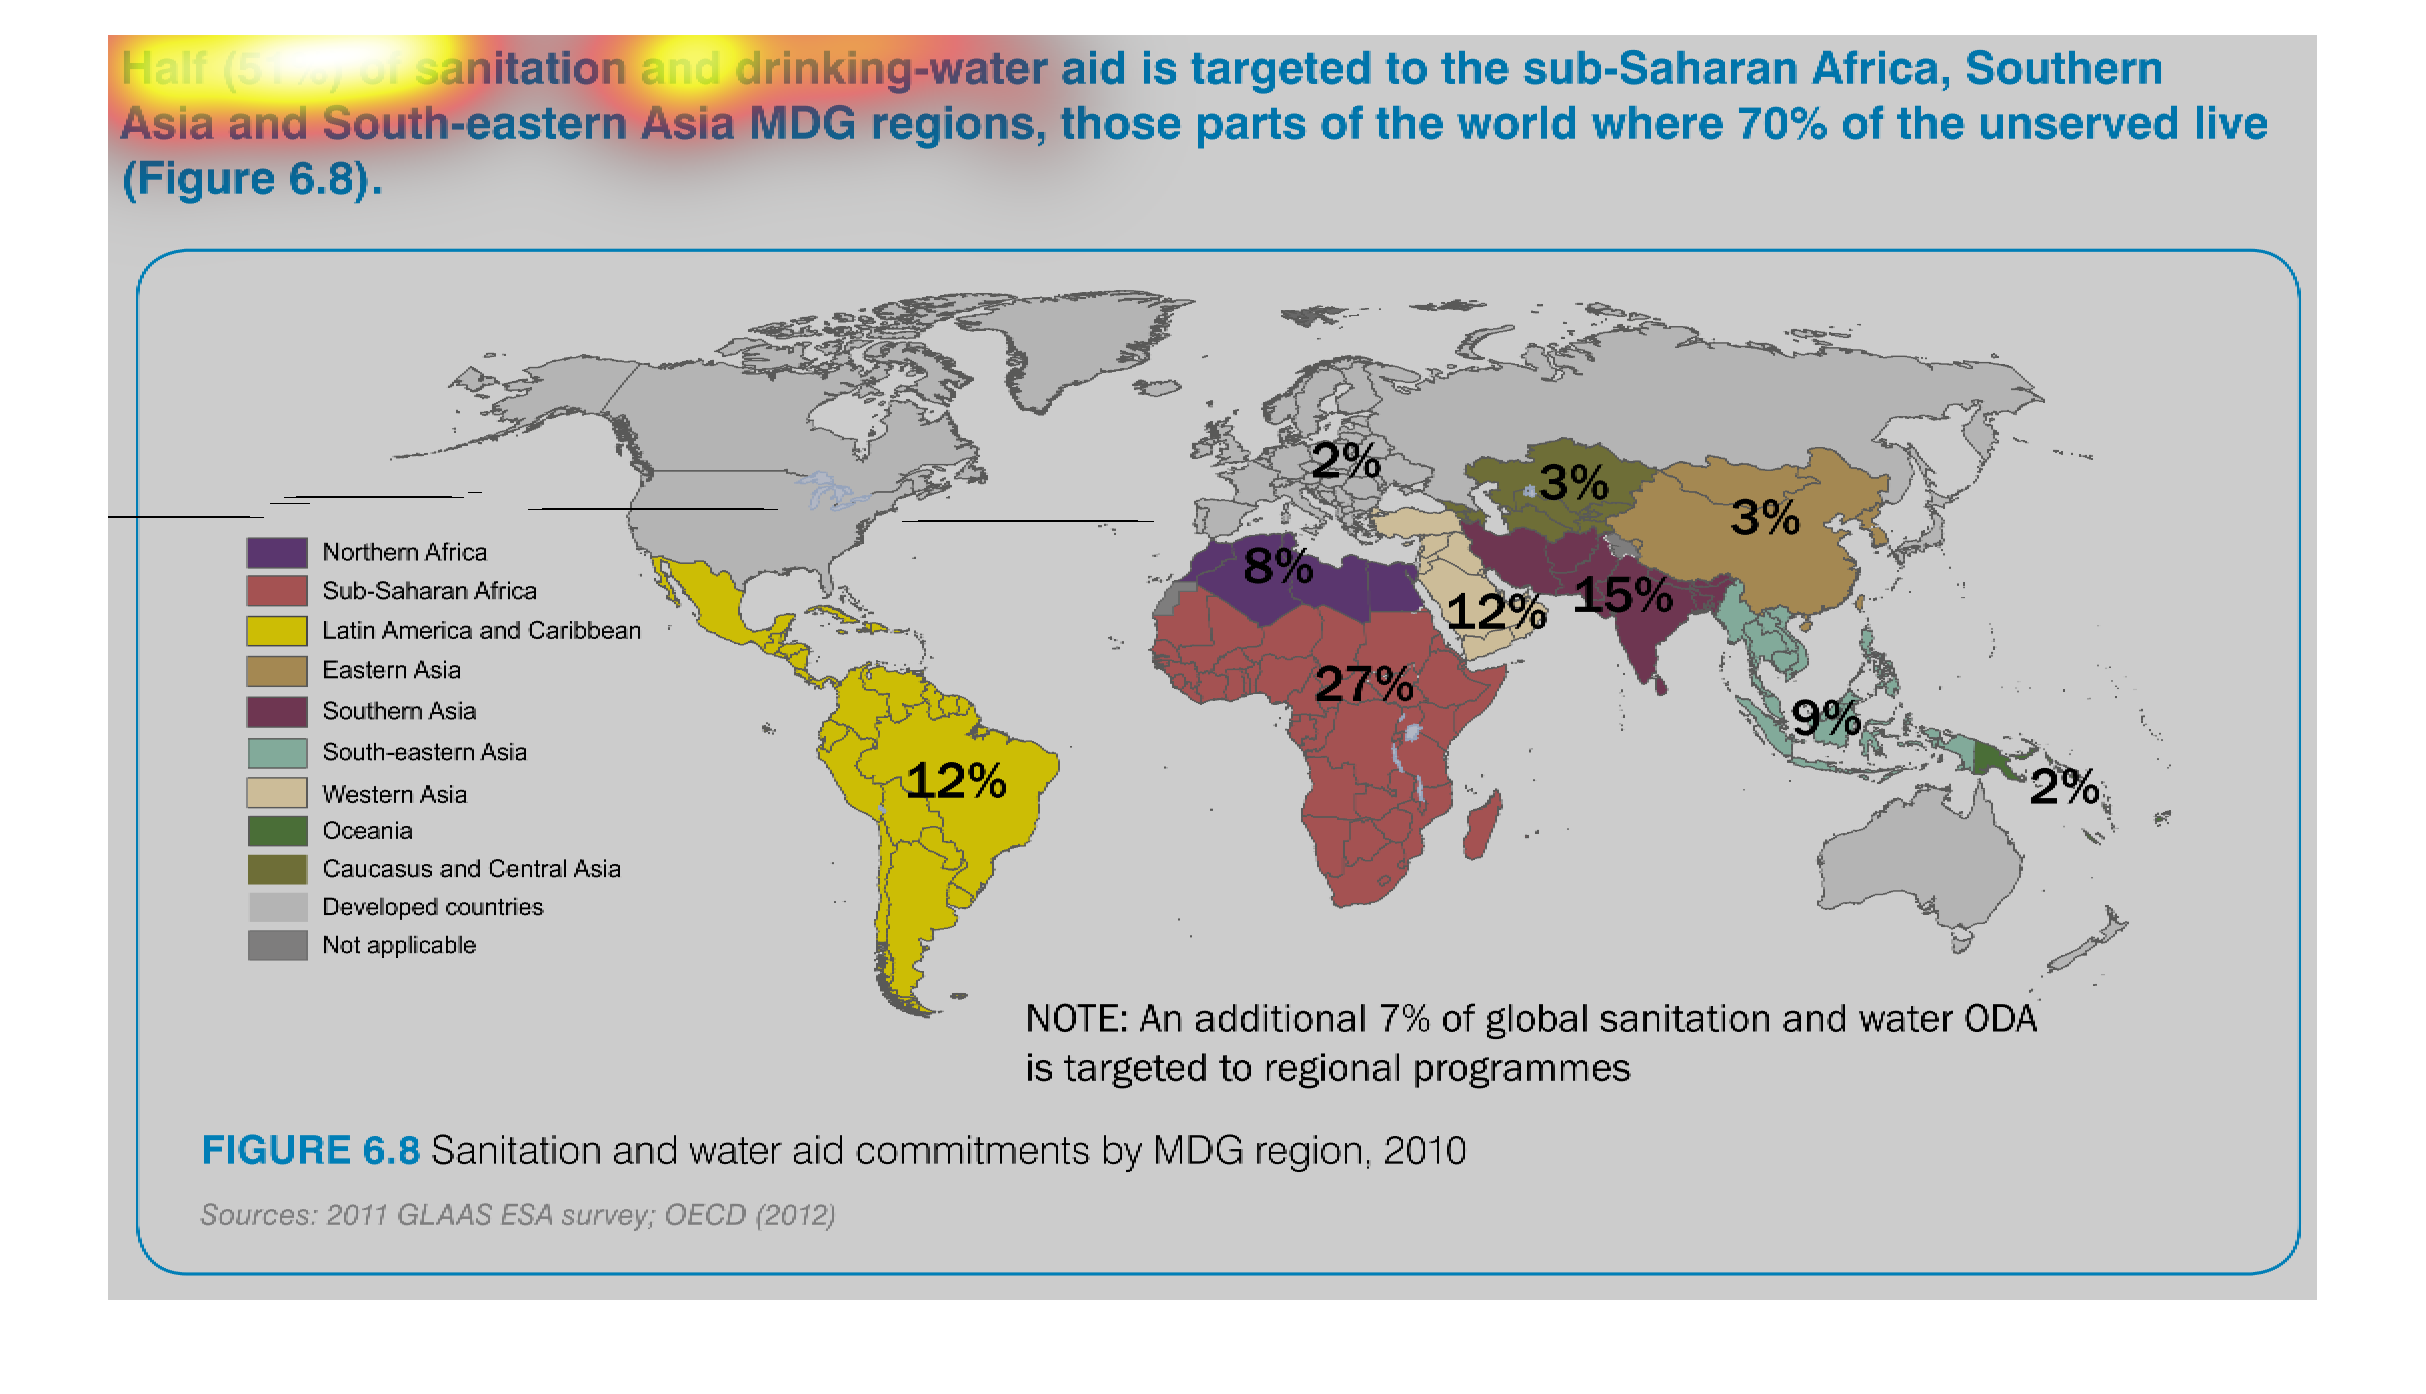
This graph shows the sanitation and water aid commitments made by MDG region in 2010. 51%
of the aid is targeted in sub-Saharan Africa and Southern Asia. South America holds 12% of
the promised aid.
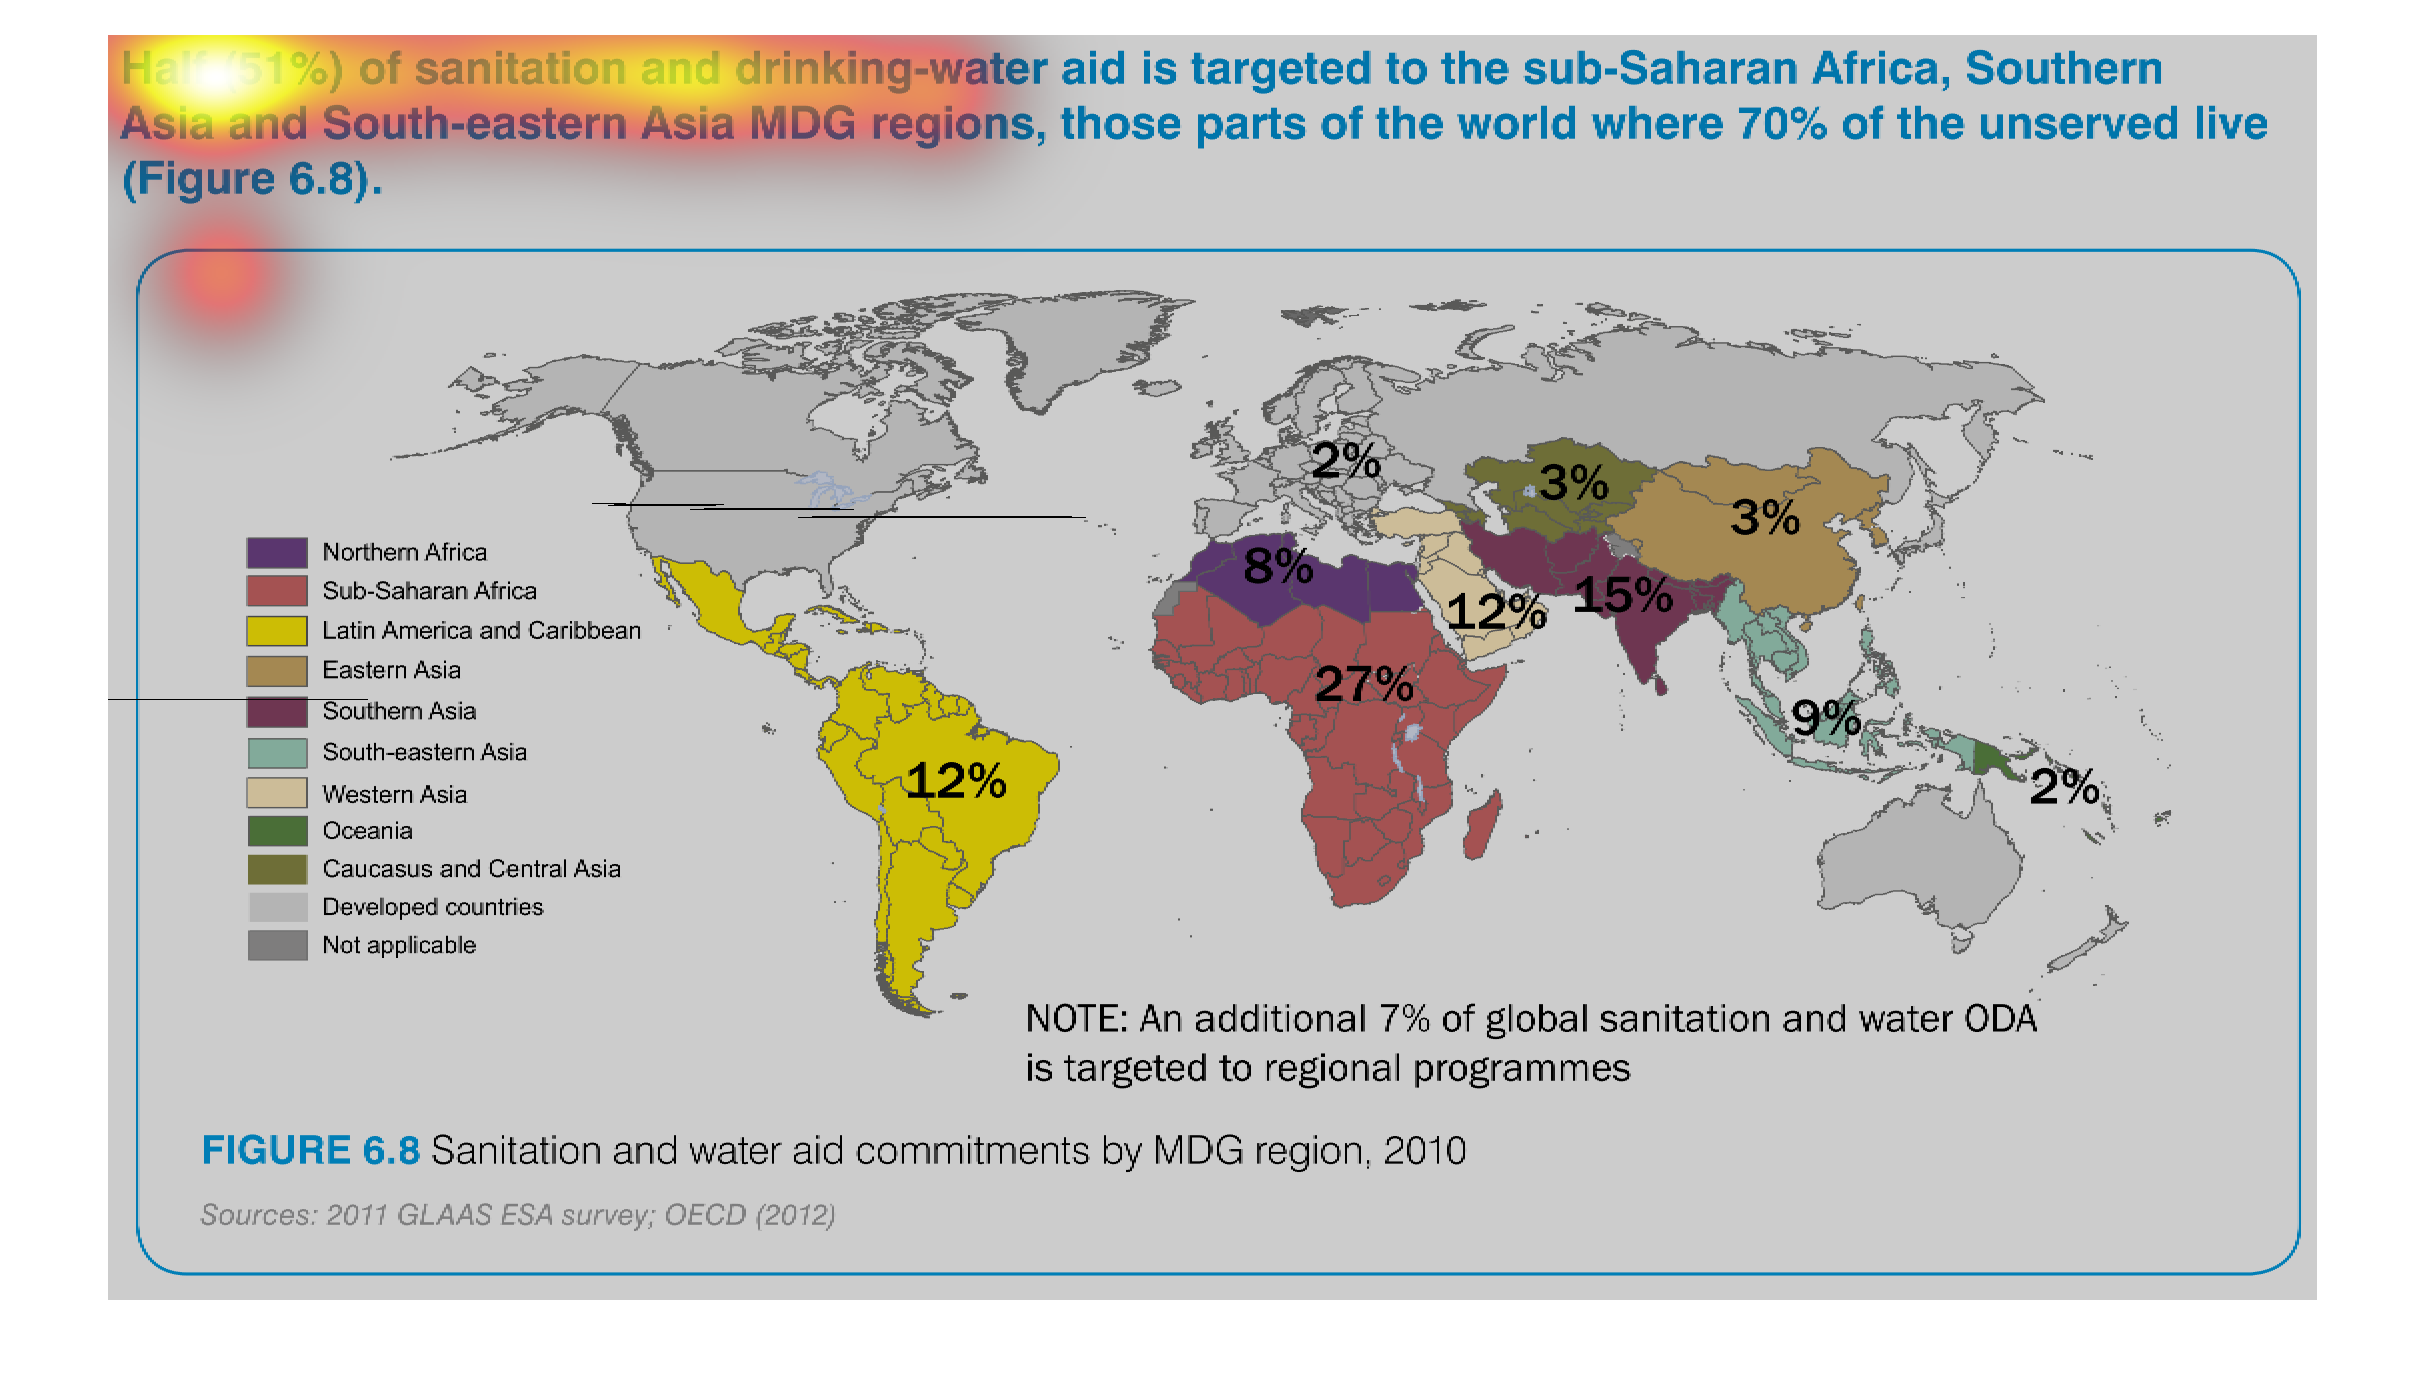
This graph shows the globalization of purified water and the efforts to deliver it to specific
countries in the world.  The US has none, while India has 12% and Africa leads with 27%.
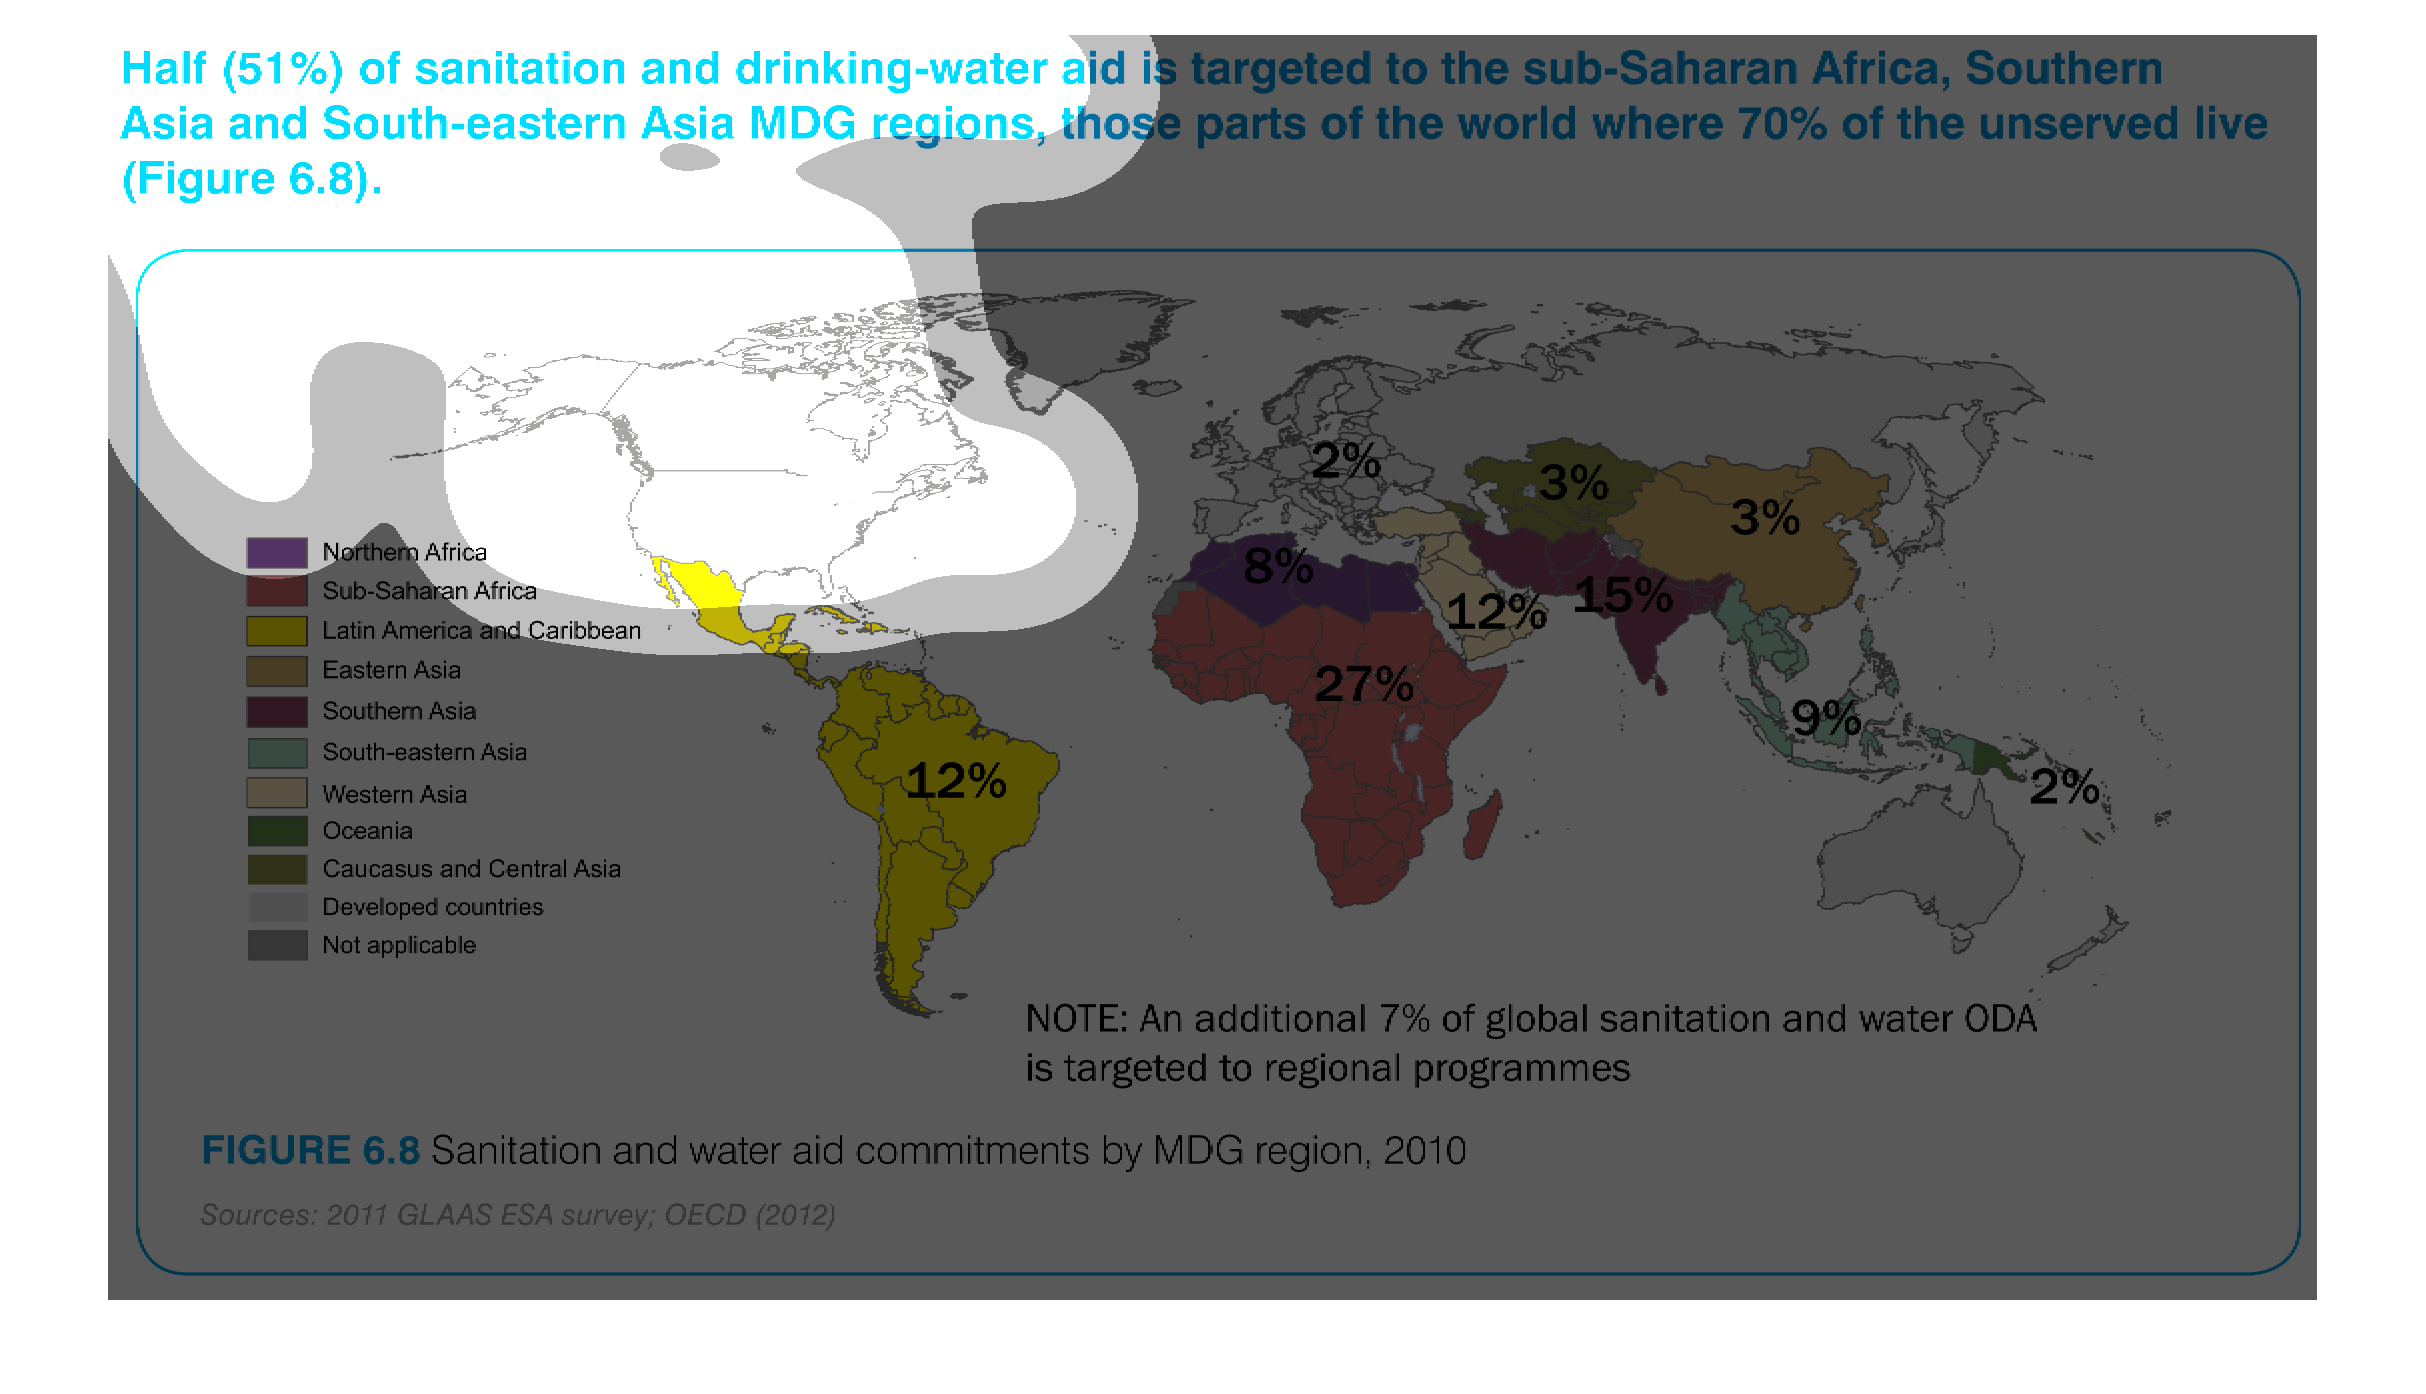
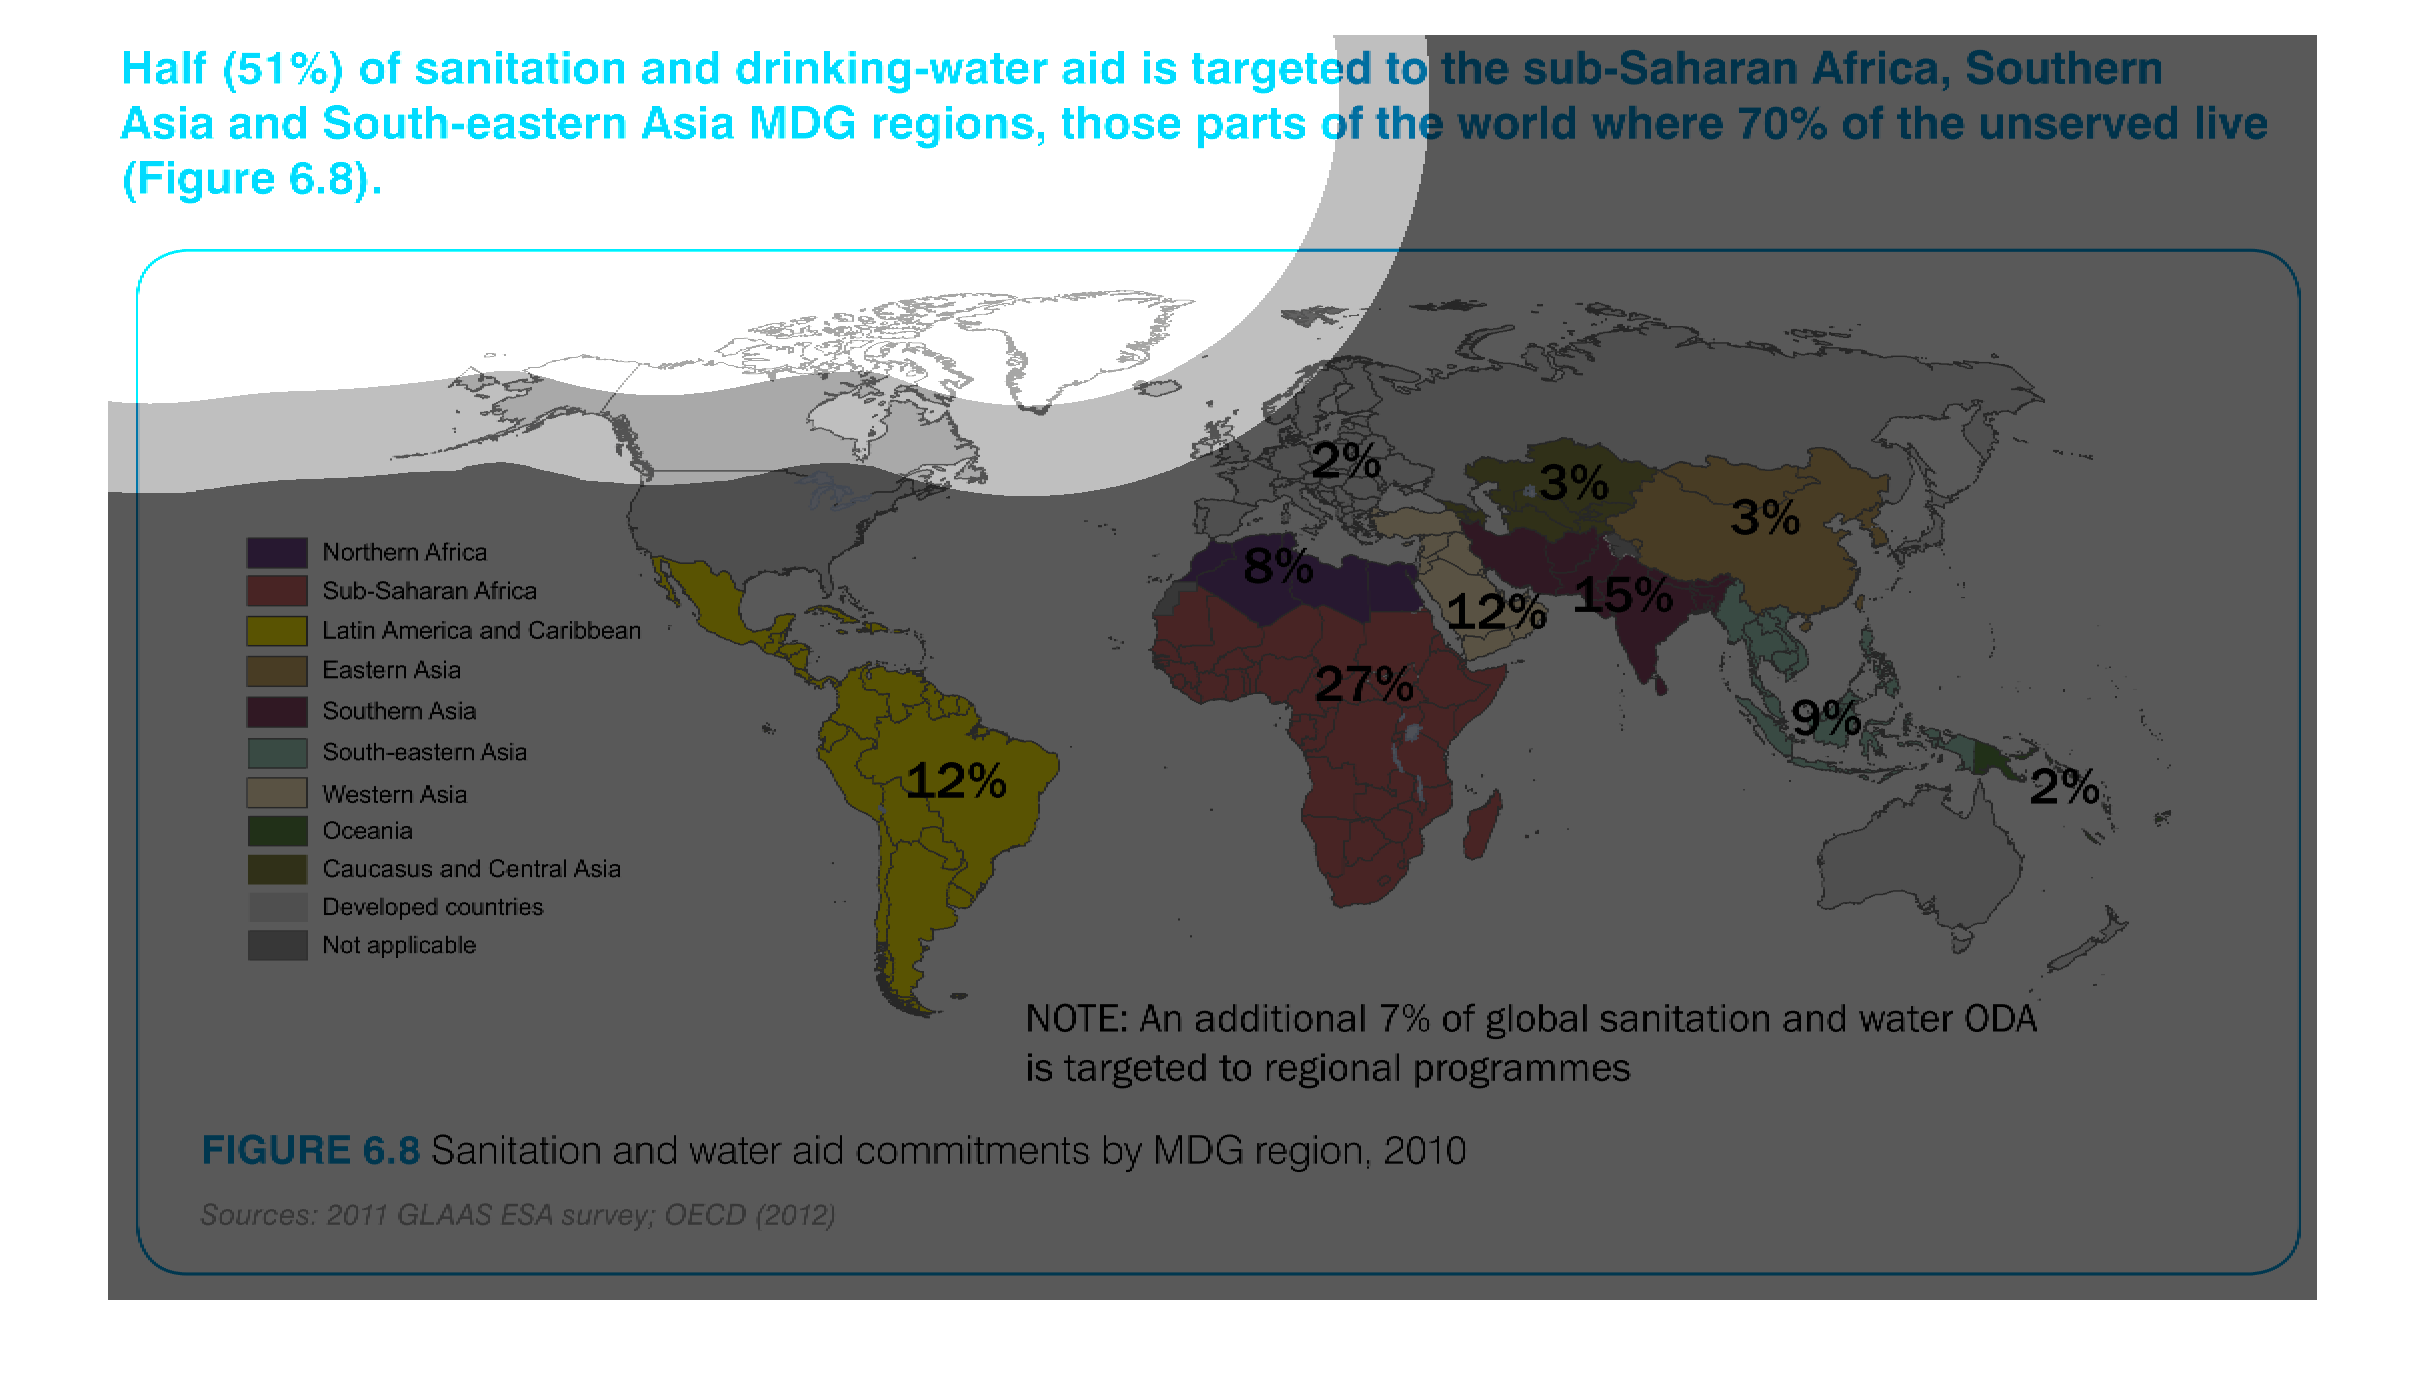
Half of sanitation and drinking water aid is targeted to the sub saharan Africa, Southern
Asia, and South Eastern Asia MDG regions, those parts of the world where 70% of the unserved
live (figure 6.8) This is displayed in a color coded map of the World.
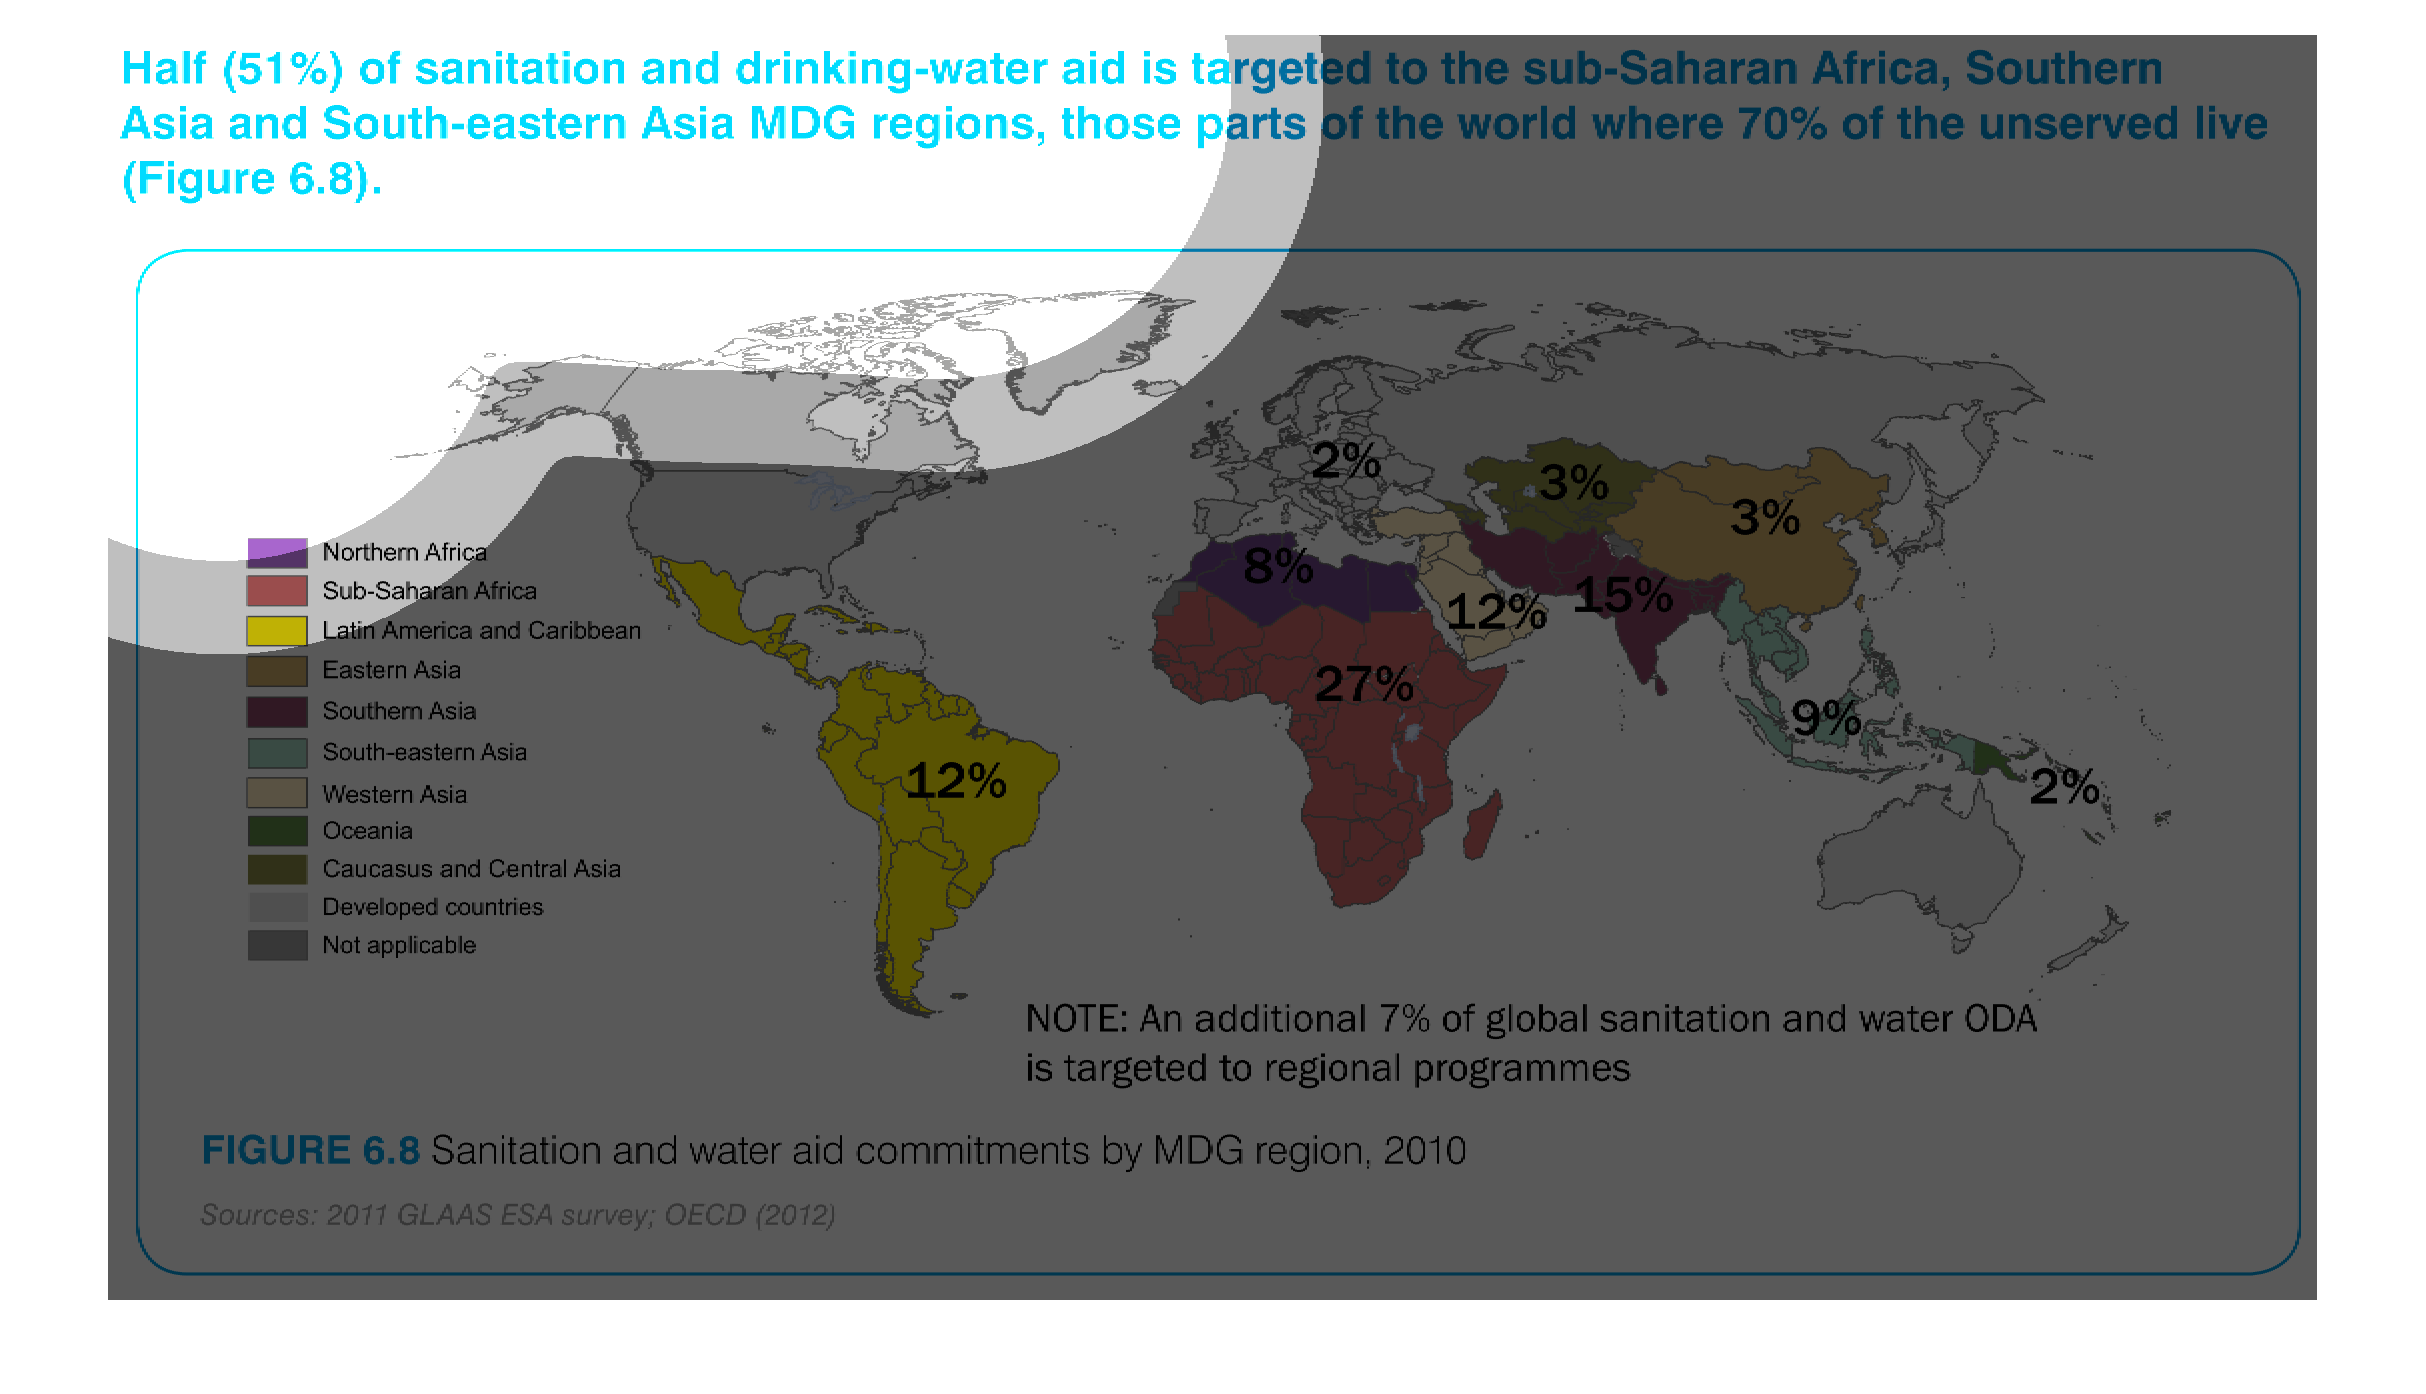
This is a map that shows the sanitation and water aid given to different countries. It shows
that the majority of the aid is giving to southern africa and southern asian countries.
half of sanitation and drinking water aid is targeted to sub saharan africa, southern asia,
and south eastern asia. MDG regions where 70% of the unserved live
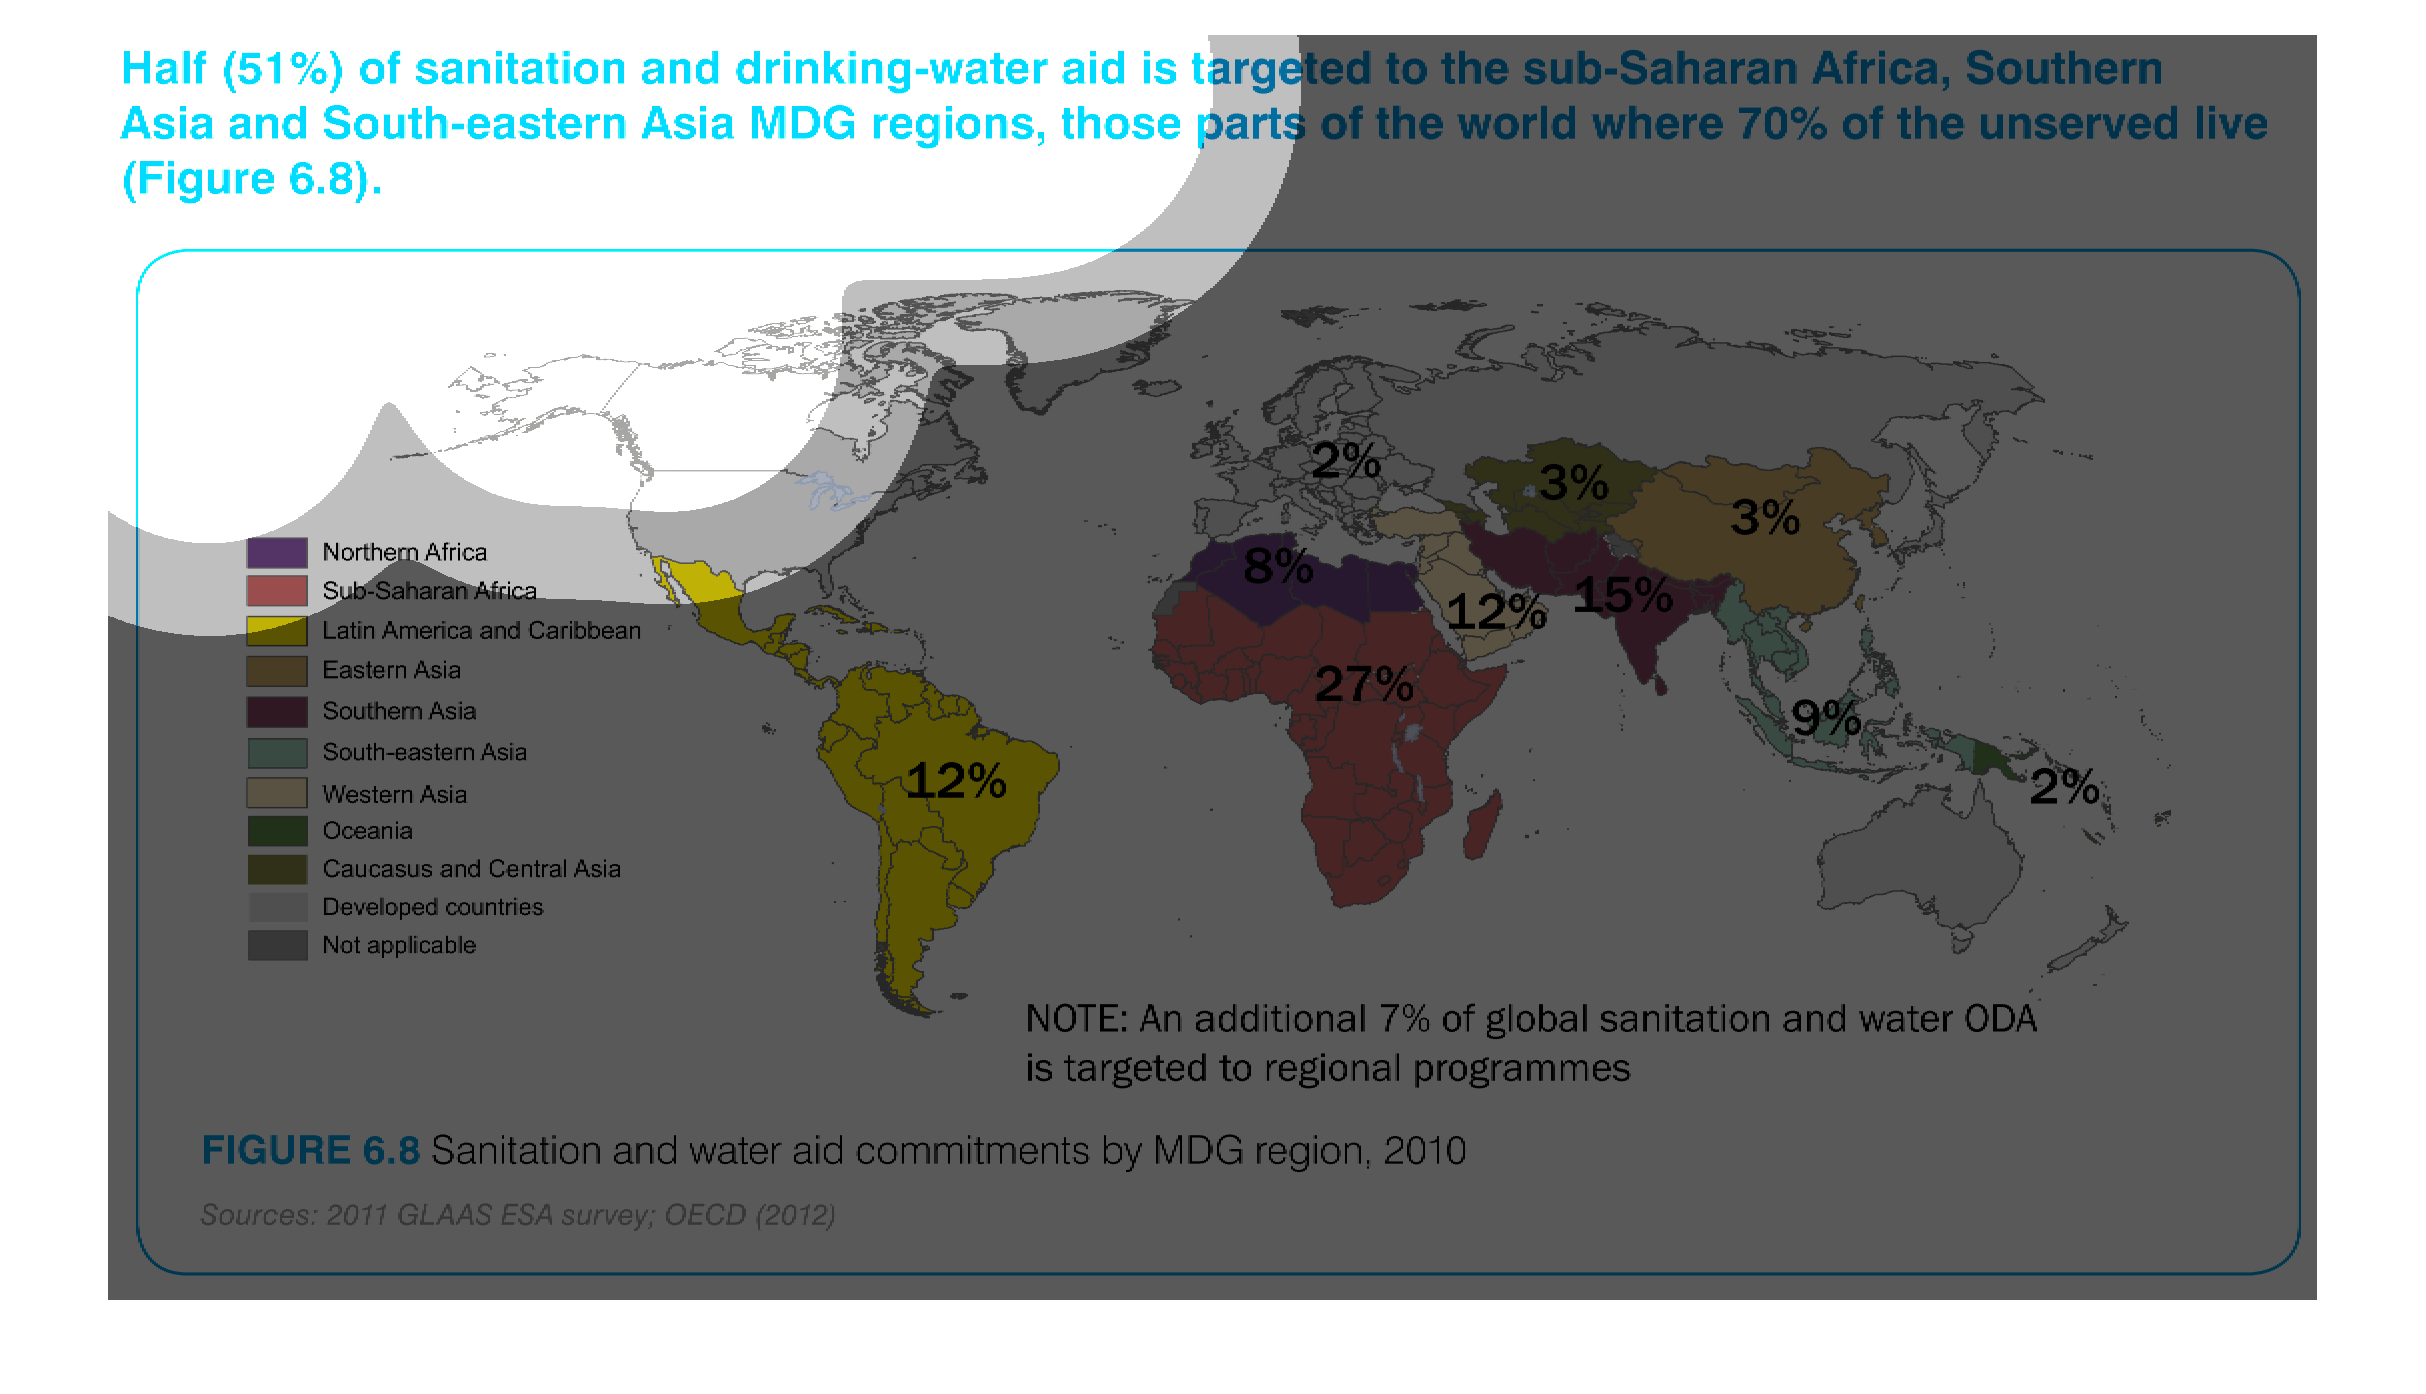
This is a color coded world map depicting that 51% of sanitation and drinking water aid is
targeted to Sub-Saharan Africa and both South and South-Eastern Asia MDG regions.