This chart describes about ability to allocate aid commitments separately to sanitation and
drinking water.  It shows the external support agency and it's total aid commitment for the
year 2010.
This chart describes ability to allocate aid commitments separately to sanitation or drinking
water, for the year 2010. regions on the chart include Germany.
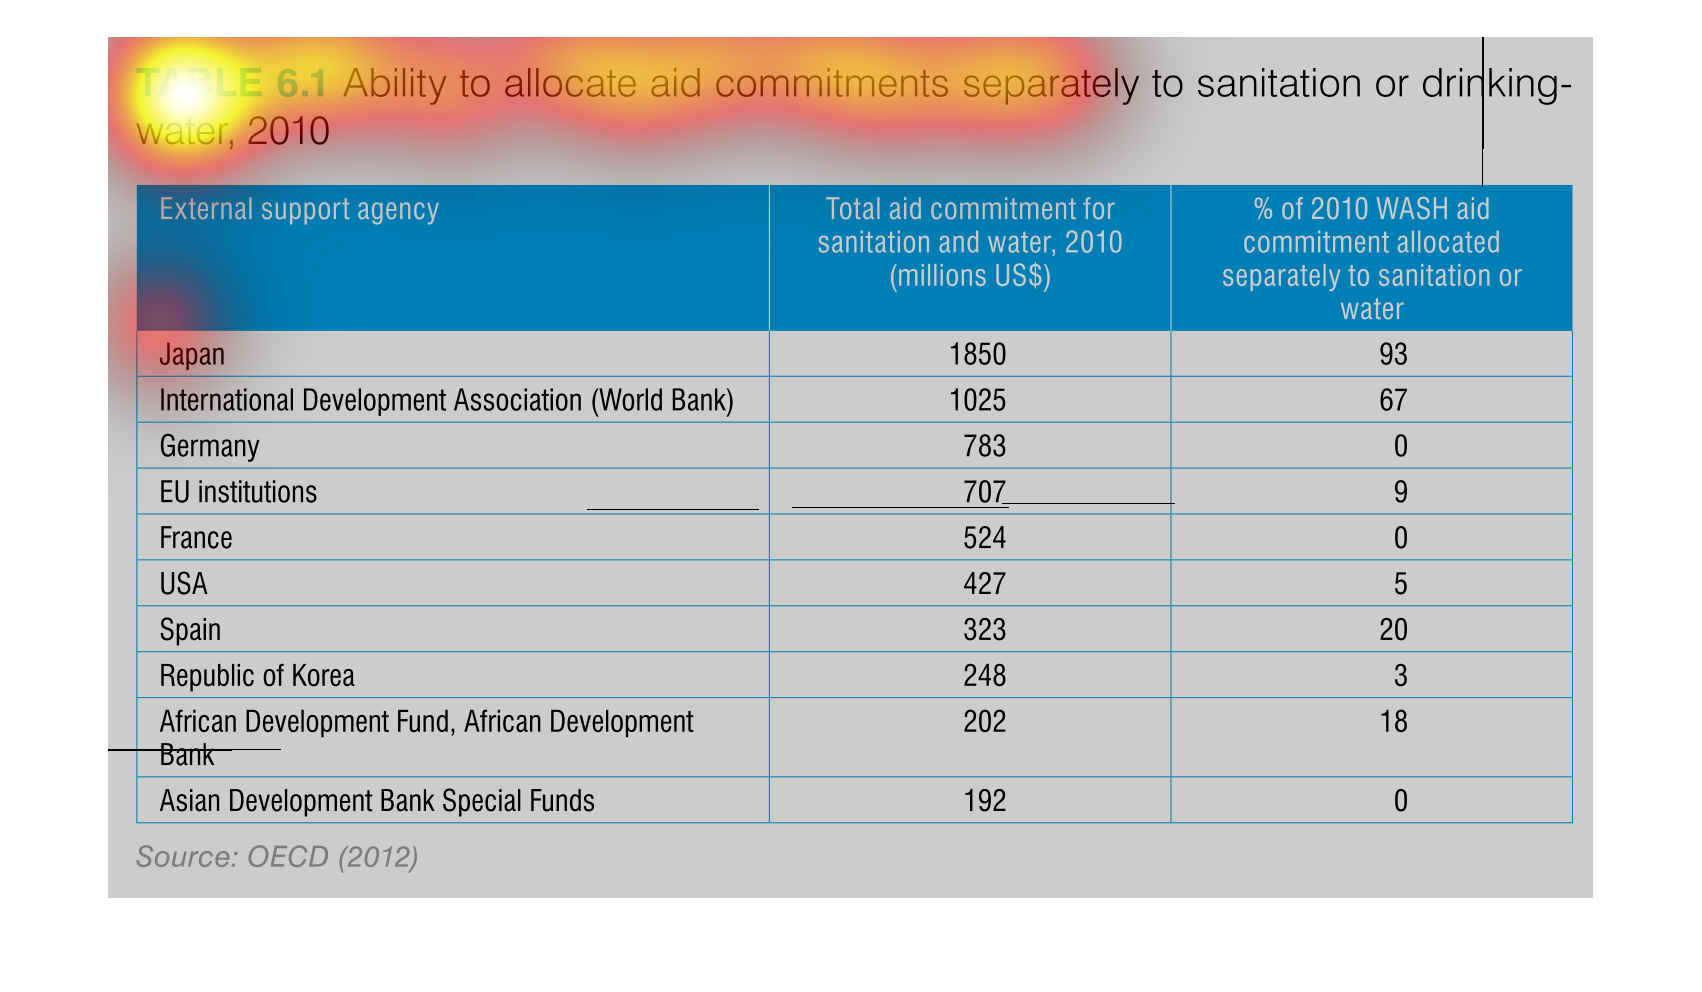
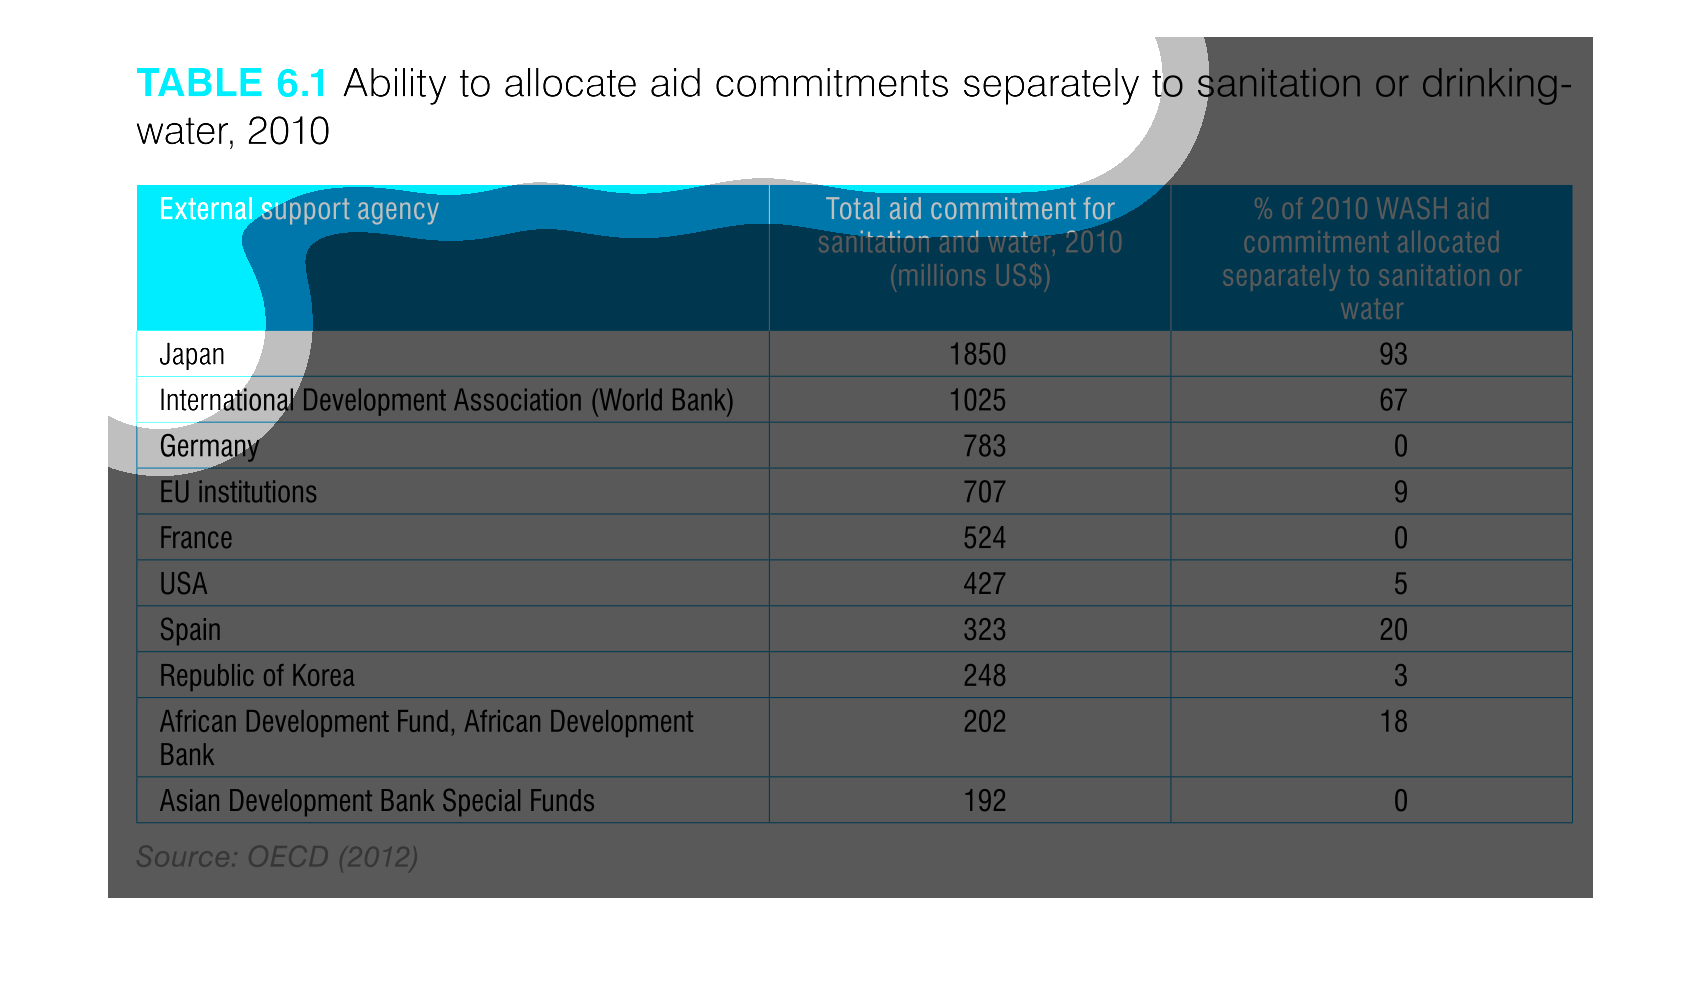
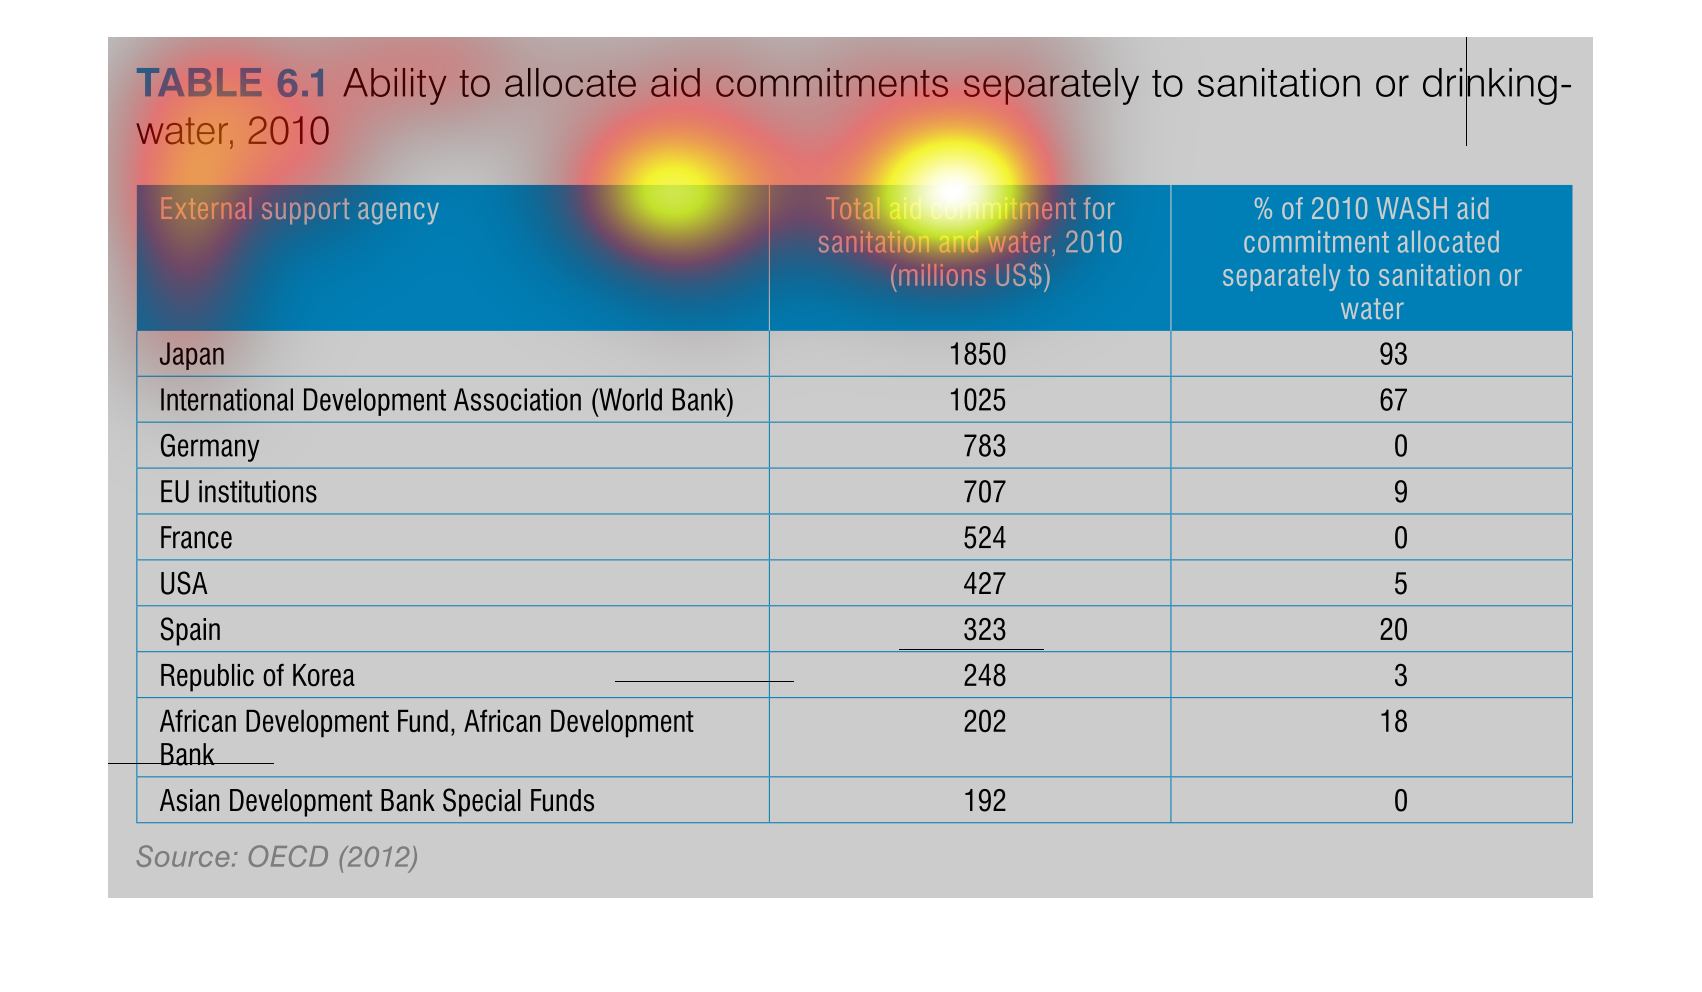
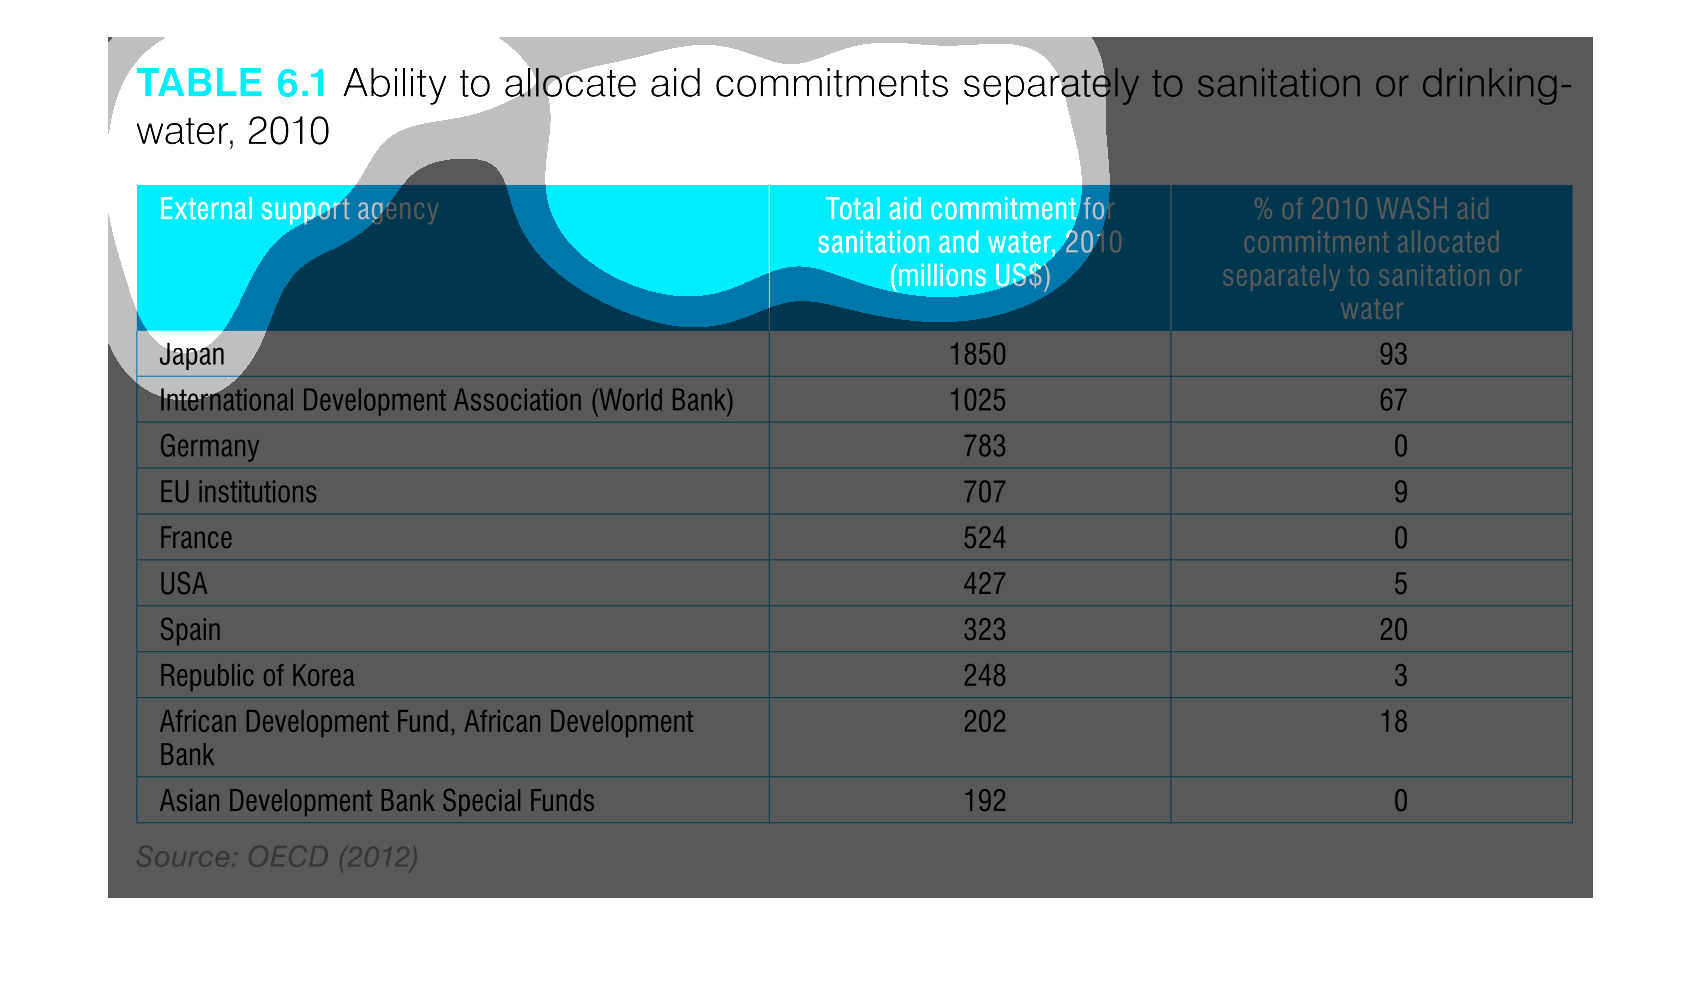
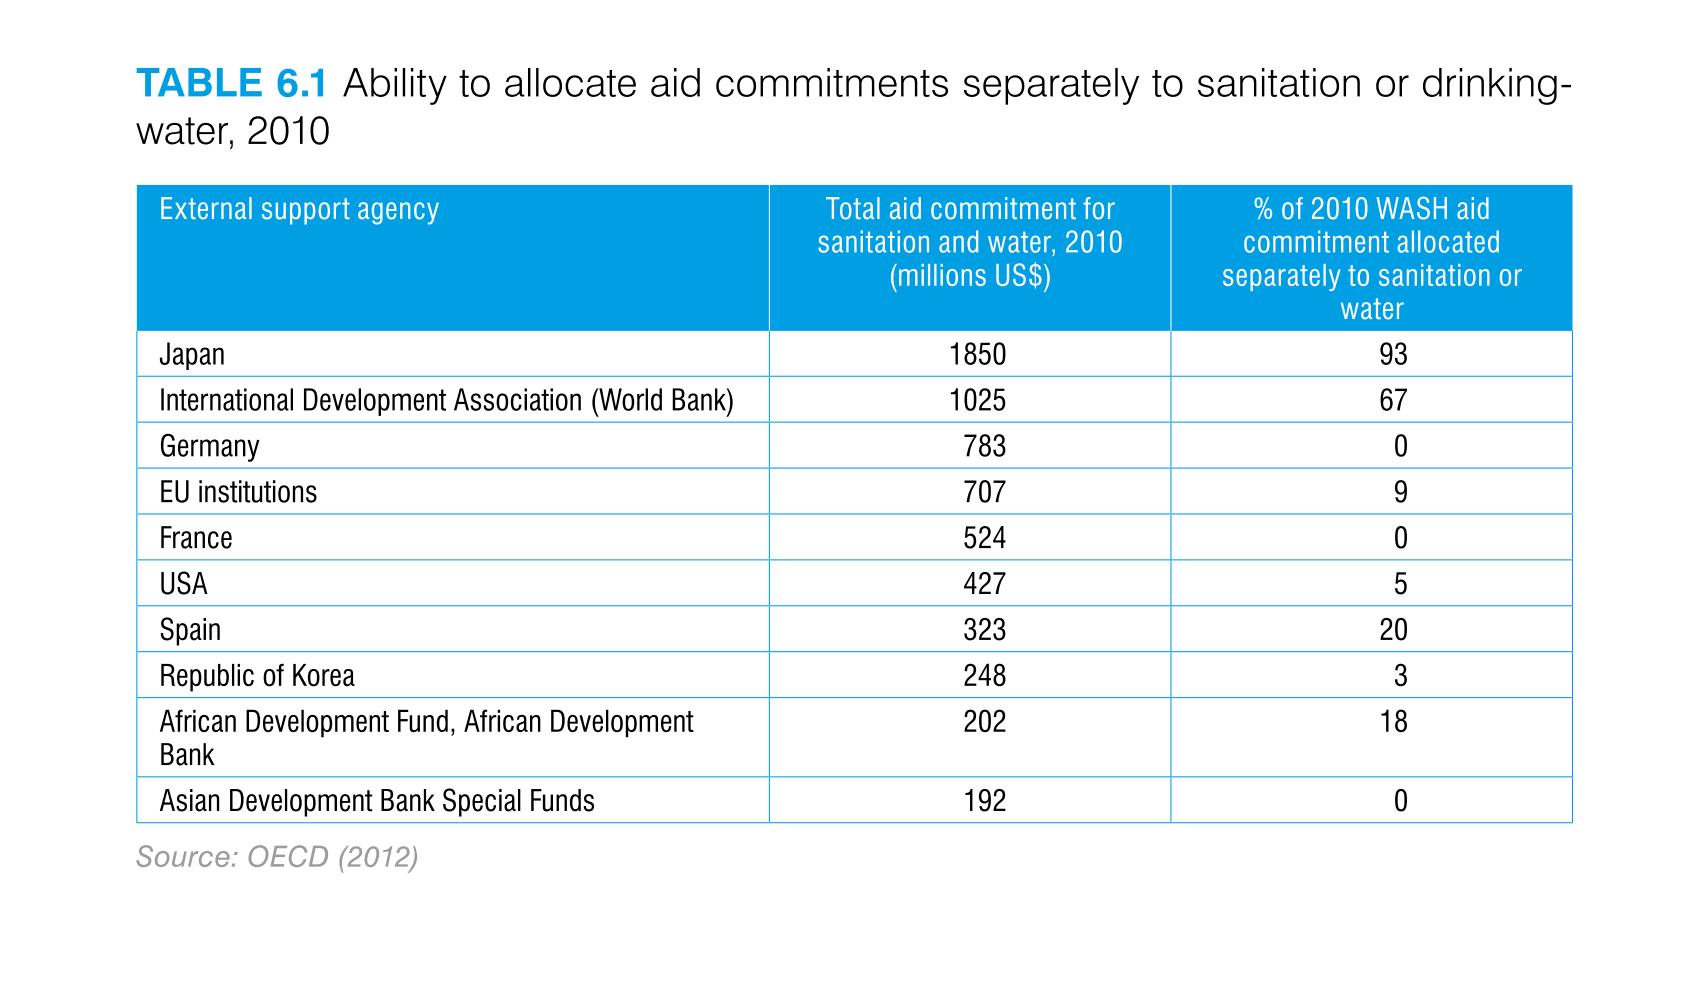
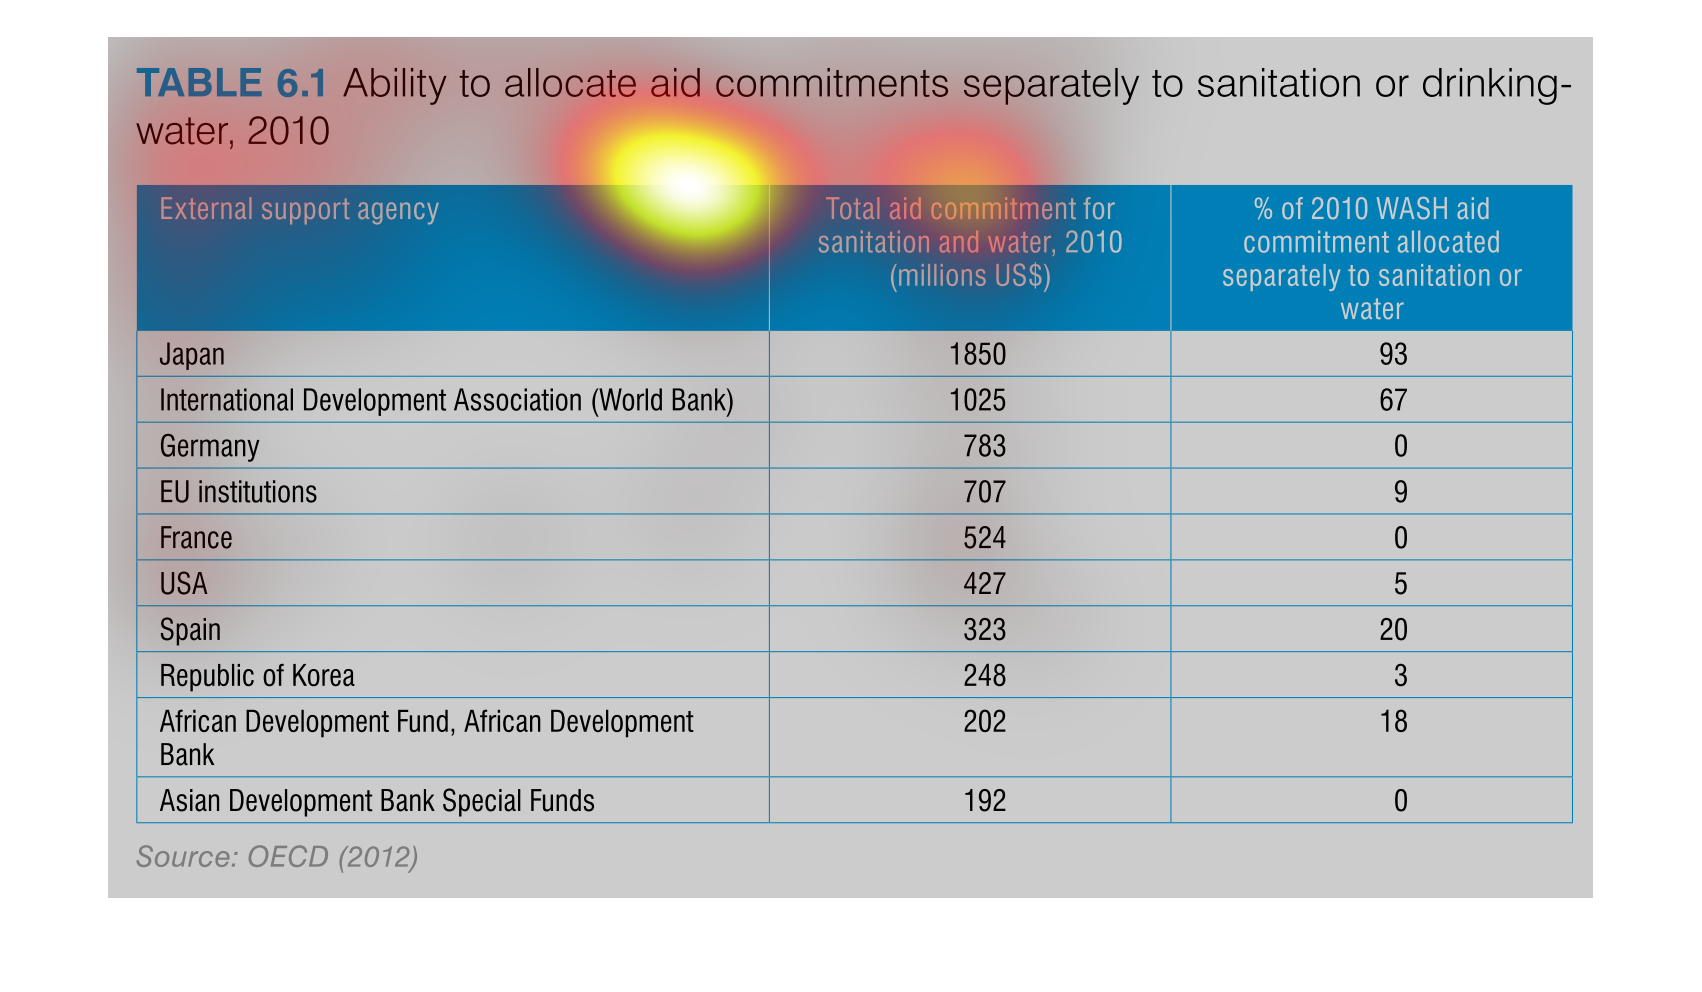
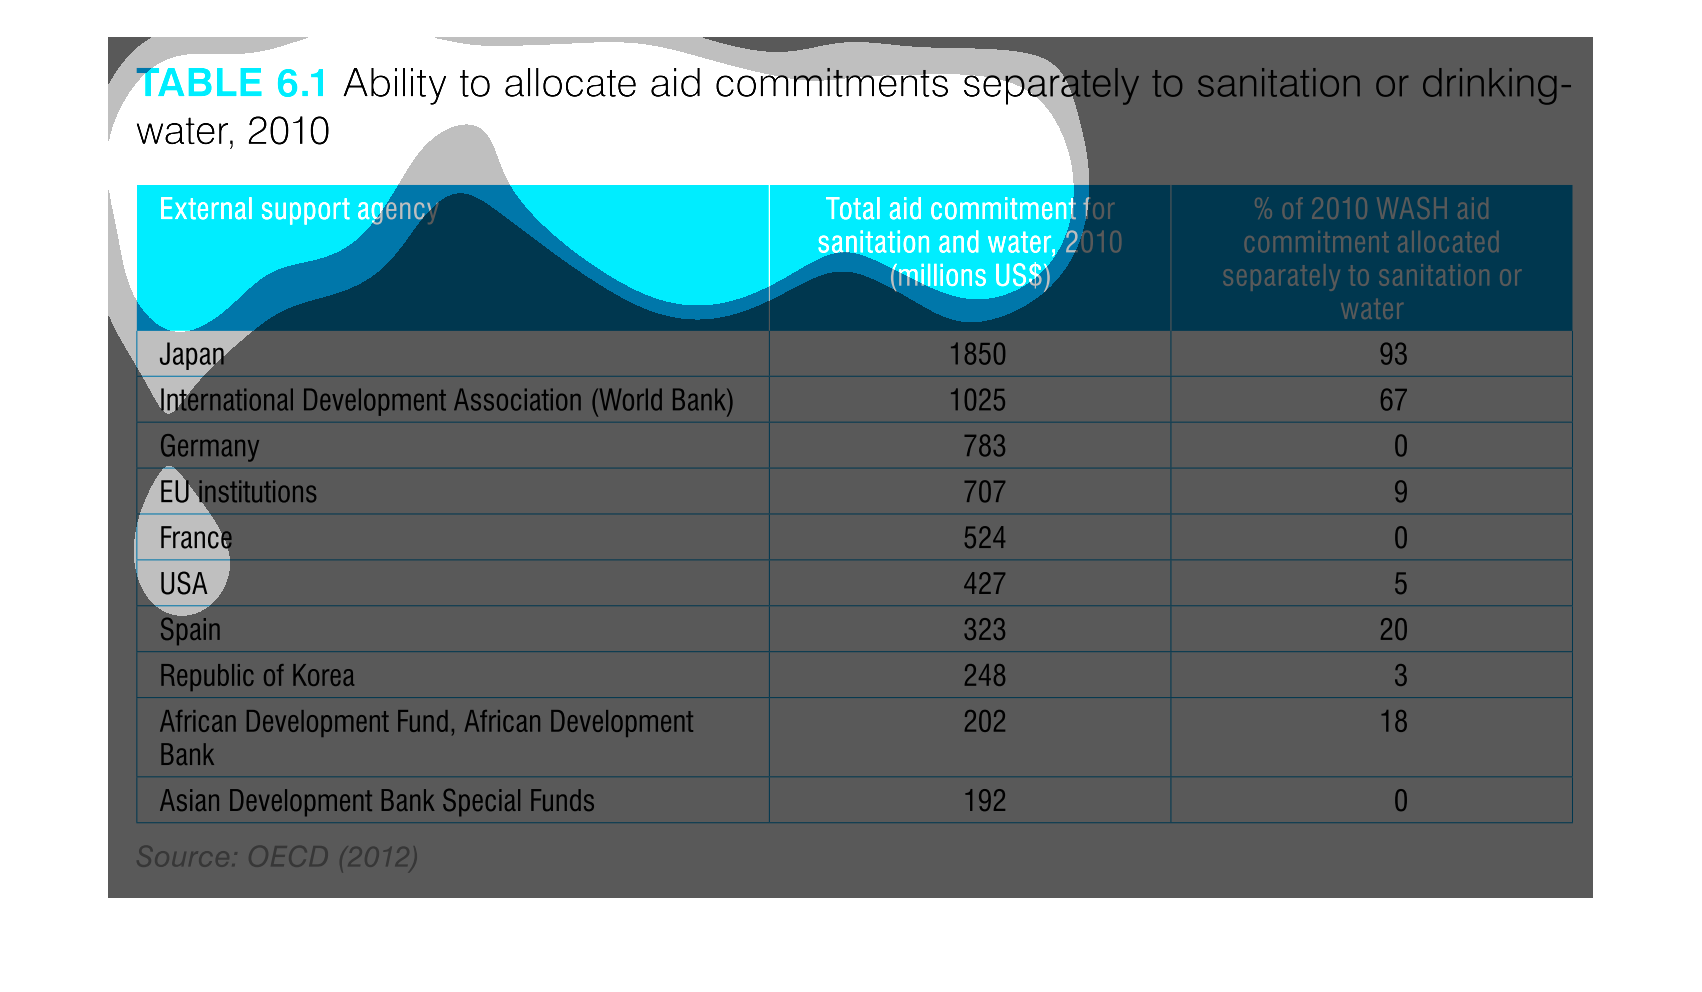
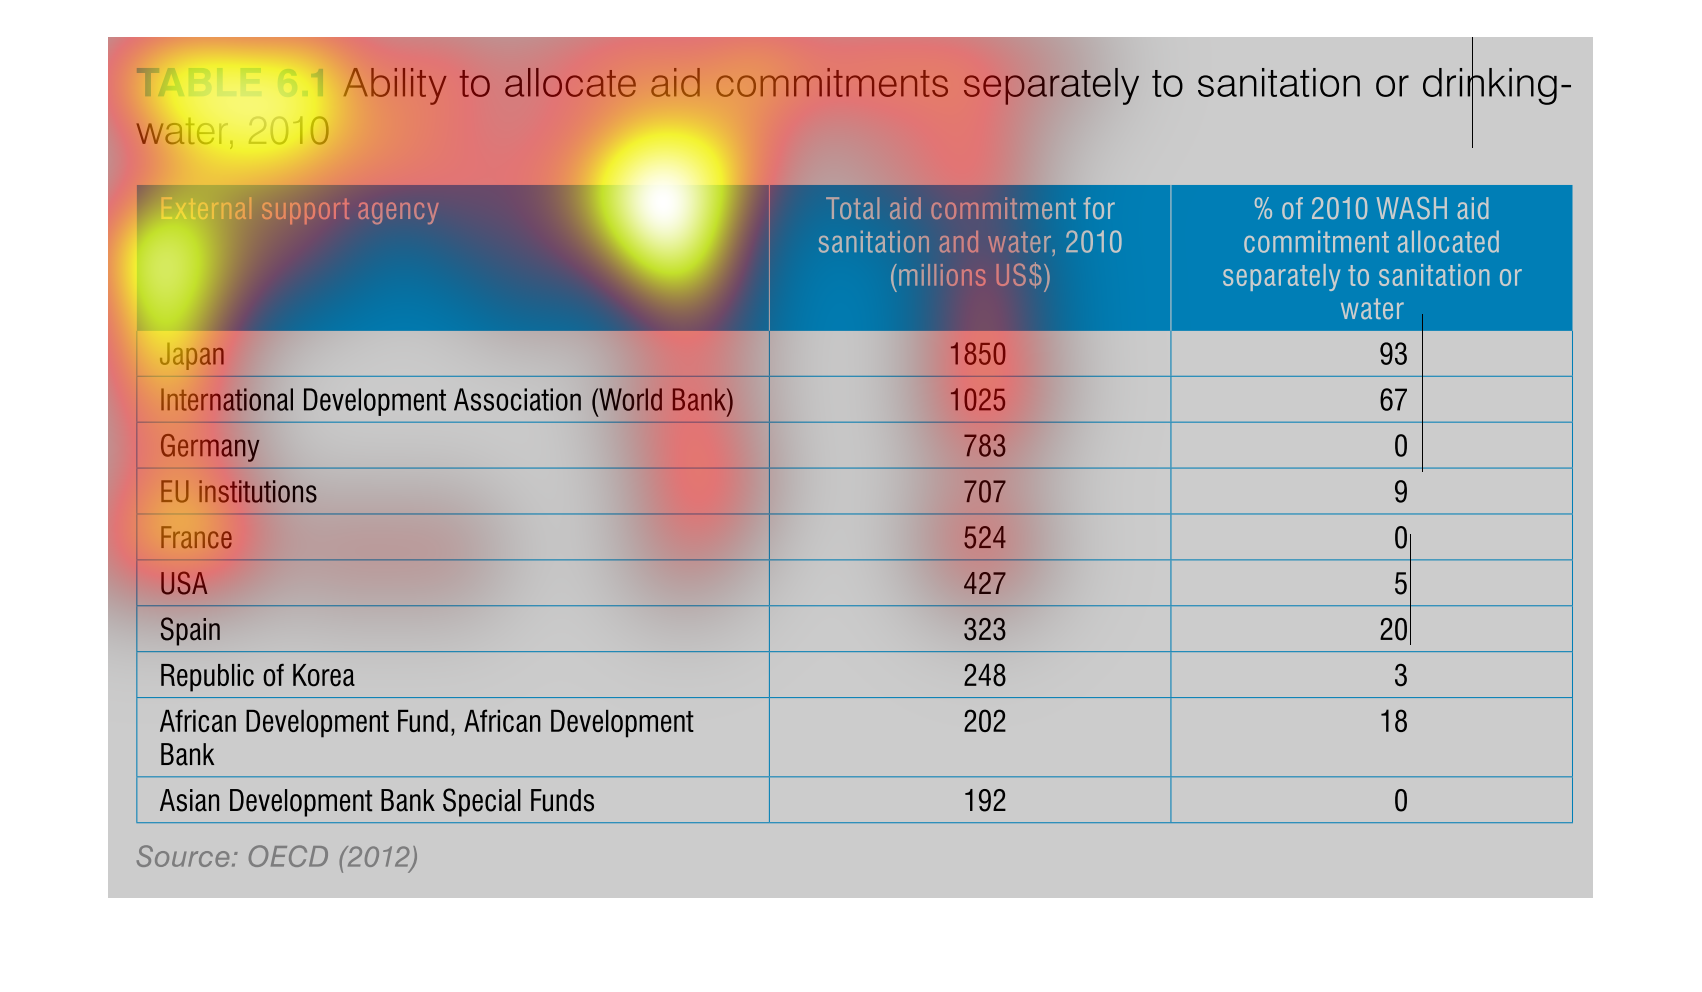
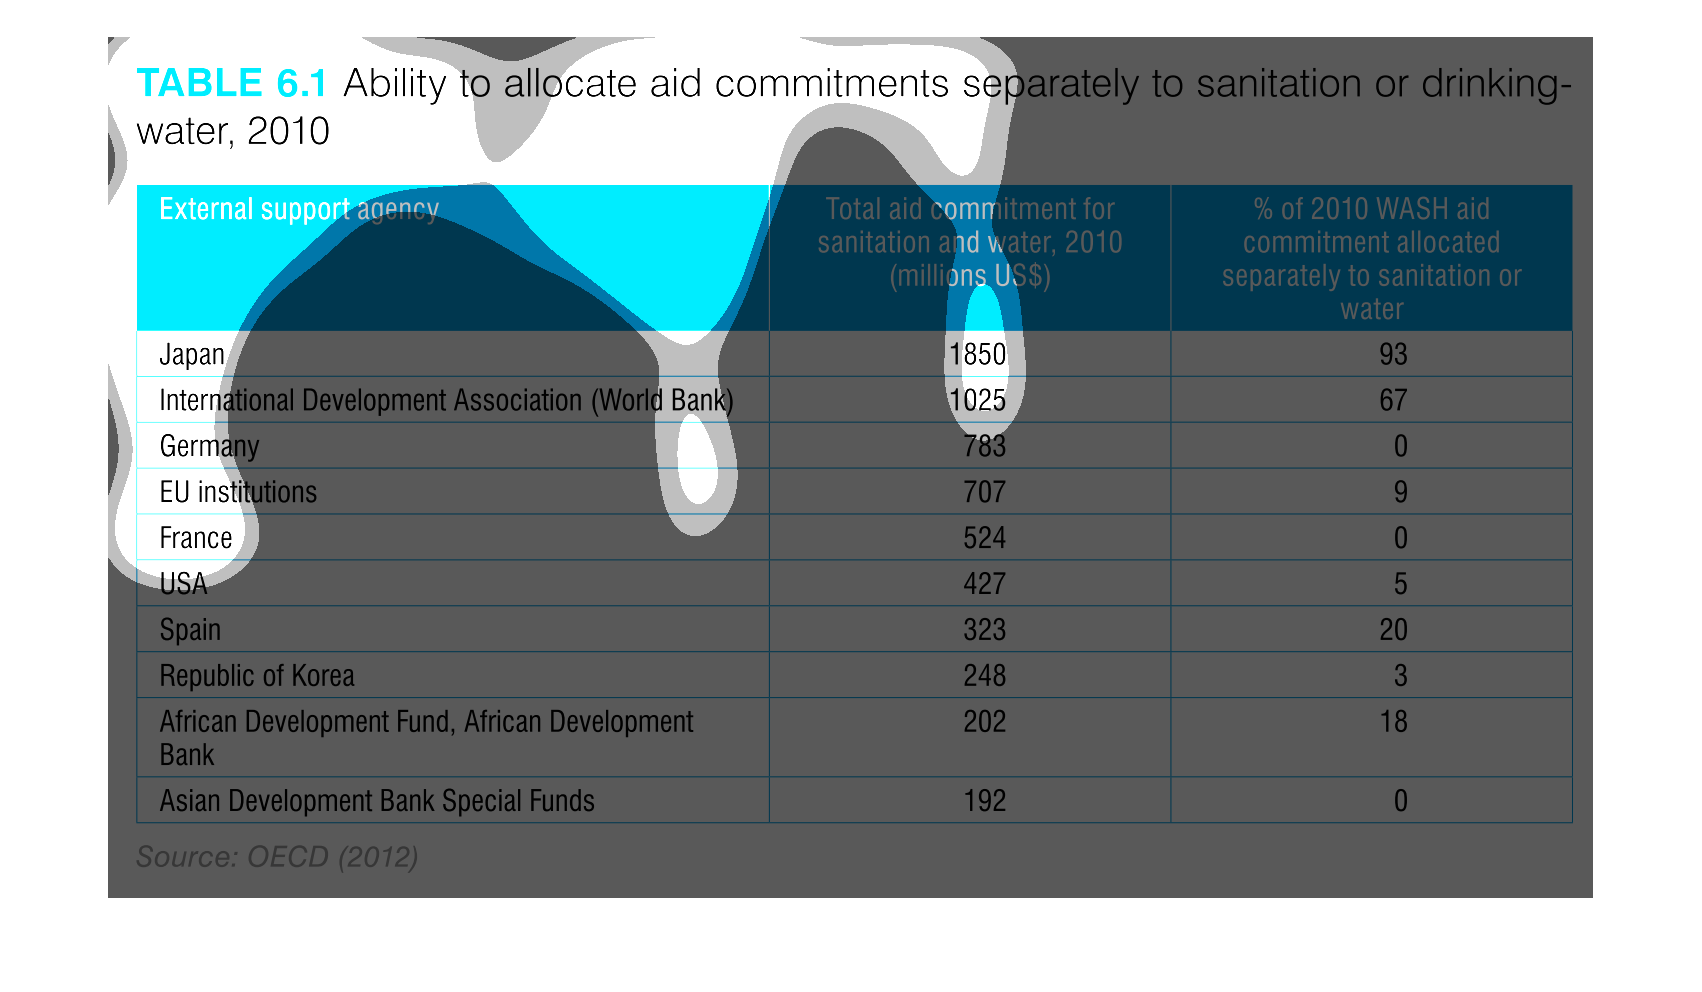
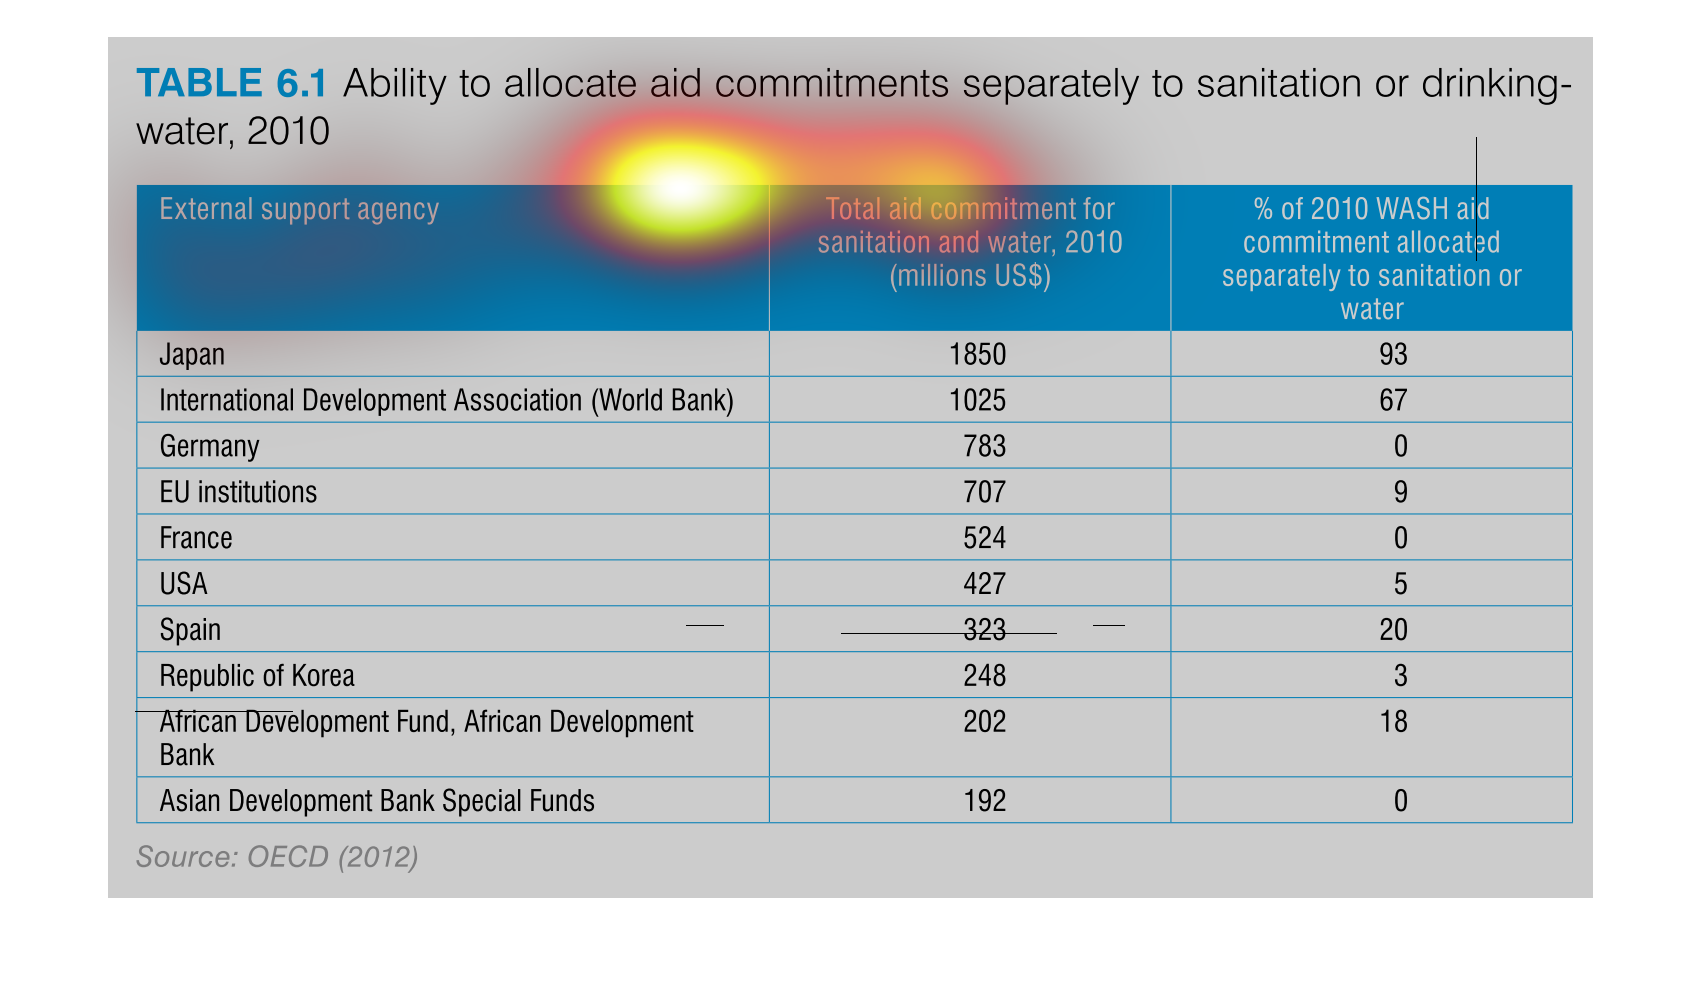
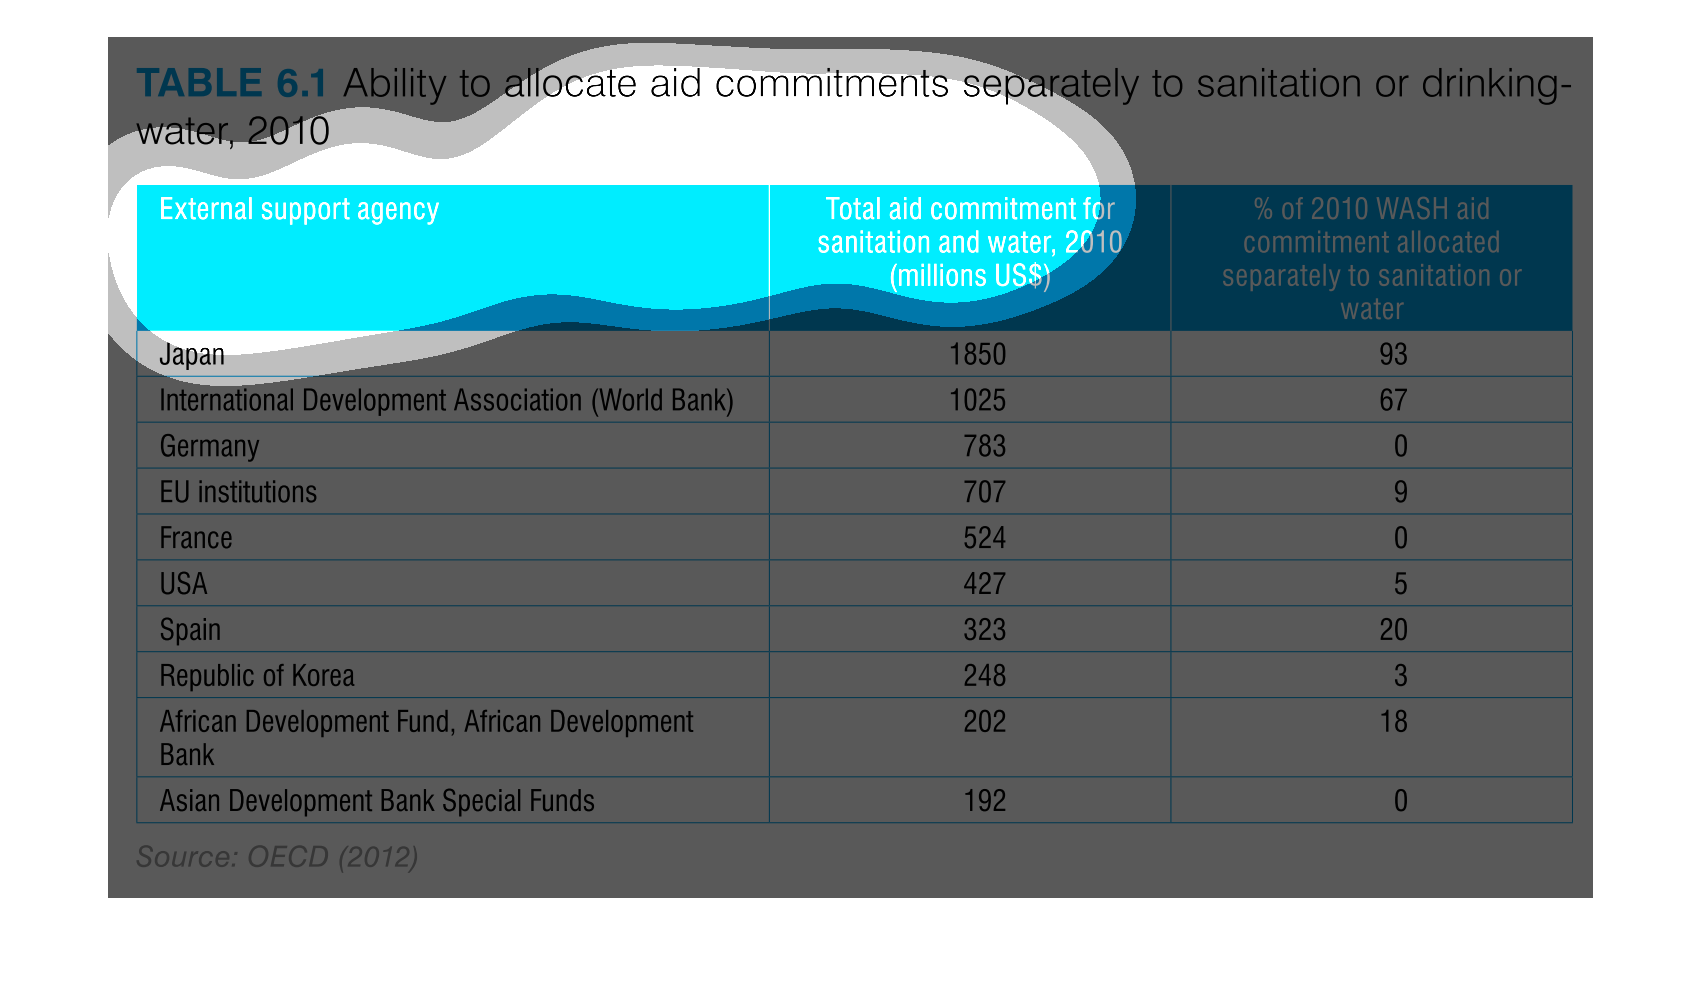
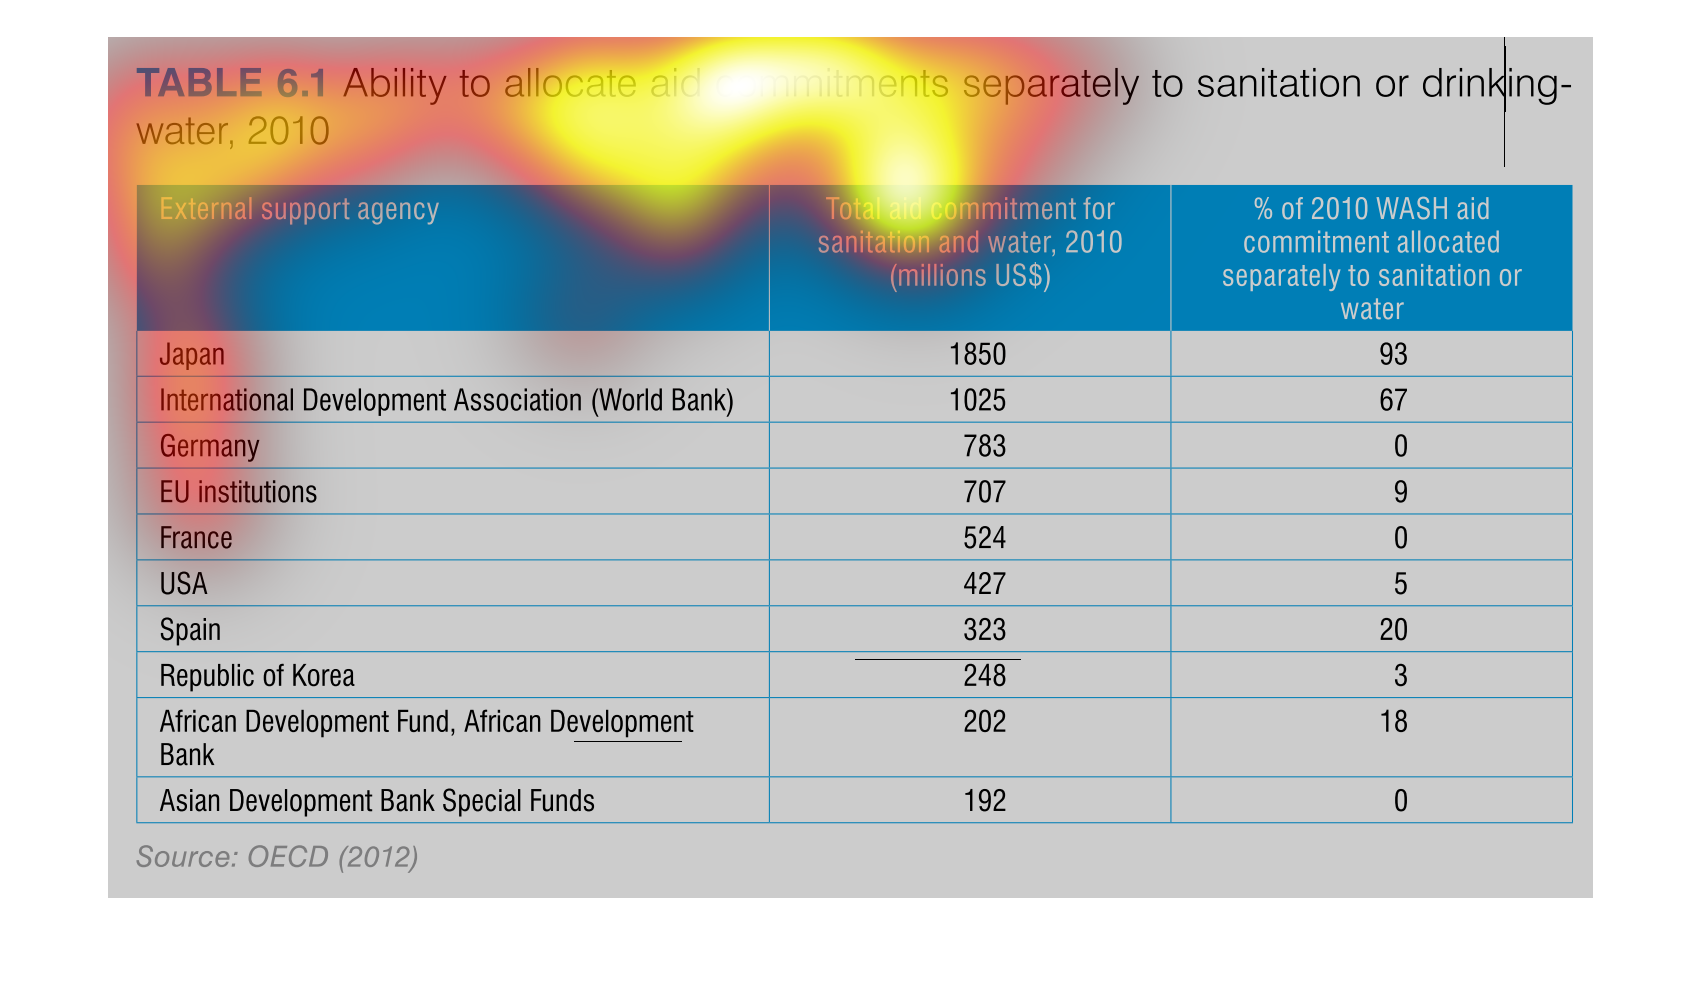
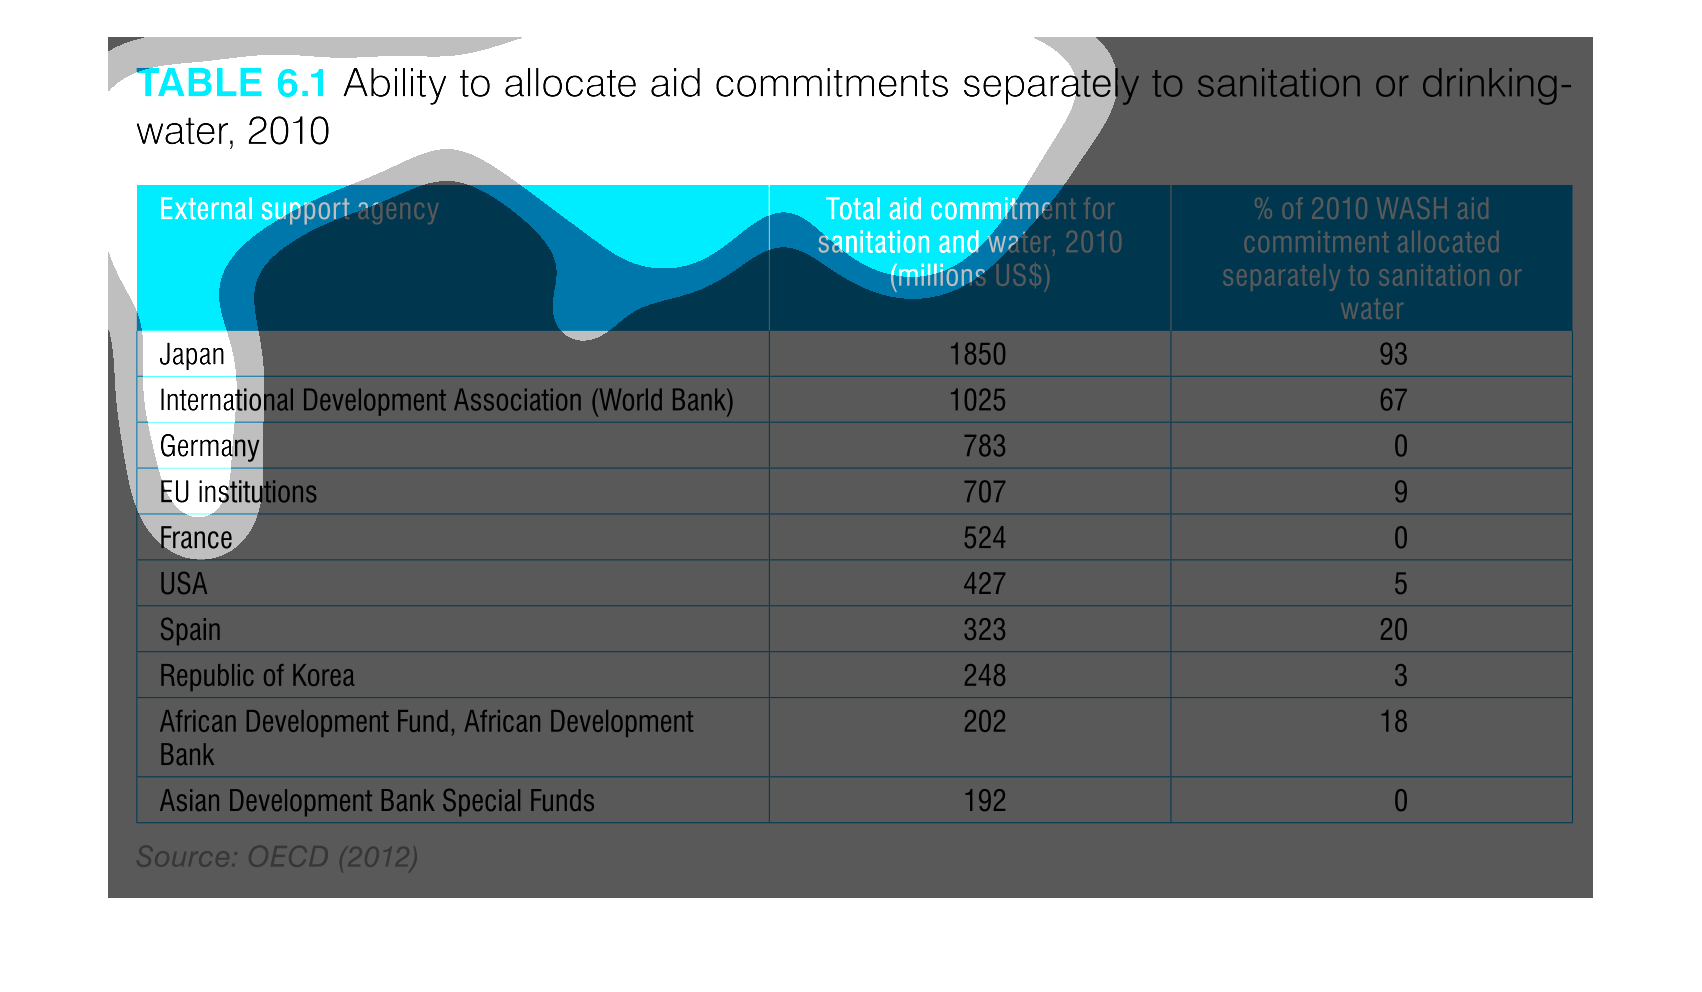
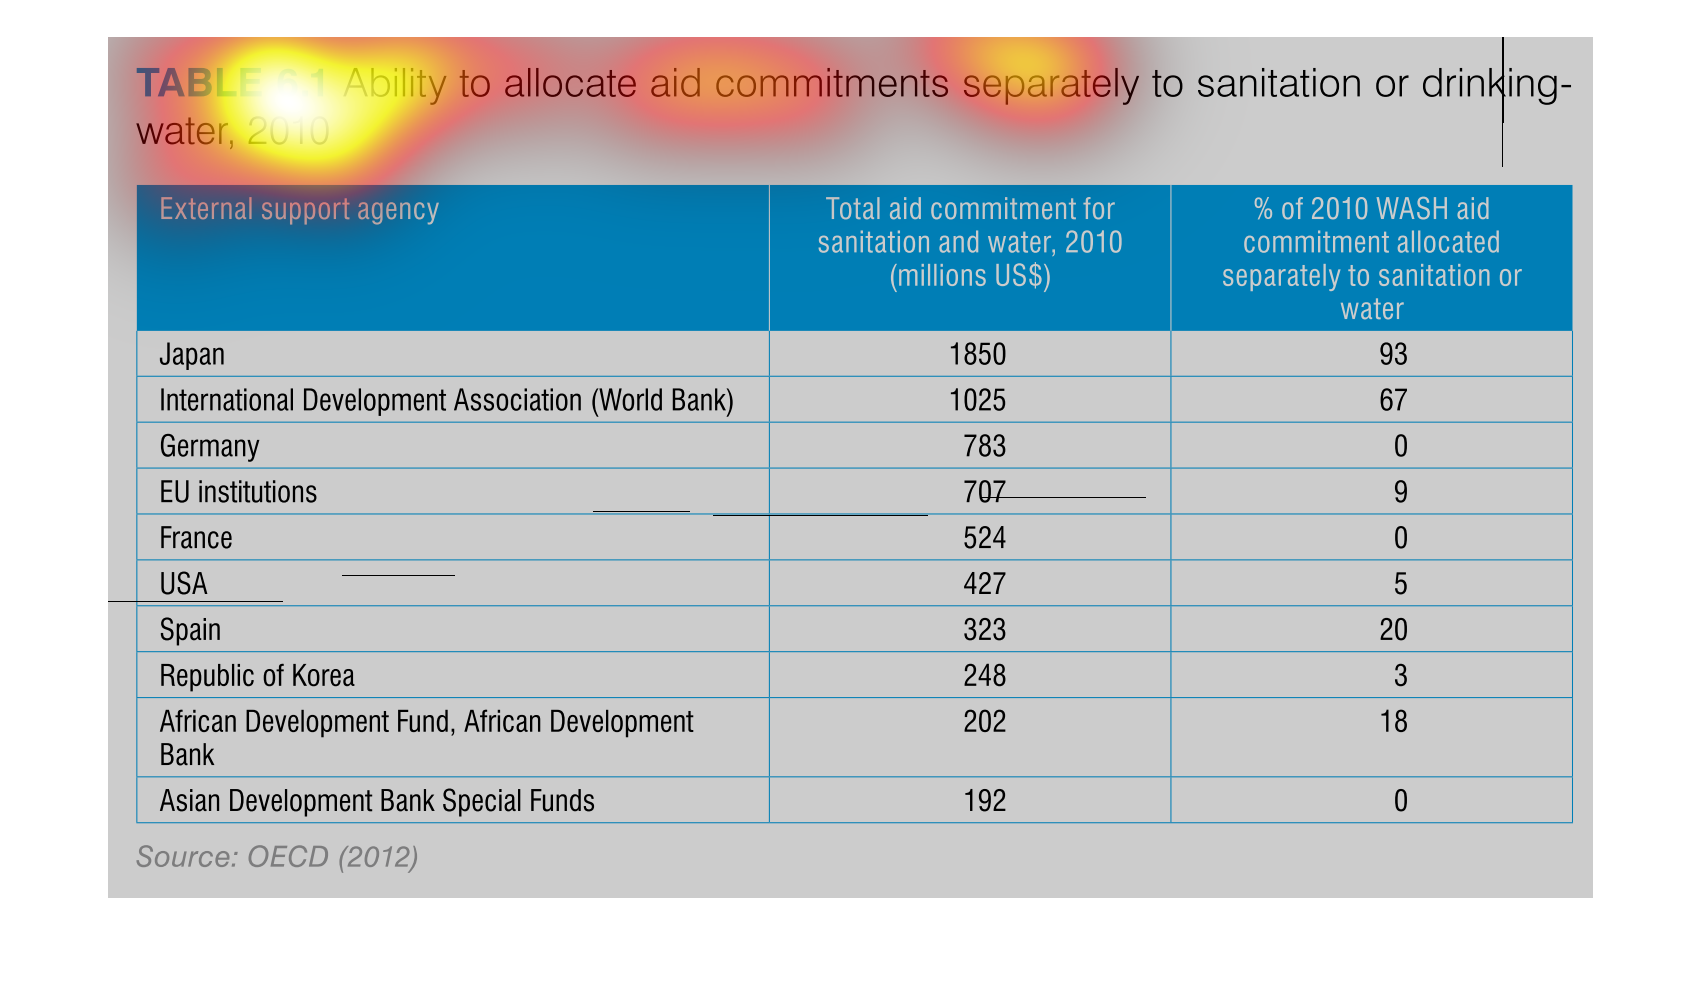
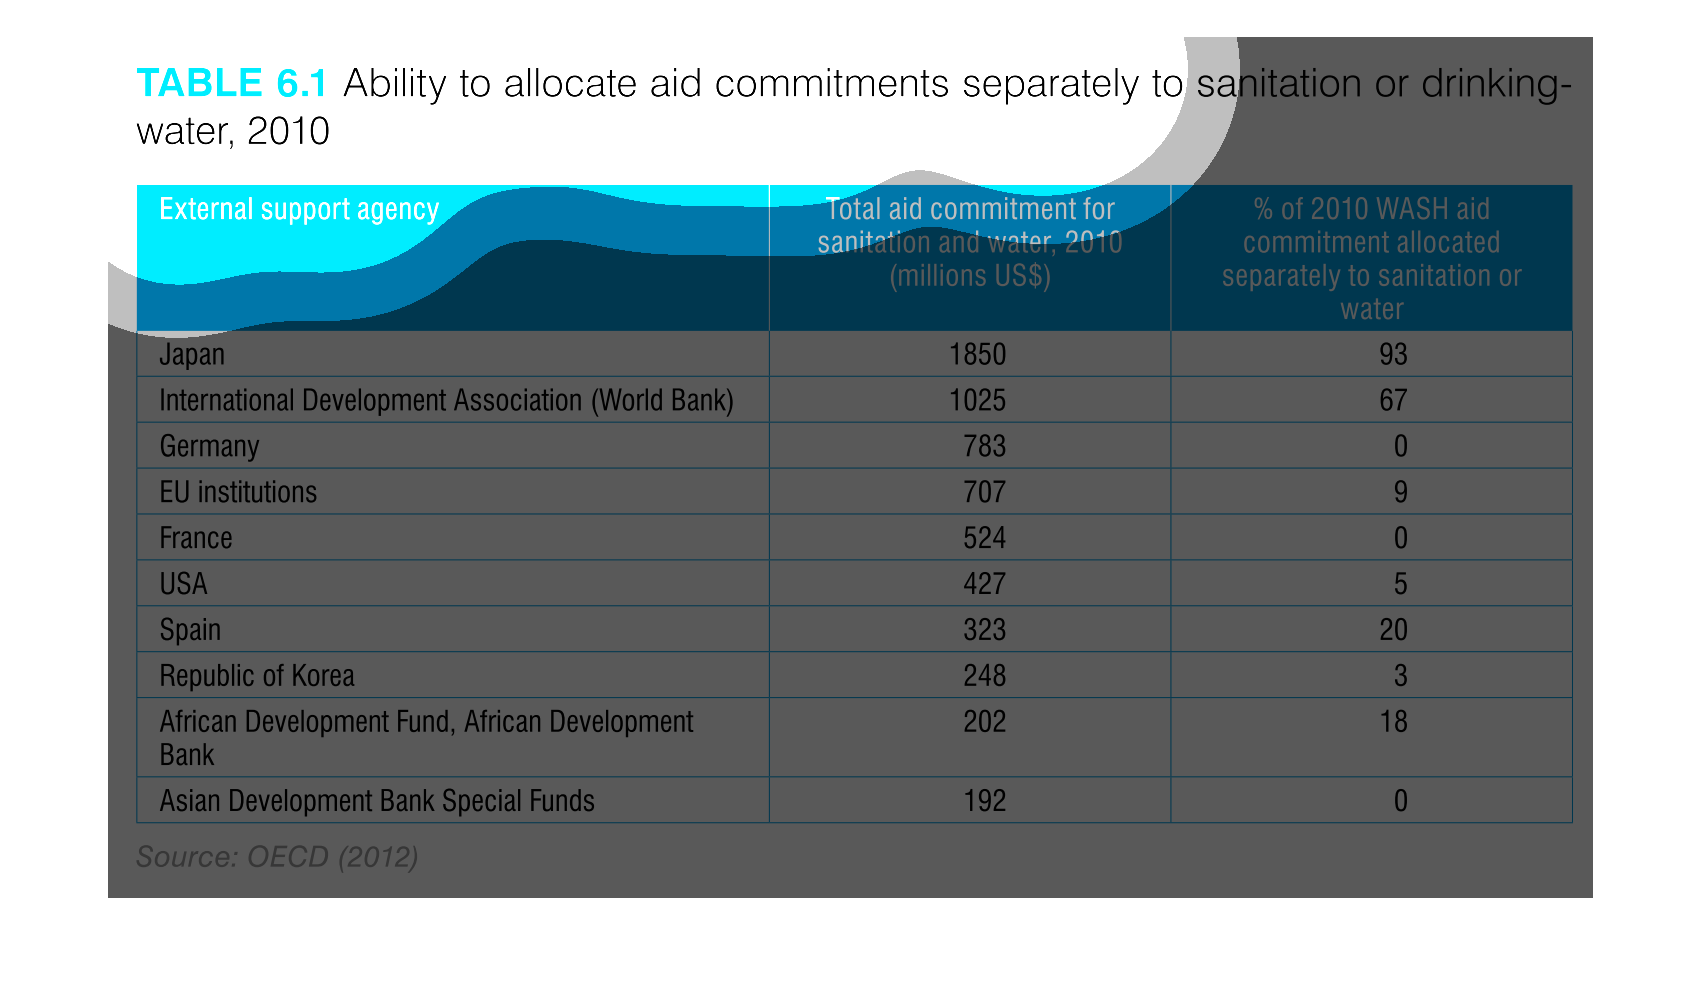
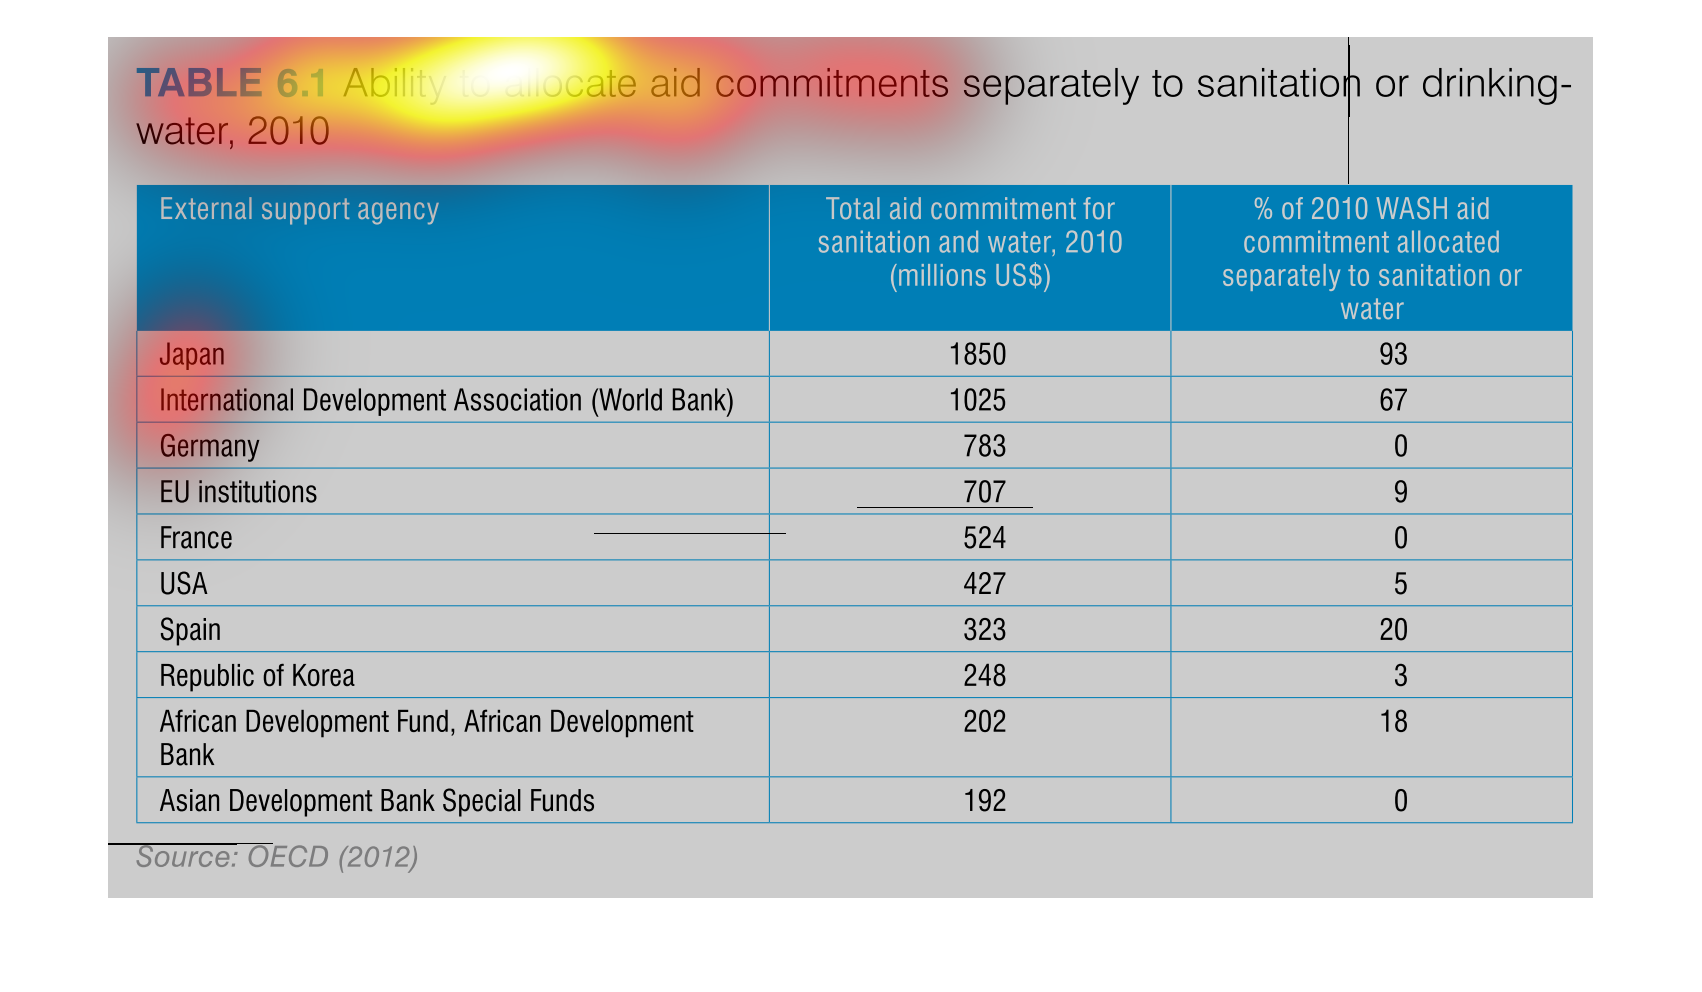
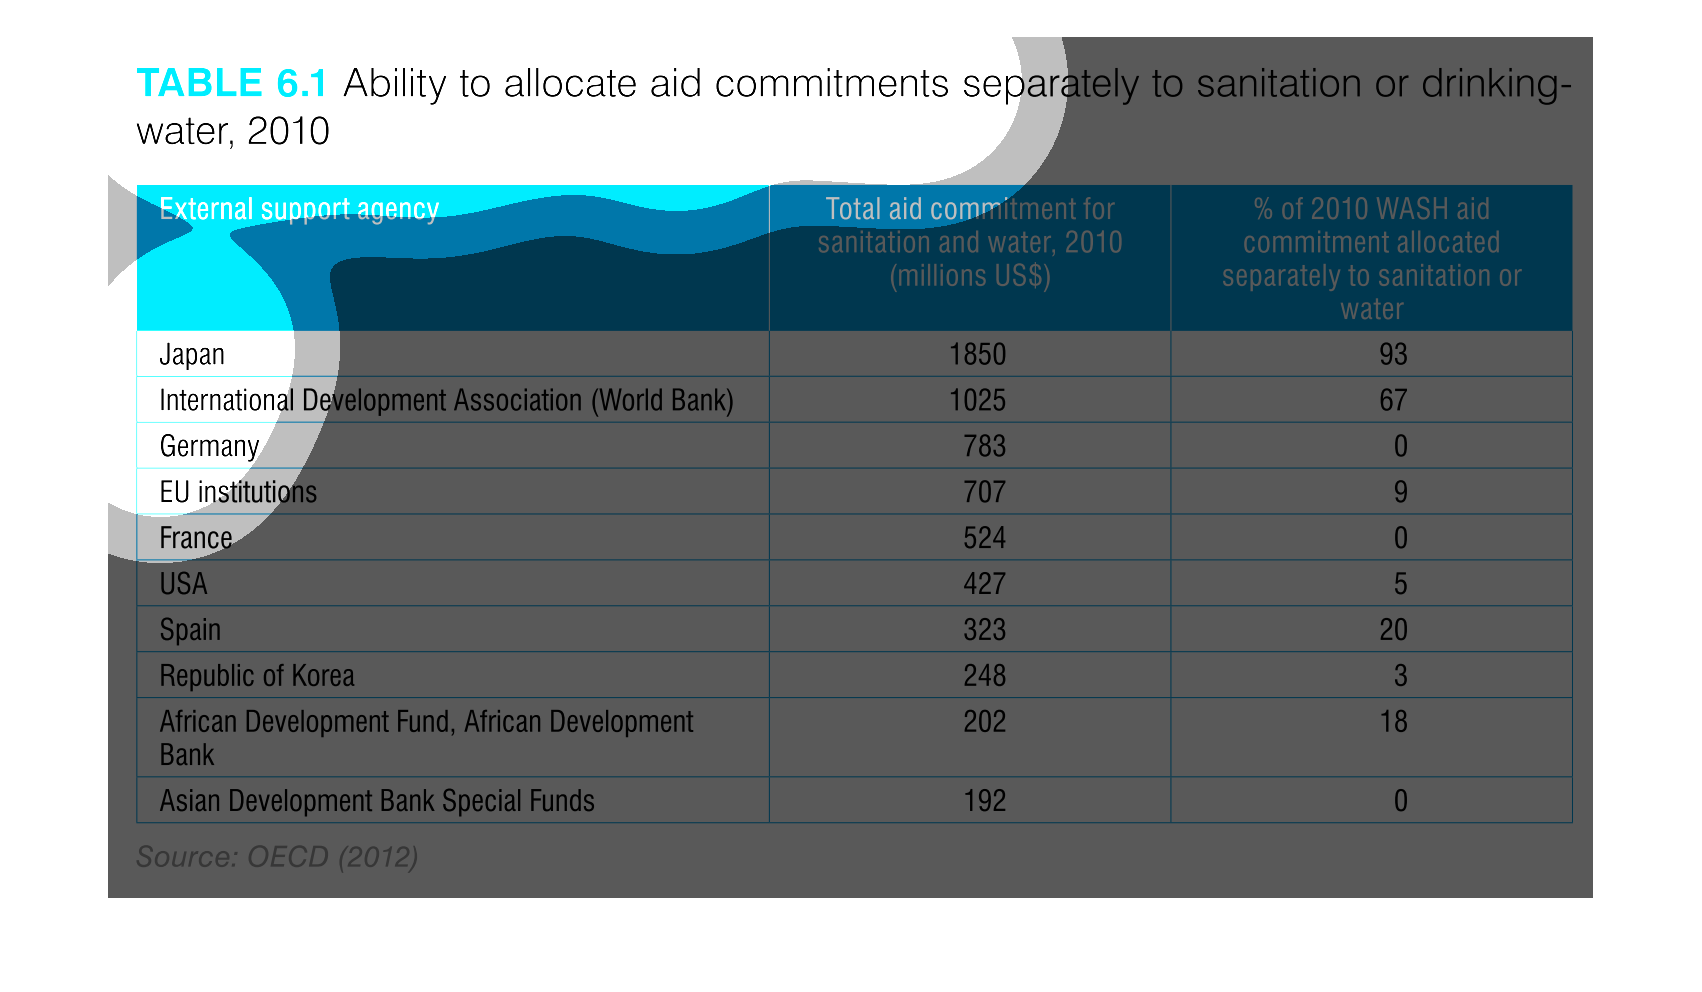
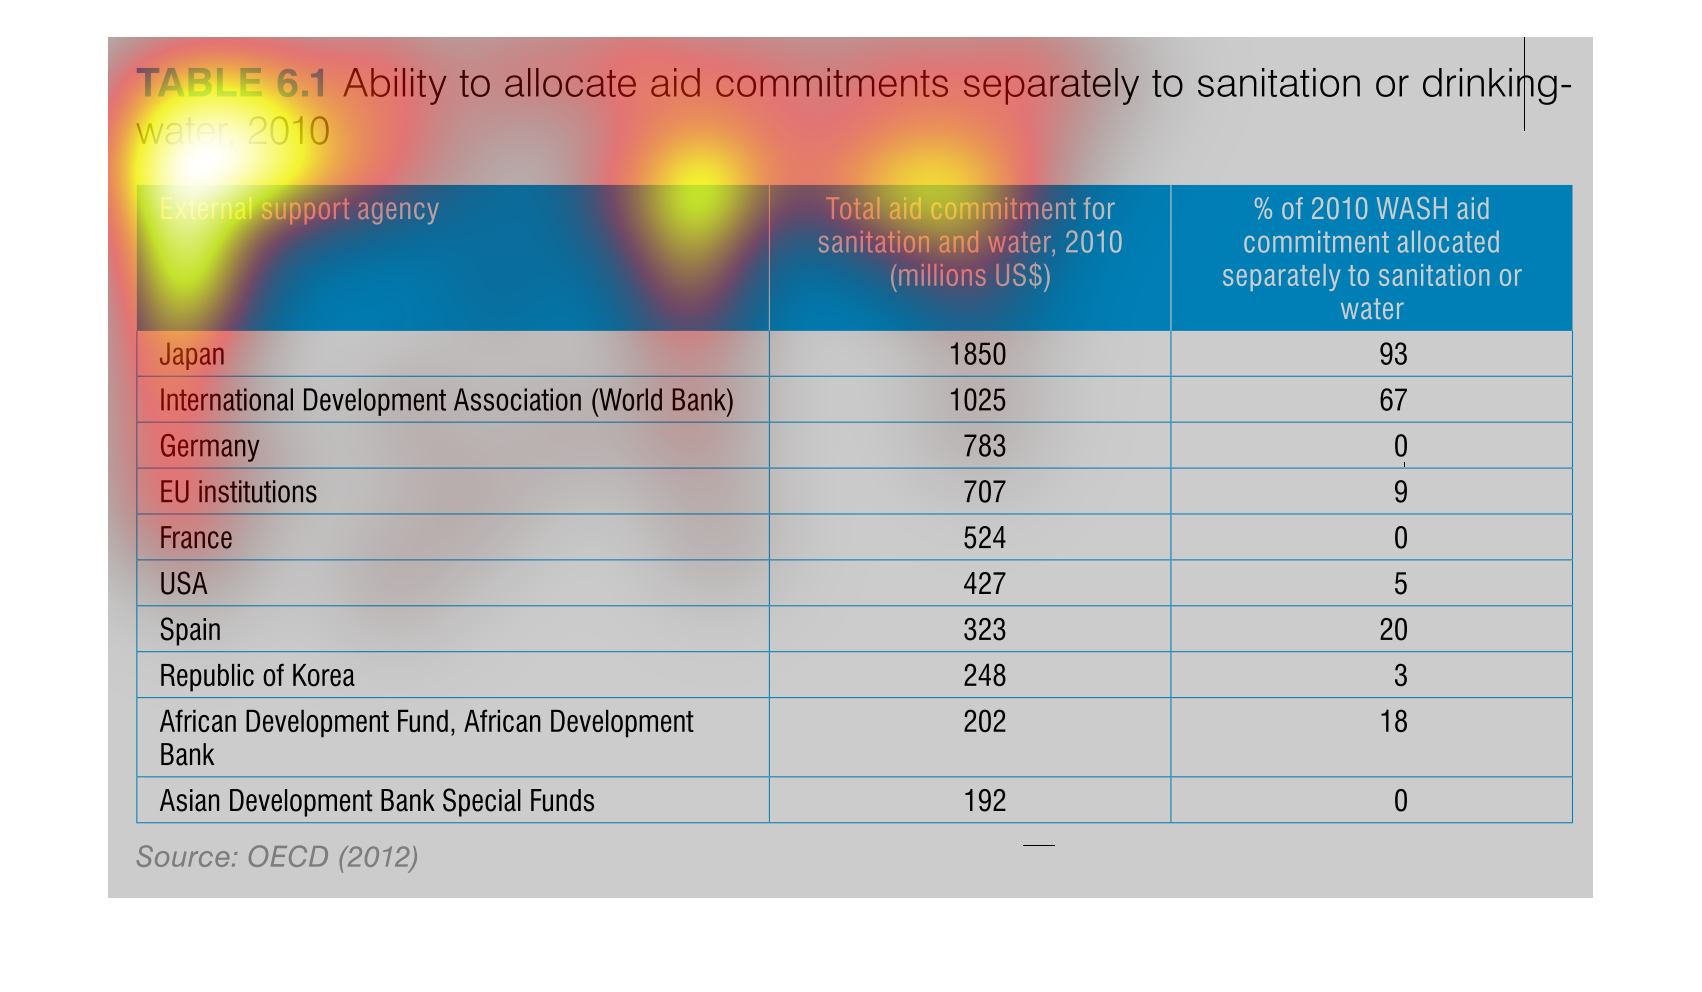
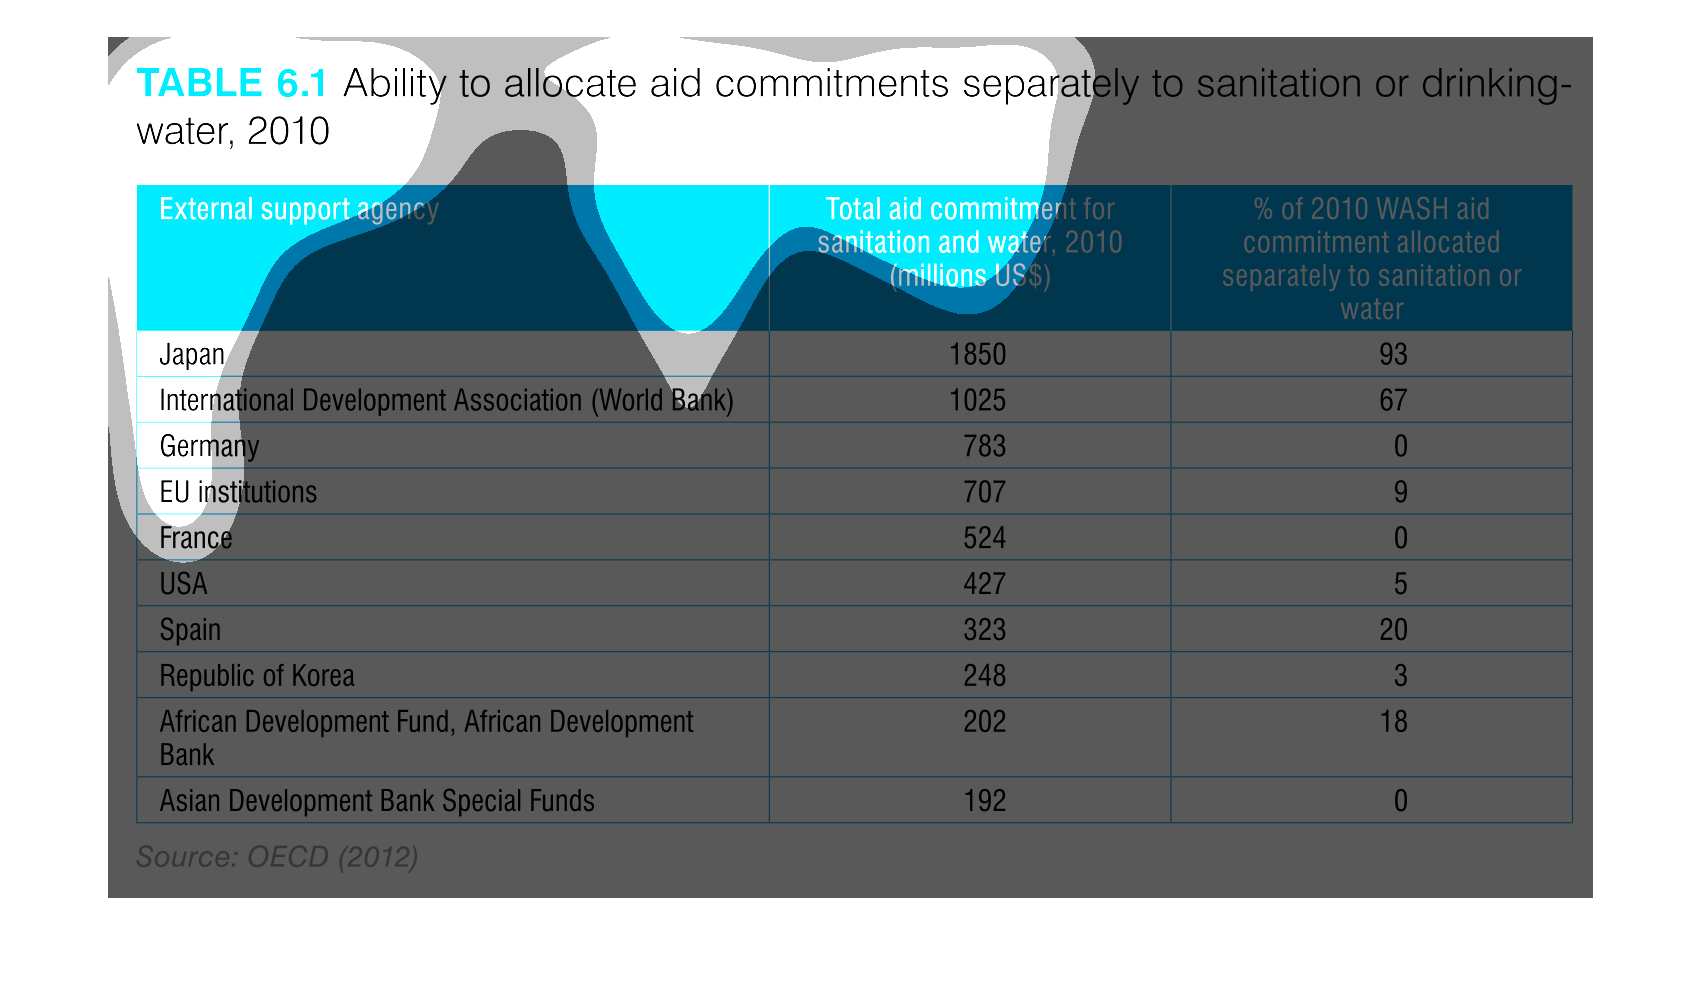
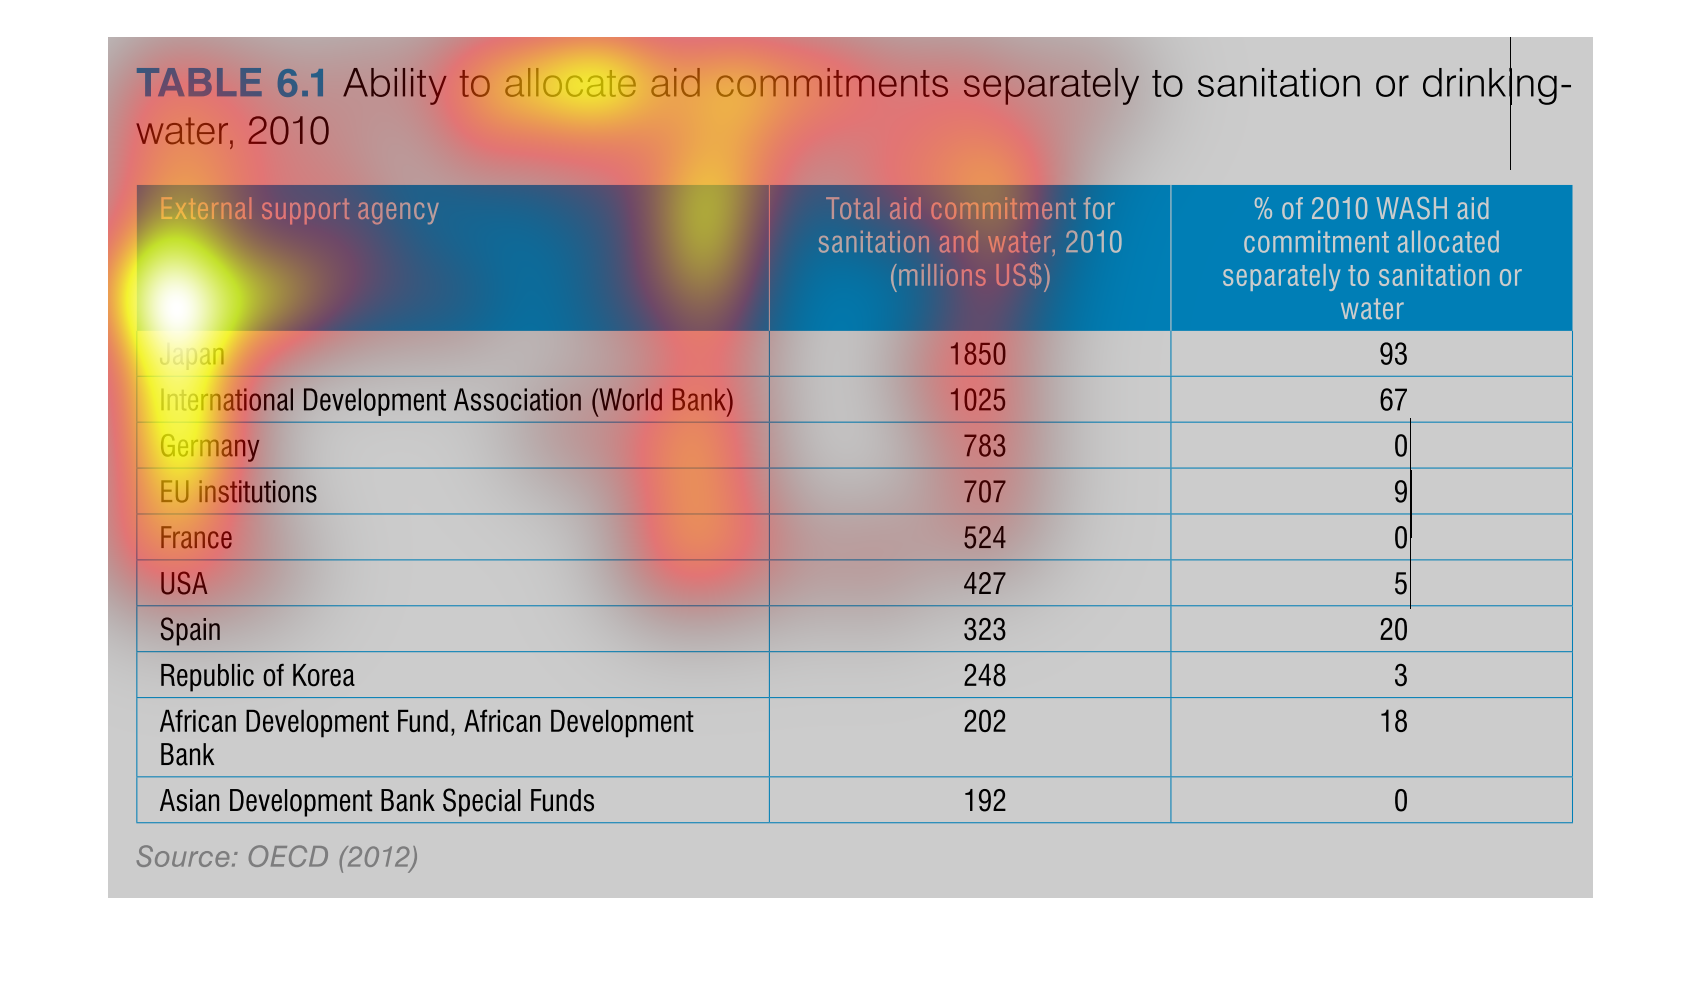
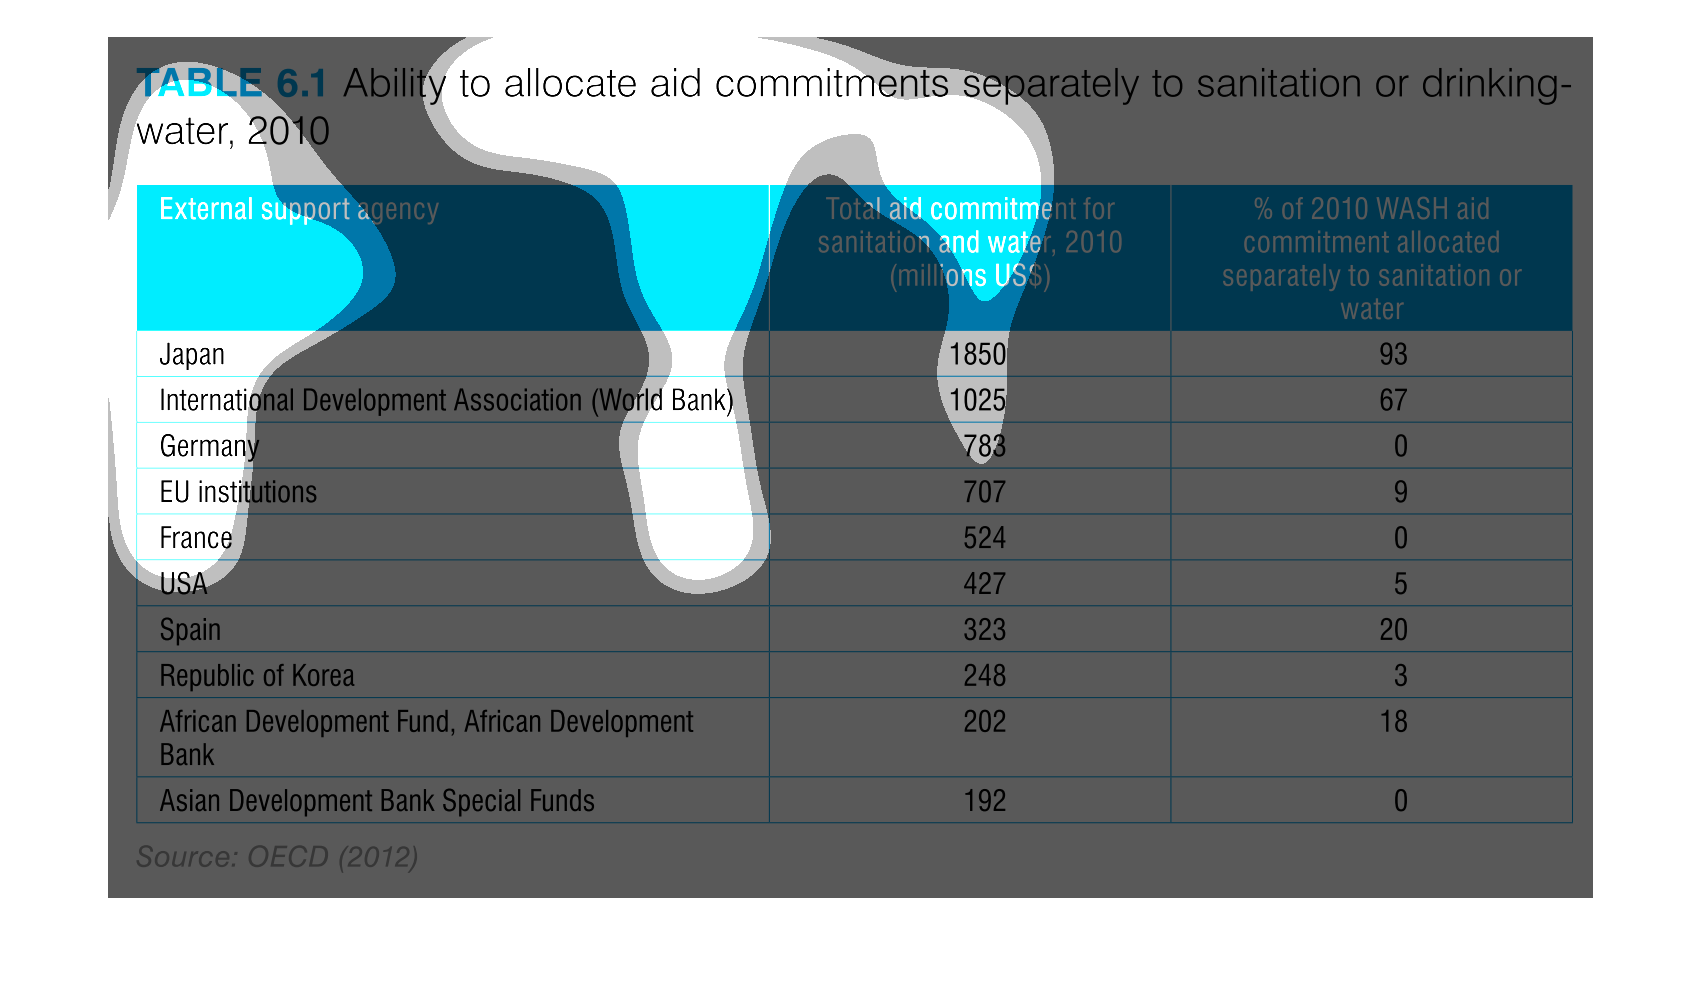
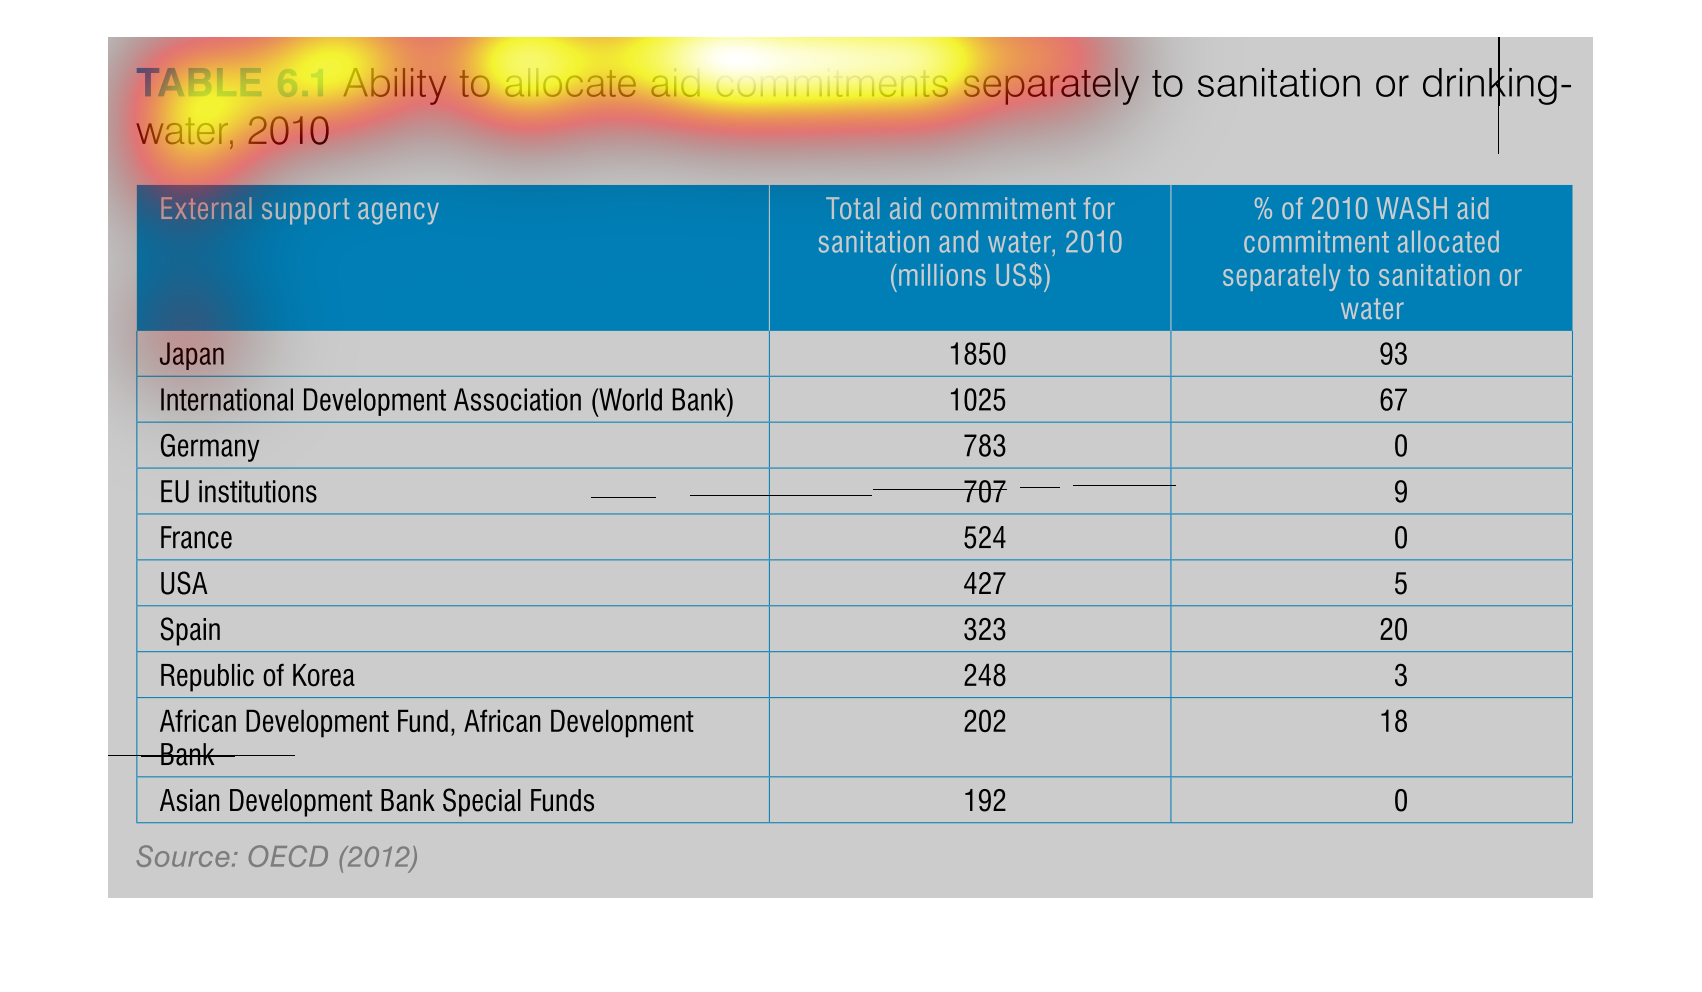
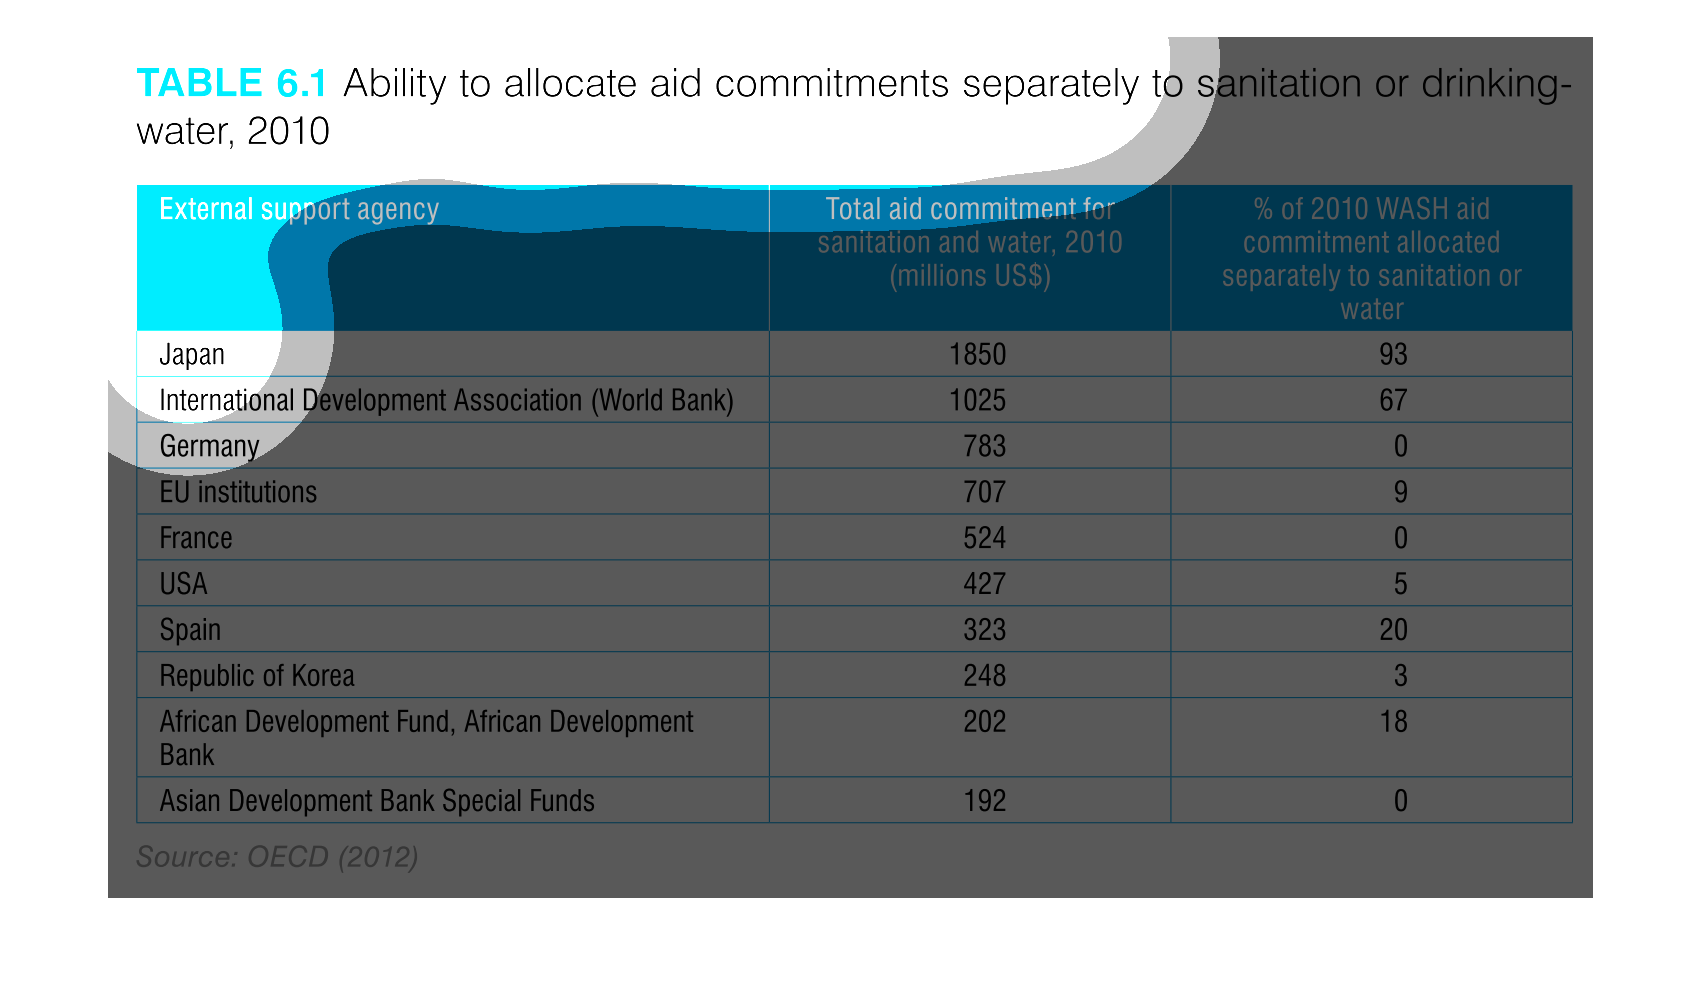
This table covers money spent/available for water sanitation. Based on this table, Japan is,
by far, spending the most money on water sanitation ($1.8 million).
It is a graph showing the percentage of clean water in a region for the year 2012. And it
is also showing the sanitation of the water used for cleaning.
This chart describes ability to allocate aid commitments separately to sanitation or drinking
water, for the year 2010. Categories include Japan and Germany.
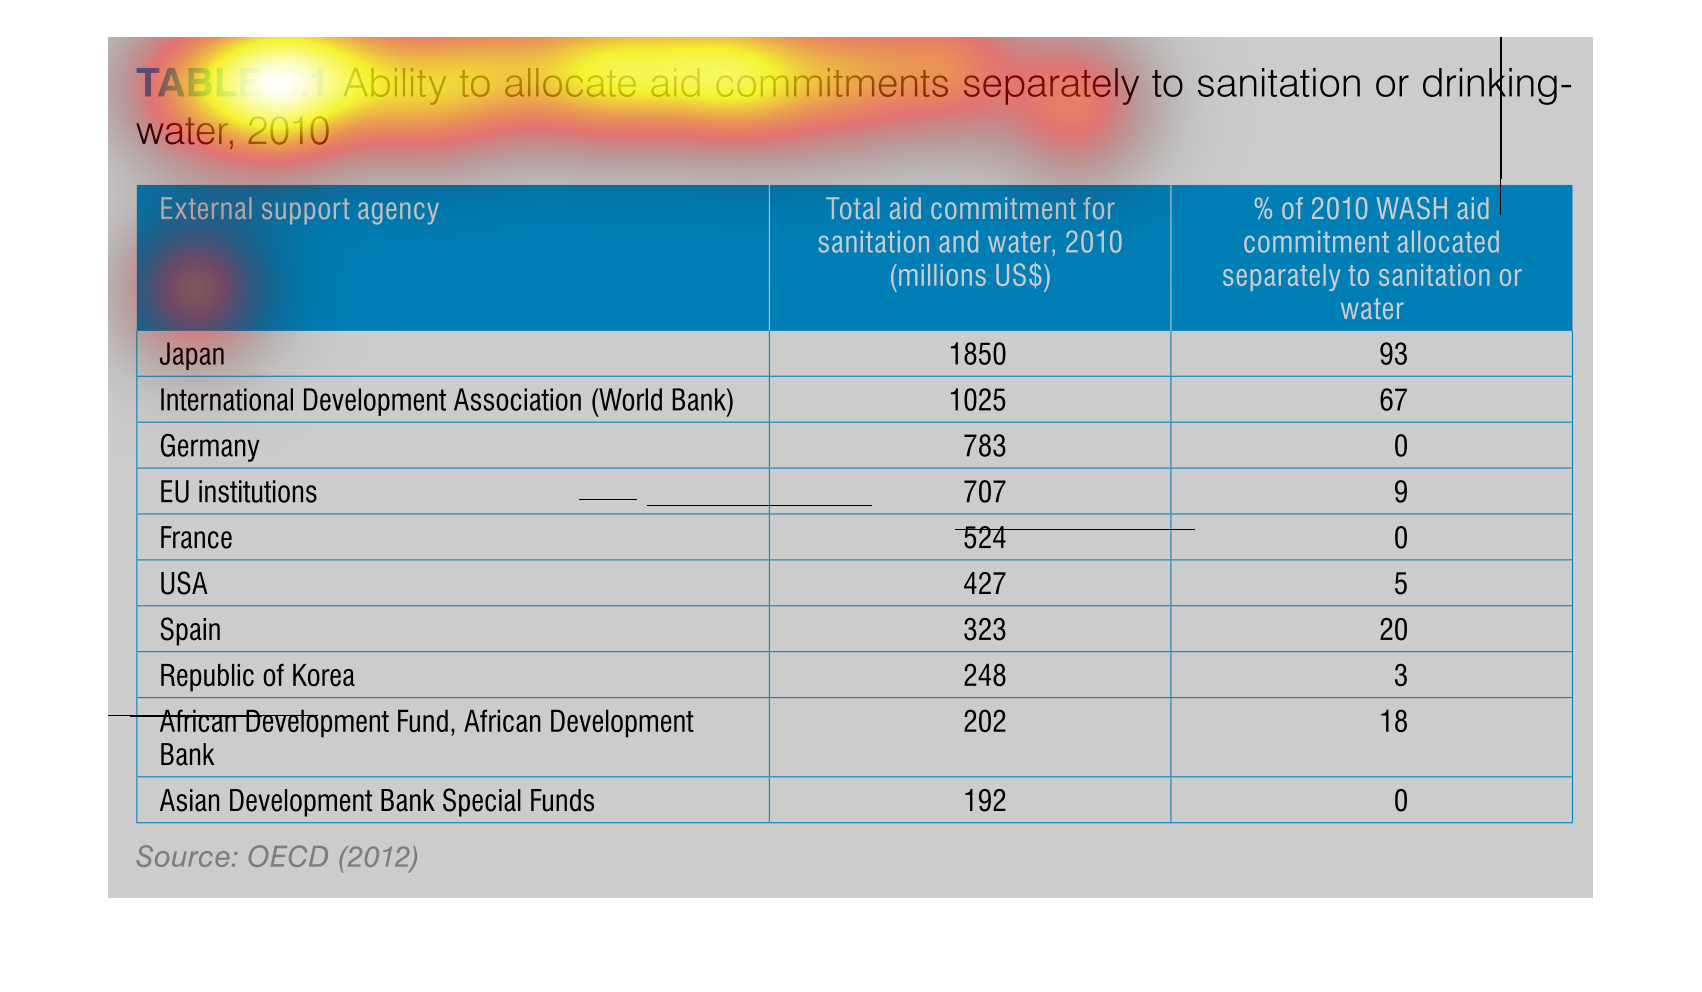
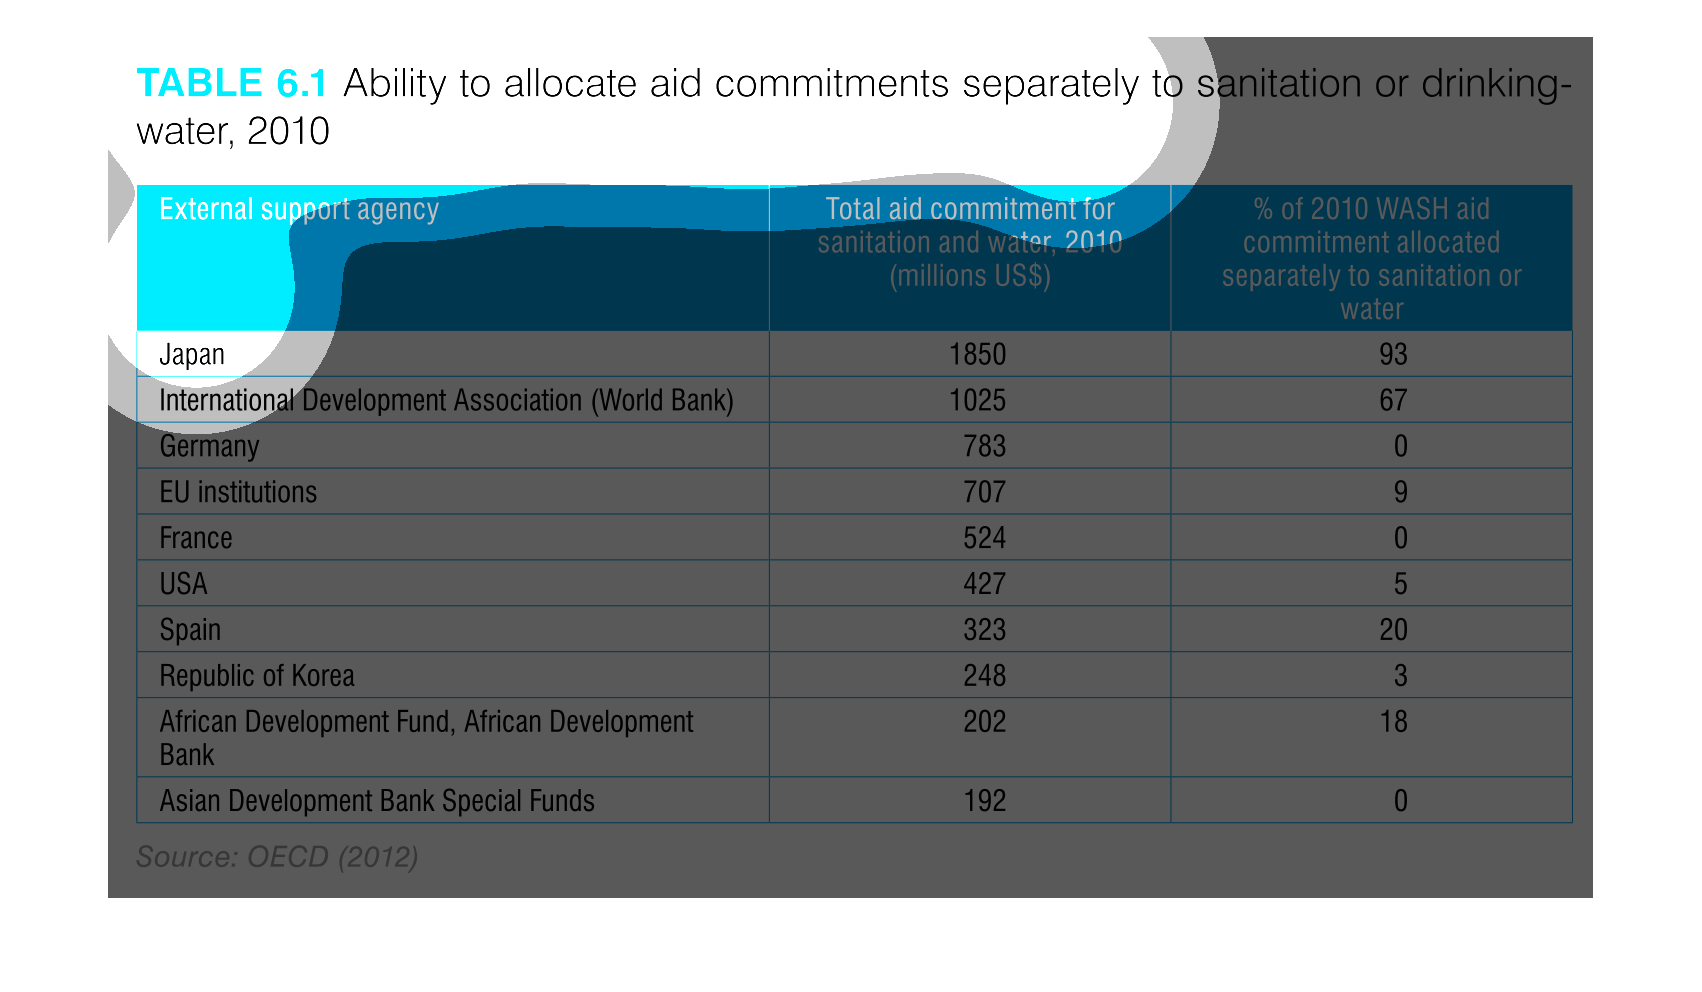
This table shows the ability to deliver aid, specifically sanitation and drinking water. It
has the different countries and agencies in one column, their total donations in millions
of dollars in another, and finally their % in 2010 WASH aid that was specficially allocated
for water.
The figure presented is titled table 6.1 ability to allocate  commitments separately to sanitation
of drinking water.  The figure is a representation of drinking water data.
This graph is showing how to allocate comments  to sanitation this is a chart and it has all
the countries name and numbers so we know who has what who needs what.
This chart shows the ability to allocate aid commitments separately to sanitation or drinking
water in 2010 with Japan having the largest total aid committed
This is a chart of a country's ability to aid contaminants separately to sanitation or drinking
water. Data is from 2010. Japan is very high on this list and other all other countries are
significantly lower.
This is a chart that shows the outcome of the ability for various countries to allocate aid
commitments with respect to sanitation and drinking-water in the year 2010.
The 2010 table describes by countries or organizations to allocate and provide aide separately
based by sanitation and drinking water. Japan tops the list at number one.
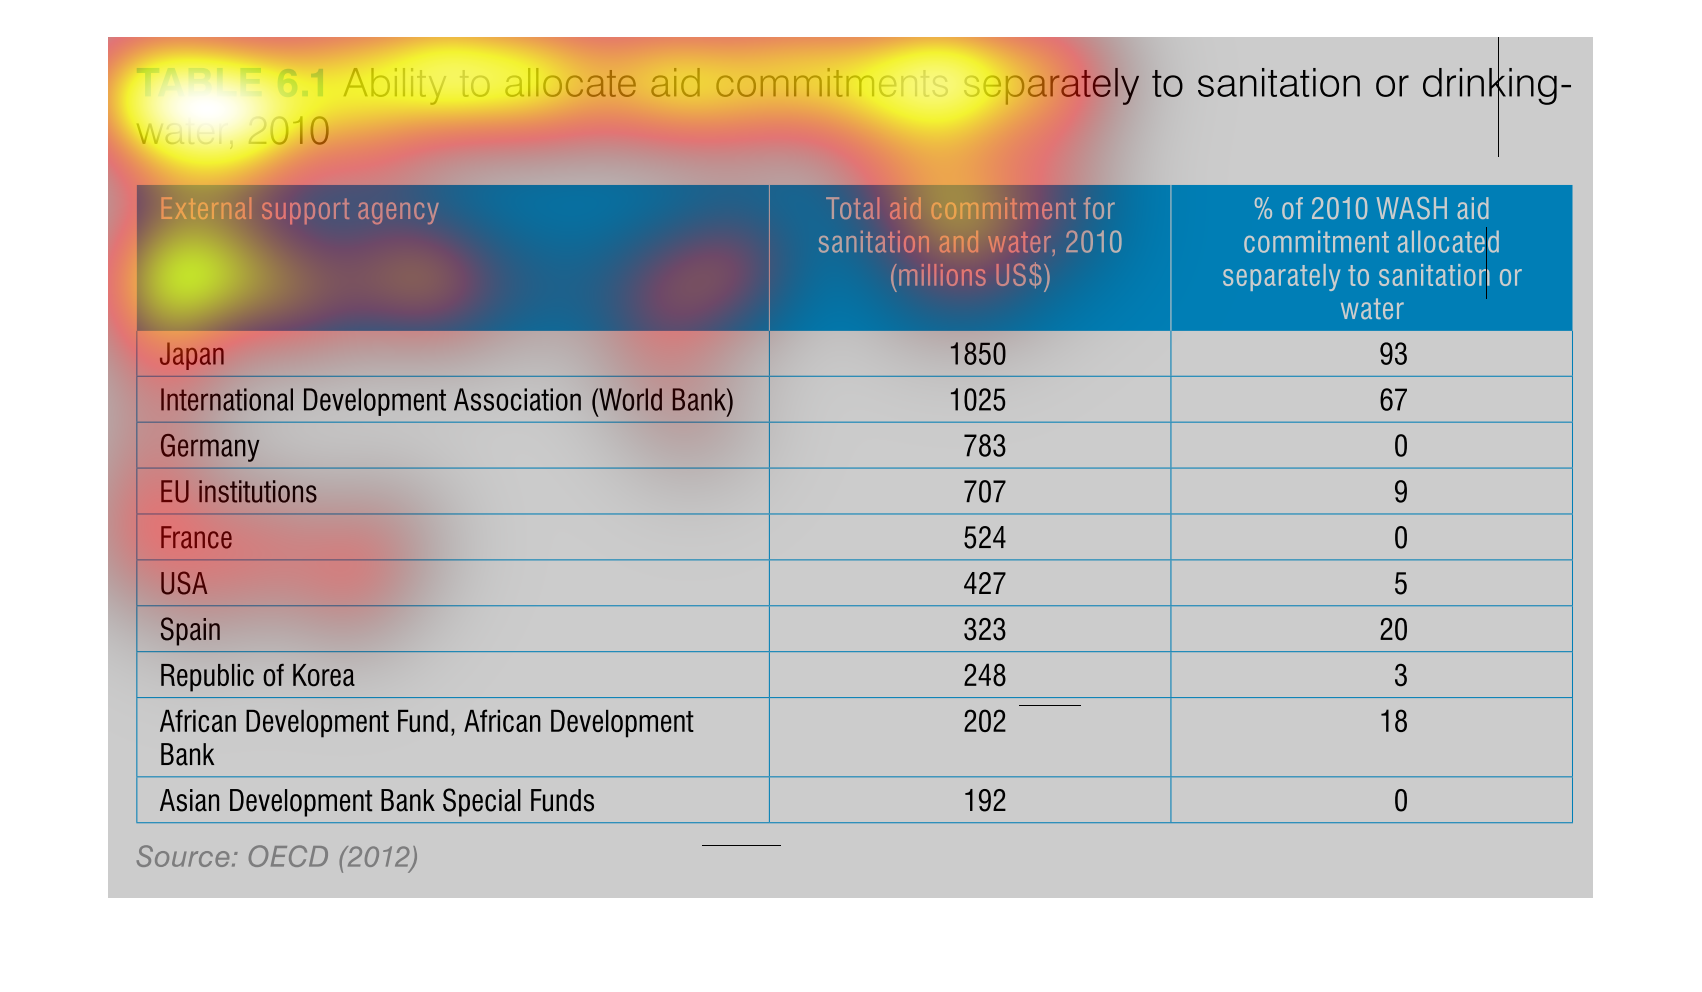
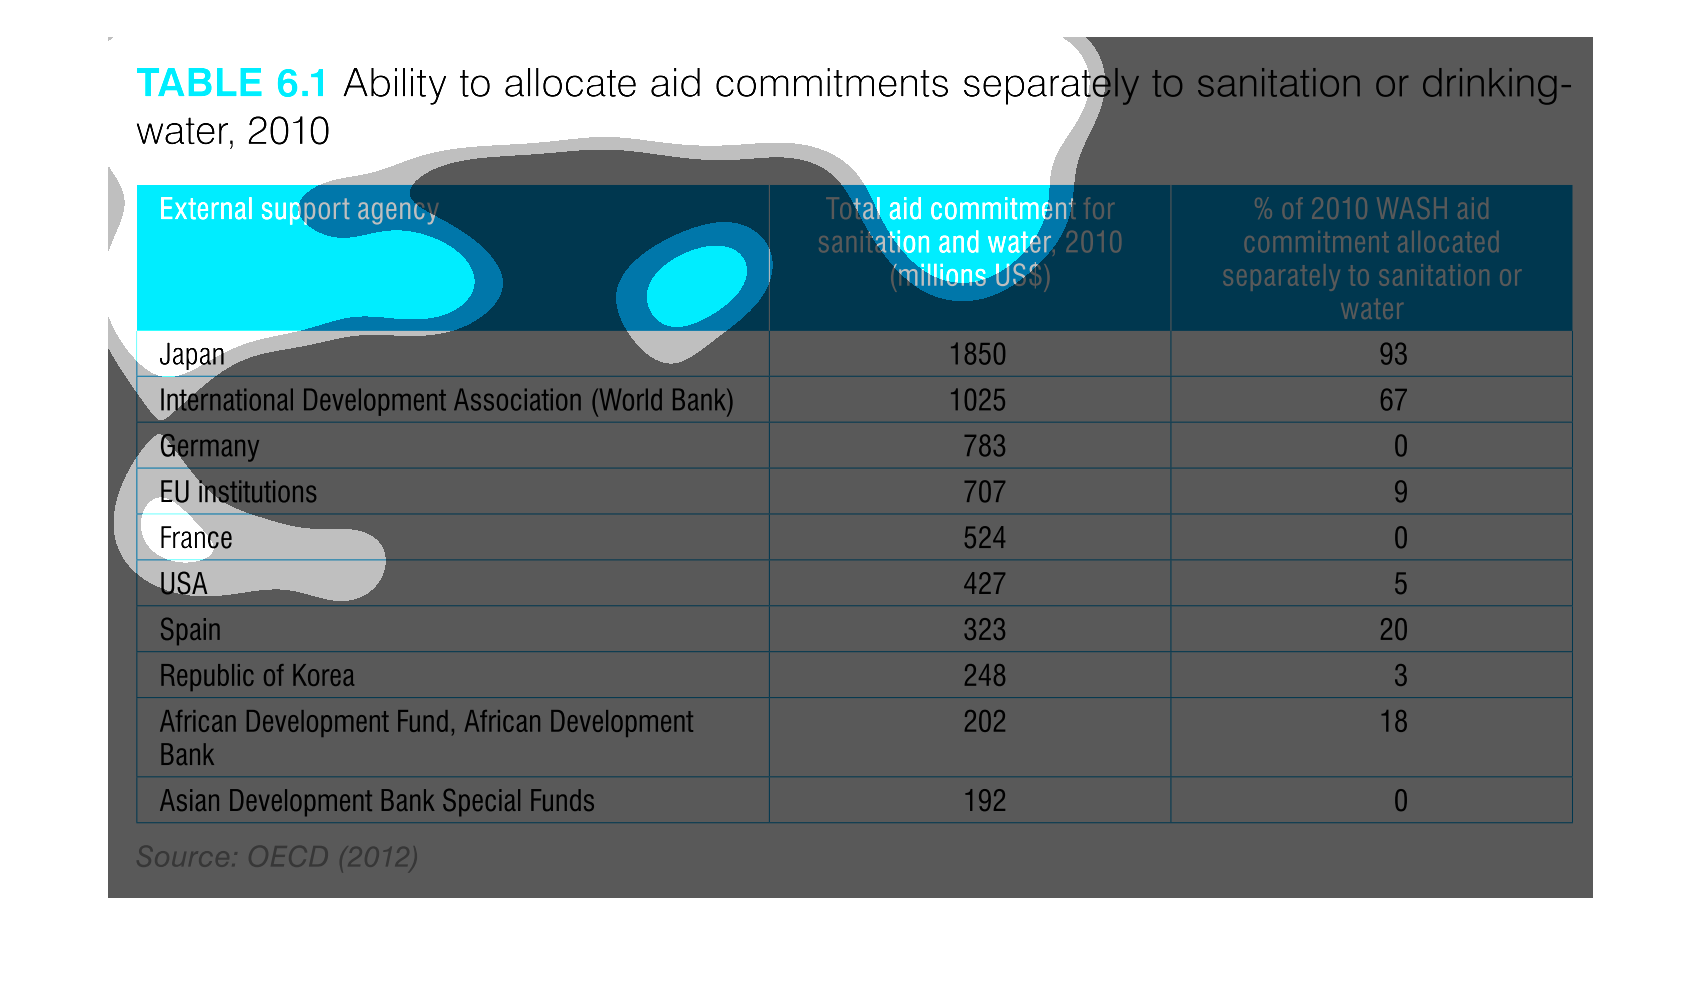
table 6.1 ability to allocate aid commitments separately to sanitation or drinking water.
We see a chart with three columns, external support agency (countries), total aid, and then
WASH aid. data is from 2010. Japan tops the list followed by world bank and germany
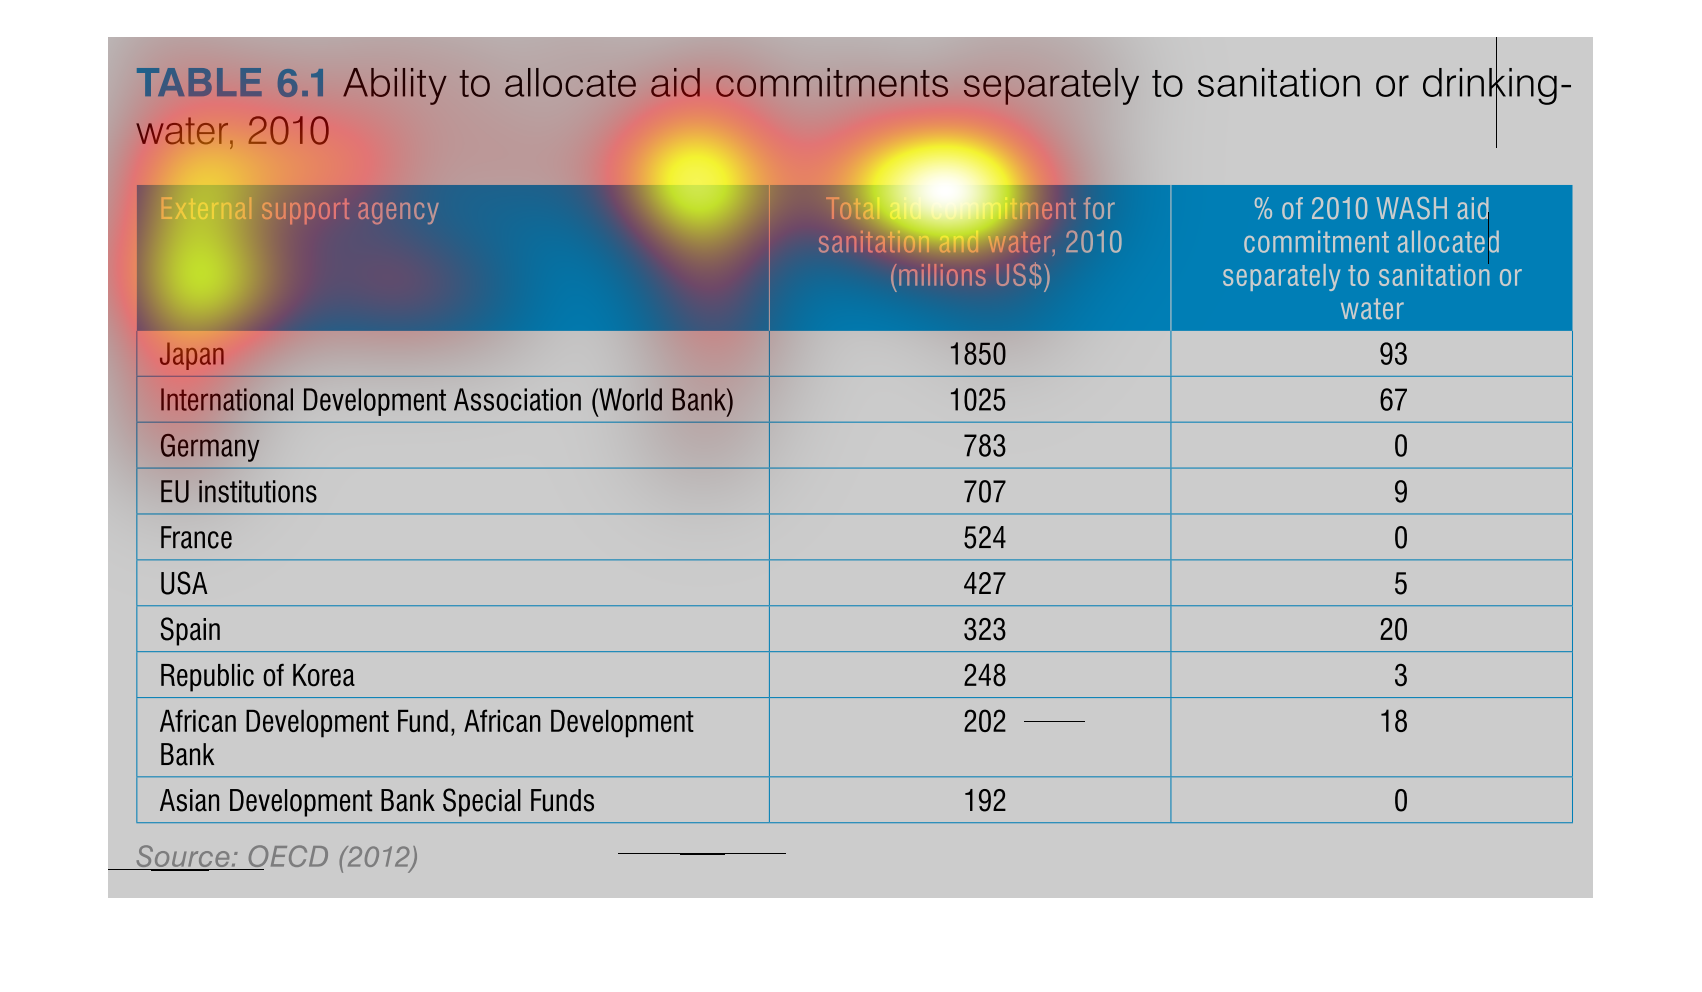
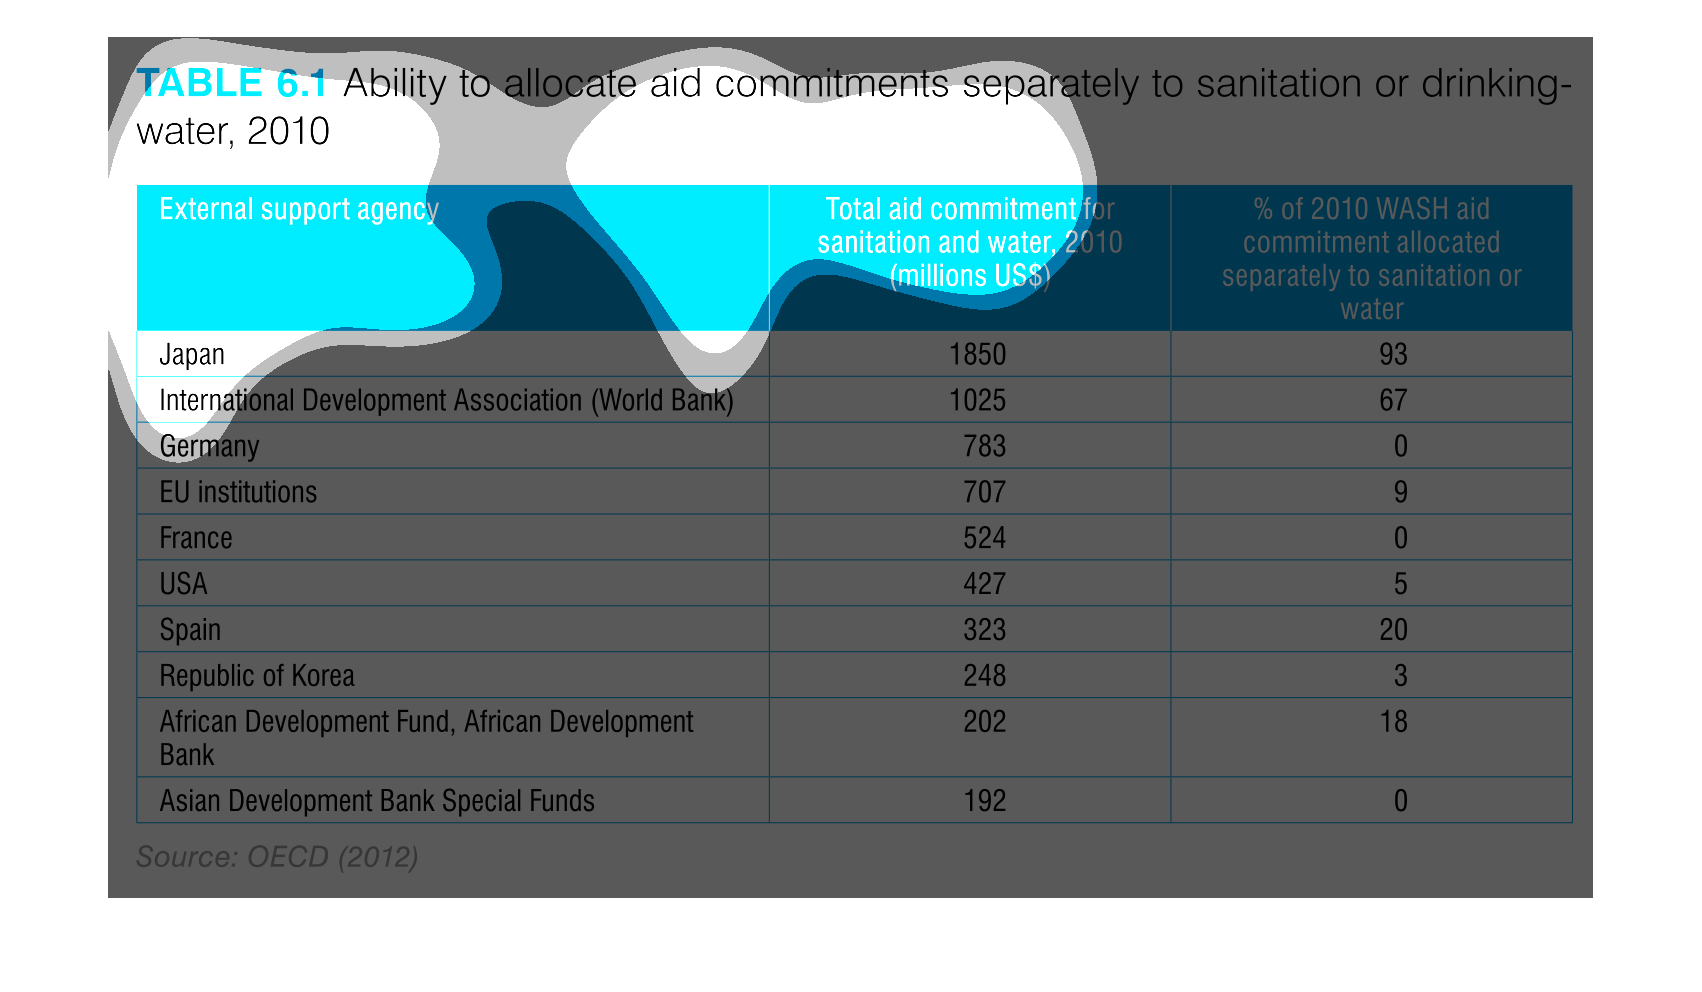
Table 6.1 ability to allocate aid commitments separately to sanitation or drinking water,
2010. The first column shows countries, second is total aid commitment to sanitation and water,
2010 in USD by millions, third column is % of 2010 WASH commitment allocated separately to
sanitation or water.