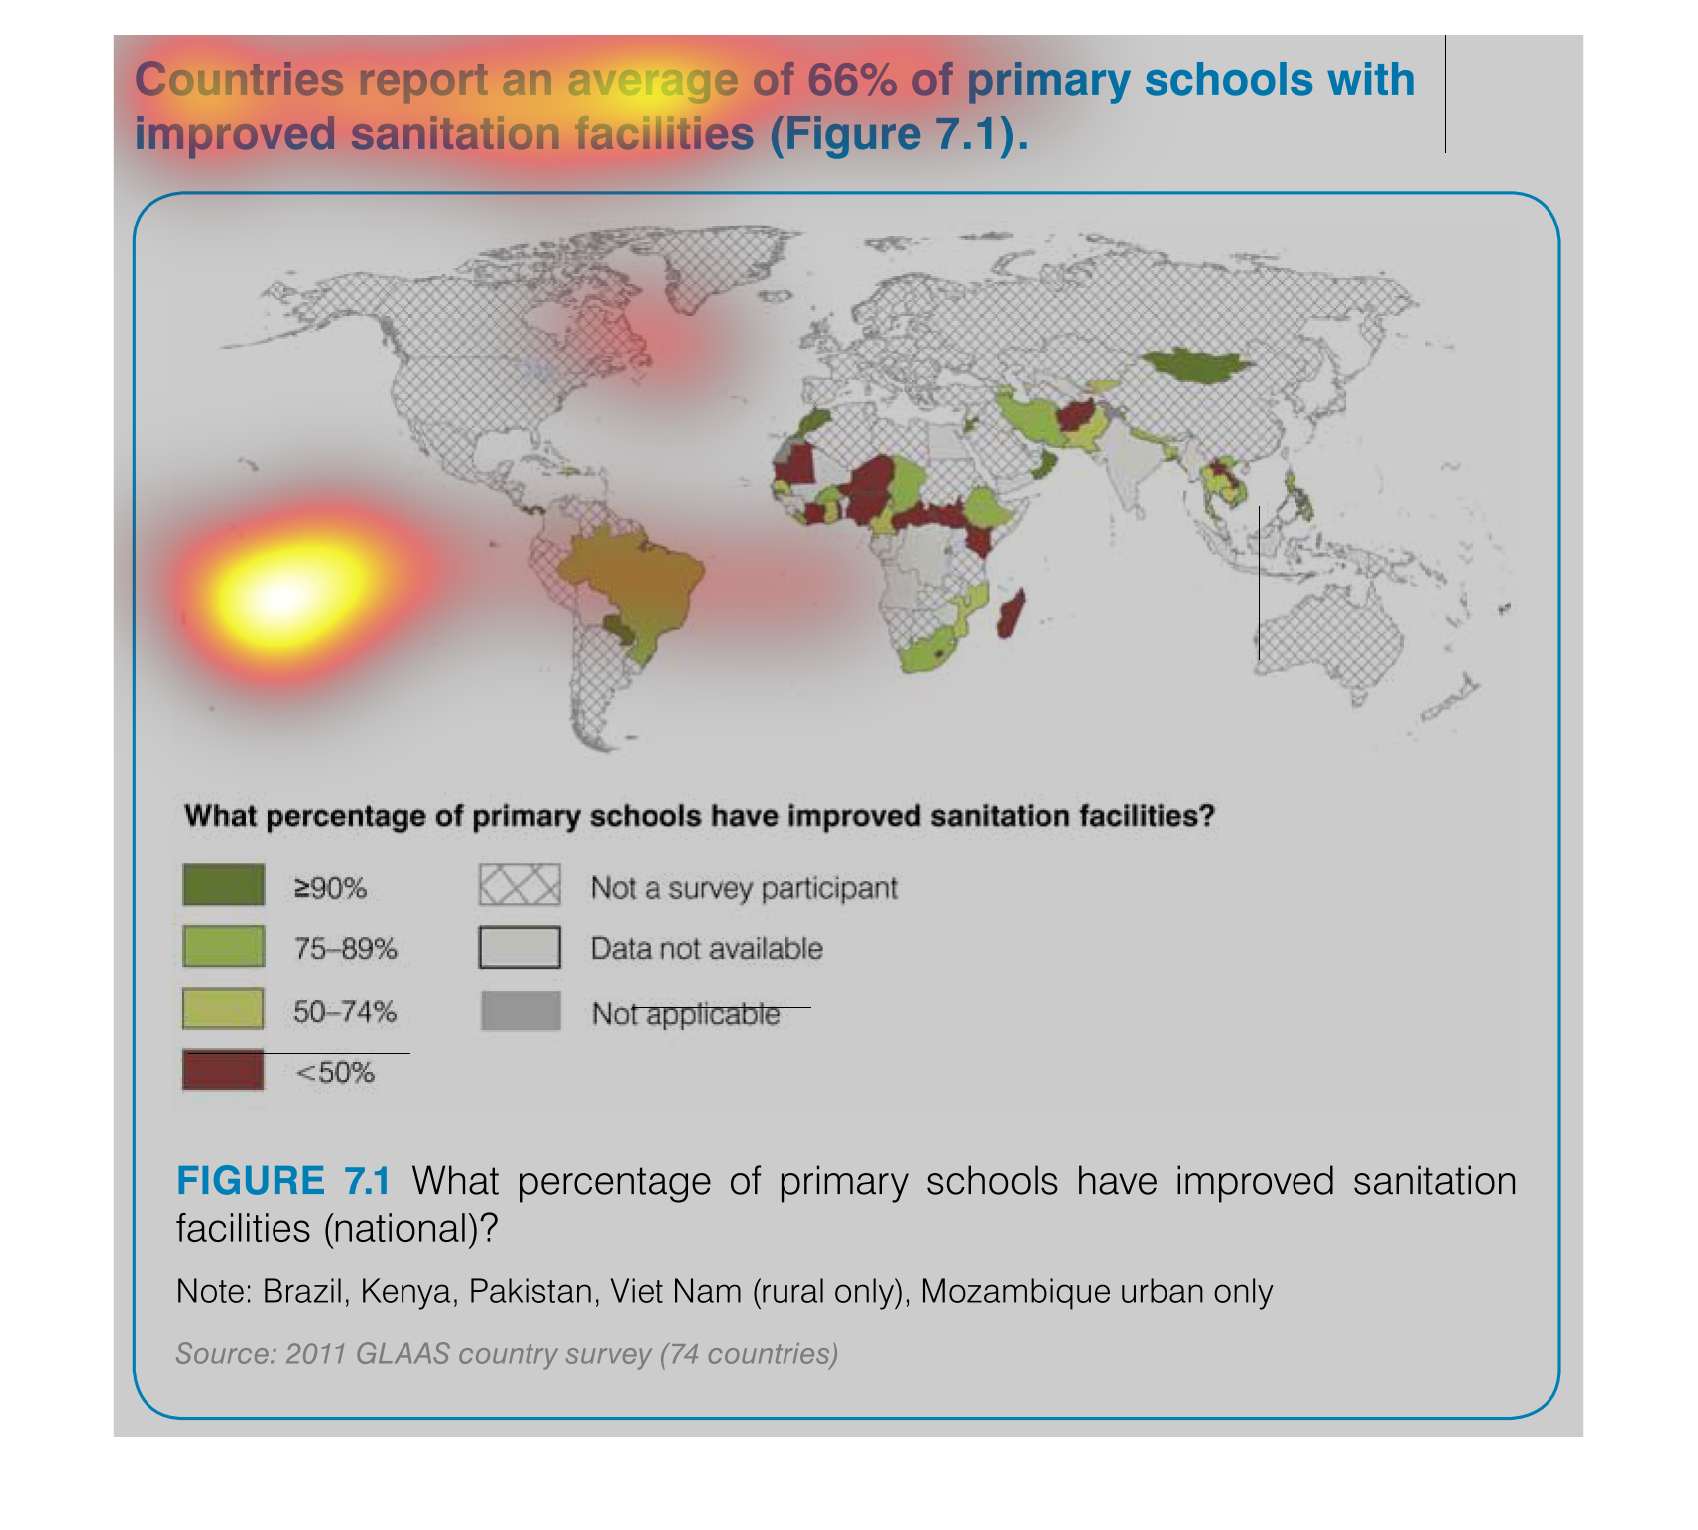
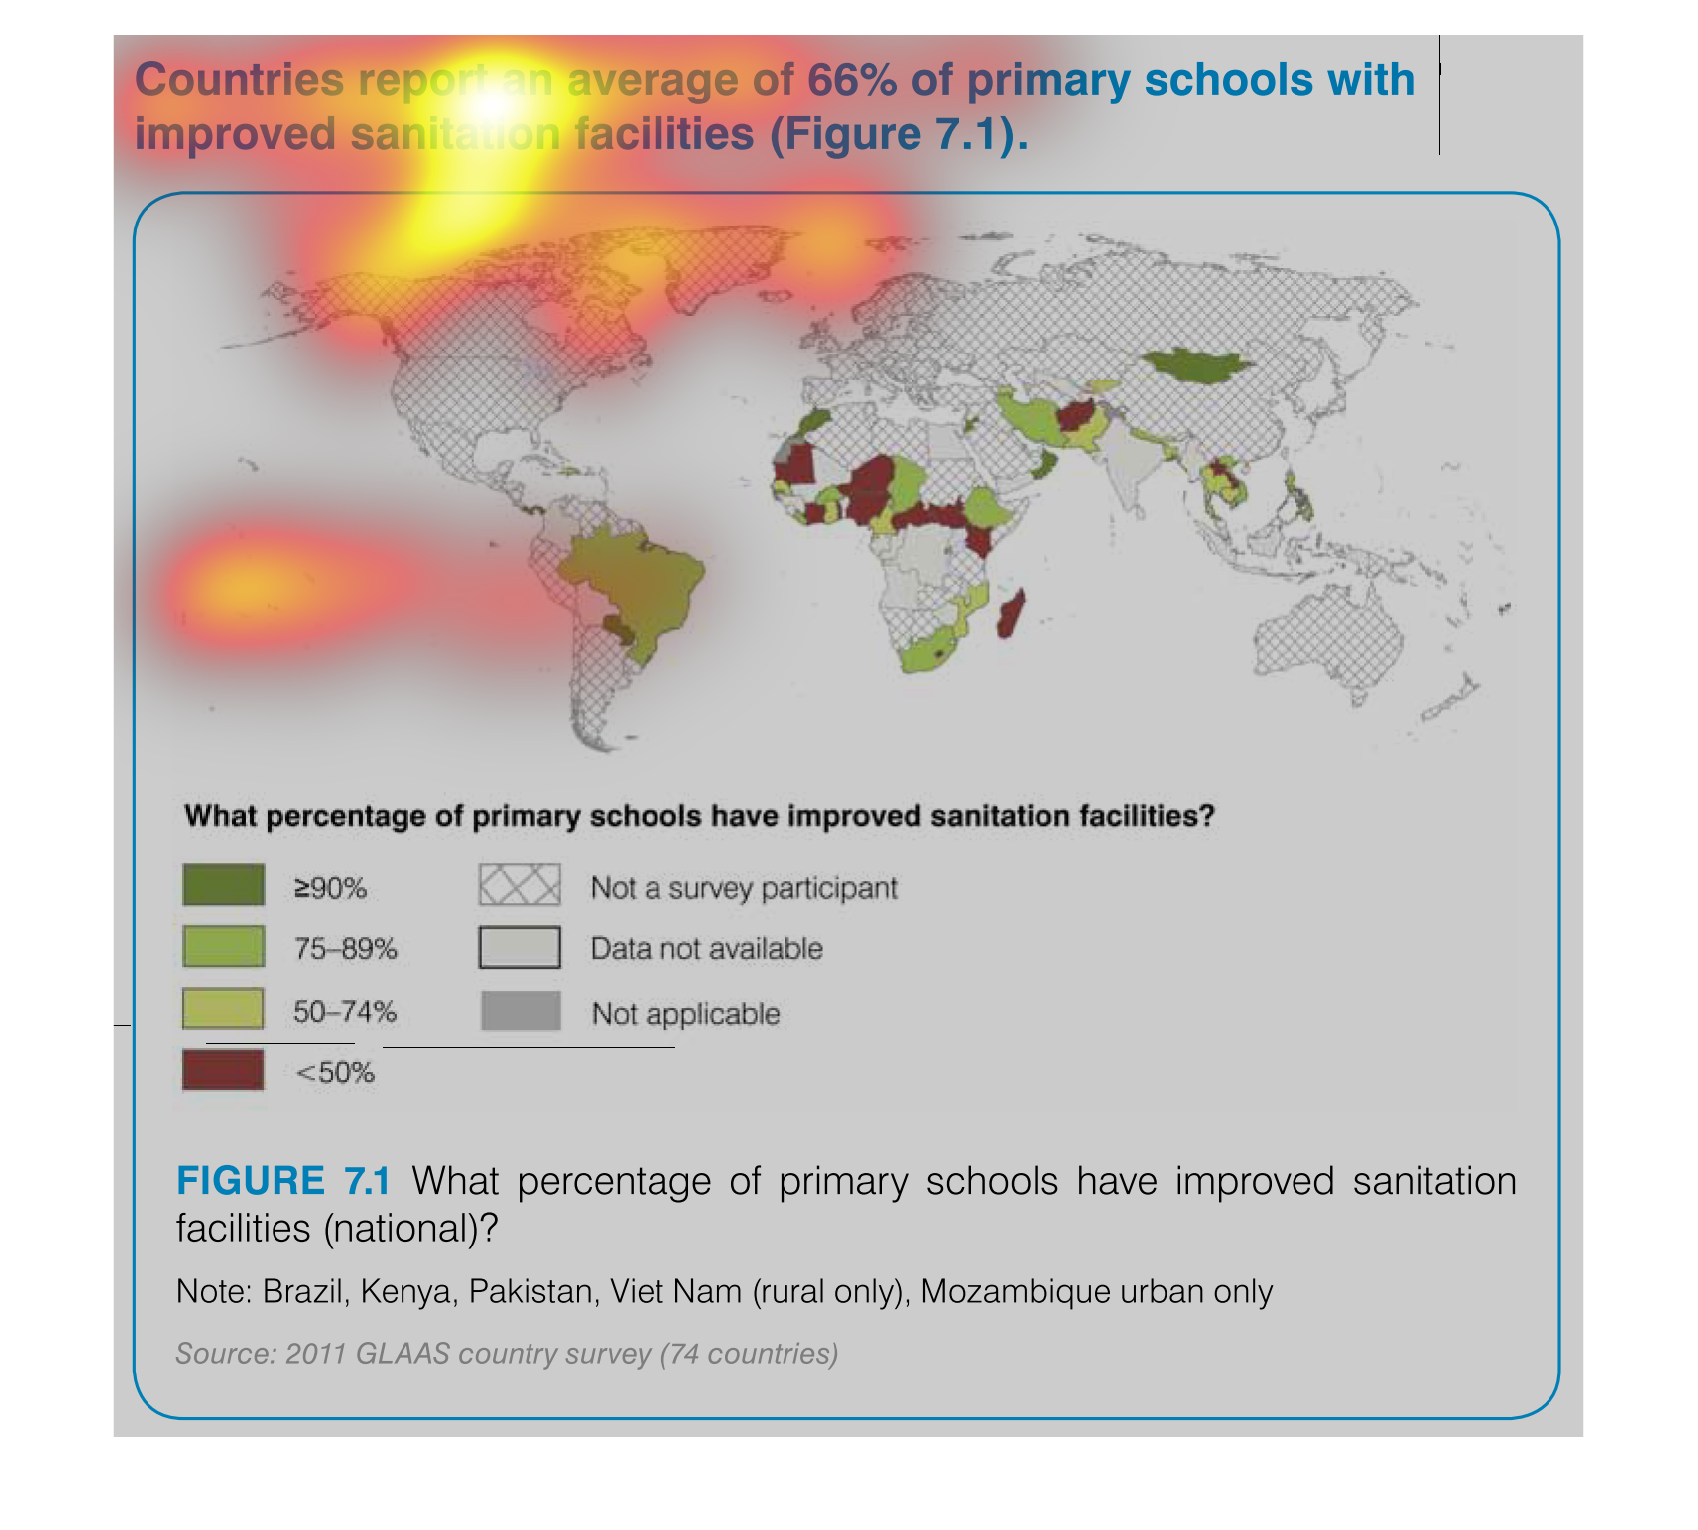
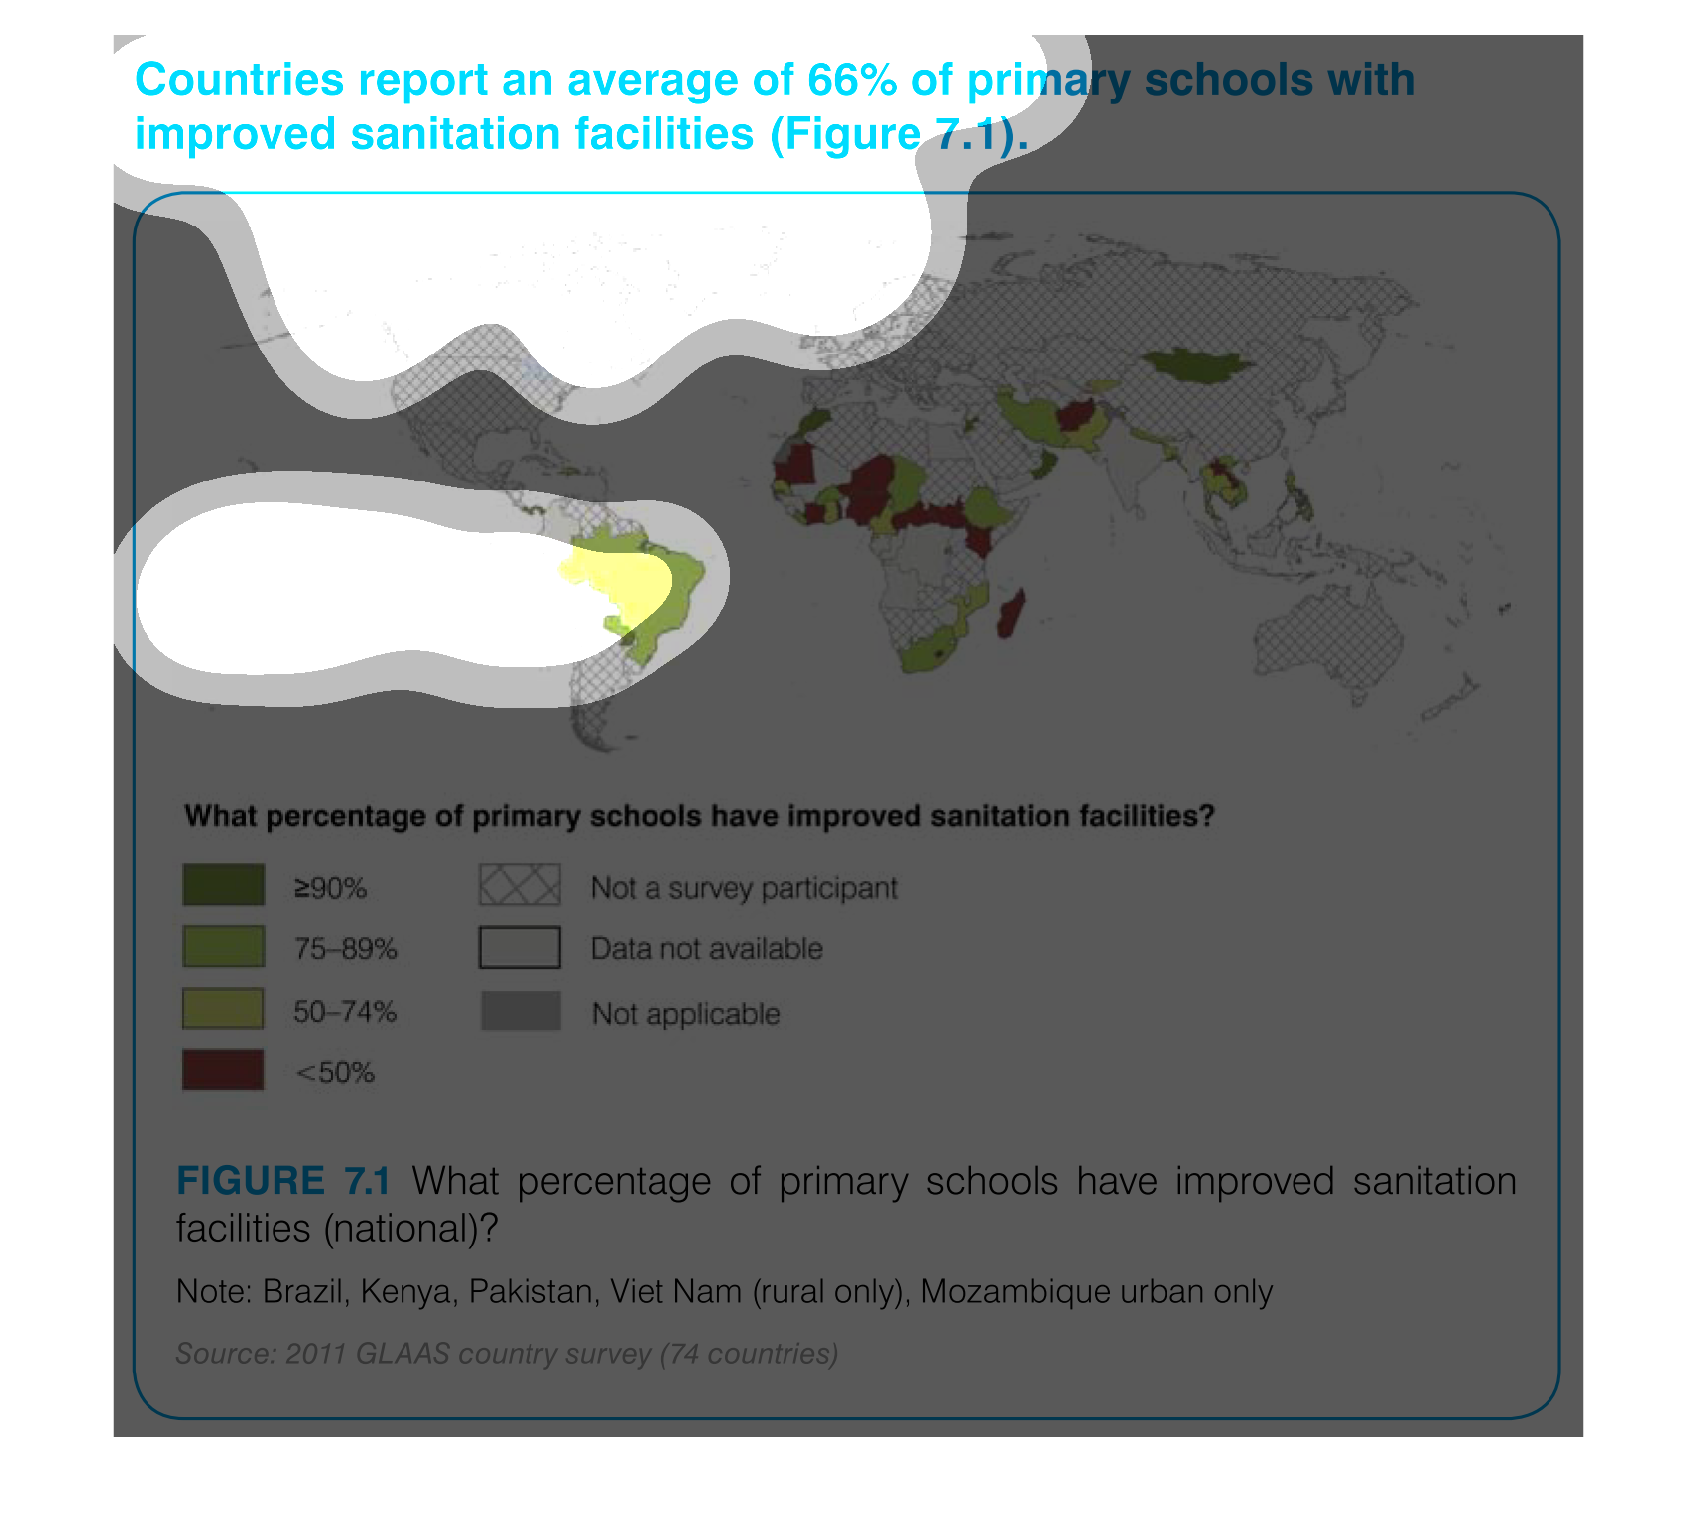
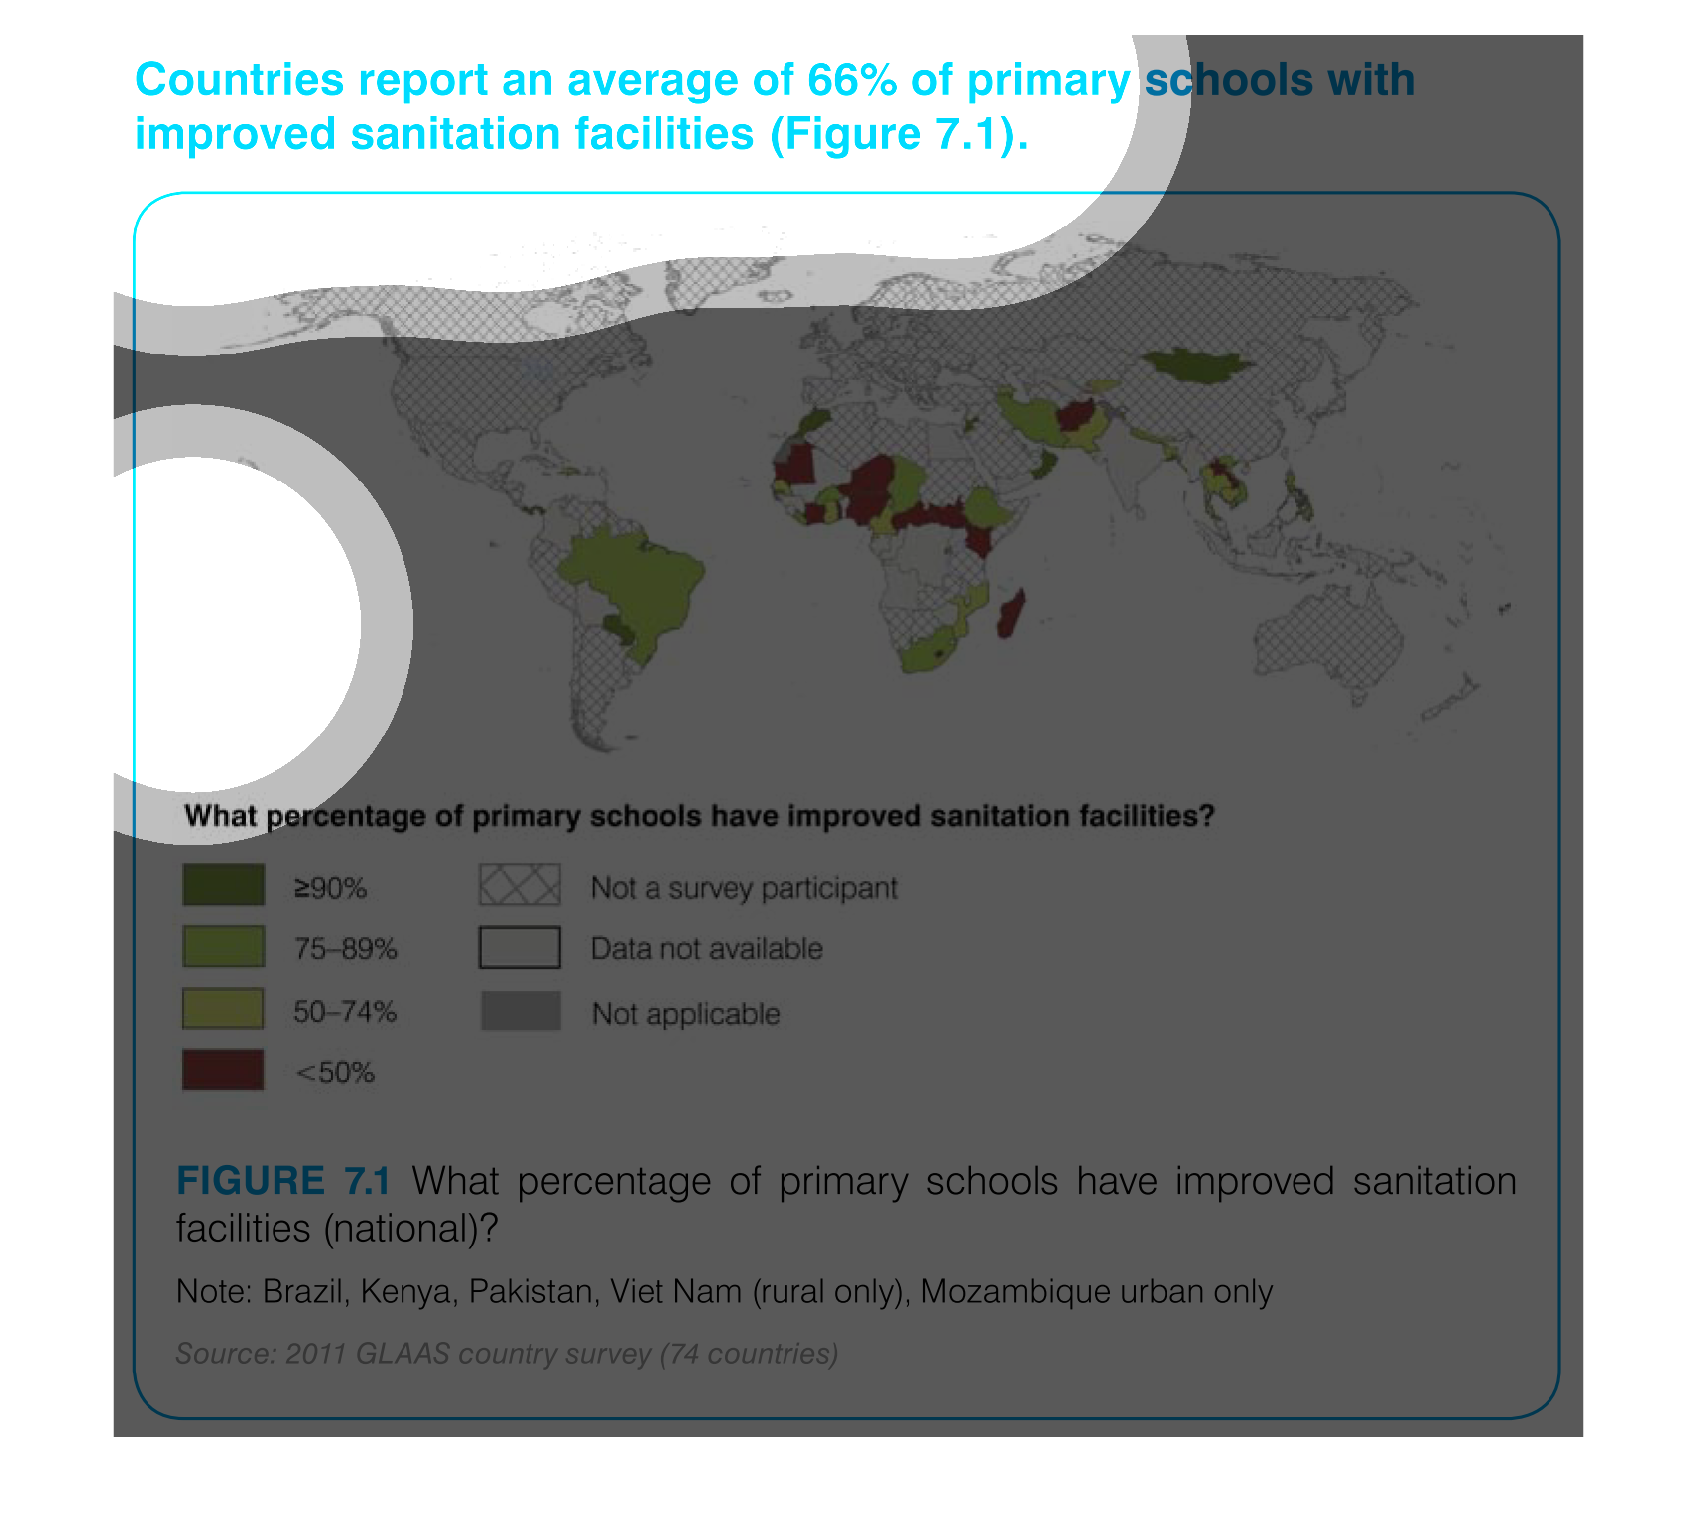
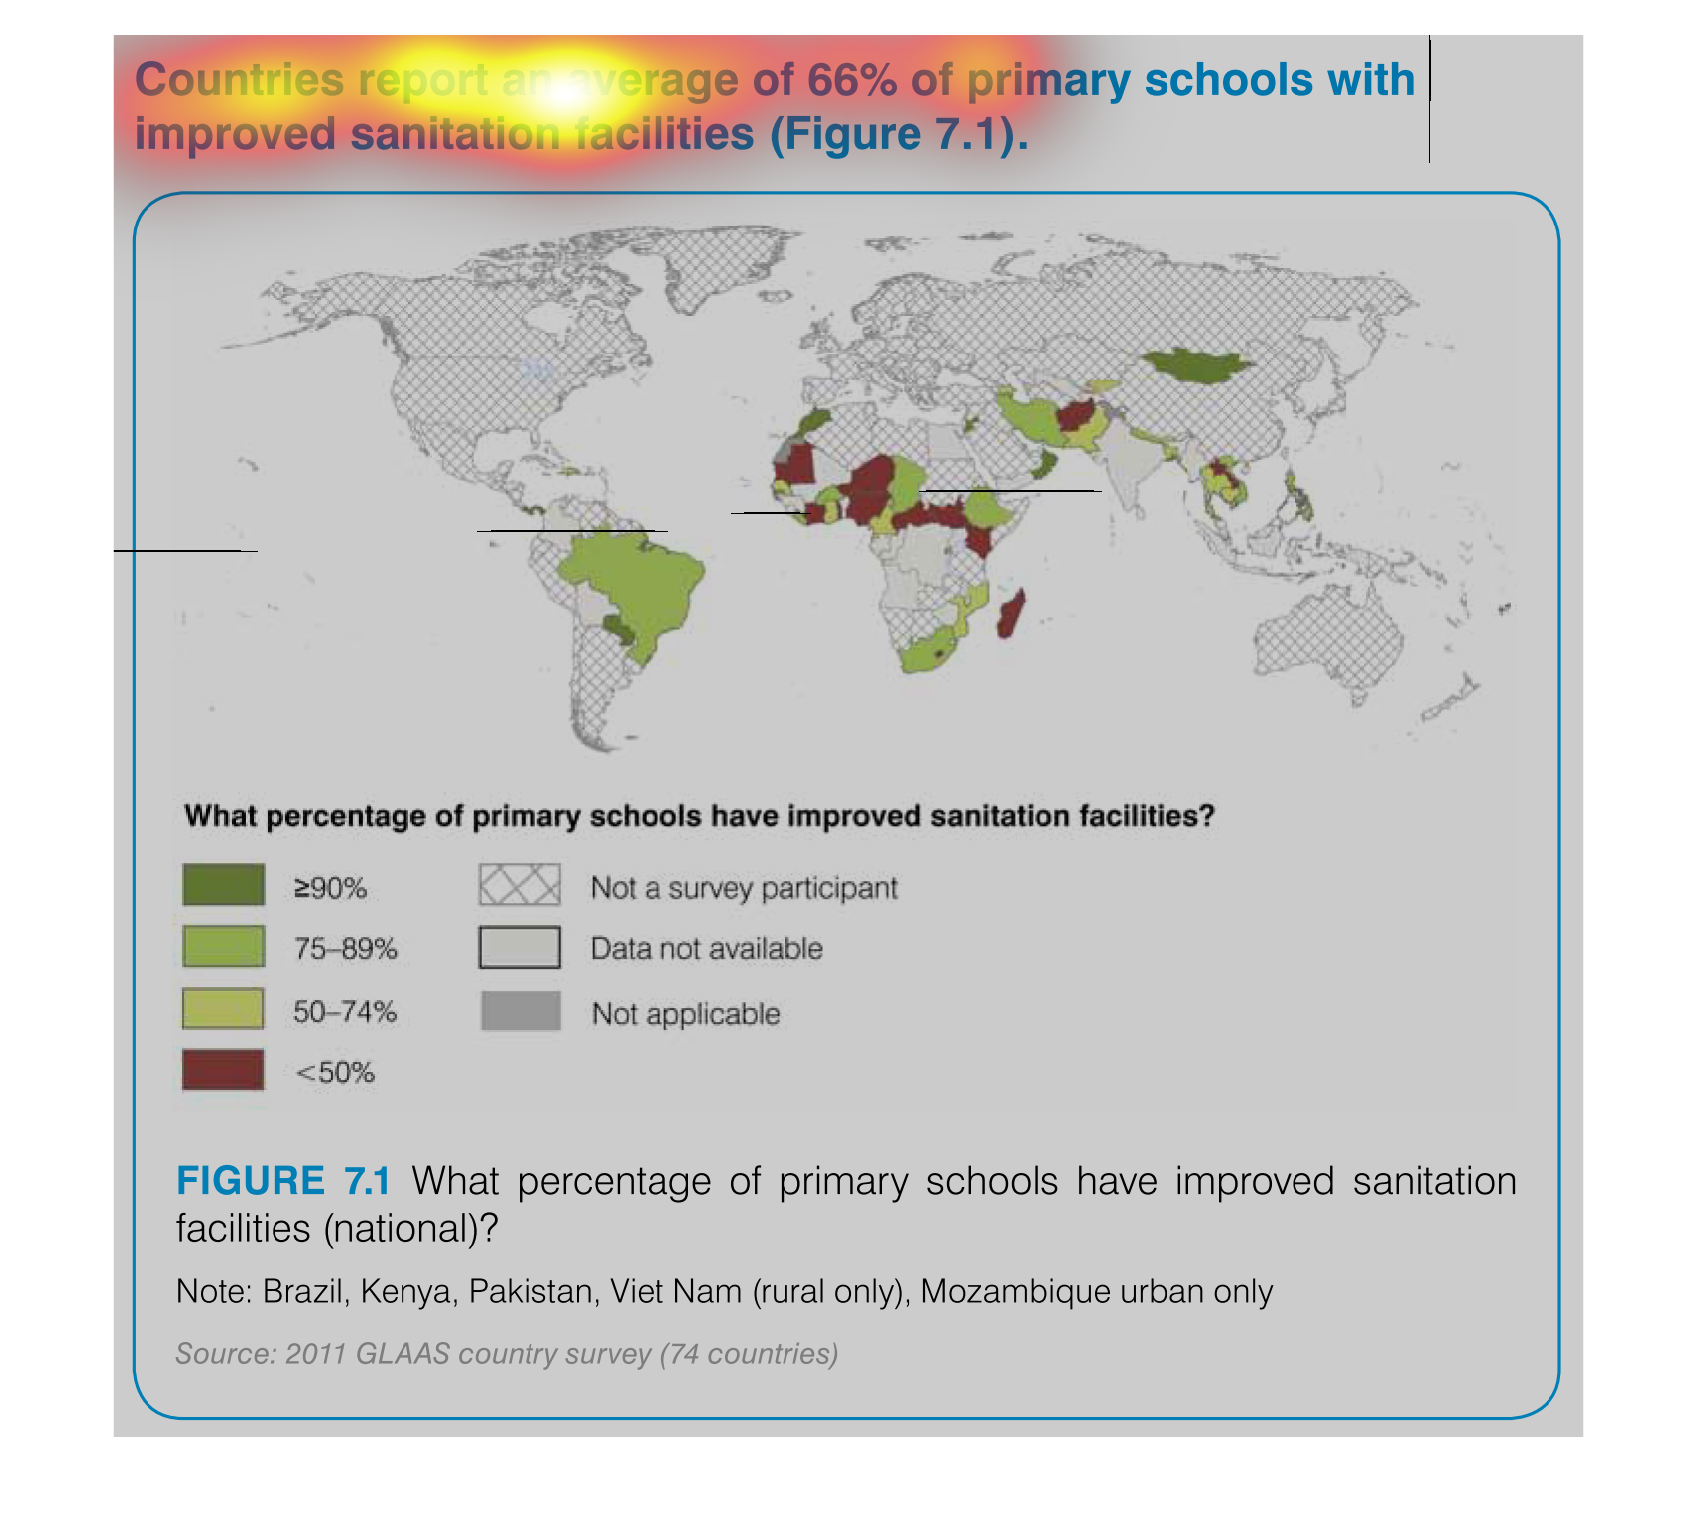
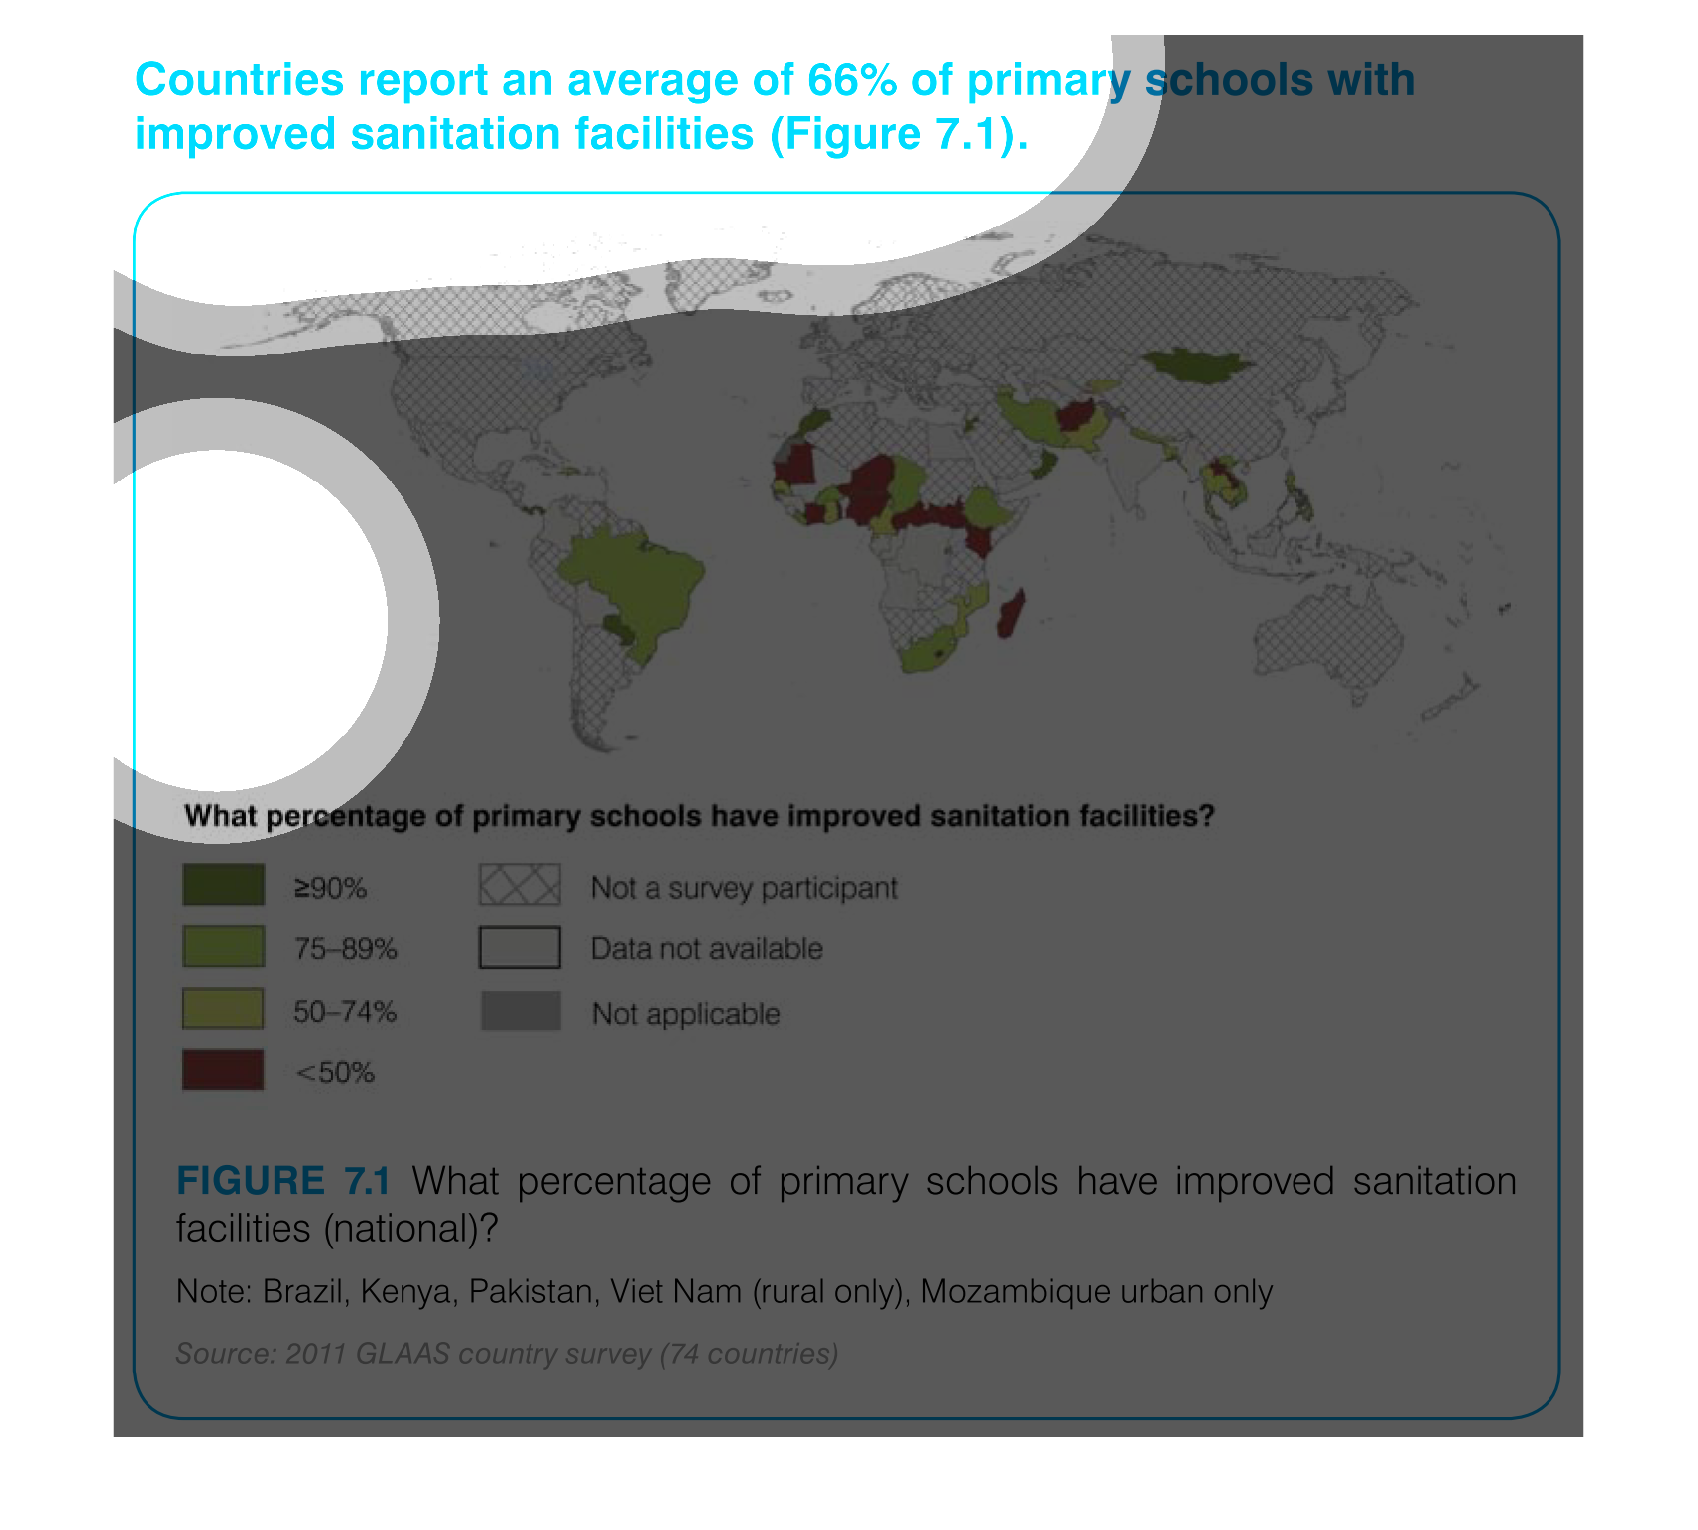
This map shows the improved sanitation of primary schools in each country. South America seems
 to have done the best with improving sanitation in primary schools while Africa has many
countries that haven't done well at all.
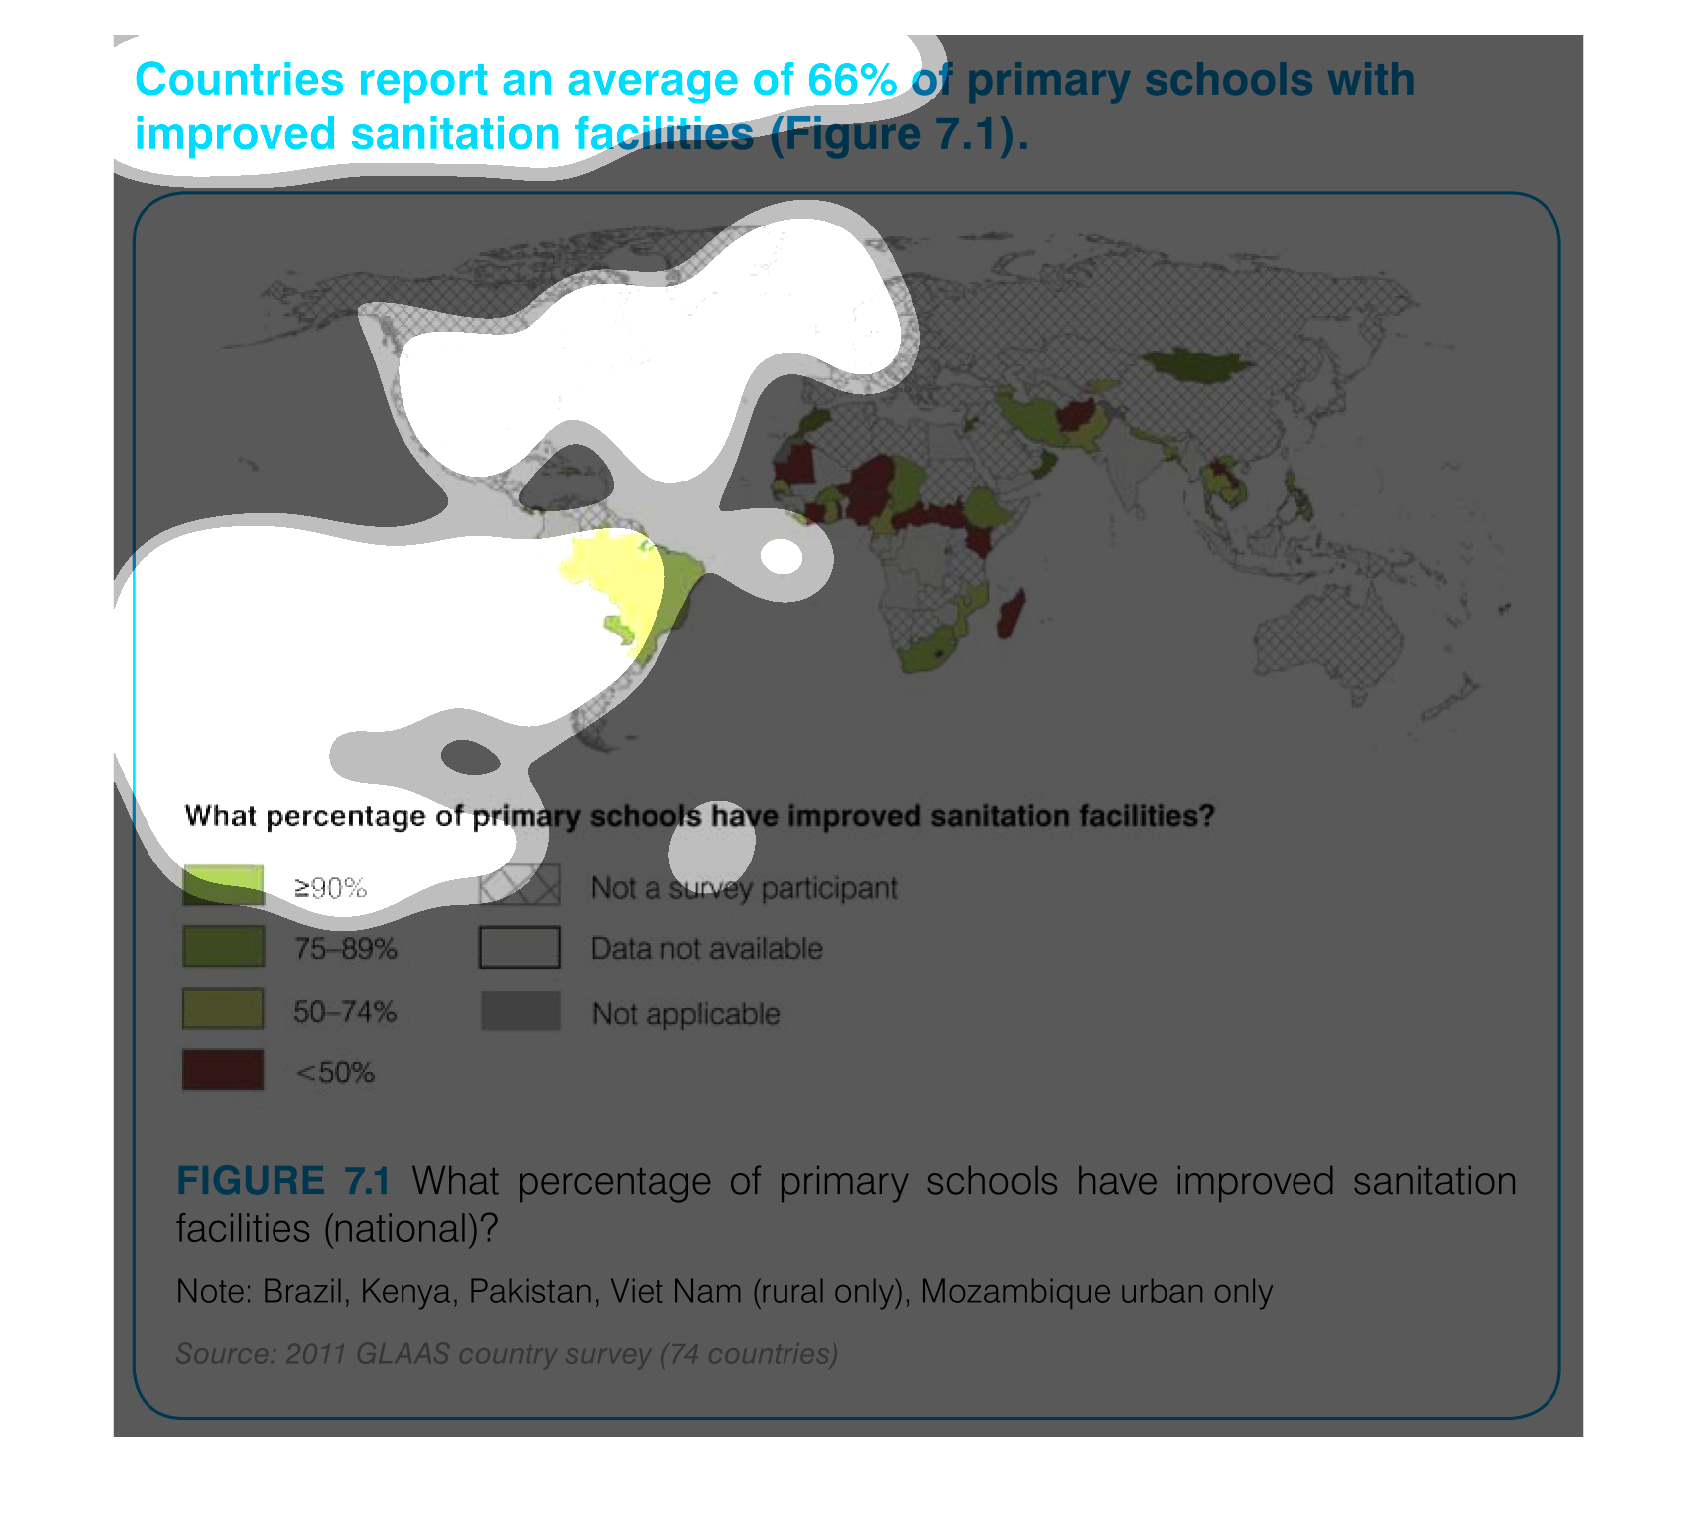
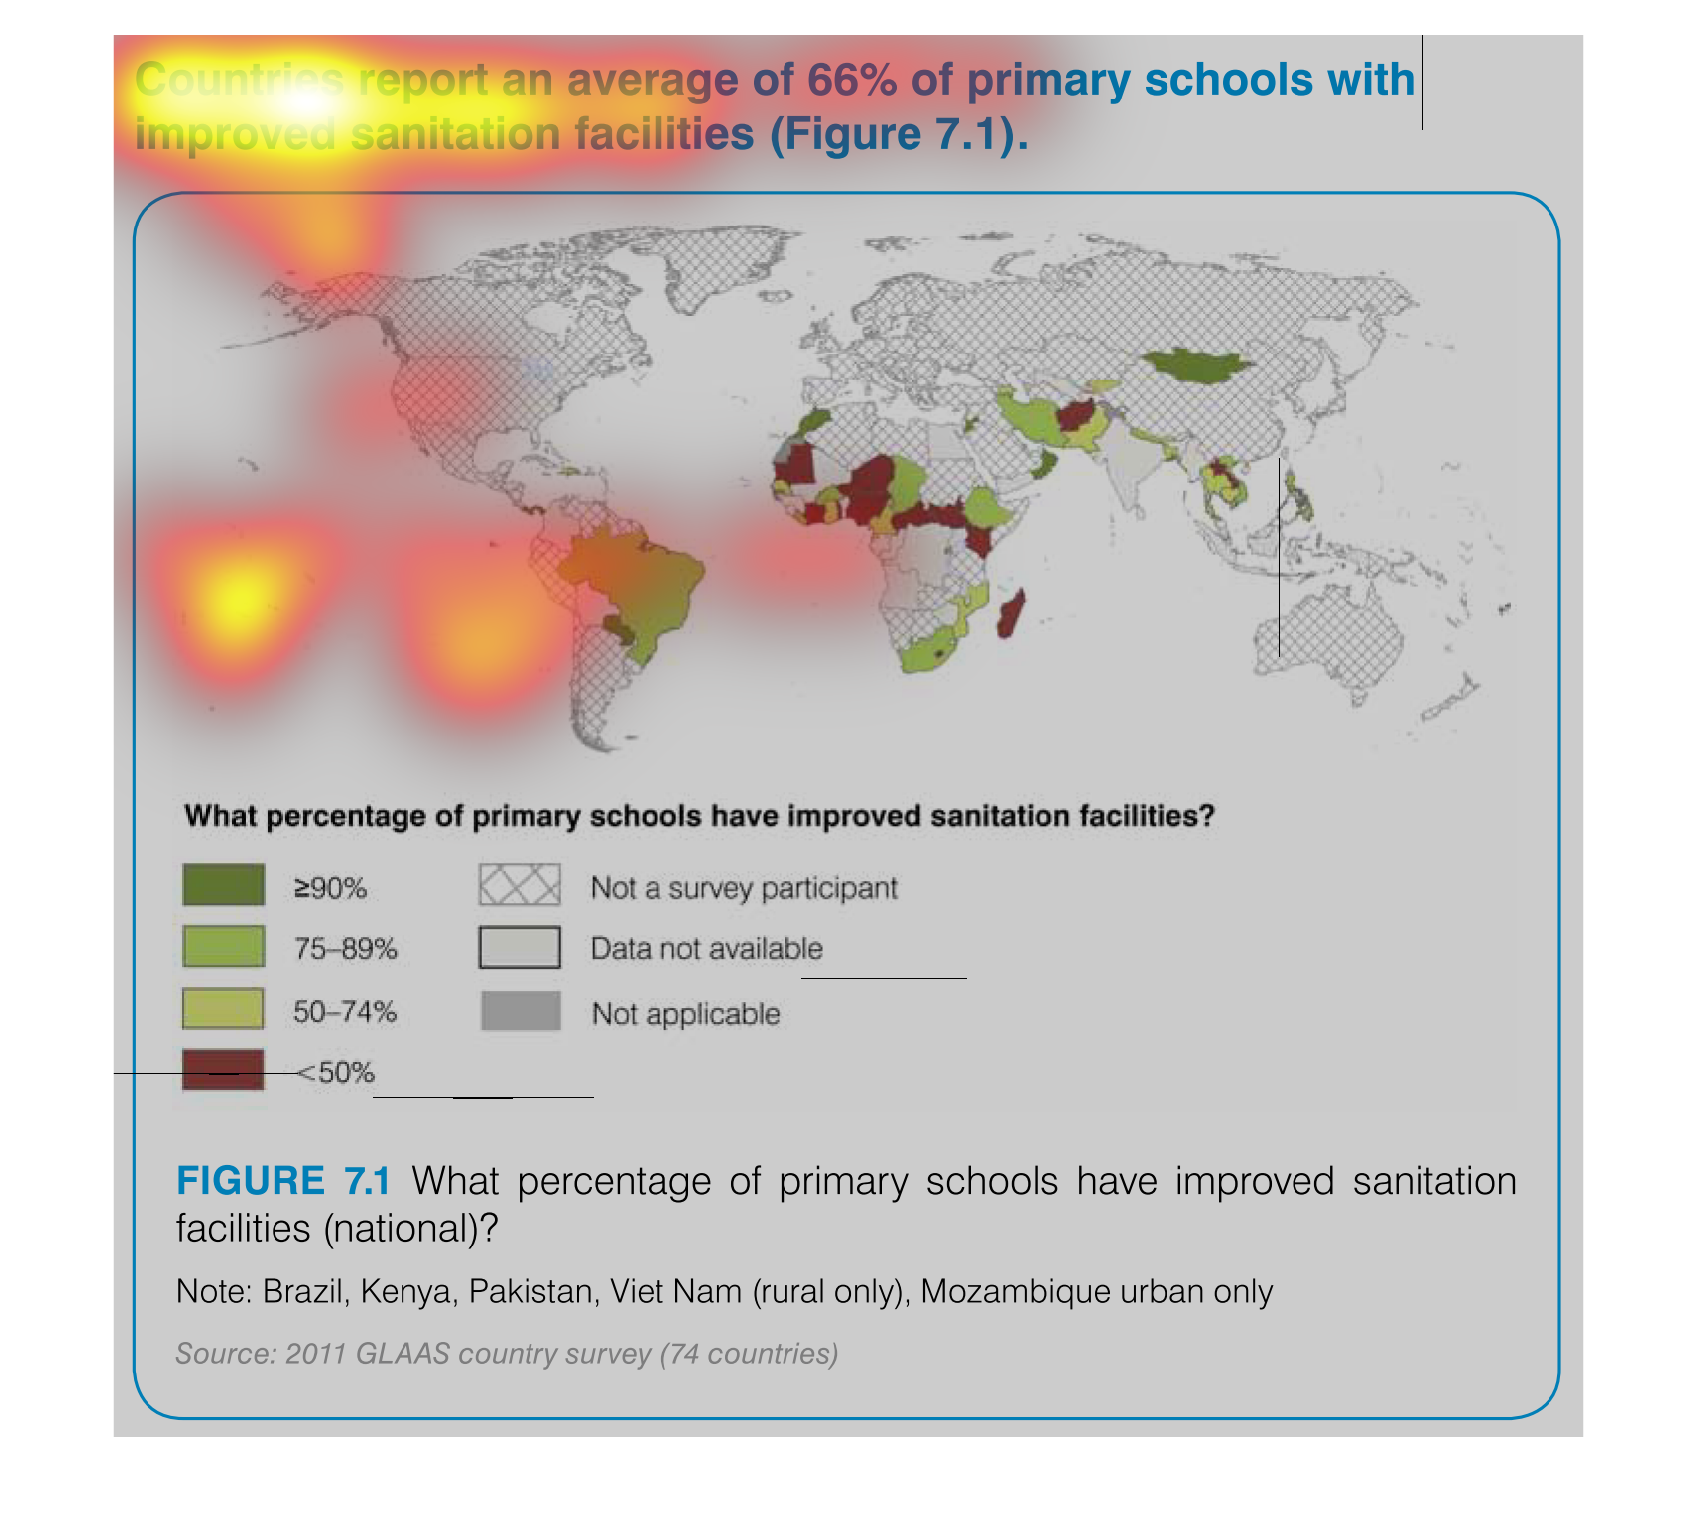
This chart measures the improvement of sanitation in primary schools.  The majority of the
globe are non participants.  Brazil had an increase between 75% and 89%. Other participating
countries in South America fared as well or better.  Africa and Asia had very mixed results,
with many countries having below 50% being neighbors with countries having above 75%.
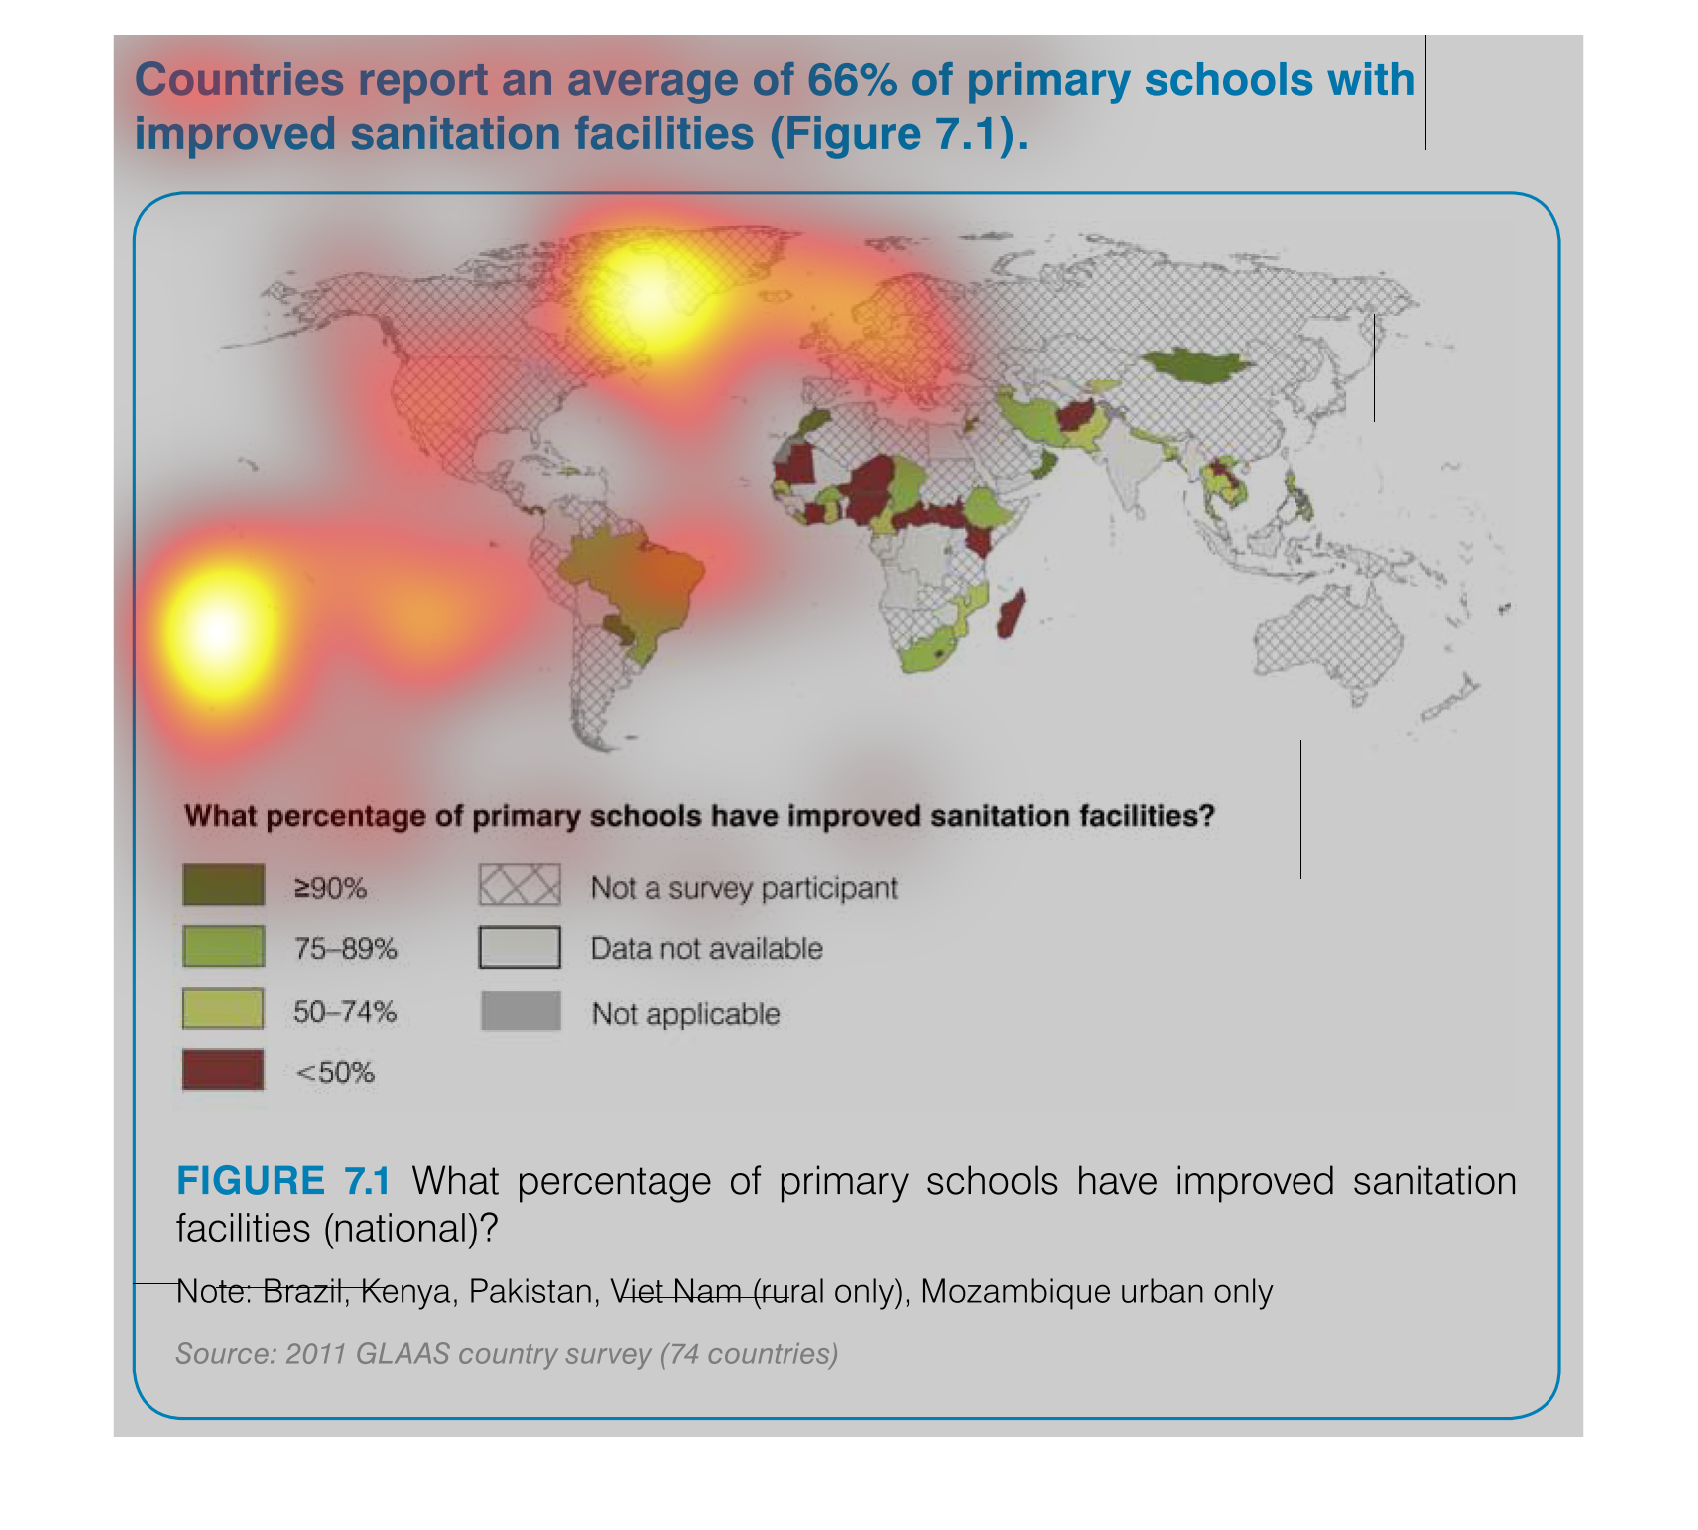
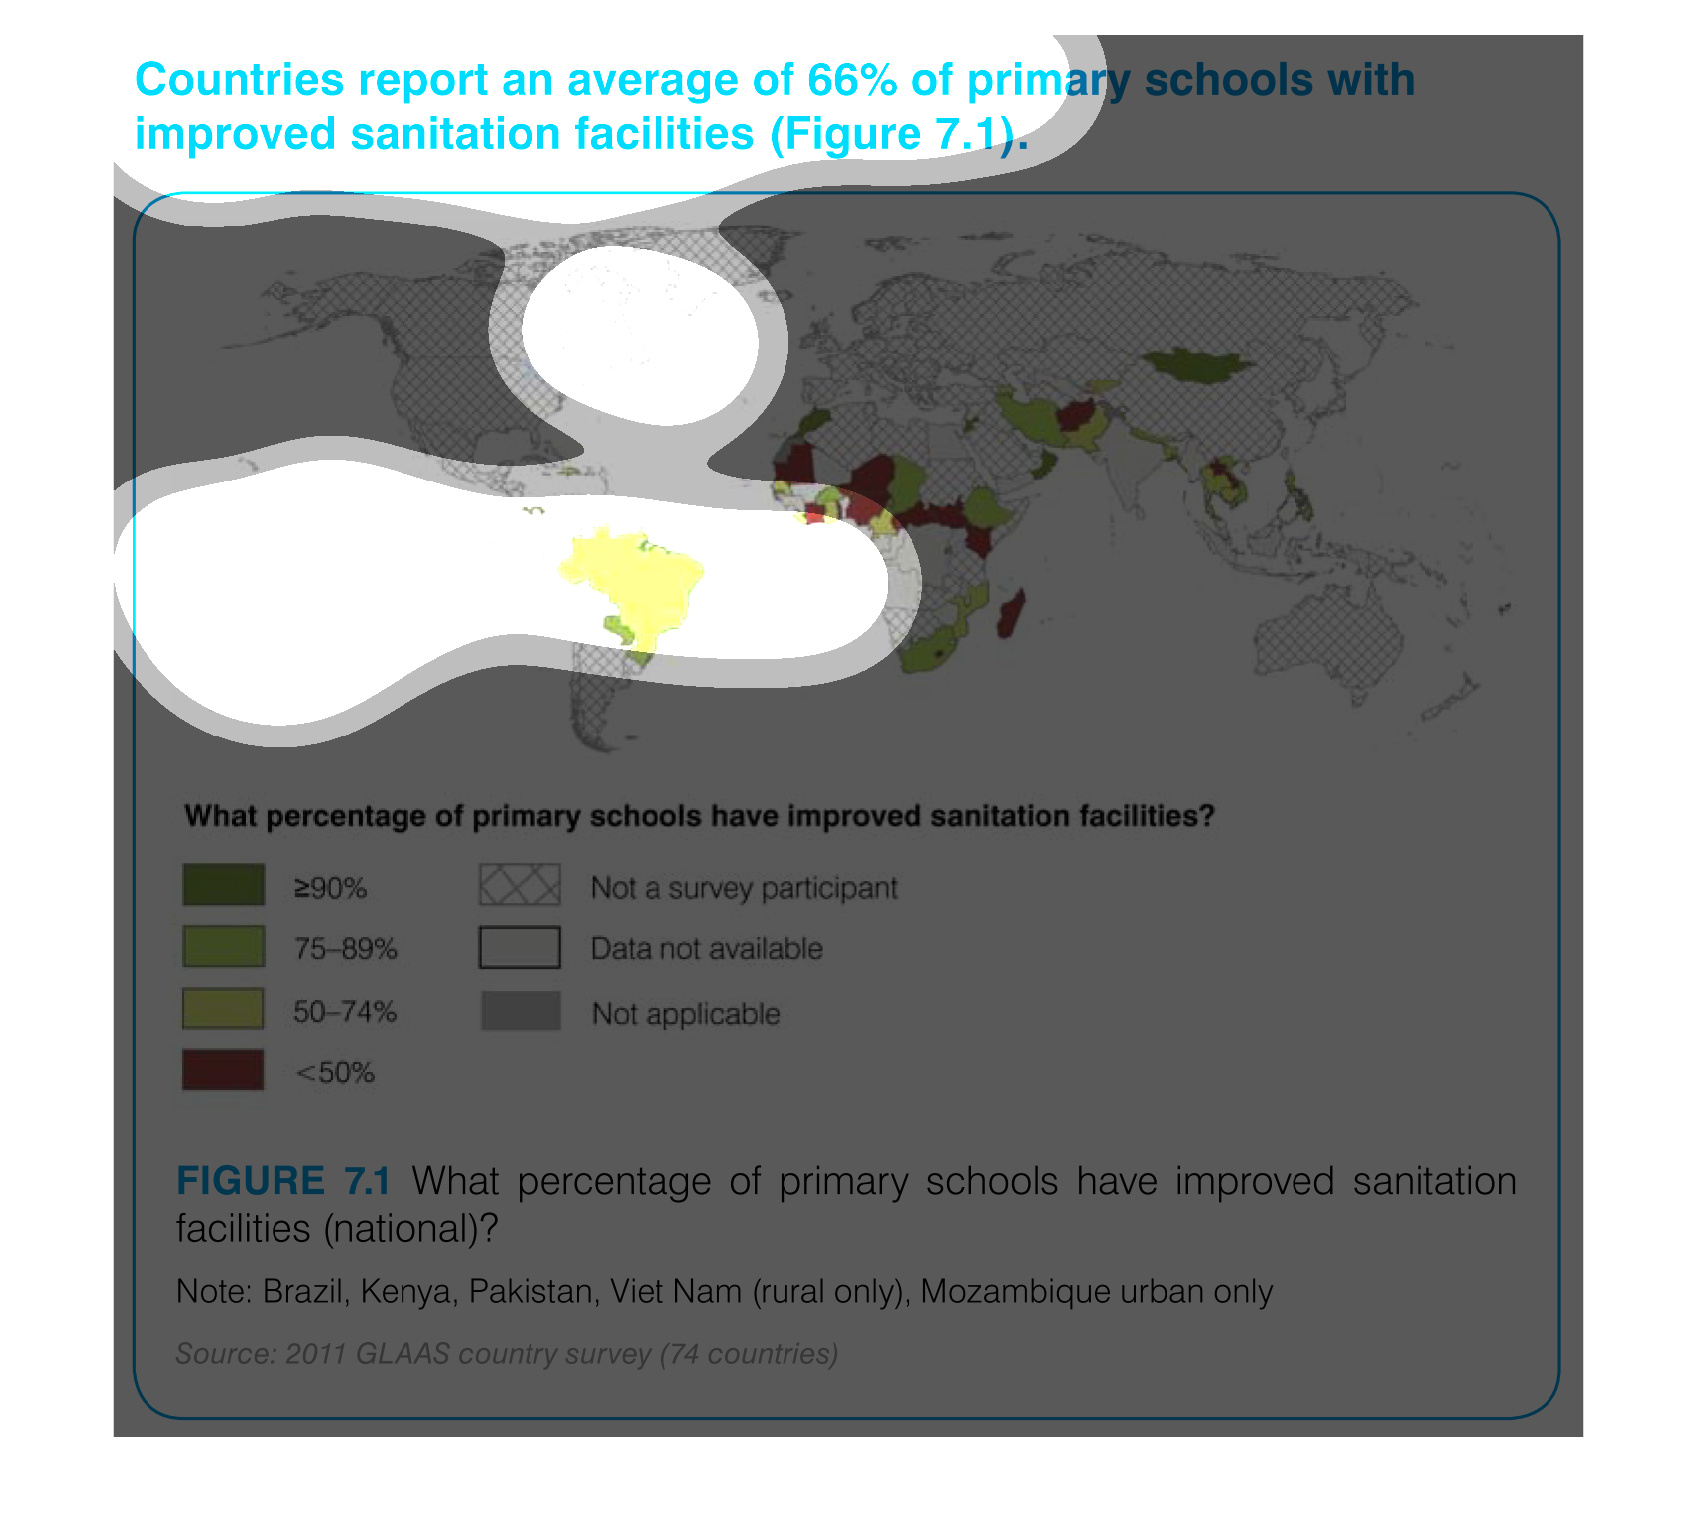
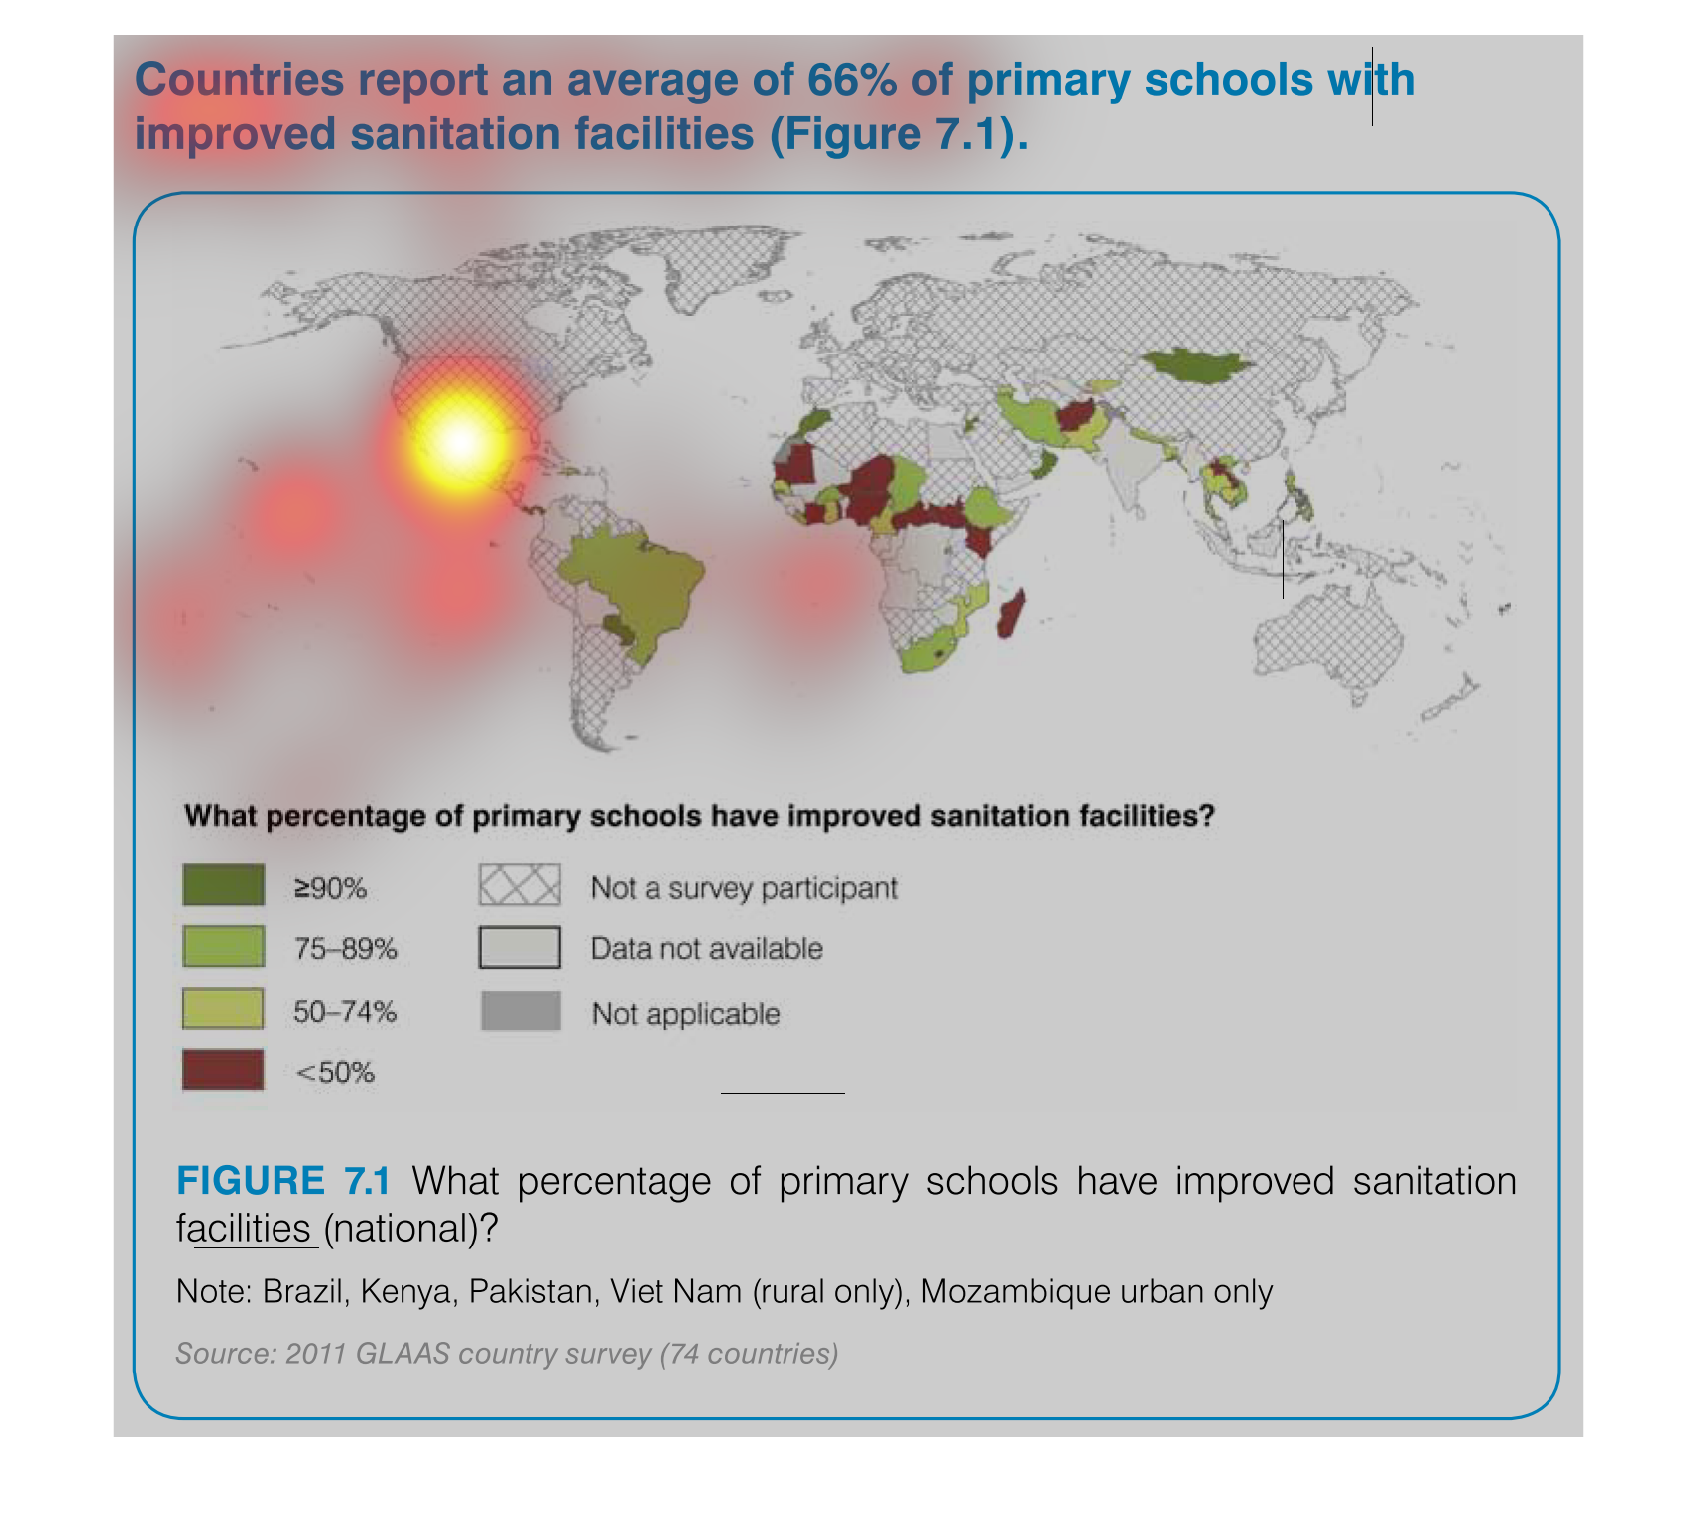
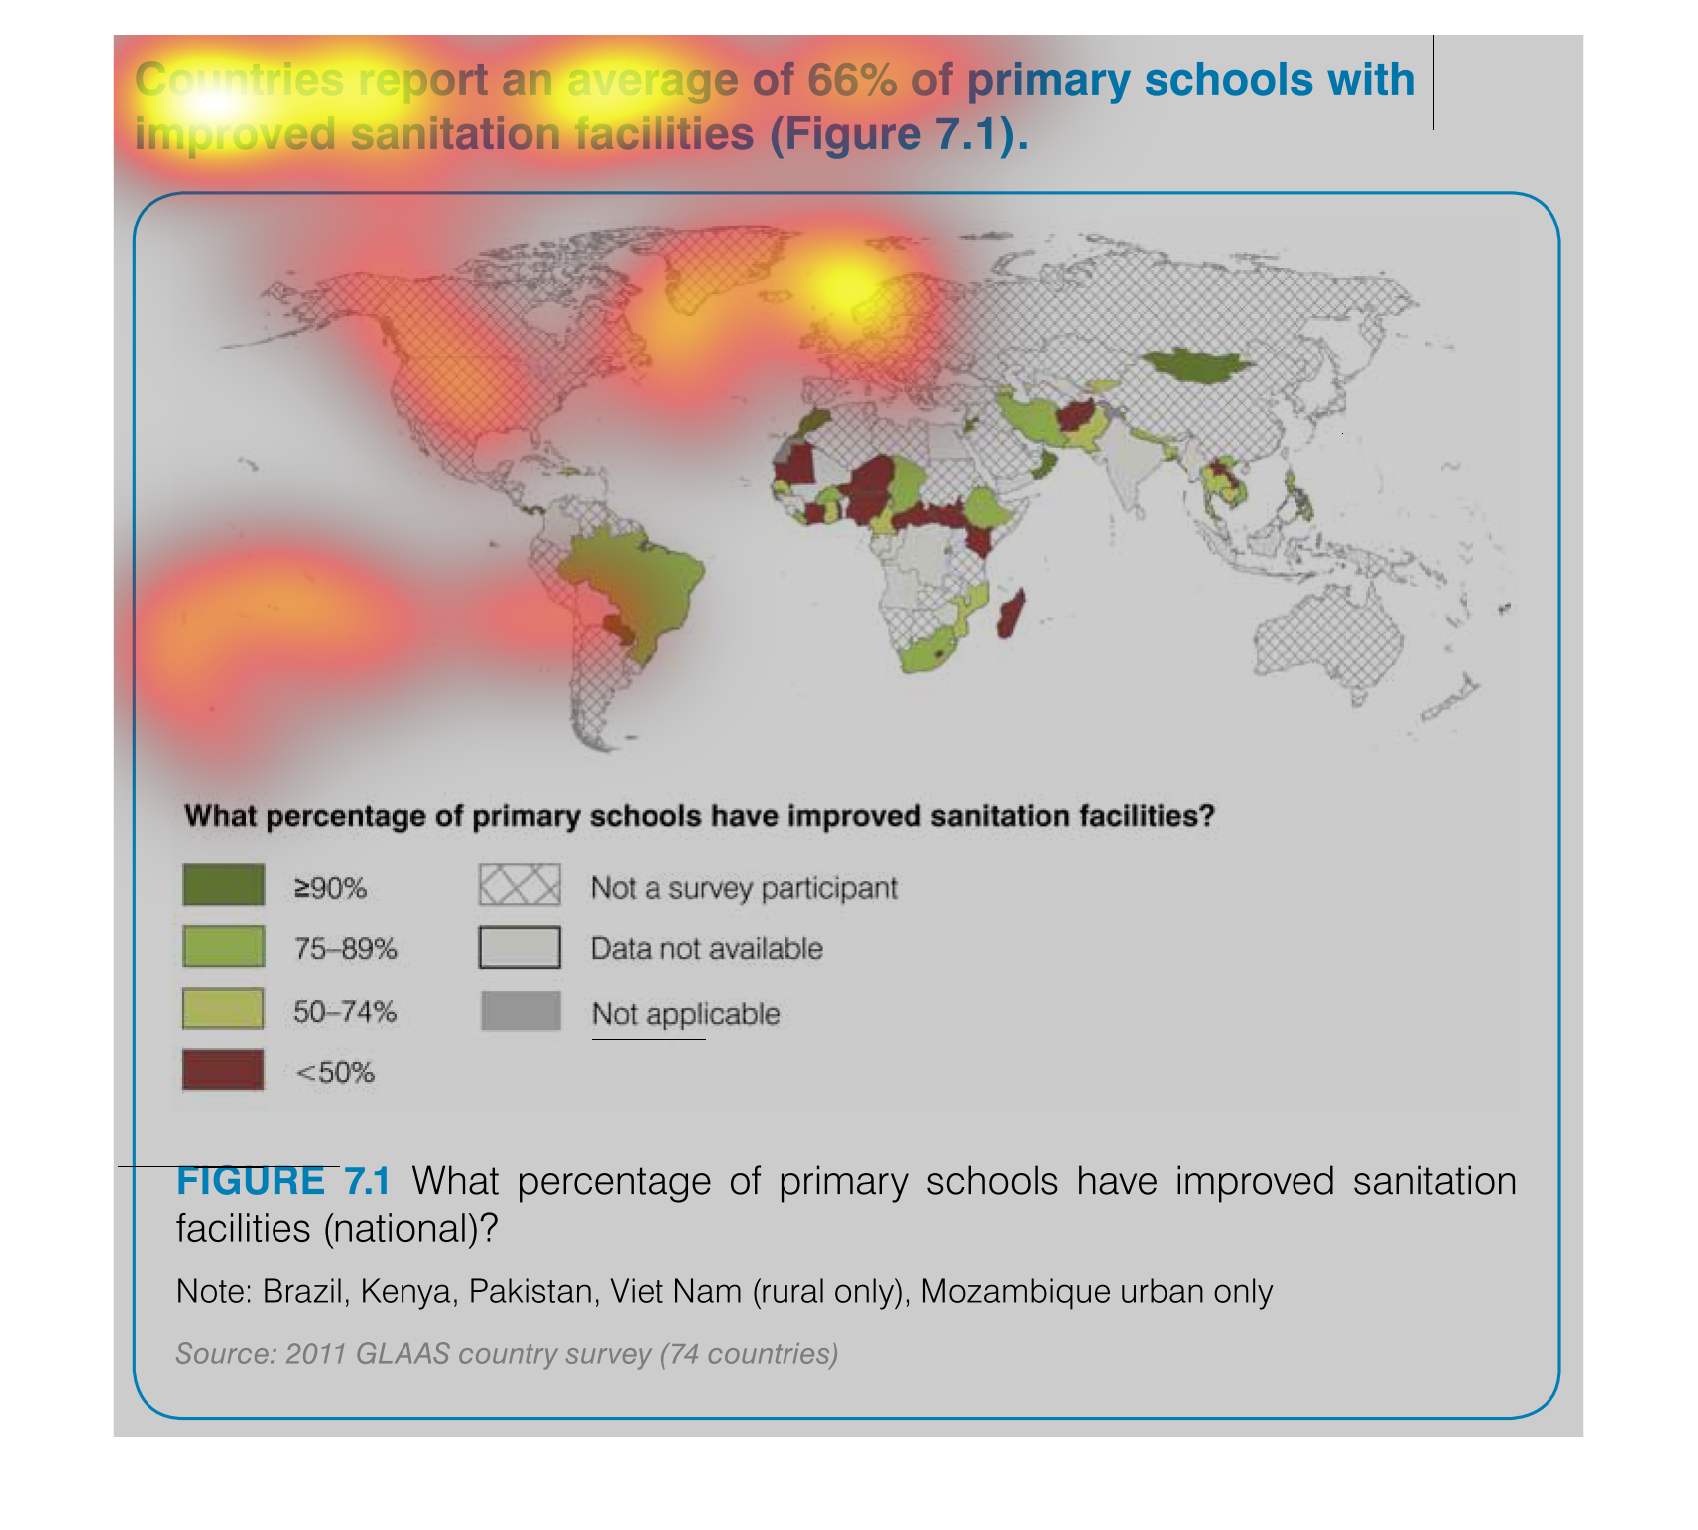
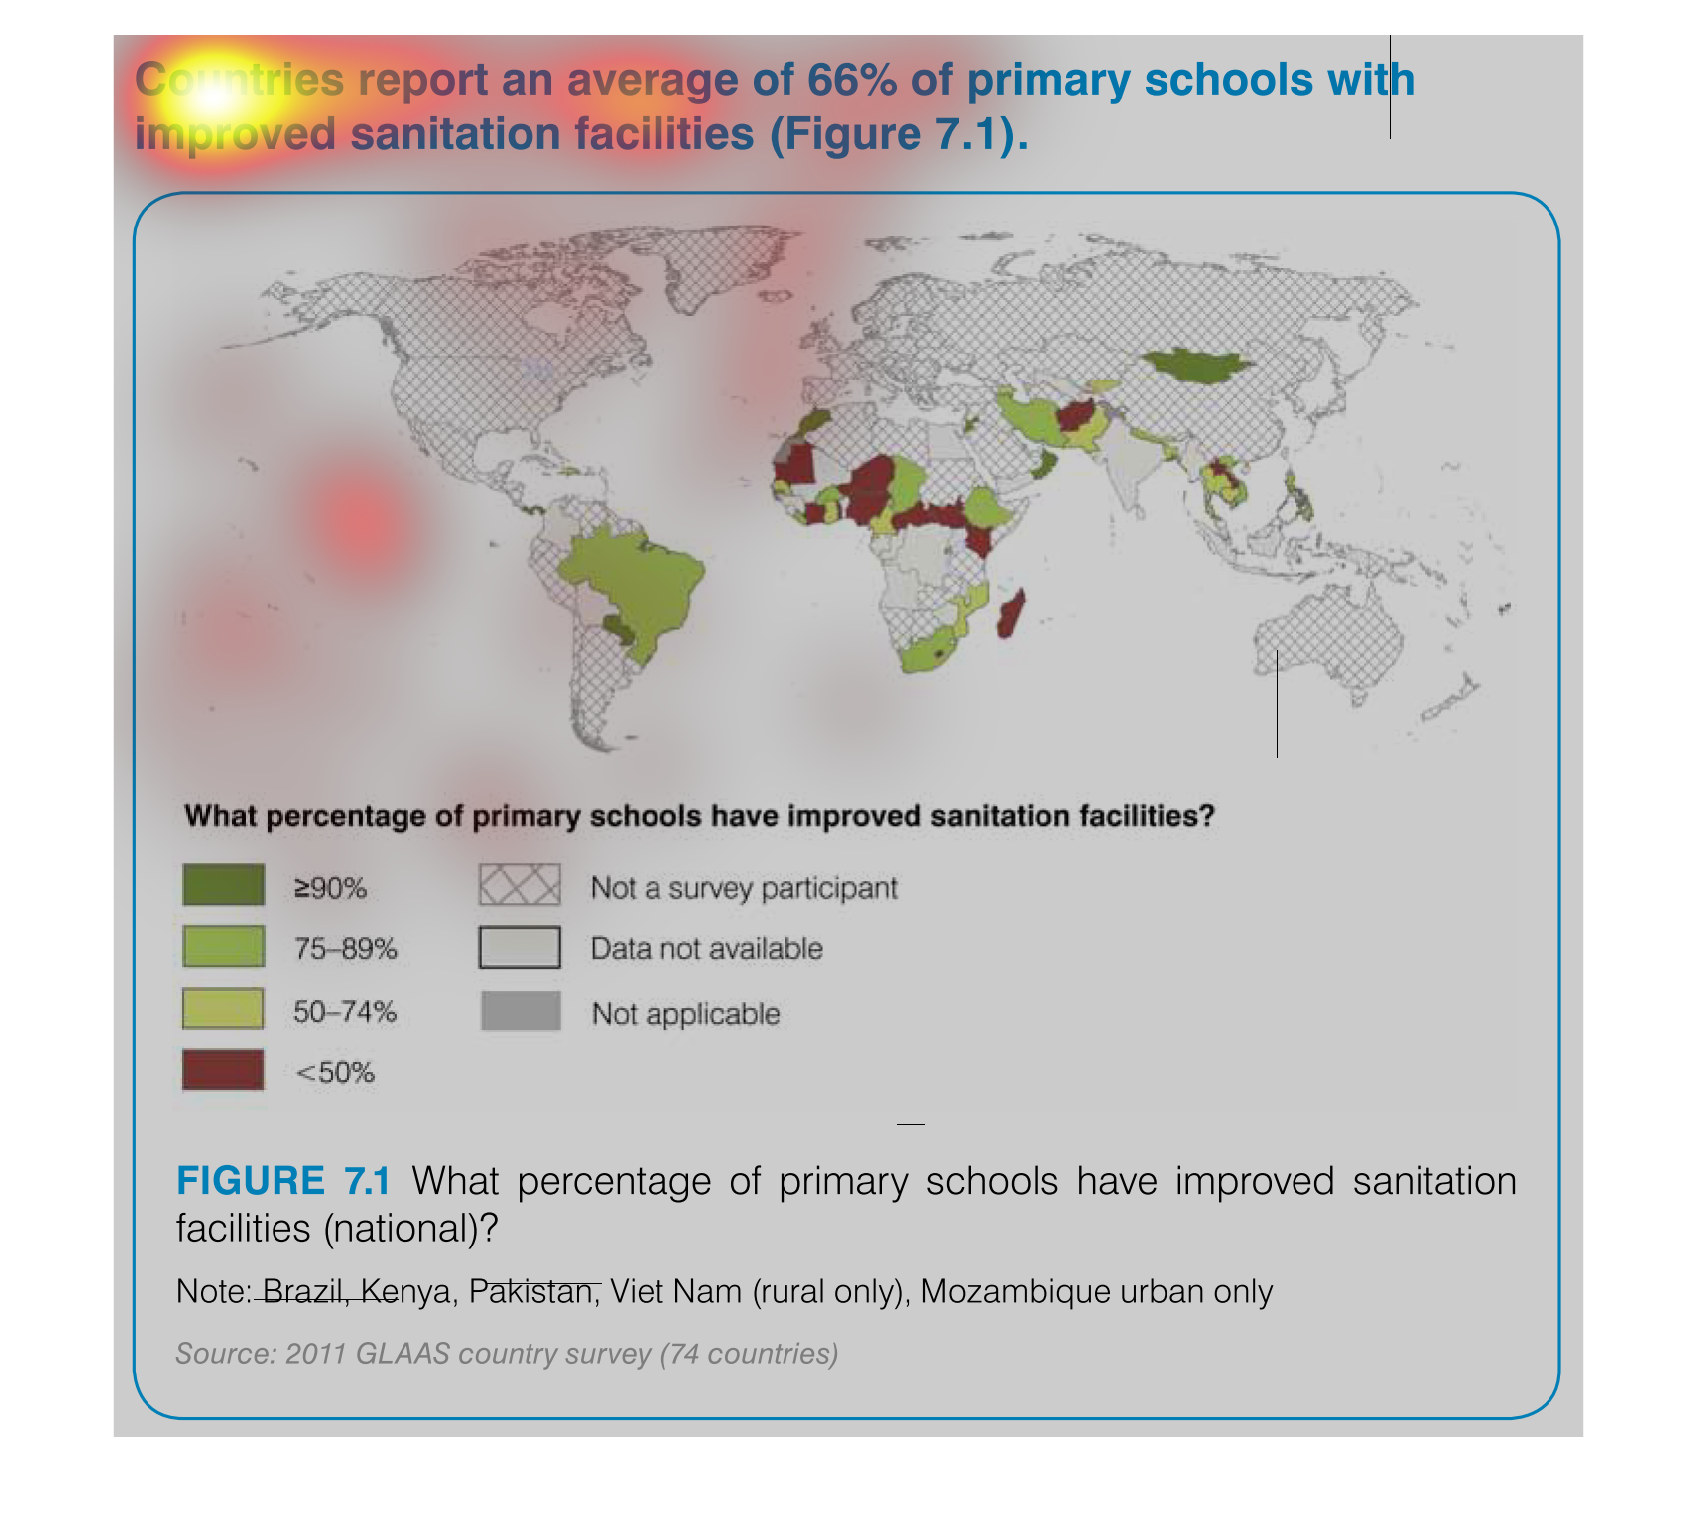
This info graphic shows how well elementary schools are performing in terms of sanitation.
The picture shows information from countries around the world.
The image is a map containing information on the sanitation level of primary school around
the world. It specifically focuses on the improvement of sanitation in primary schools and
organizes the information via a color coded map.
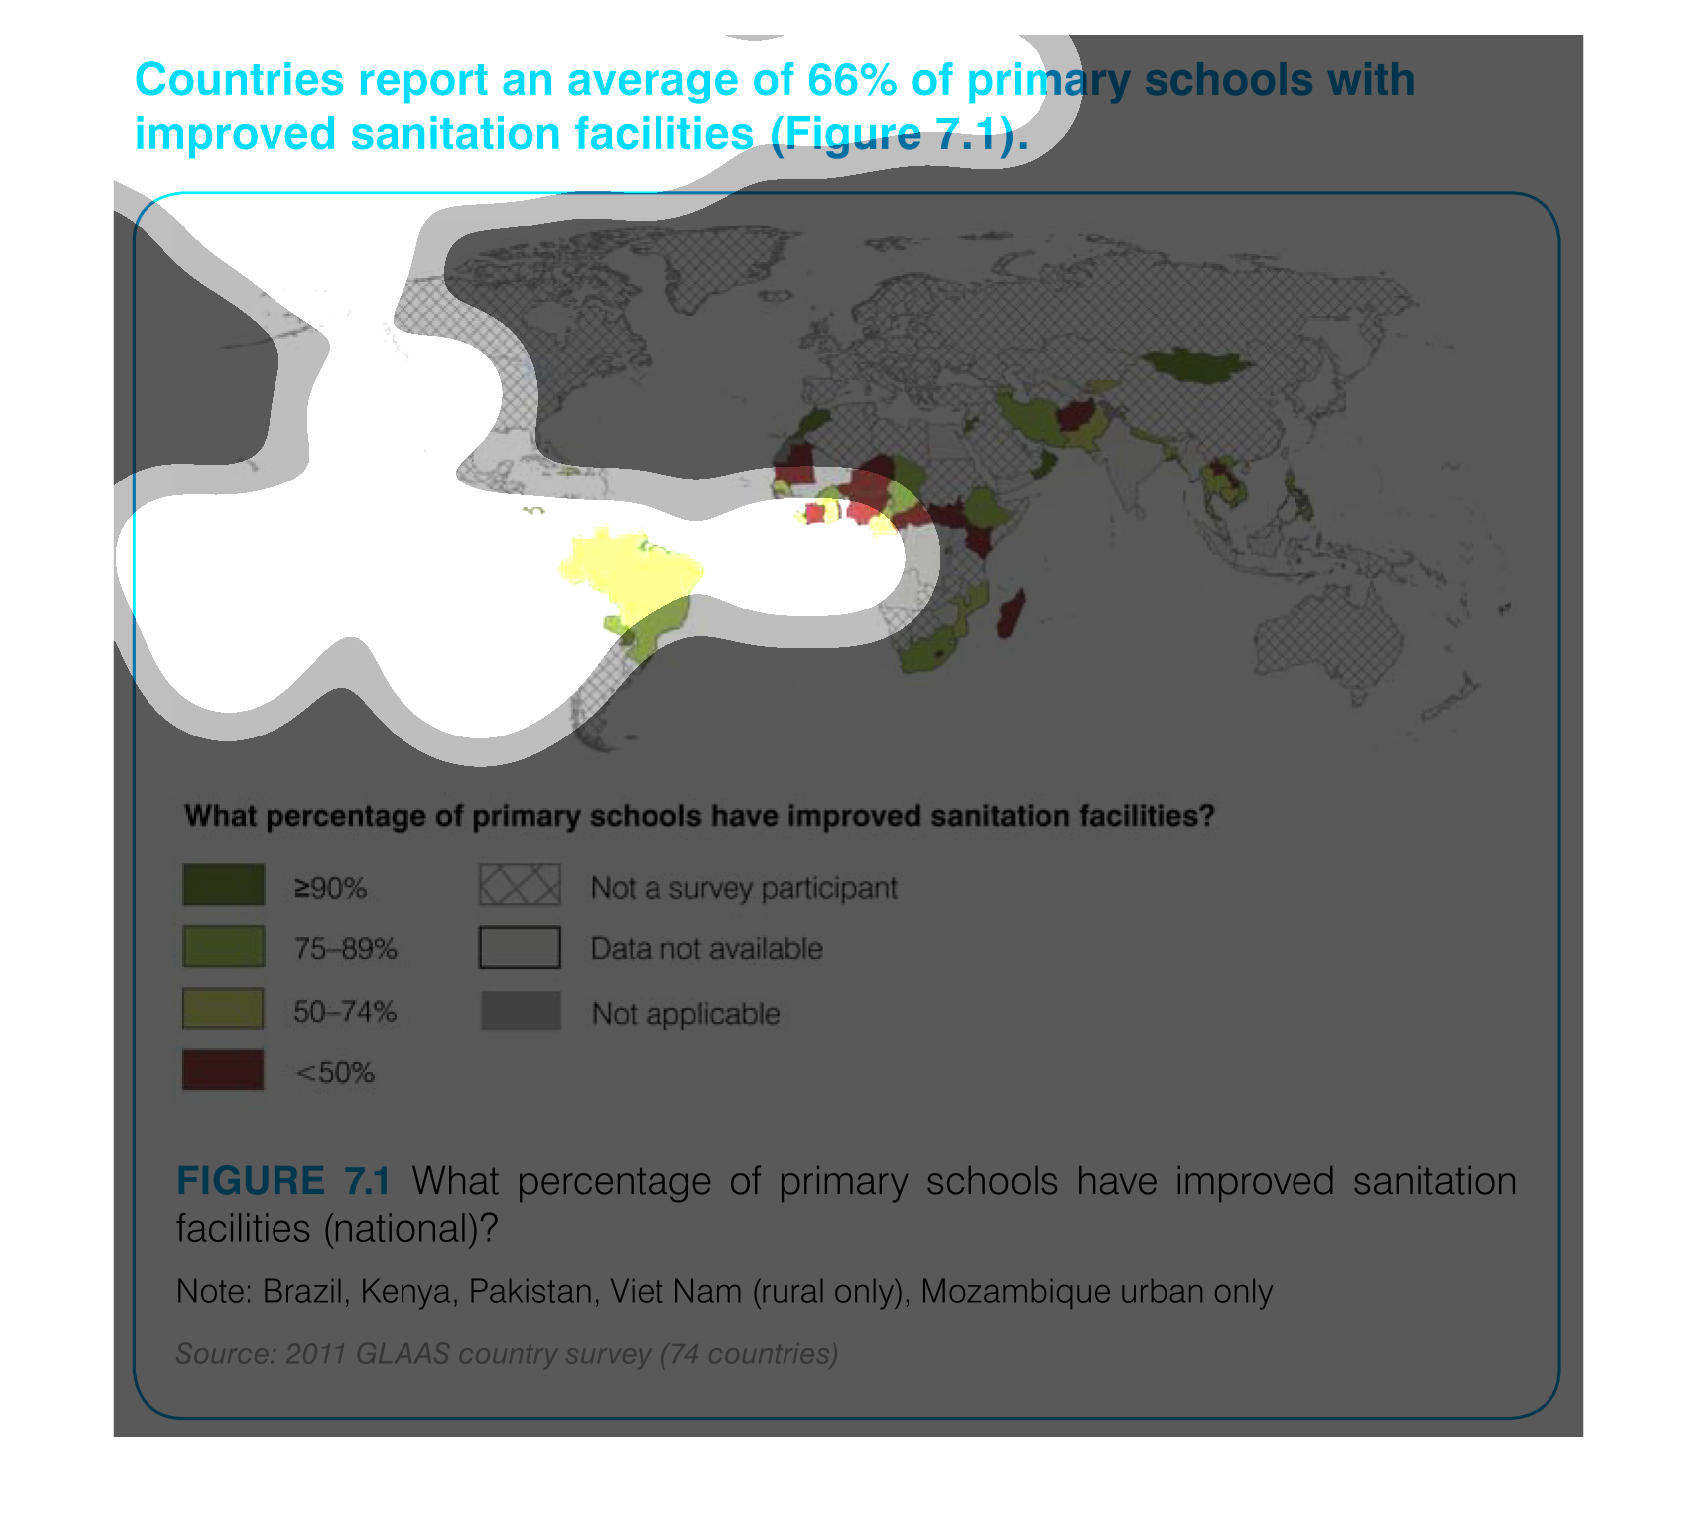
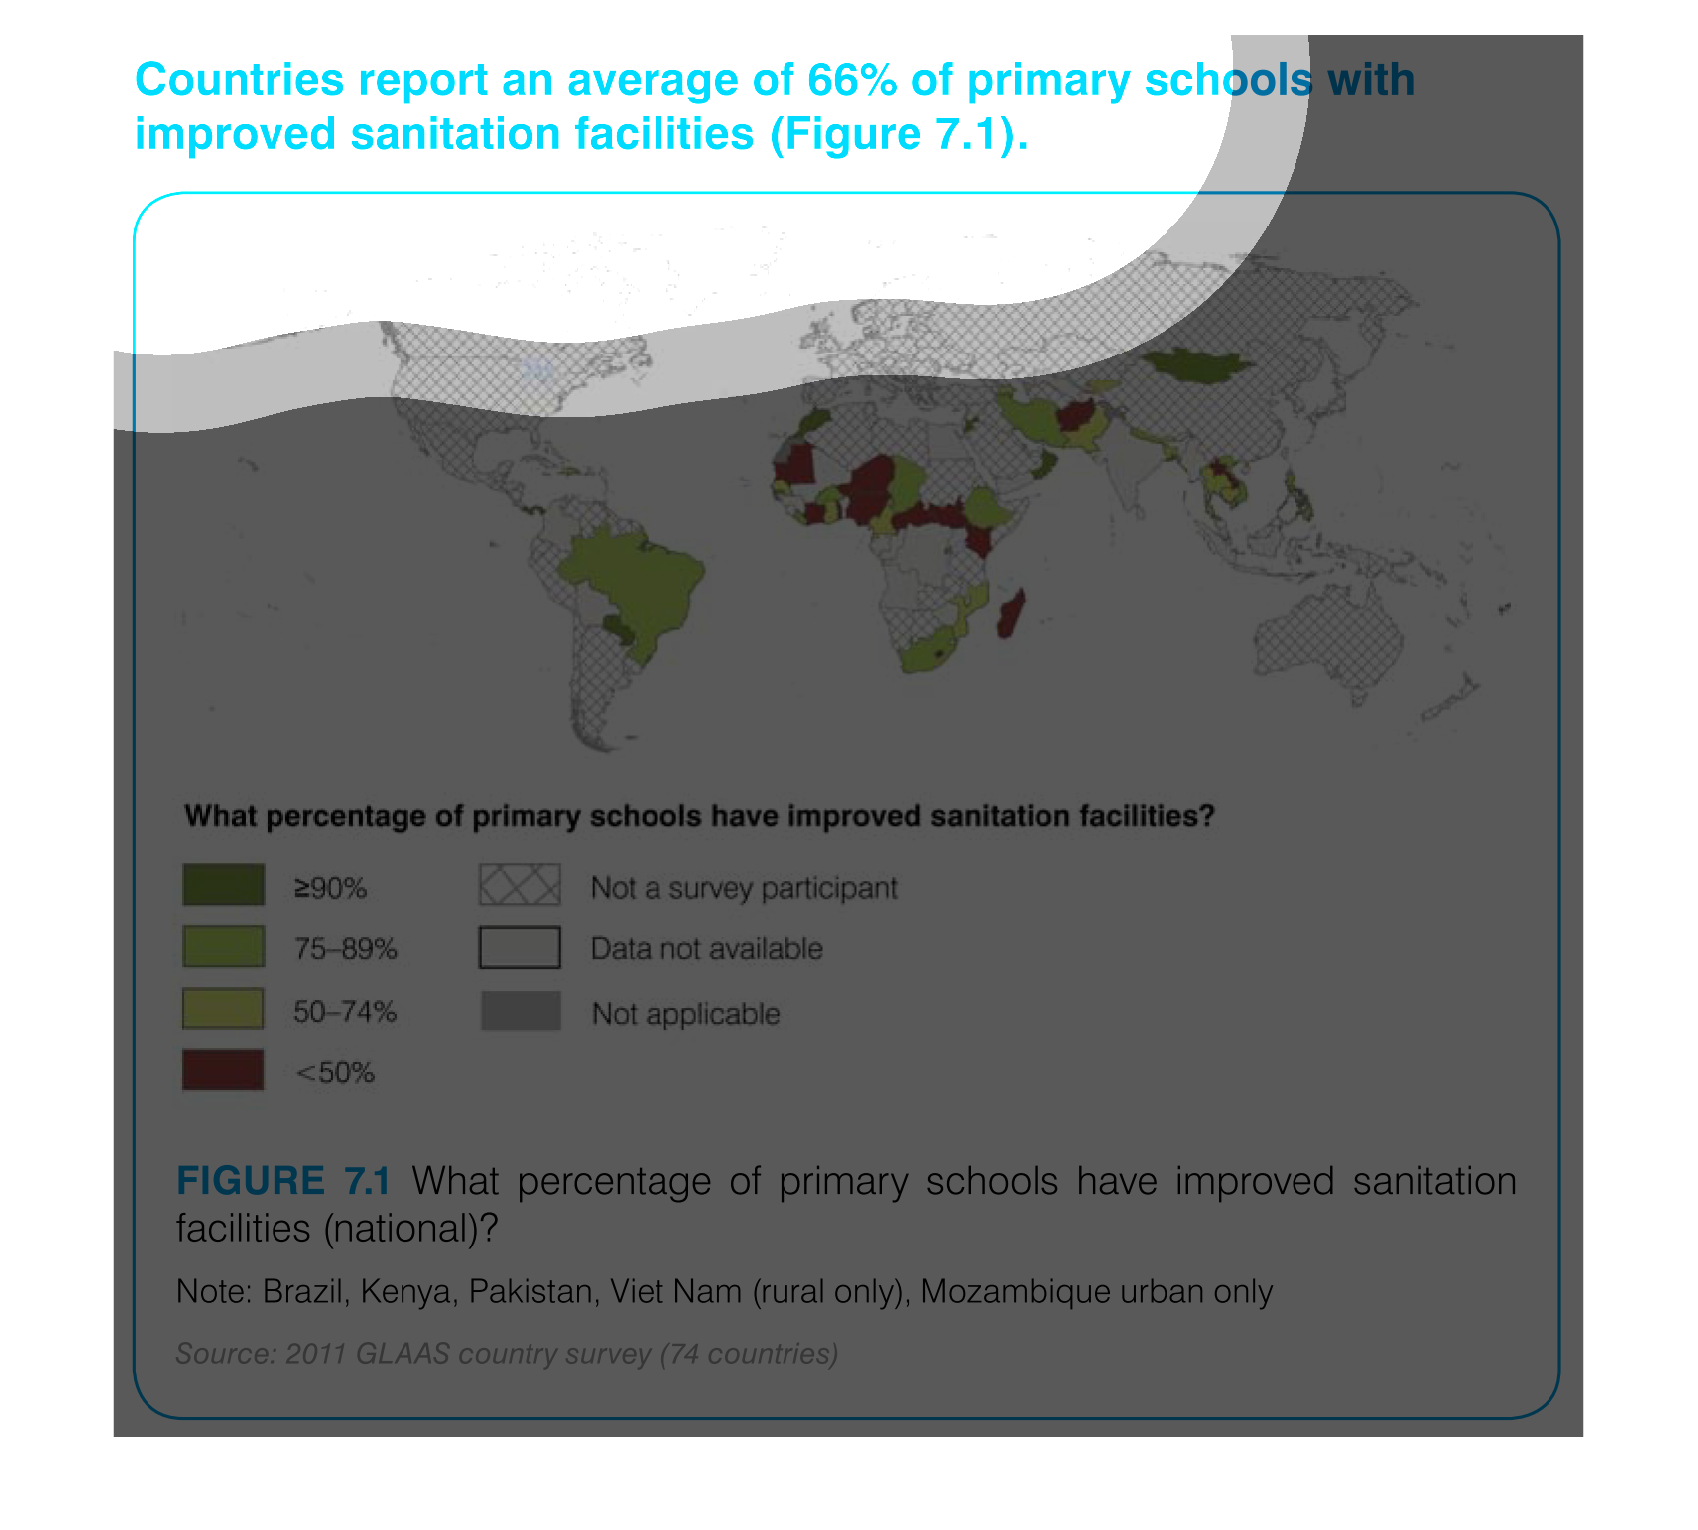
This map categorized countries based on the percentage of primary schools with improved sanitation
facilities. North America, Europe, and some Asian countries did not participate in the study.
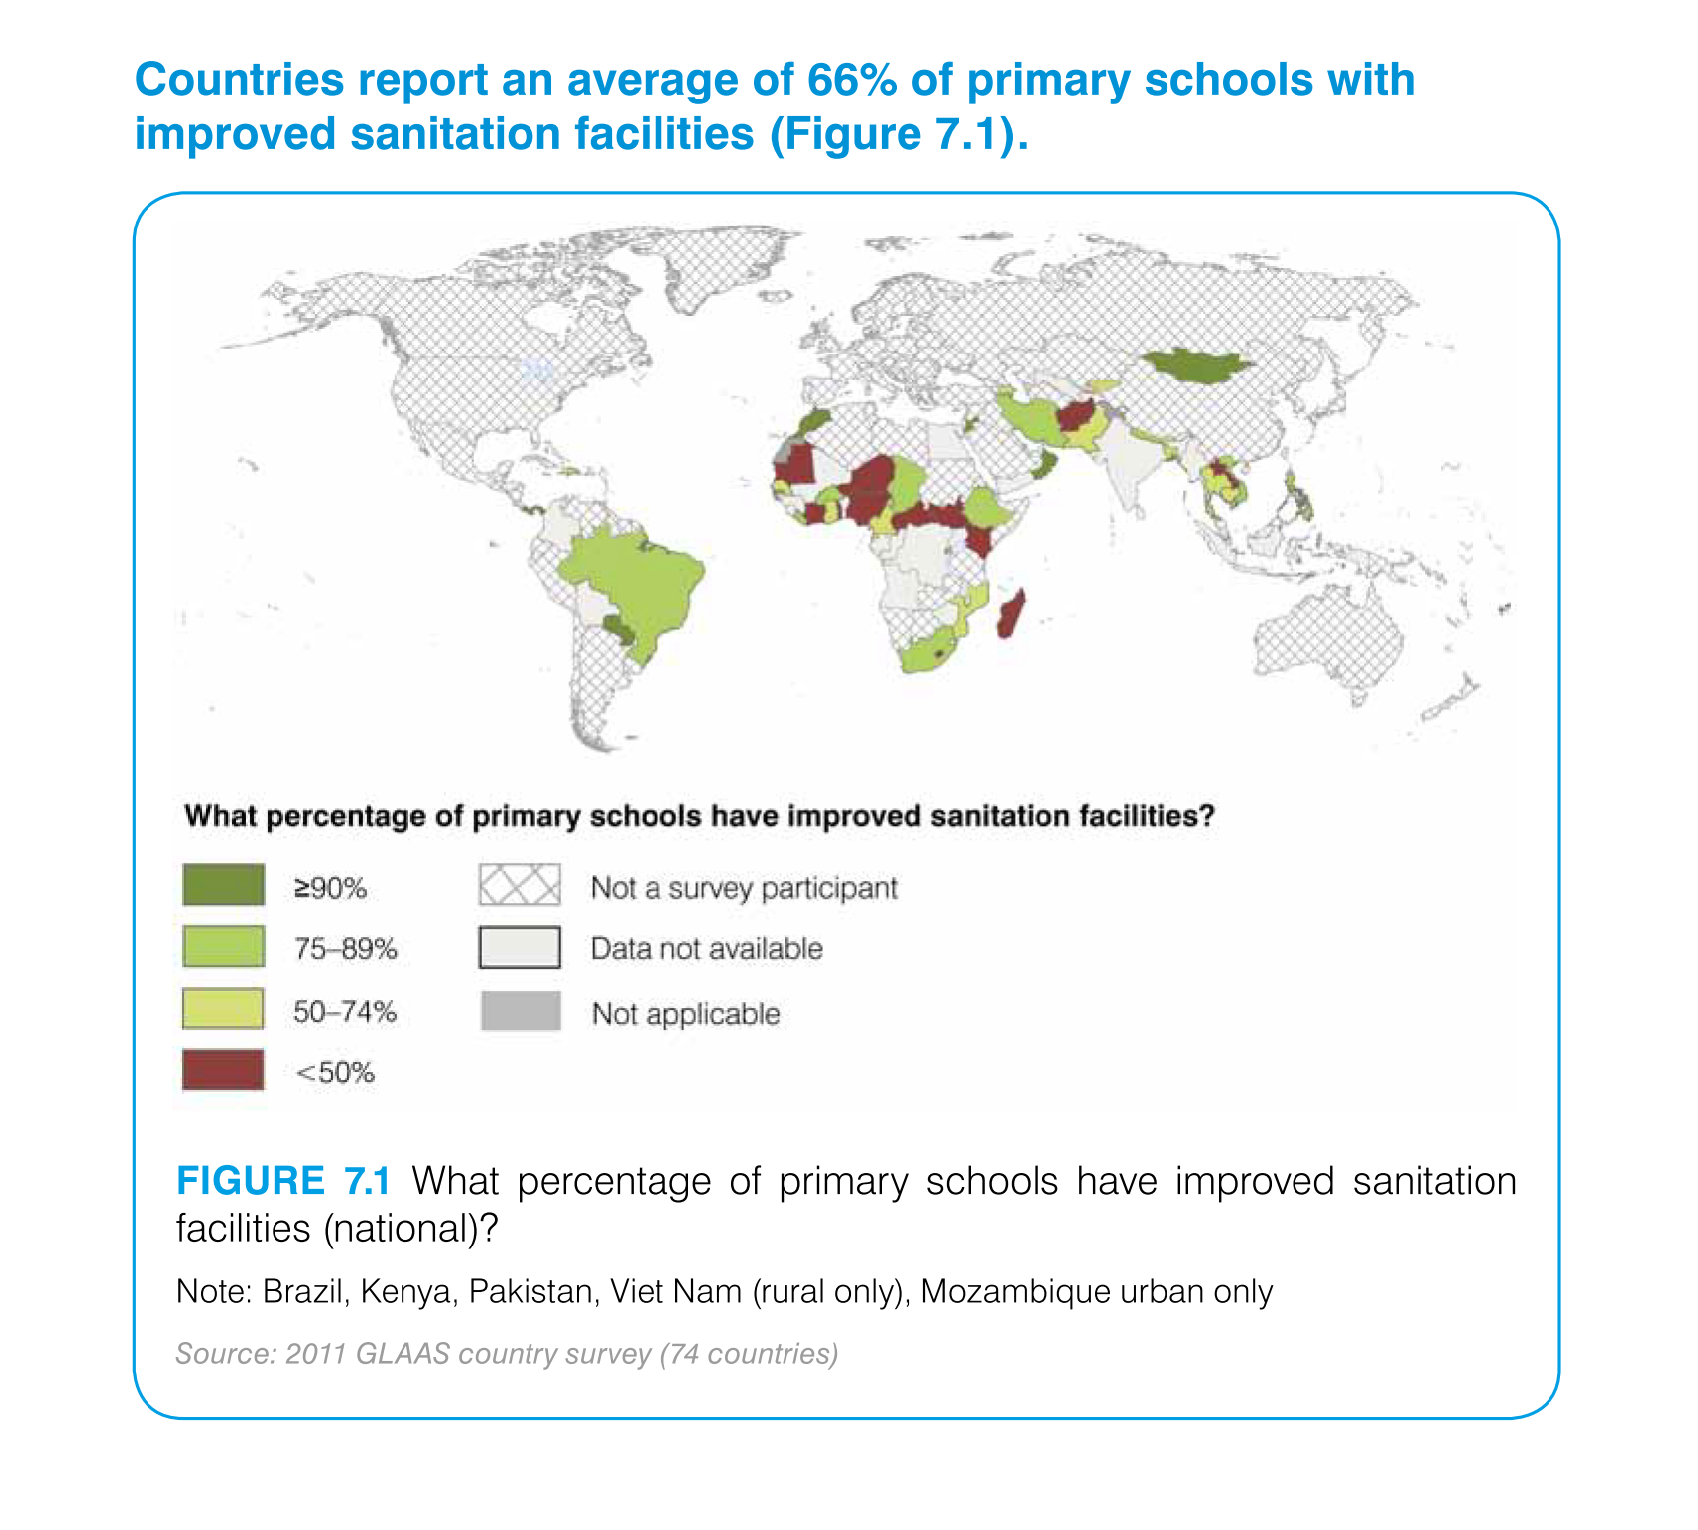
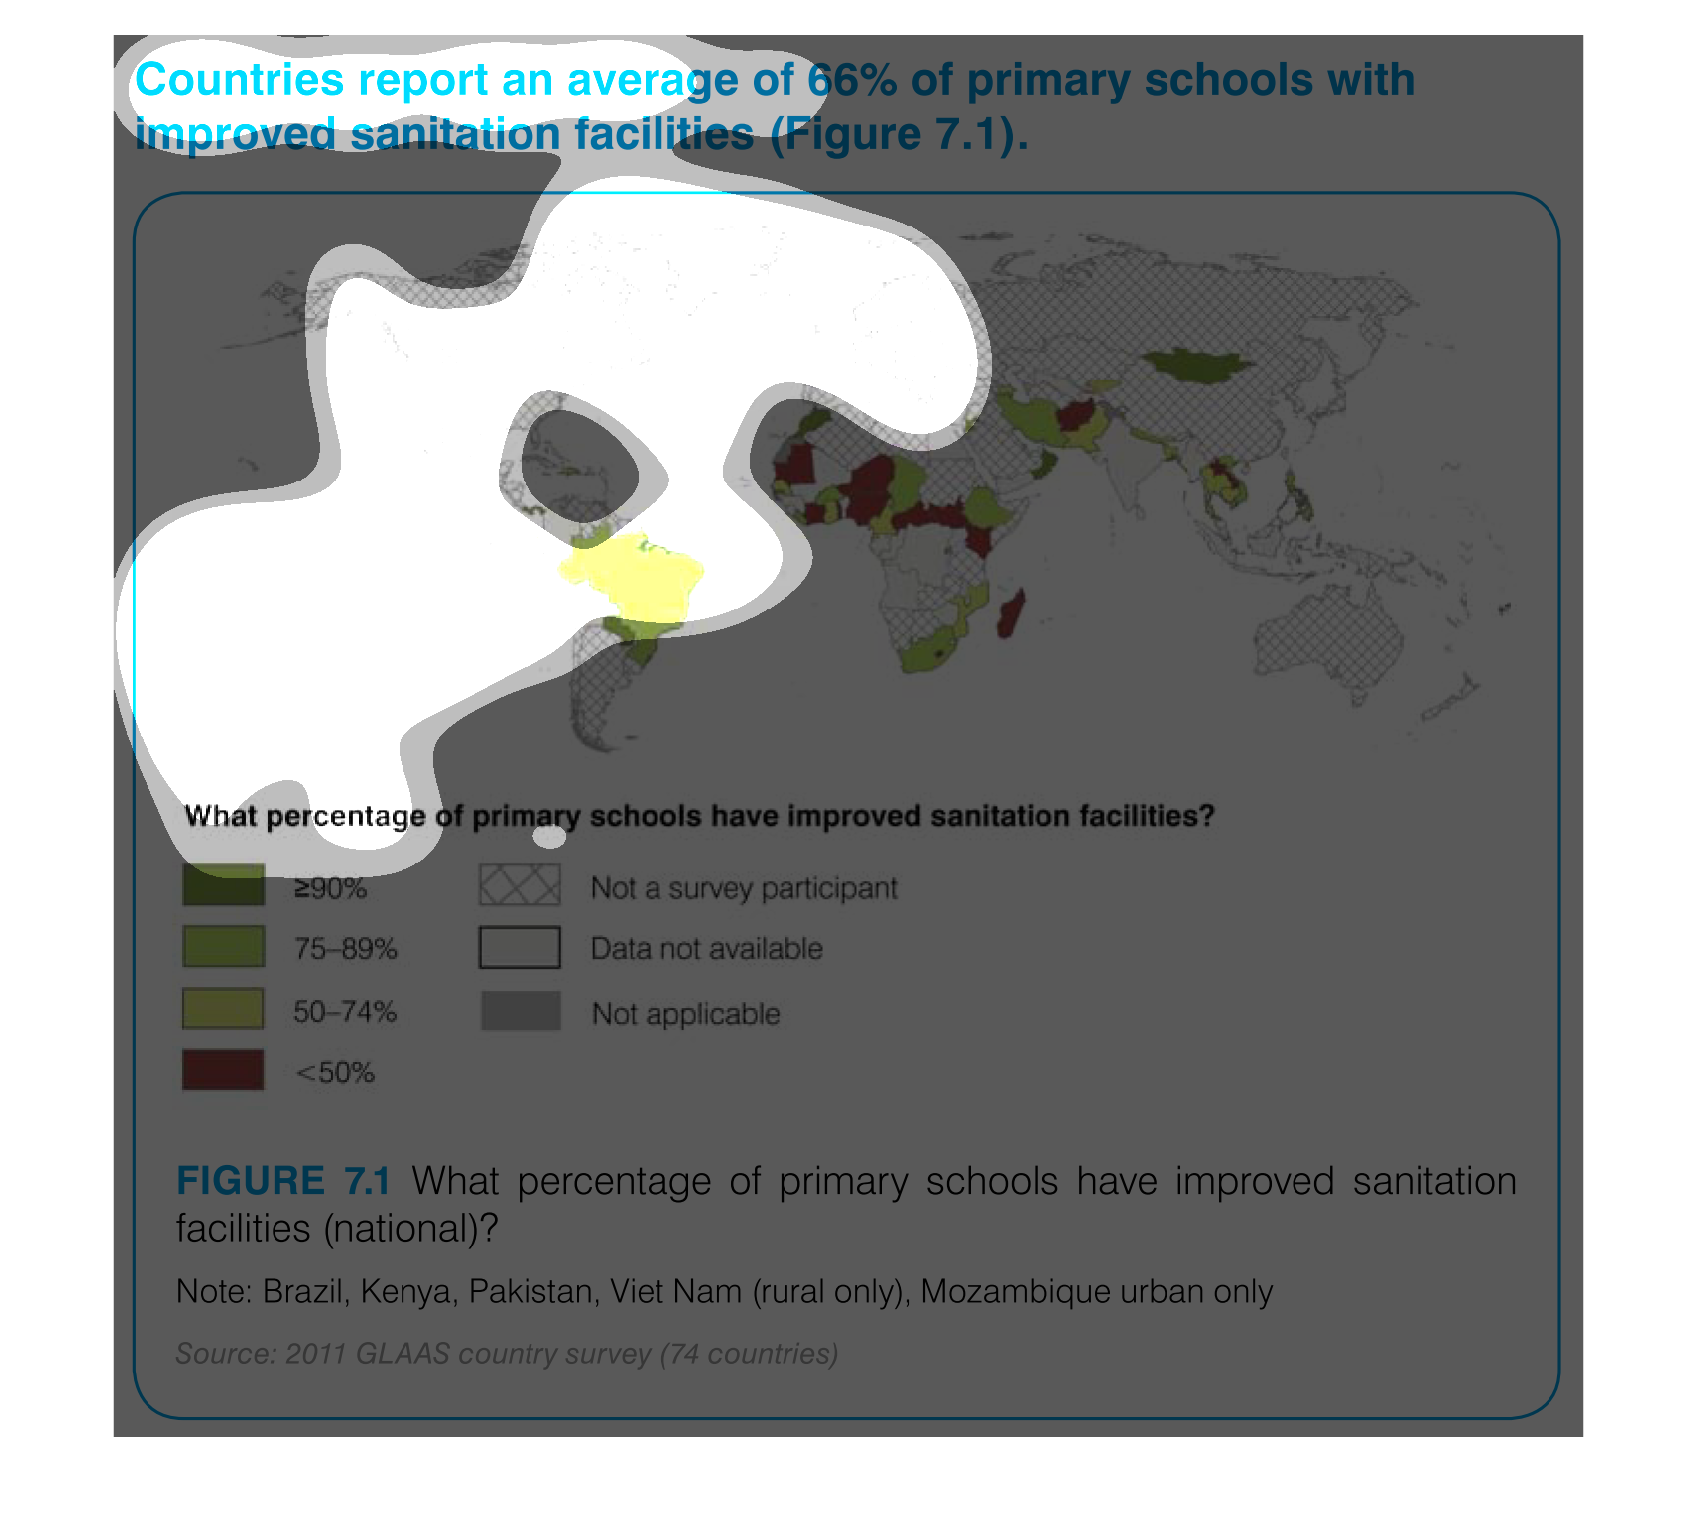
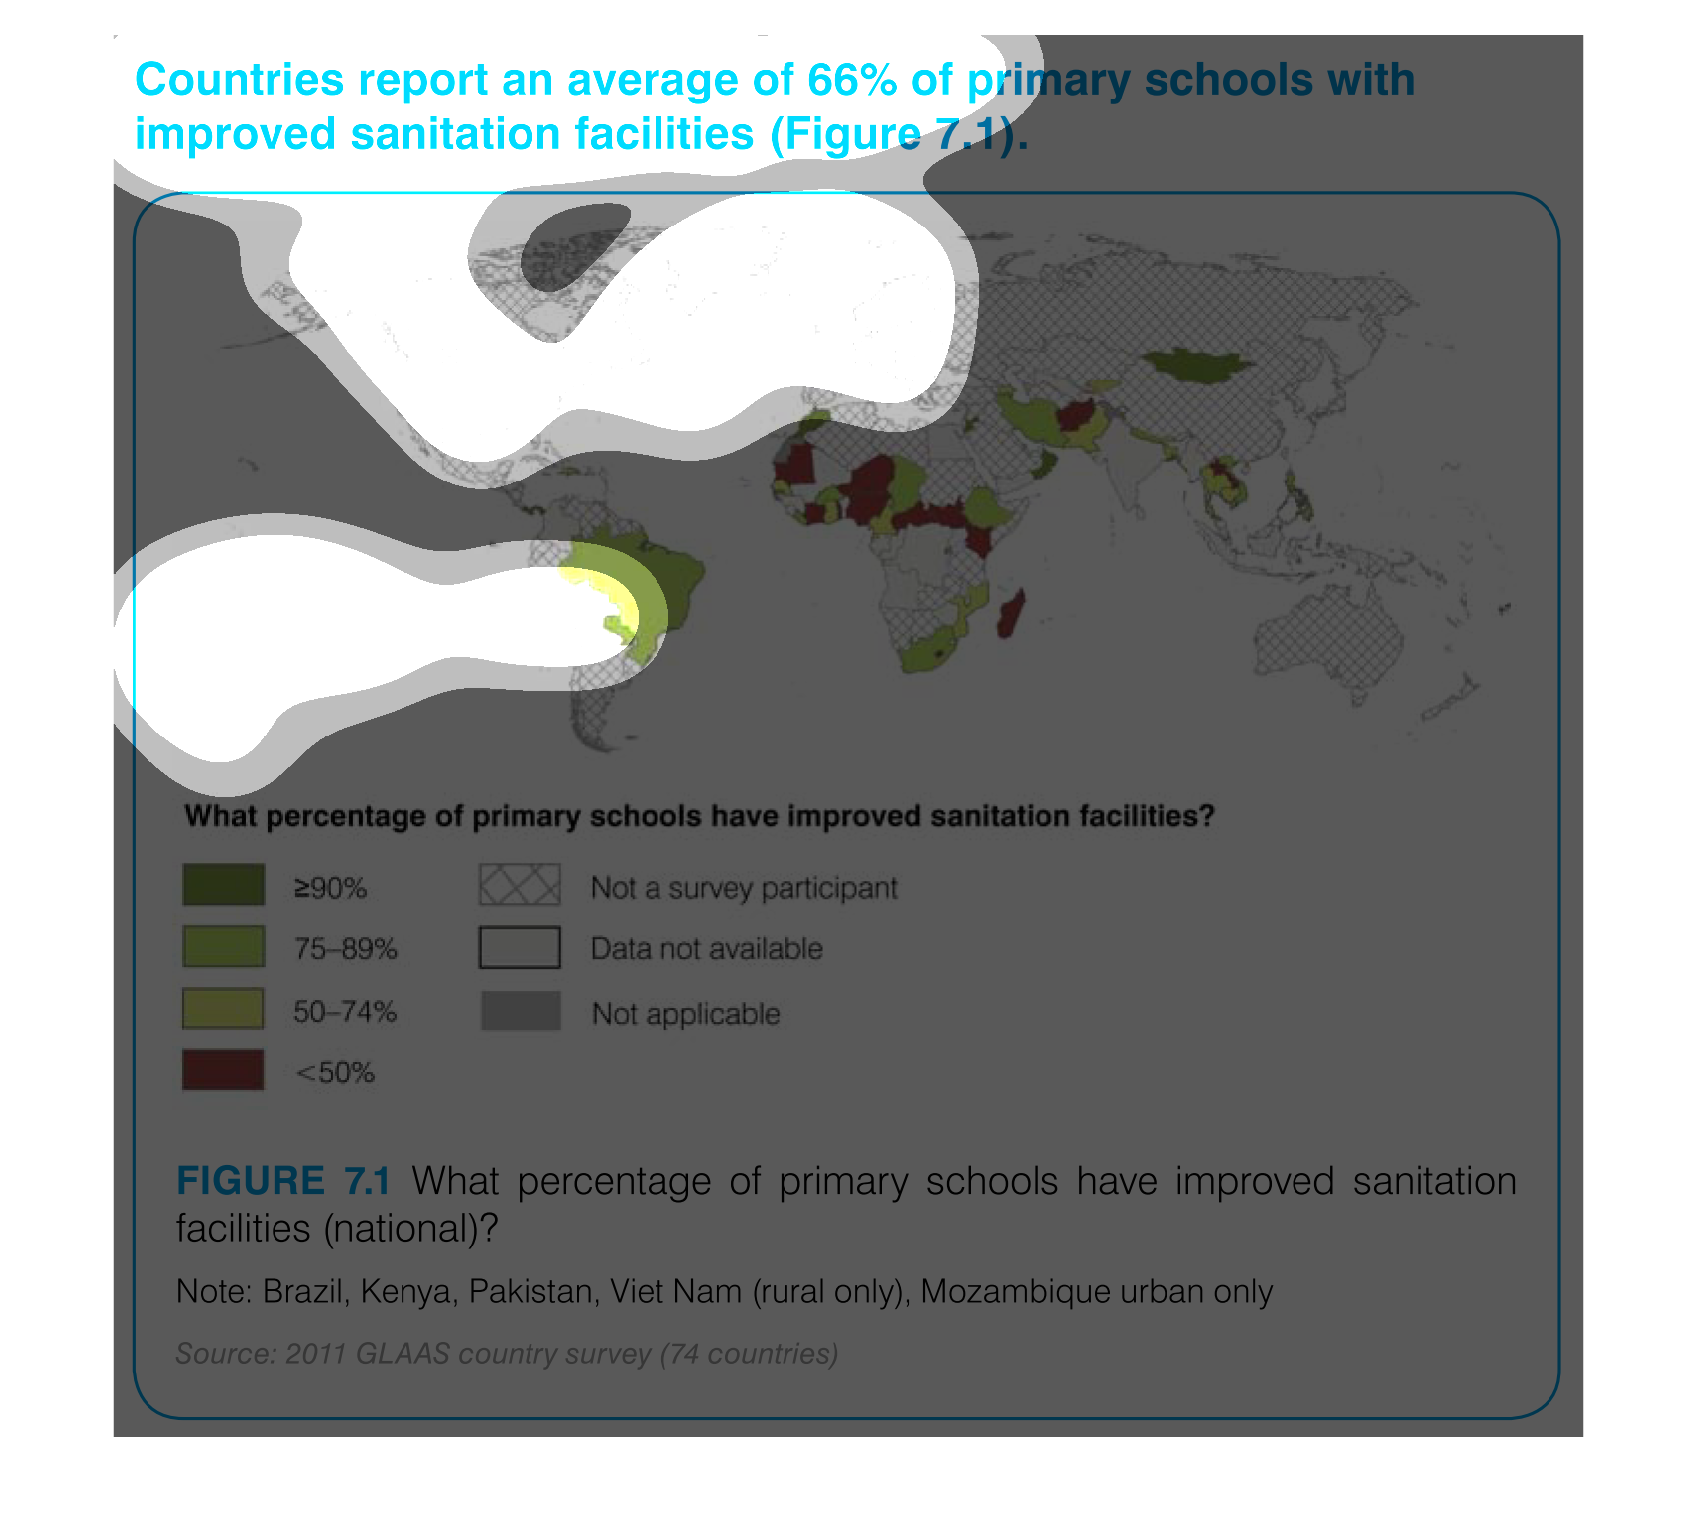
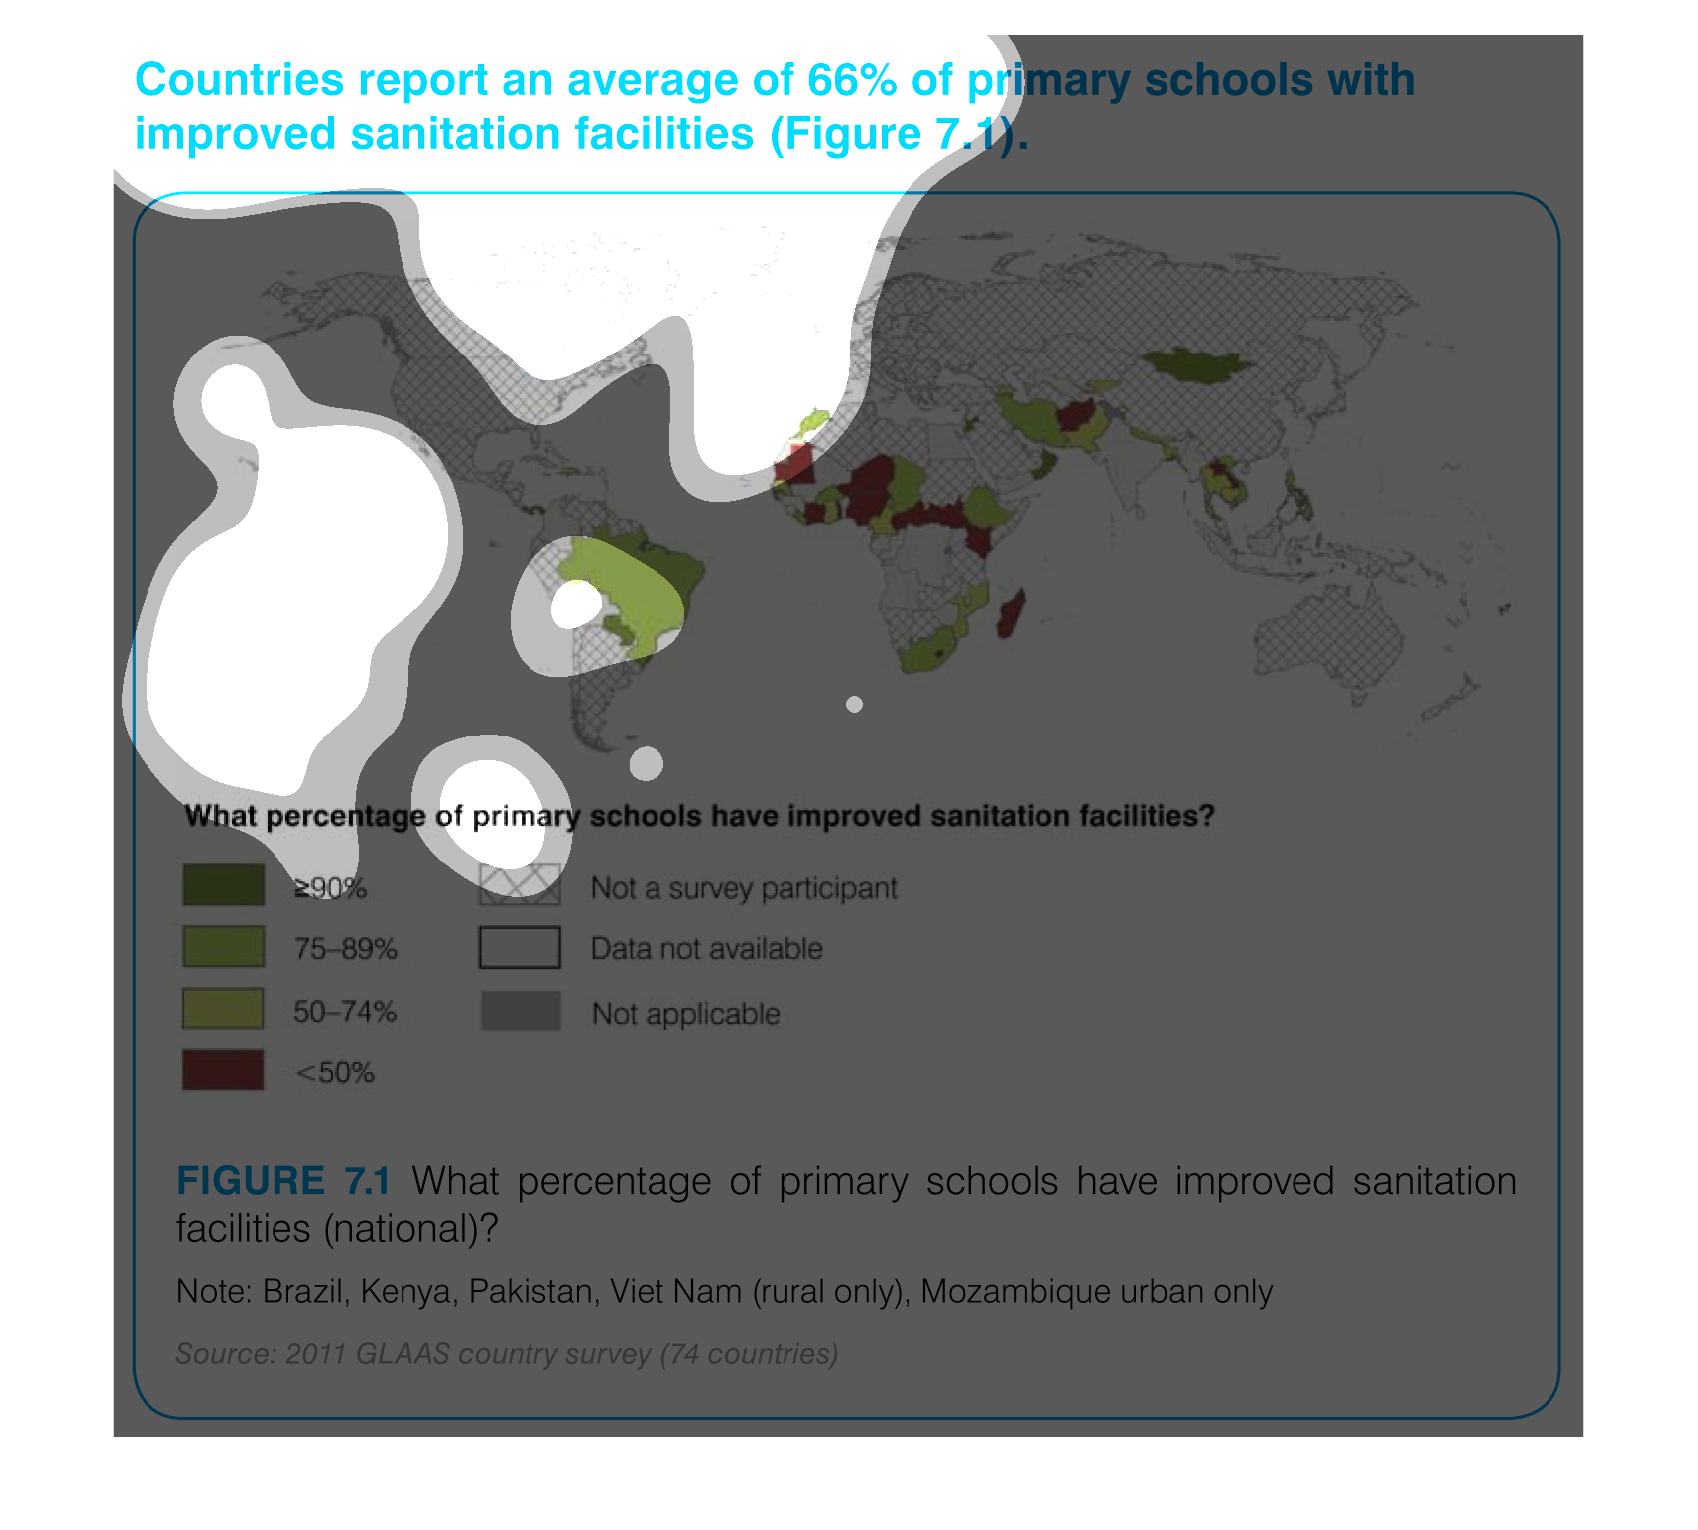
Cleanliness is next to godly as the saying goes, and in this illustration we see the steps
certain regions in the world have taken secure that they do their best to clean this up in
schools.
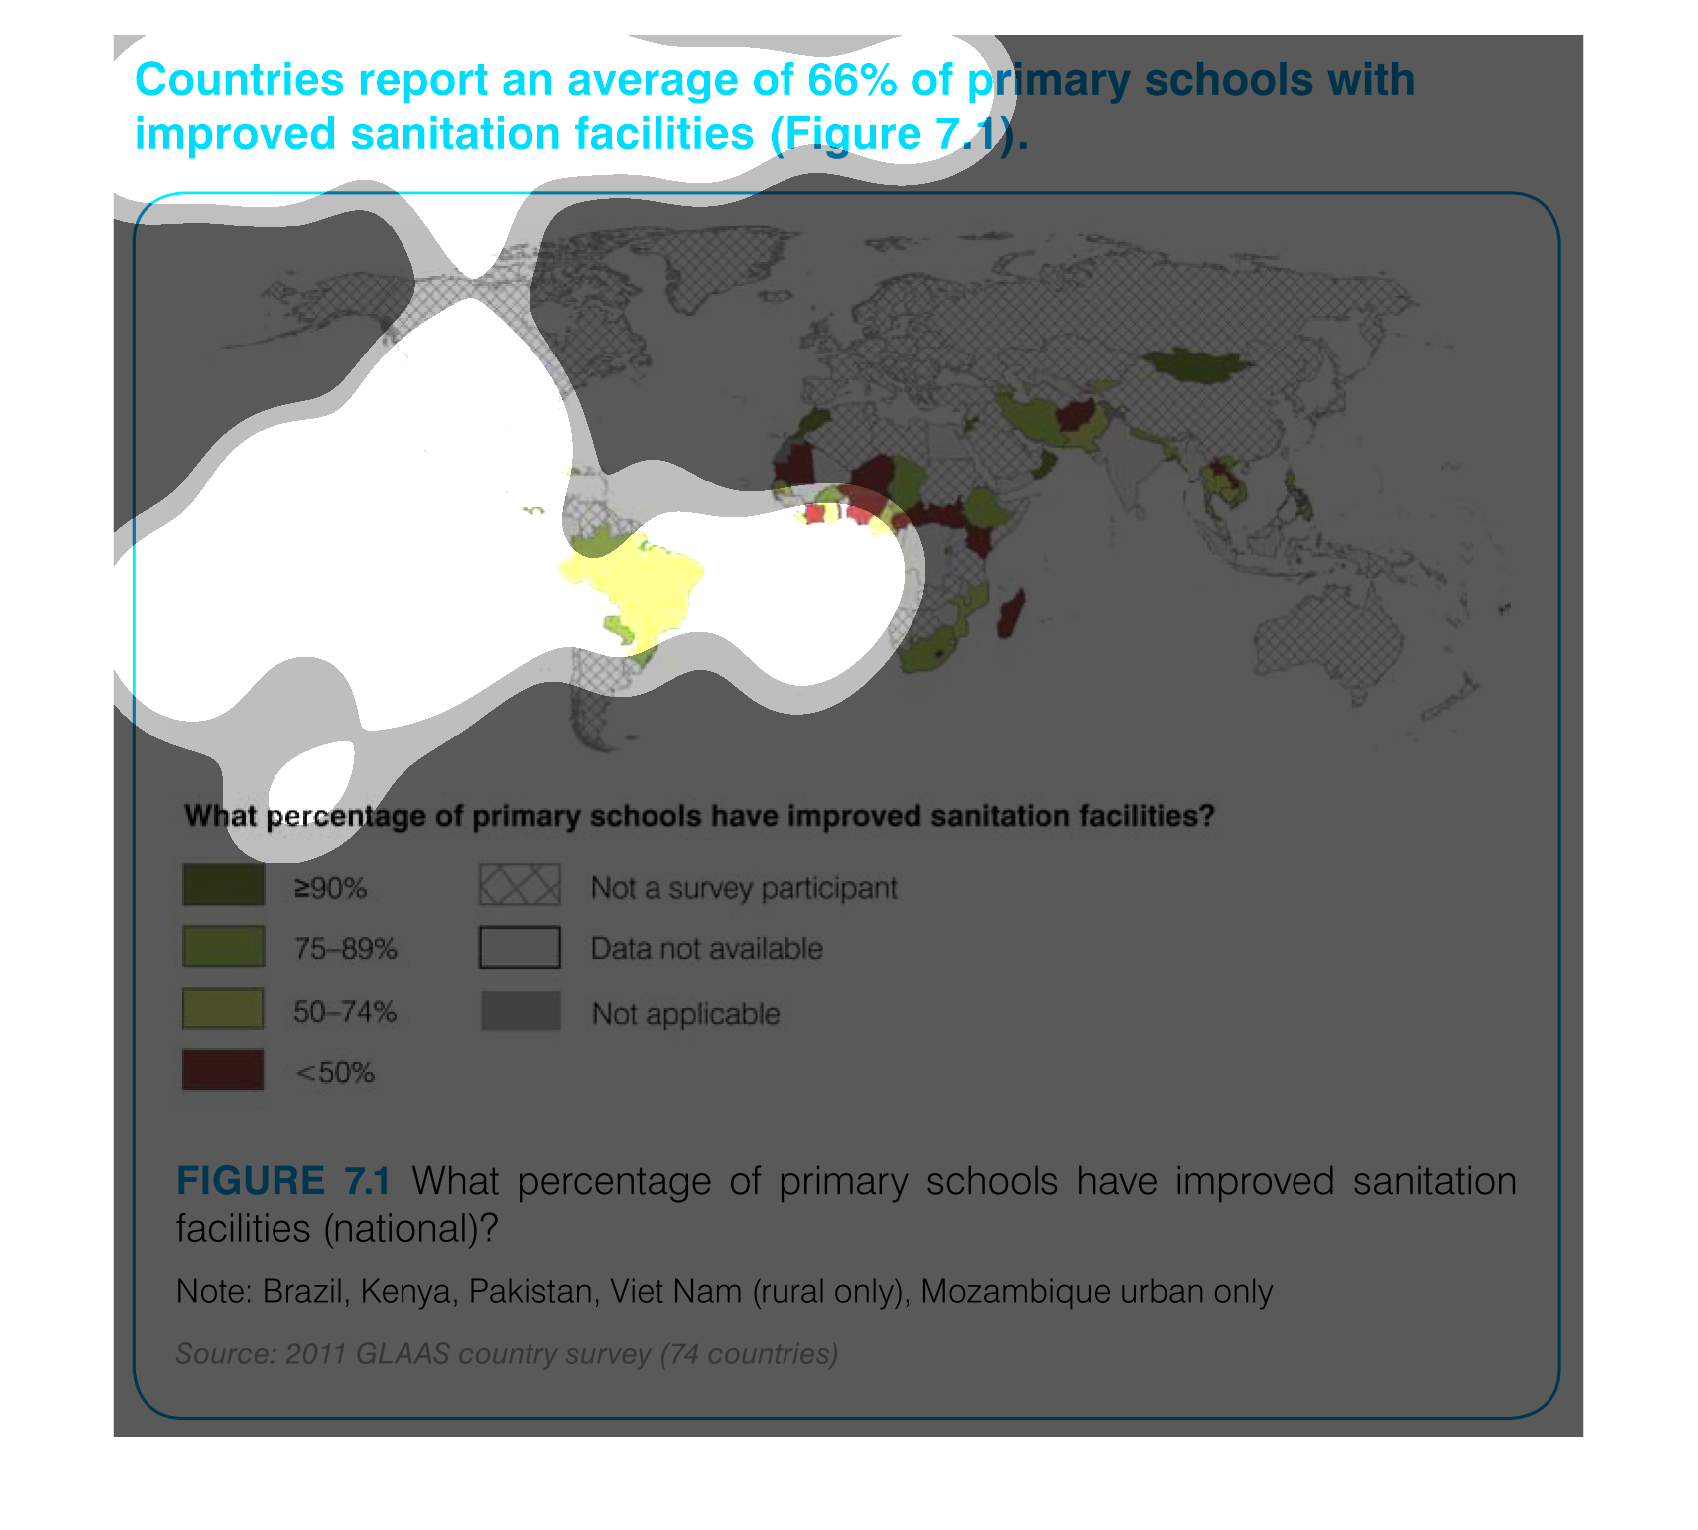
This chart describes countries report an average of sixty-six percent of primary school with
improved sanitation facilities. Different categories are represented by different colors.
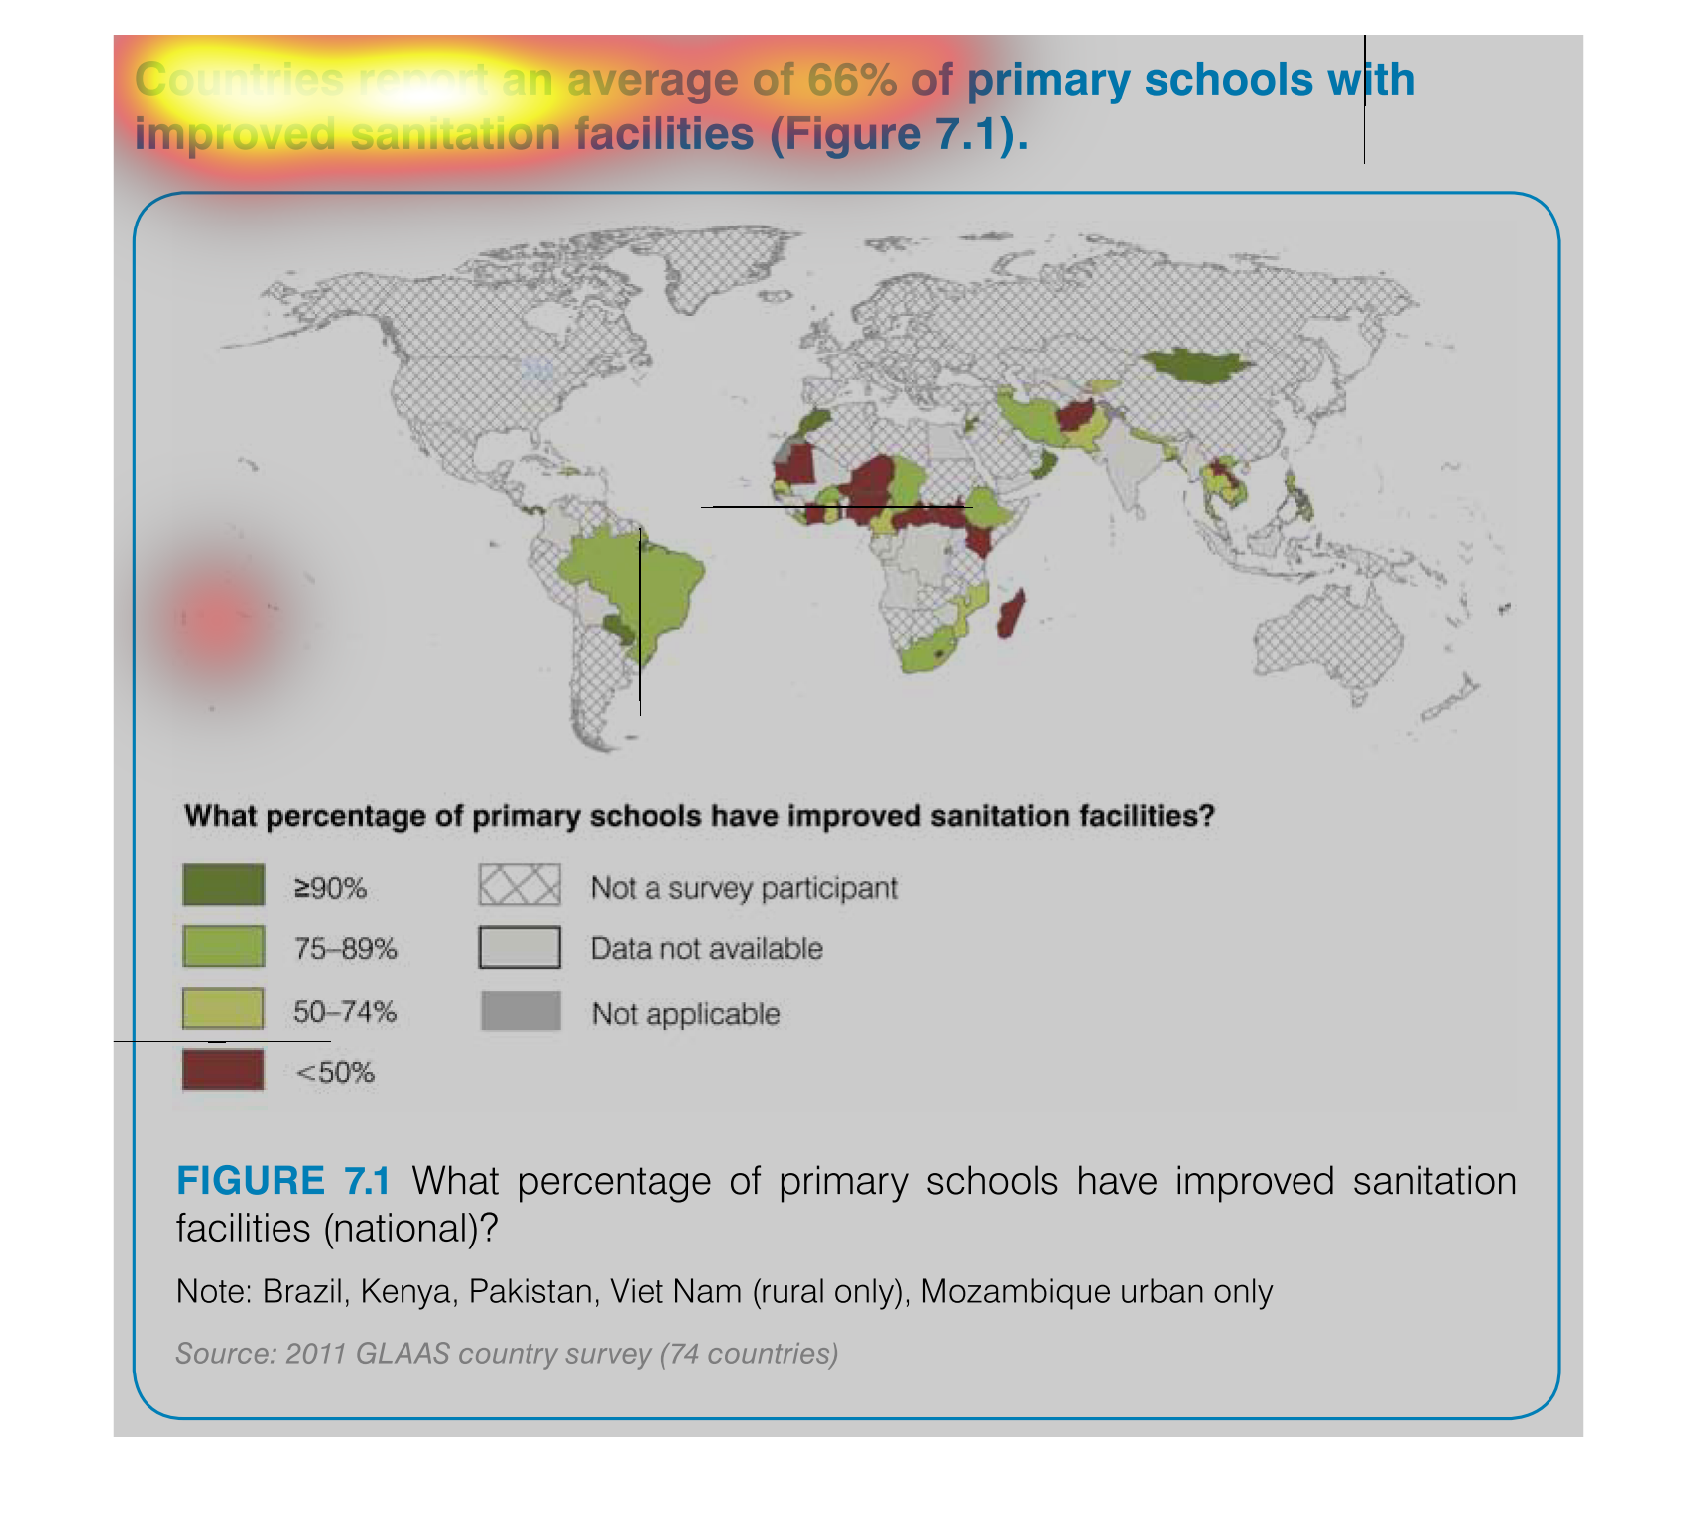
This image shows some countries that have reported improved sanitation facilities in primary
schools.  There is an average of 66% that have had there sanitation facilities improved.
Brazil was a major contributor  to this percentage. However, parts of Africa hurt this number.
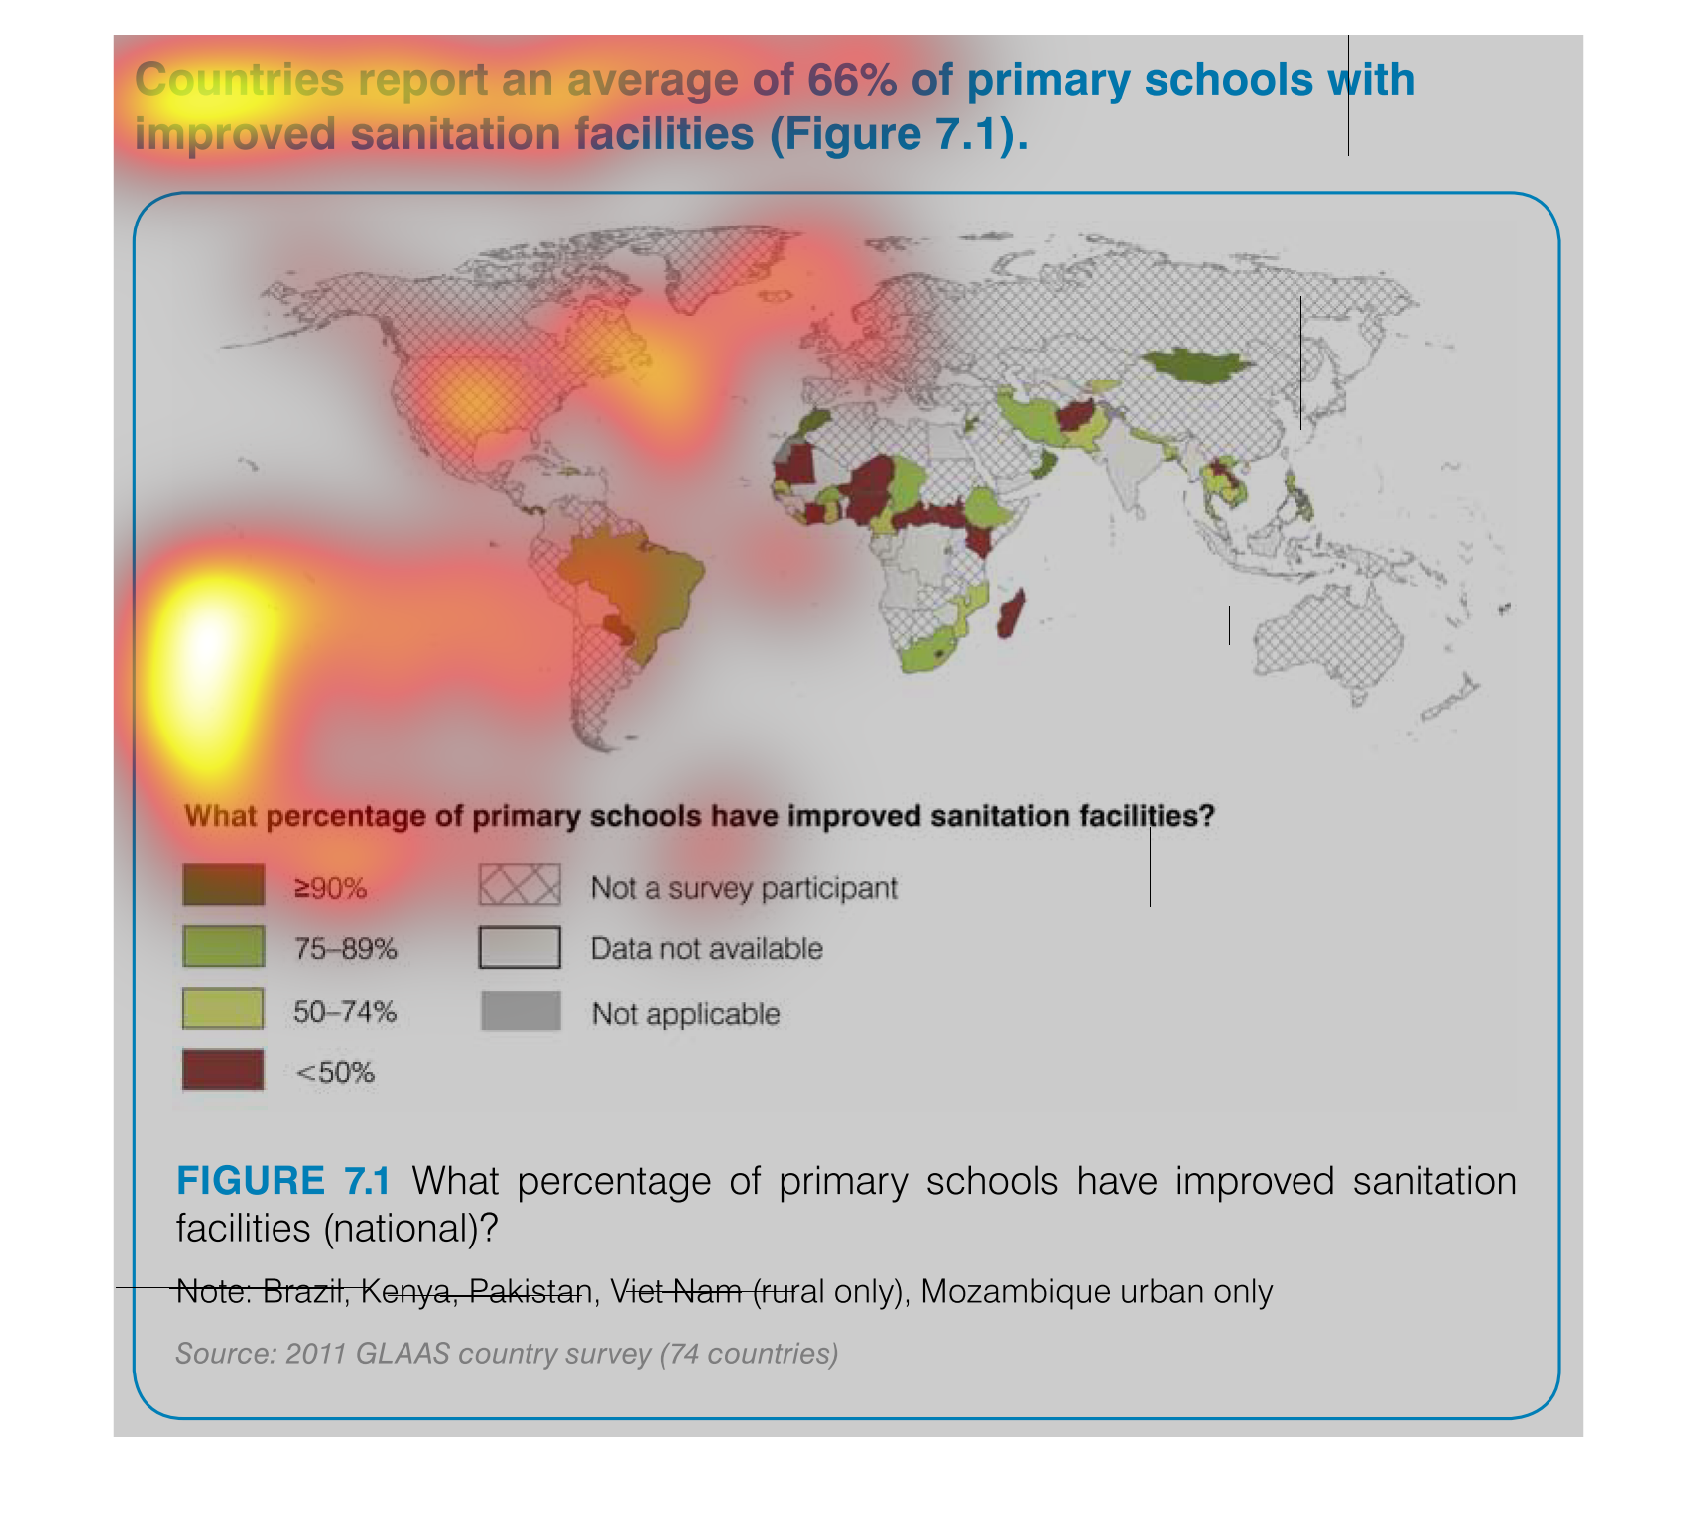
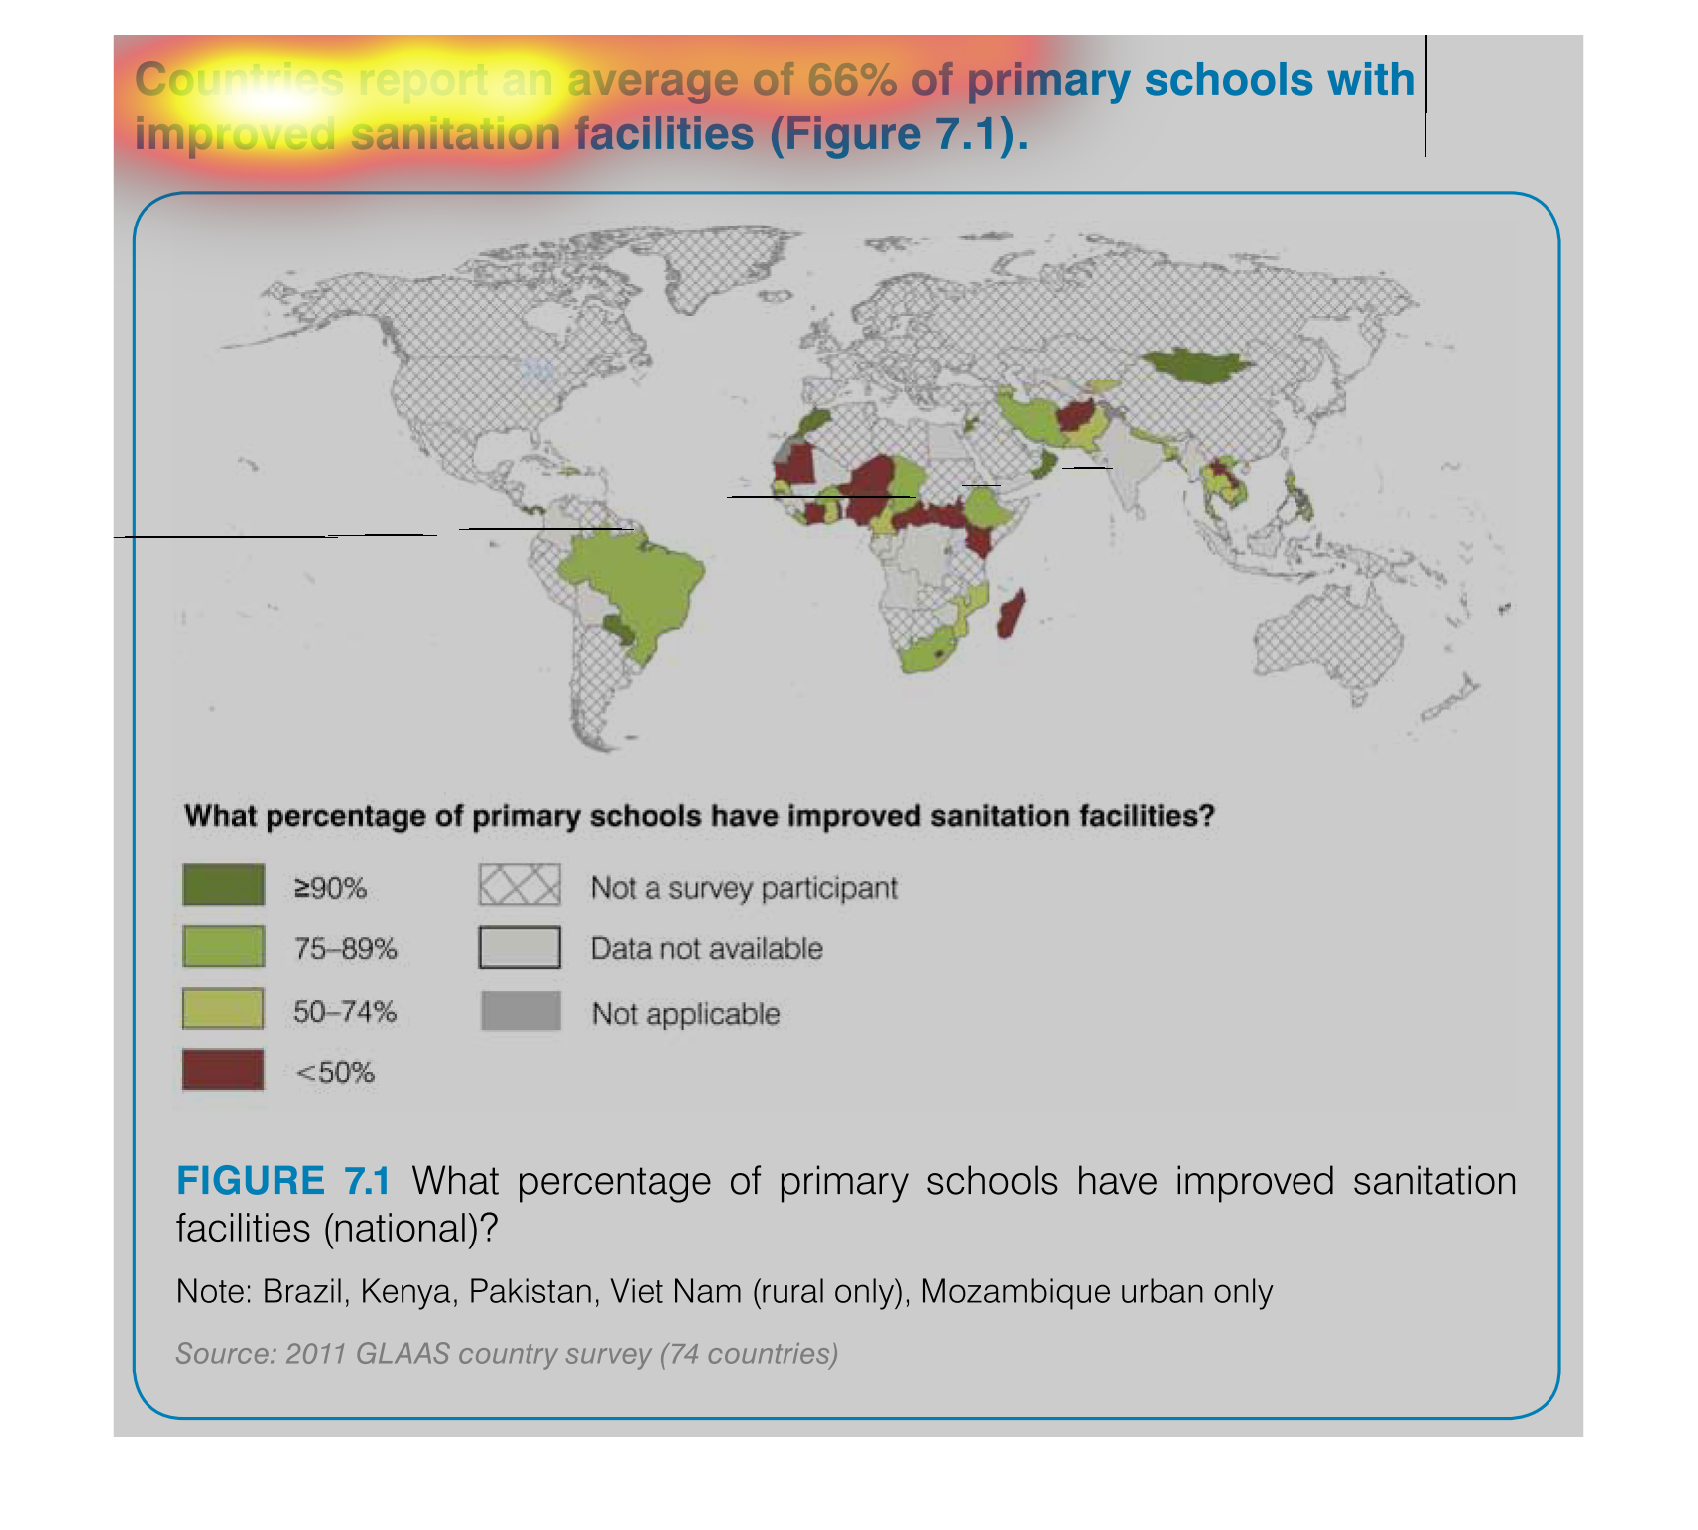
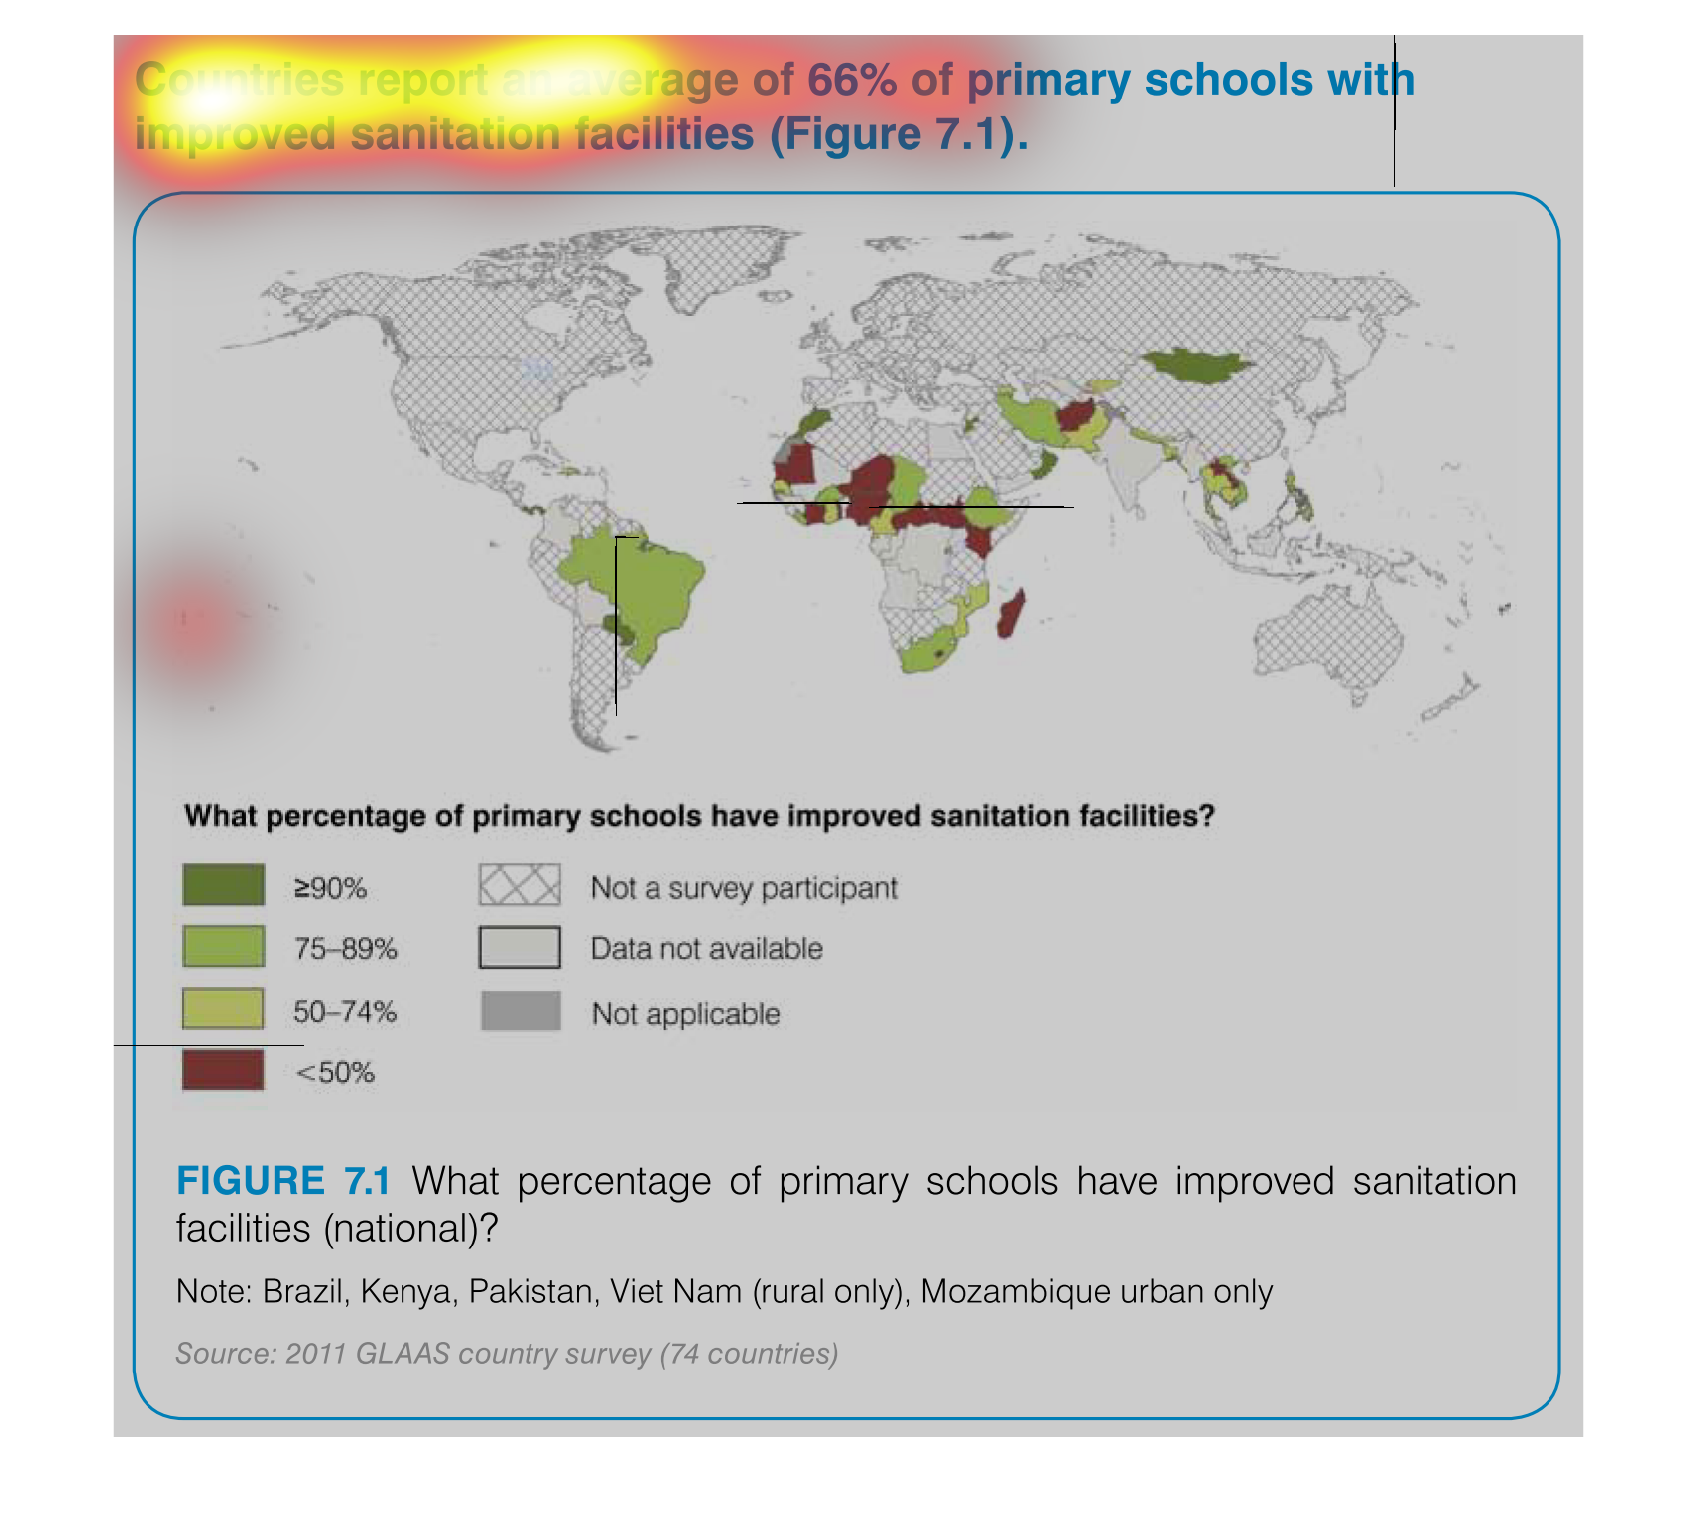
The chart shows the percent of secondary schools with improved sanitation facilities throughout
the globe .   Most of the Northern Hemisphere was not included in the survey.  Africa, South
America, and southeast Asia, all have a high percentage of secondary schools without improved
sanitation.
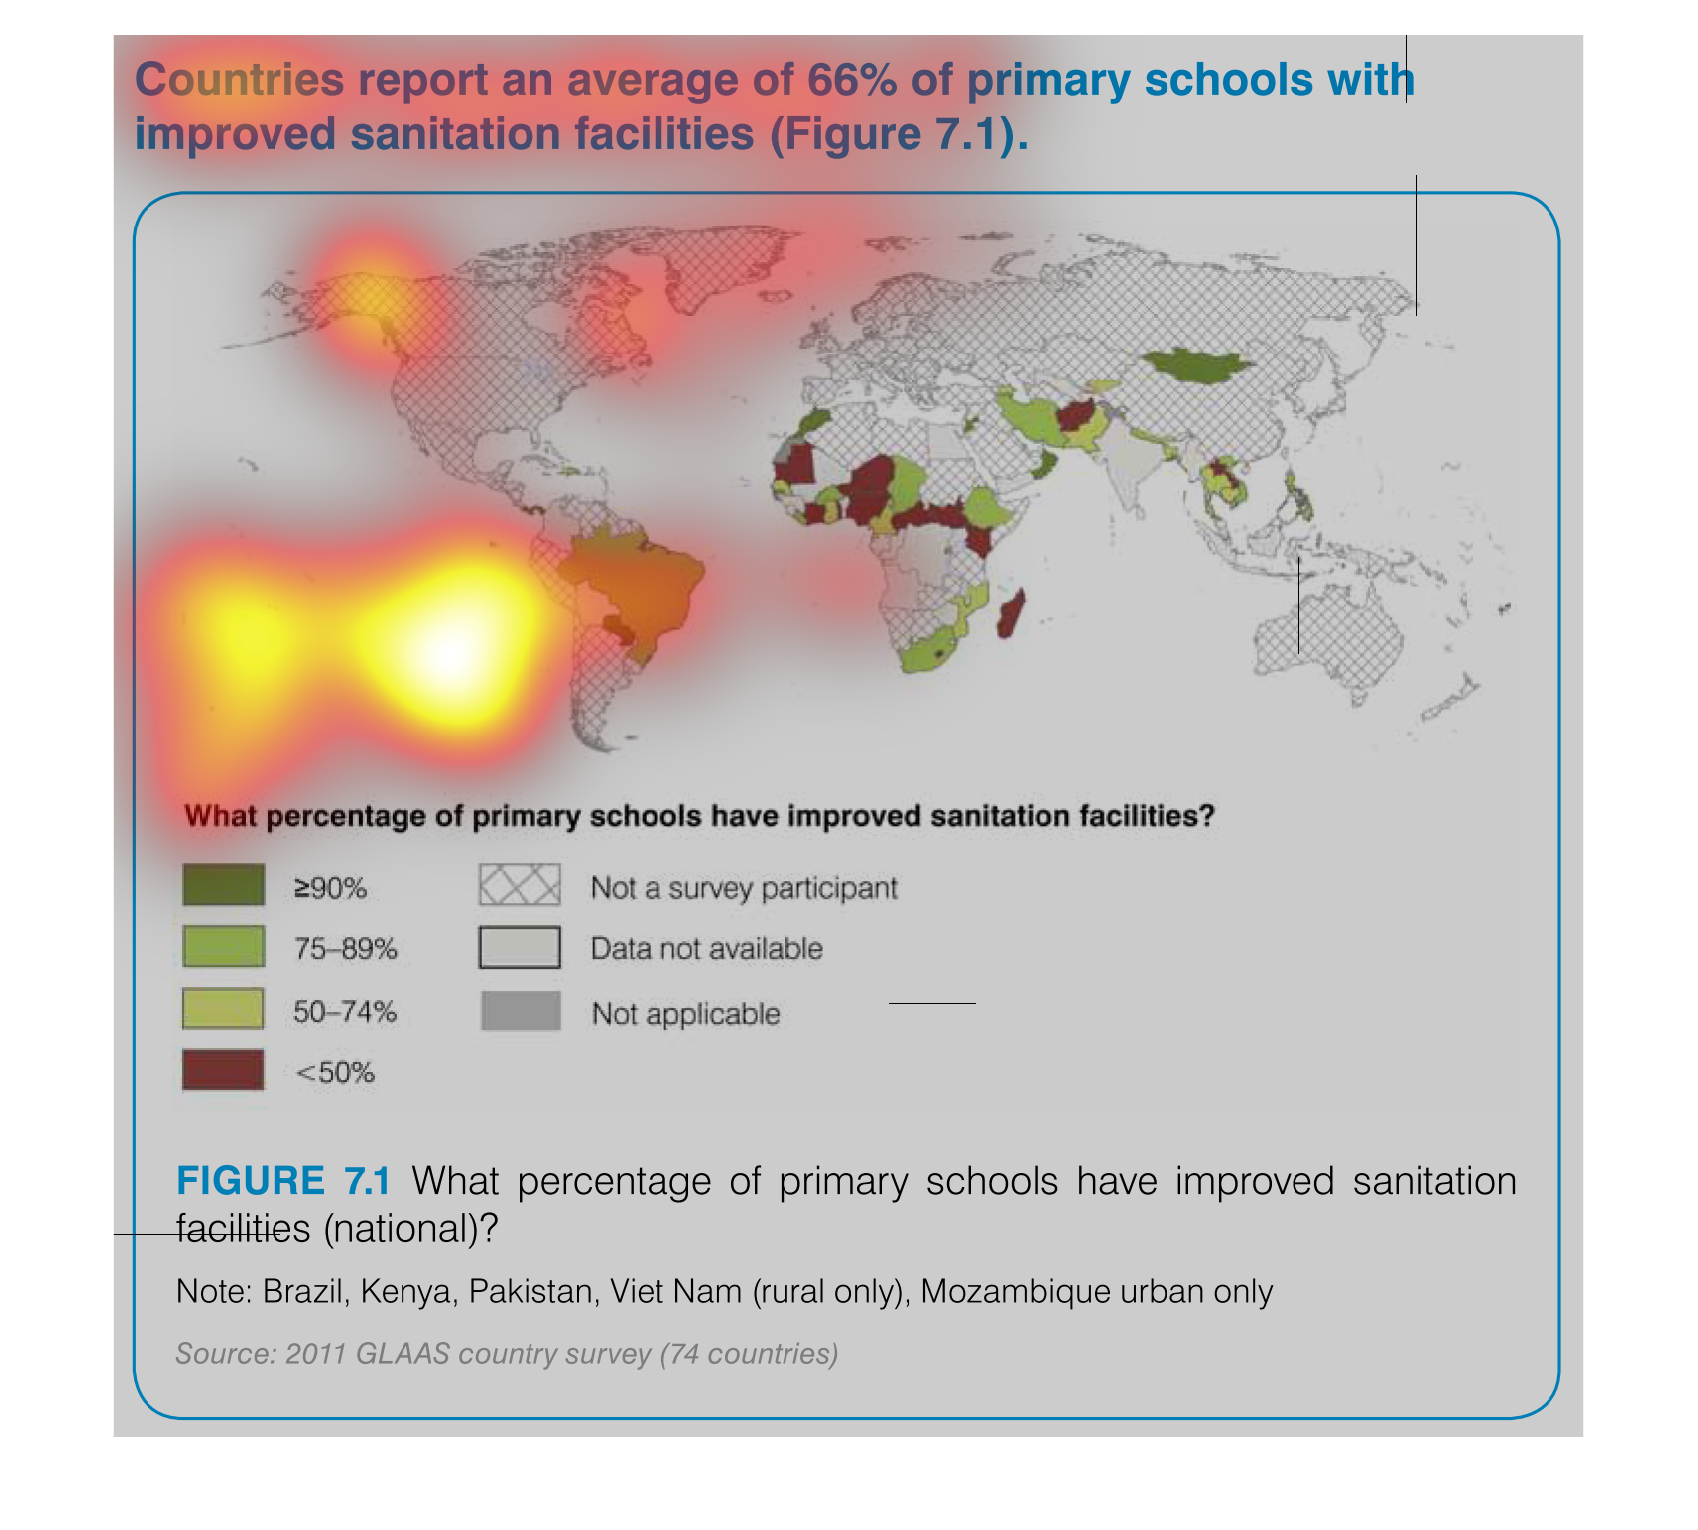
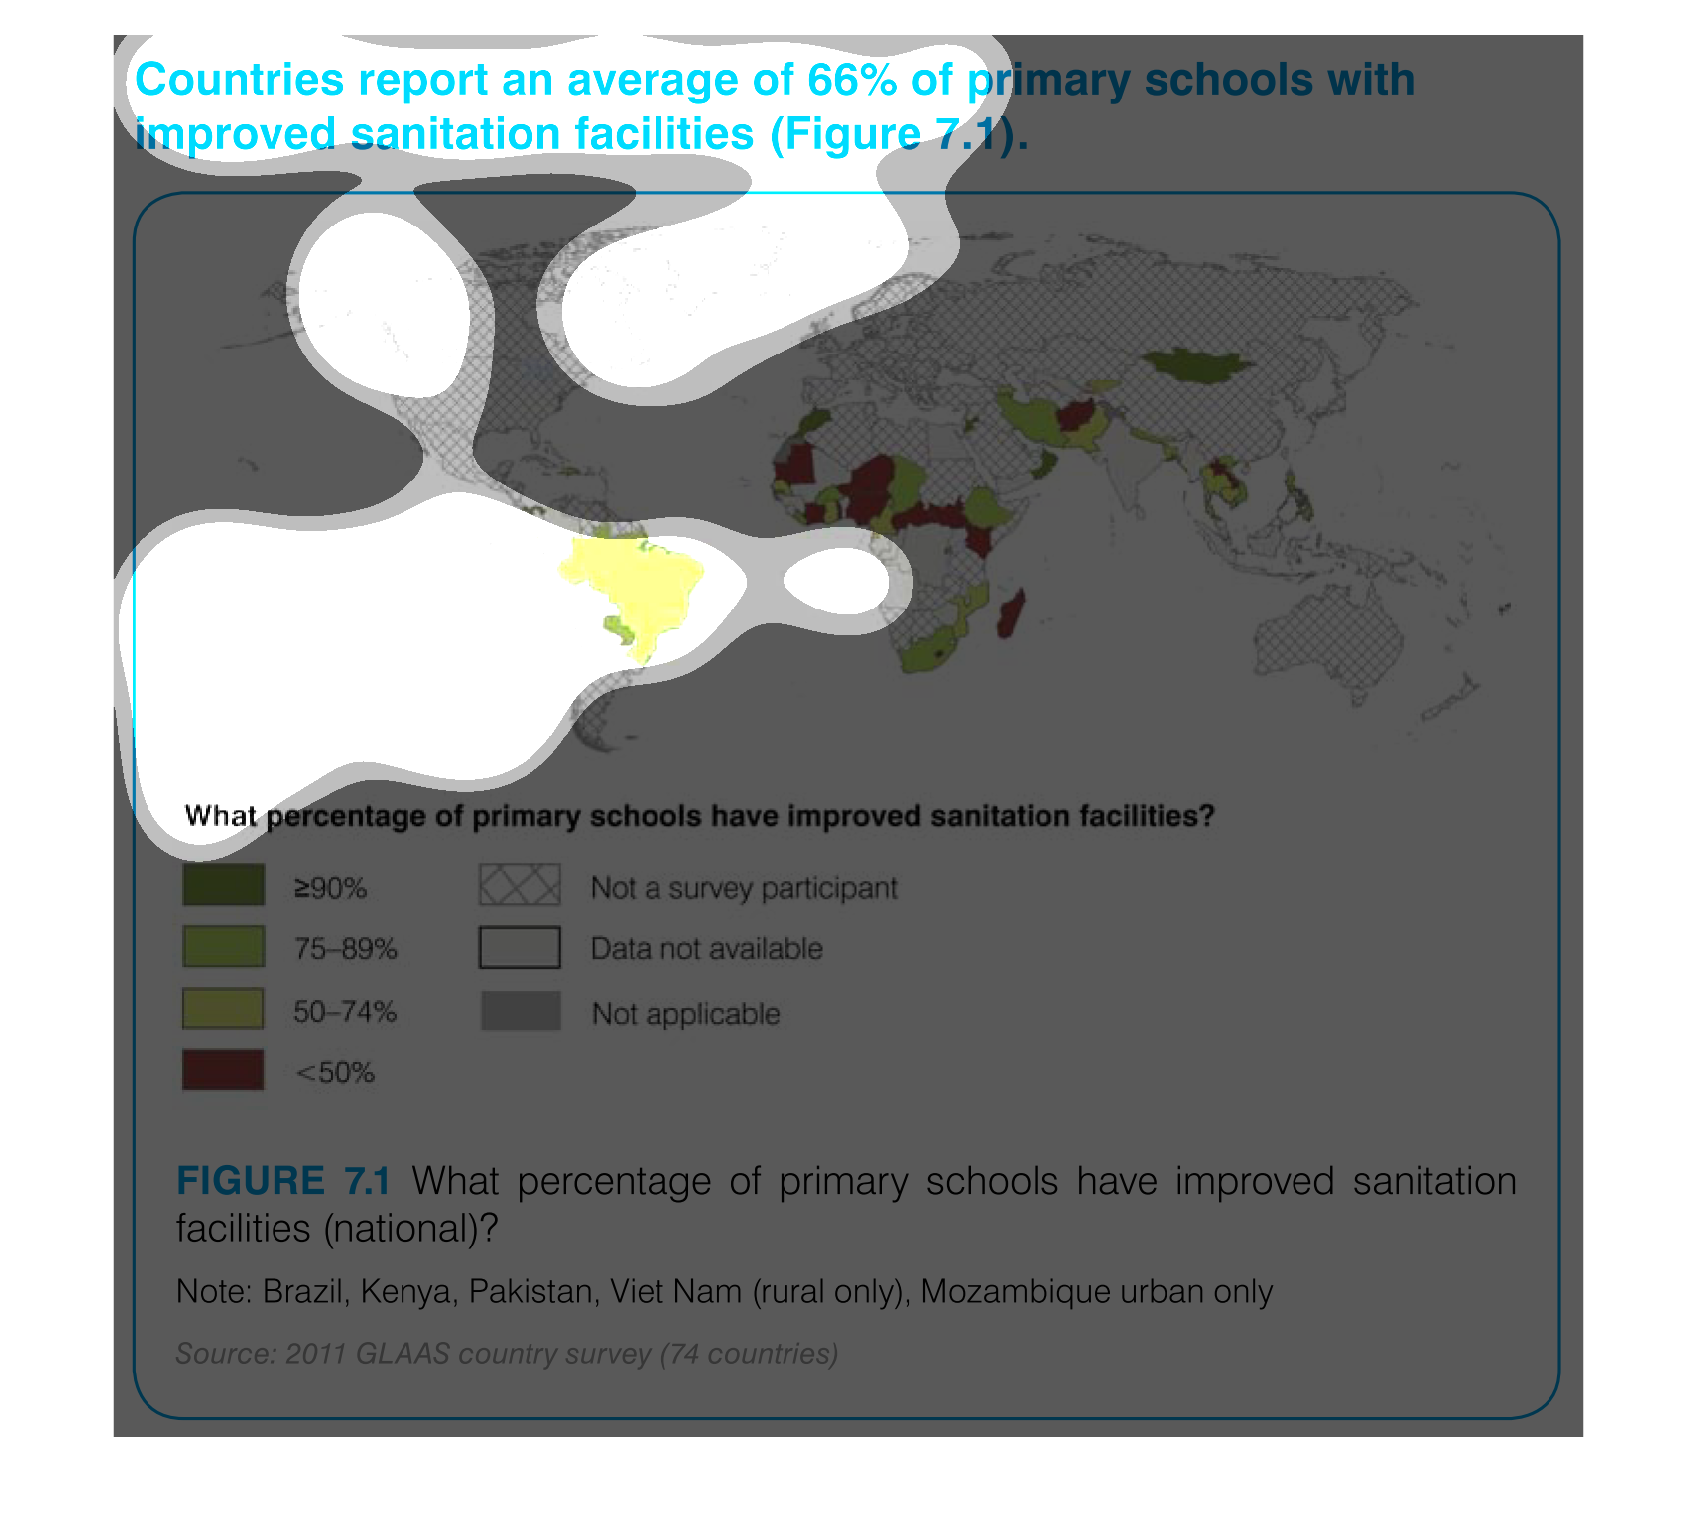
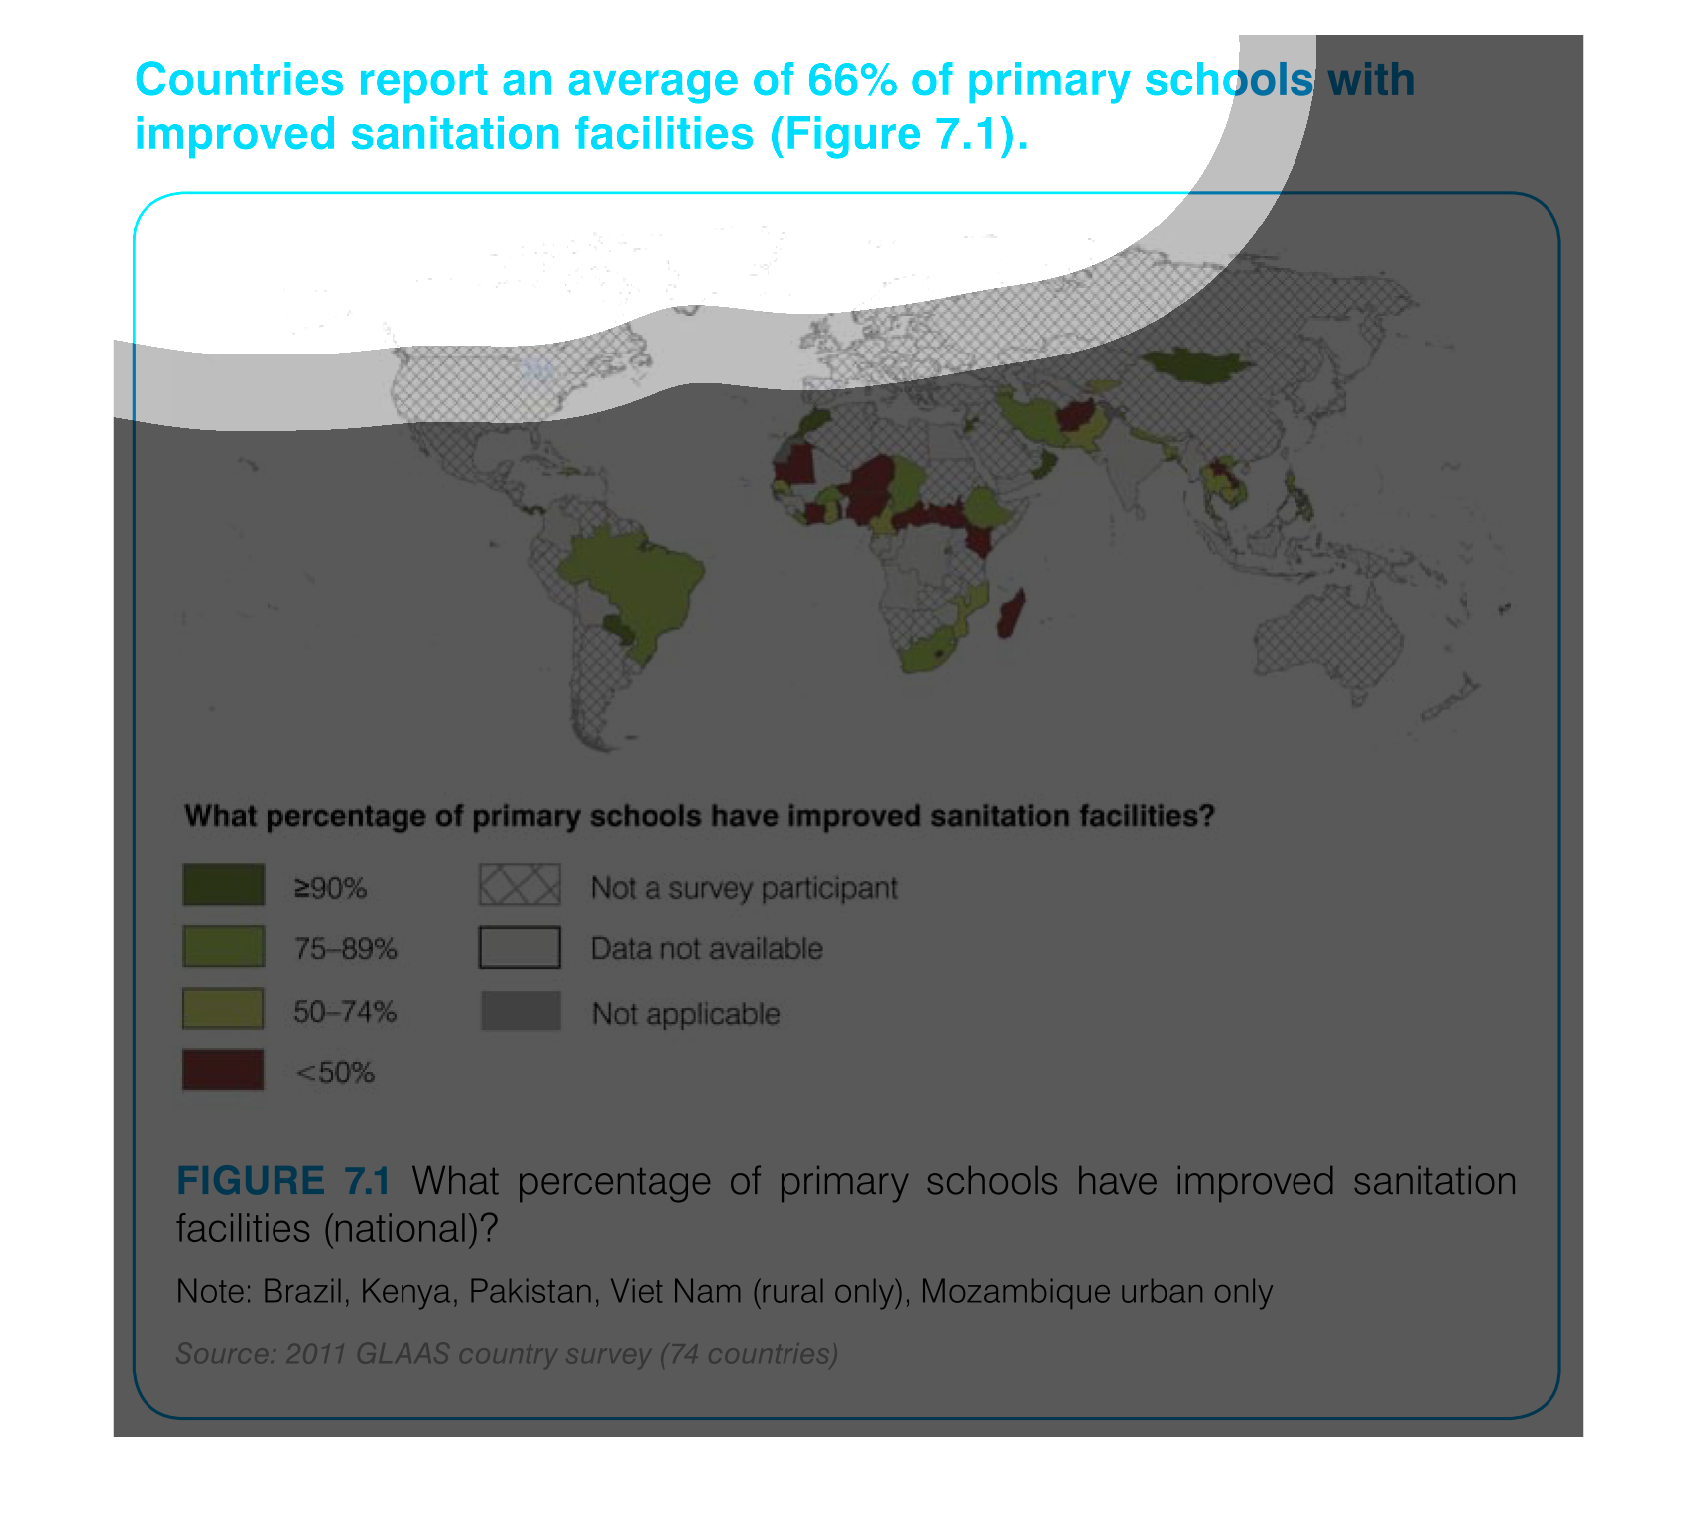
The figure presented is titled Countries report an Average of 66% of primary schools with
improved sanitation facilities. (figure 7.1).  The figure shows a map.
This chart describes that countries report and average of 66% of primary schools with improved
sanitation facilities. Different categories are represented by different colors.
This graph illustrates the importance of sanitation and the efforts taken to try and improve
conditions over the course of a few years in the highlighted region.
A map infographic showing the number of primary schools in a country with improved sanitation
facilities most for third world countries. Map shows an average of 66% report improved sanitation