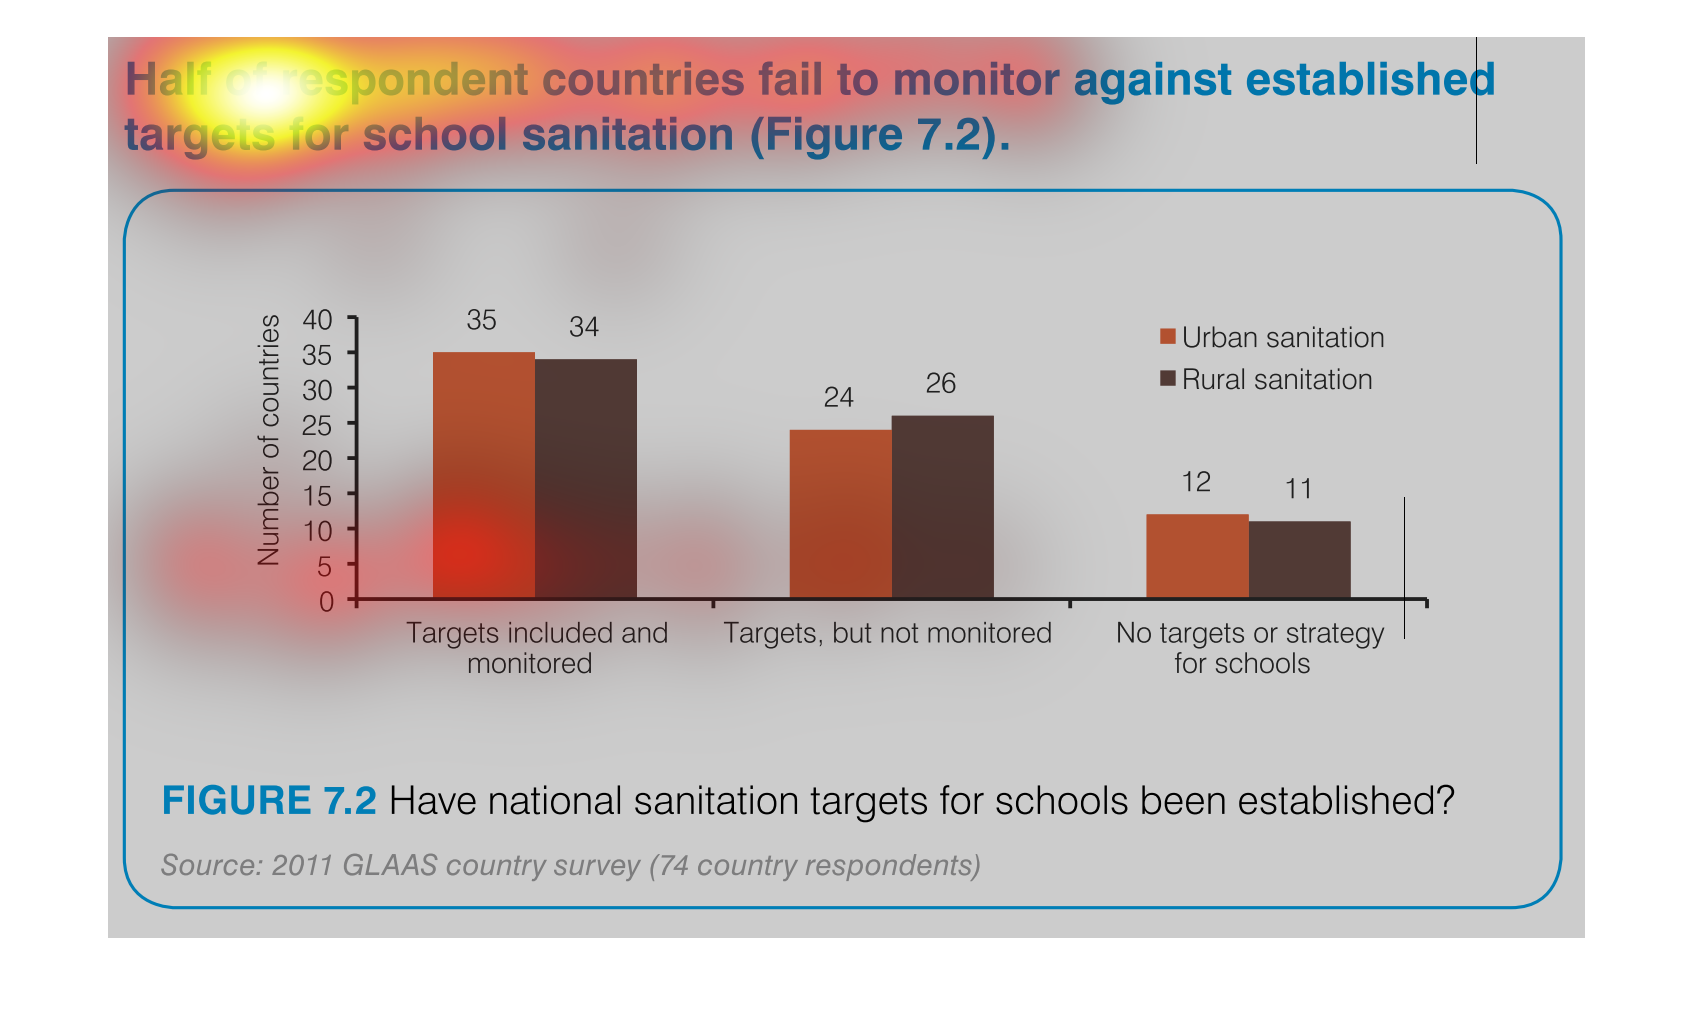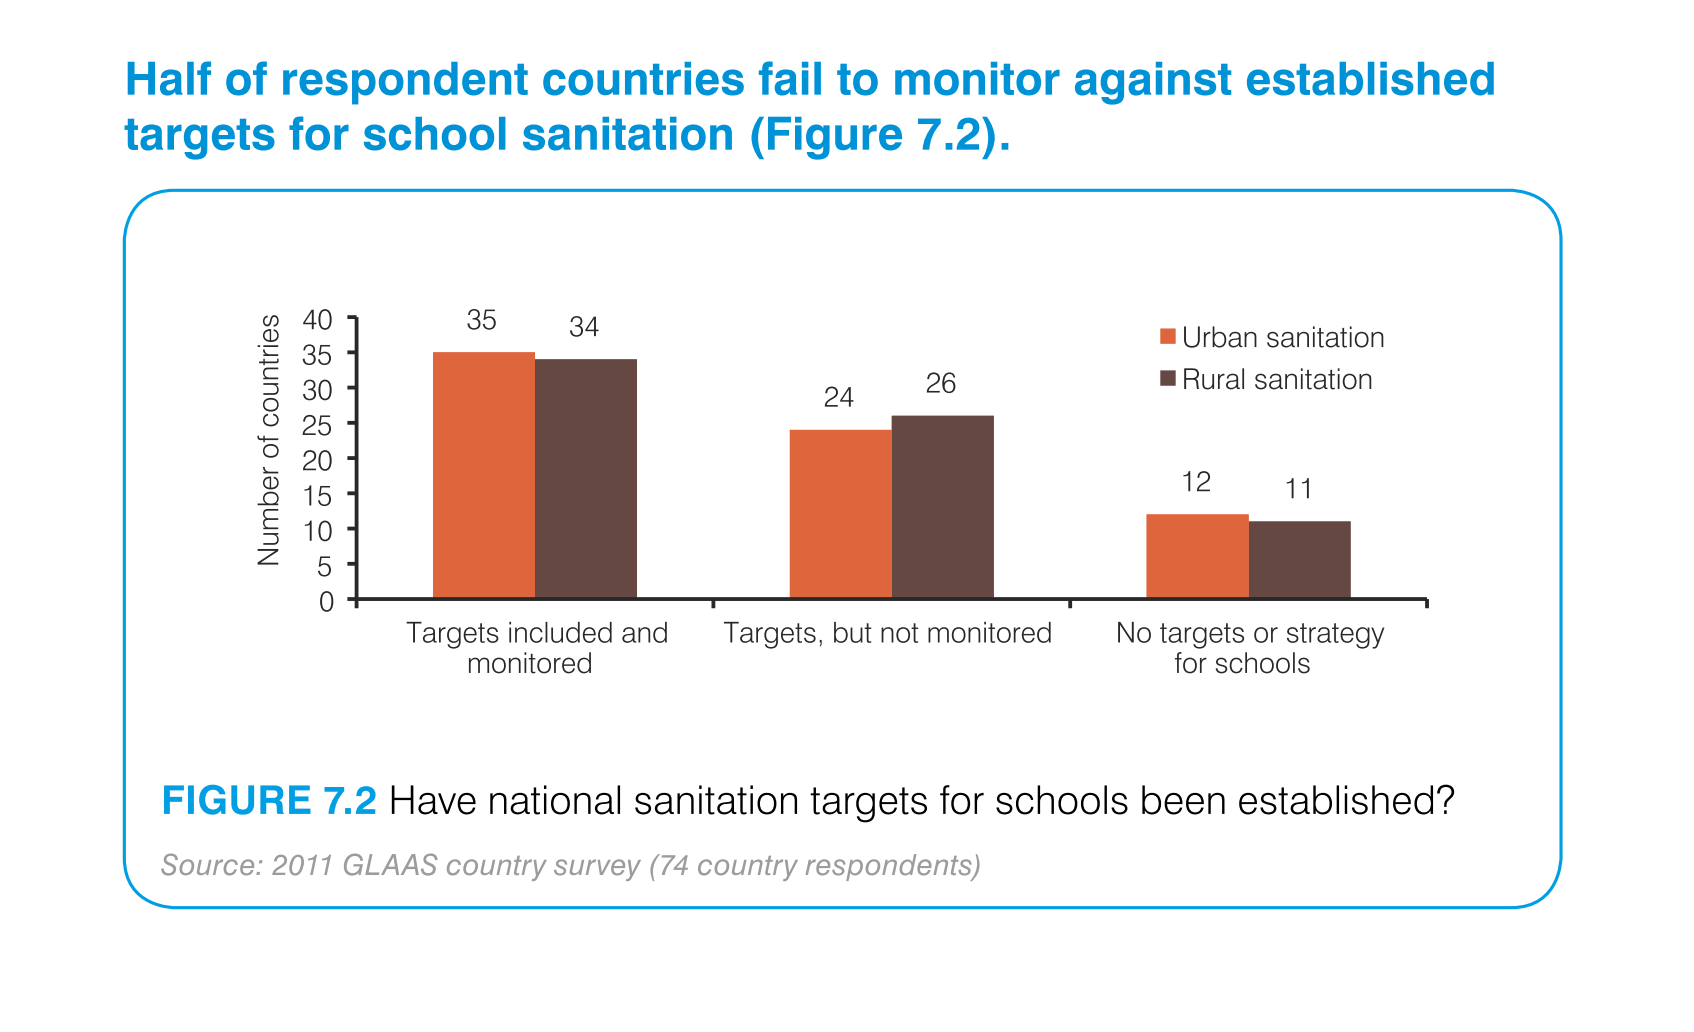
The bar graph indicates that the majority of school sanitation standards have either not been
establish or once established, have not been monitored.  There is no mention as to whether
this is based on self reporting or observation.  There are two columns in each category but
nothing telling what they are.
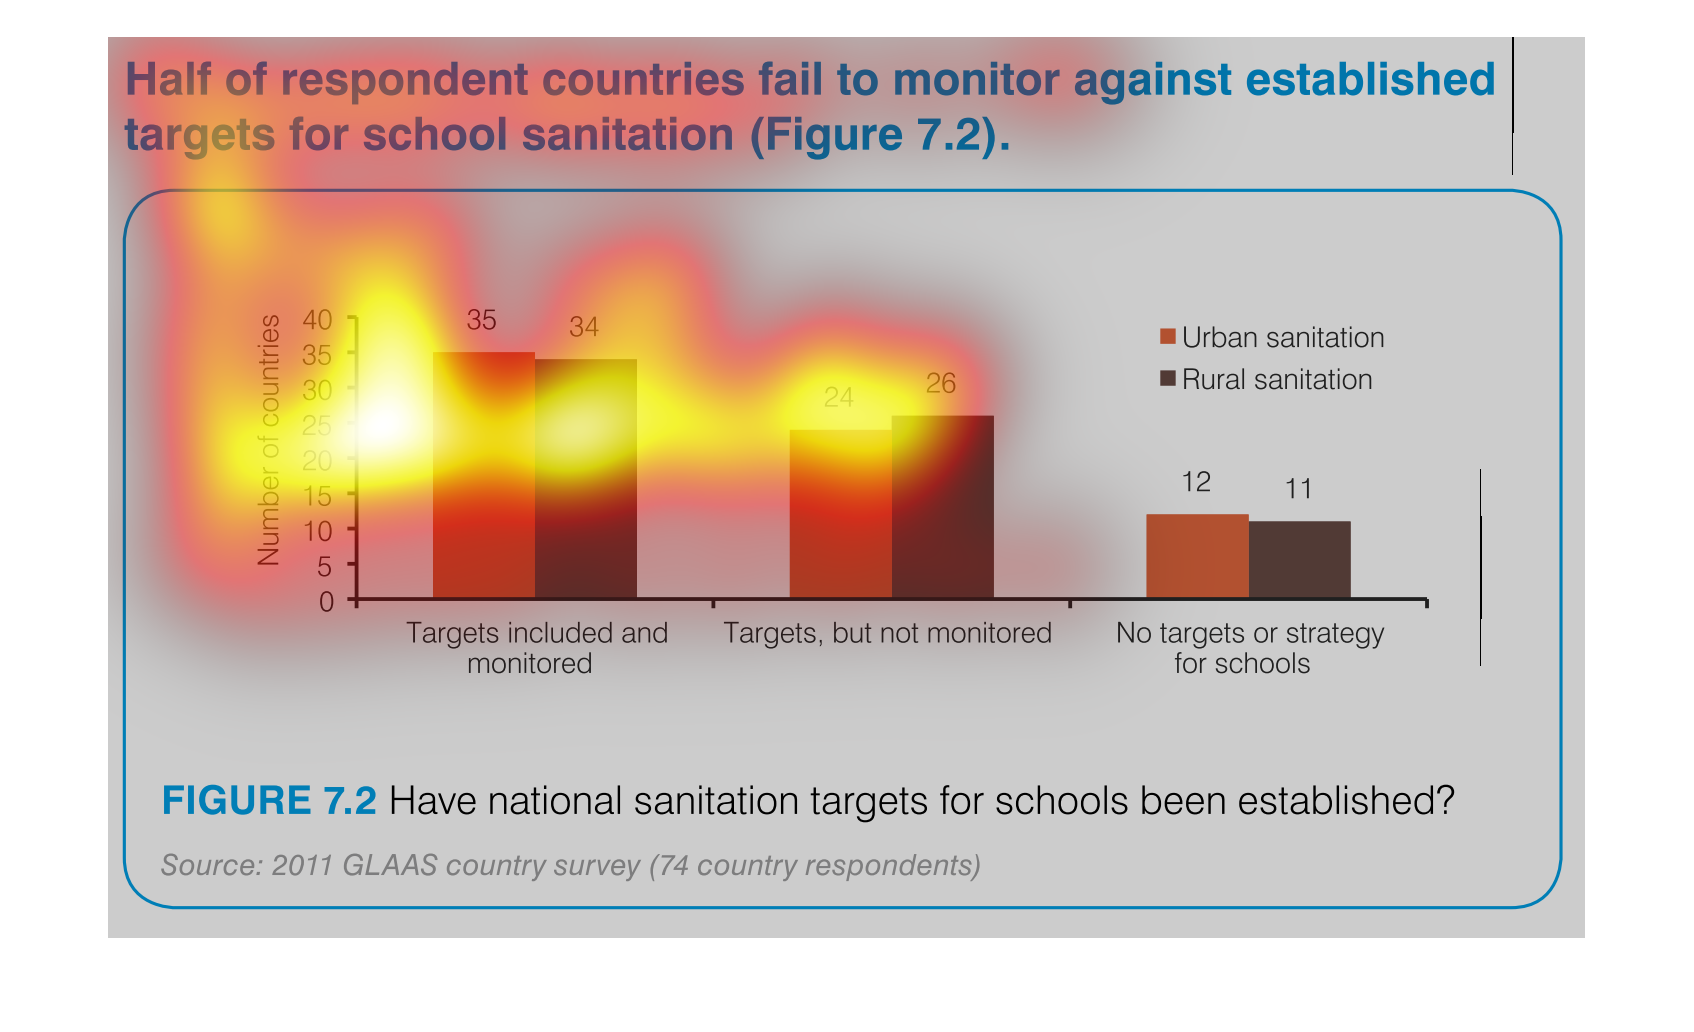
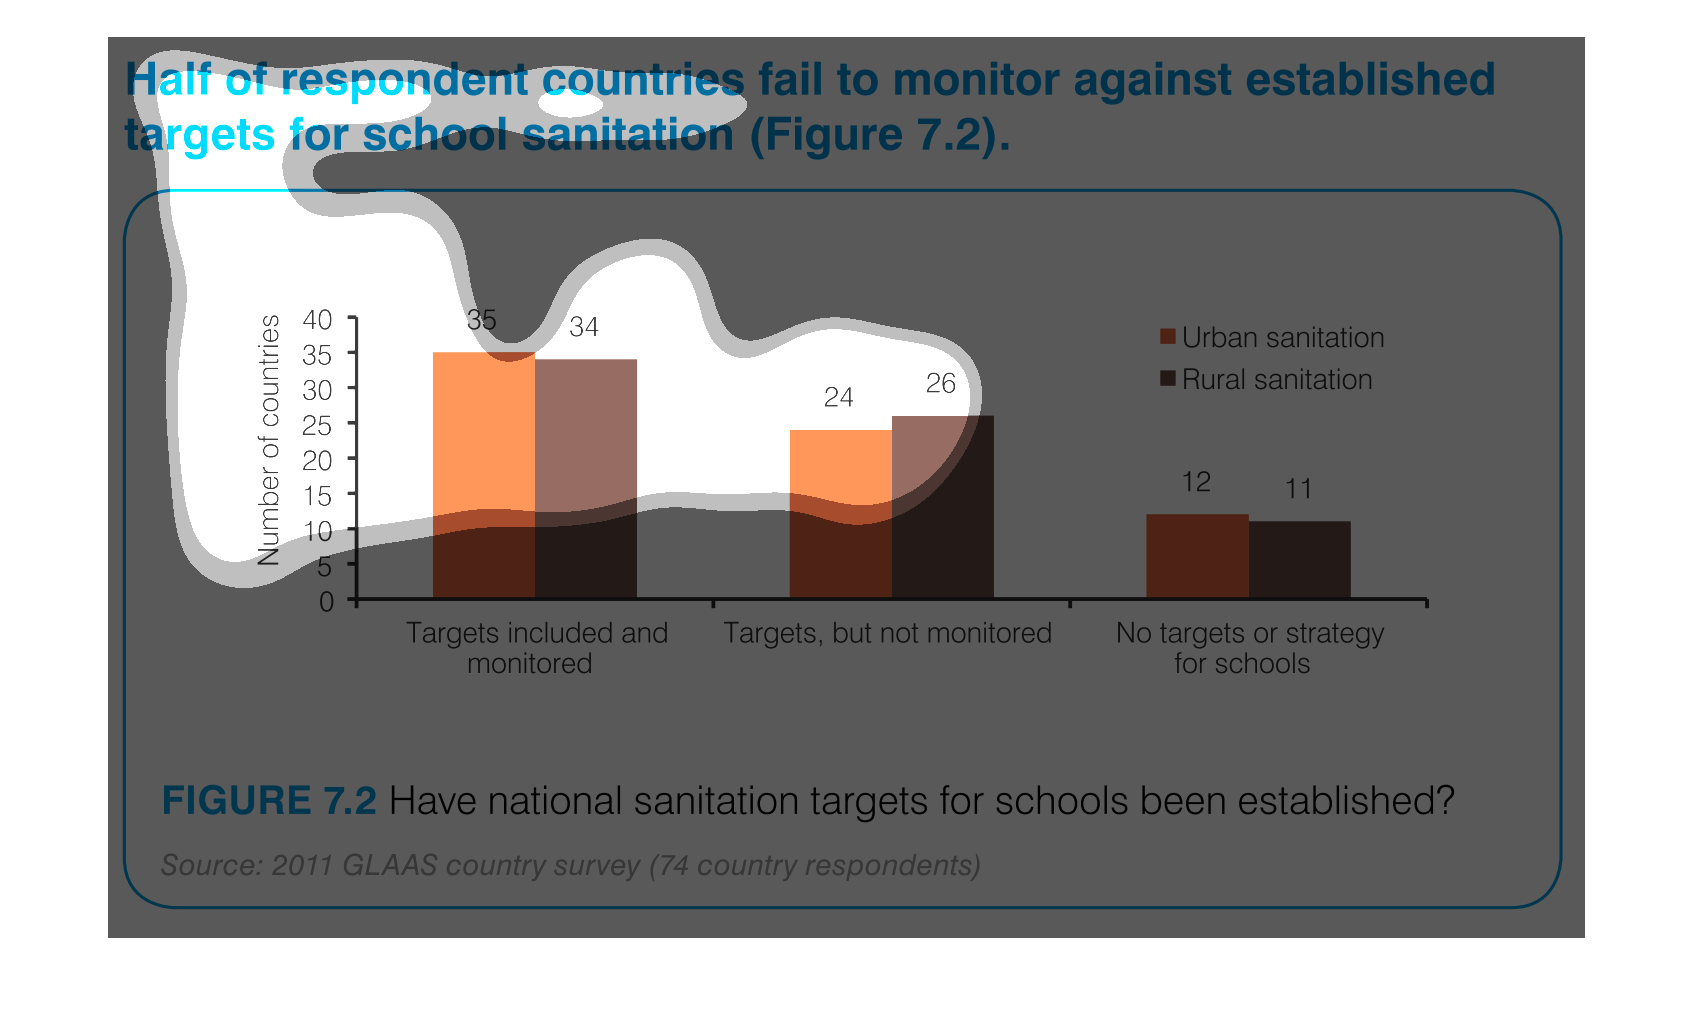
This chart describes half of respondent countries fail to monitor against established targets
for school sanitation. Categories on the chart include, targets included and monitored.
This chart describes that half of respondent countries fail to monitor against established
targets for school sanitation. Categories on the chart include targets included and monitored.
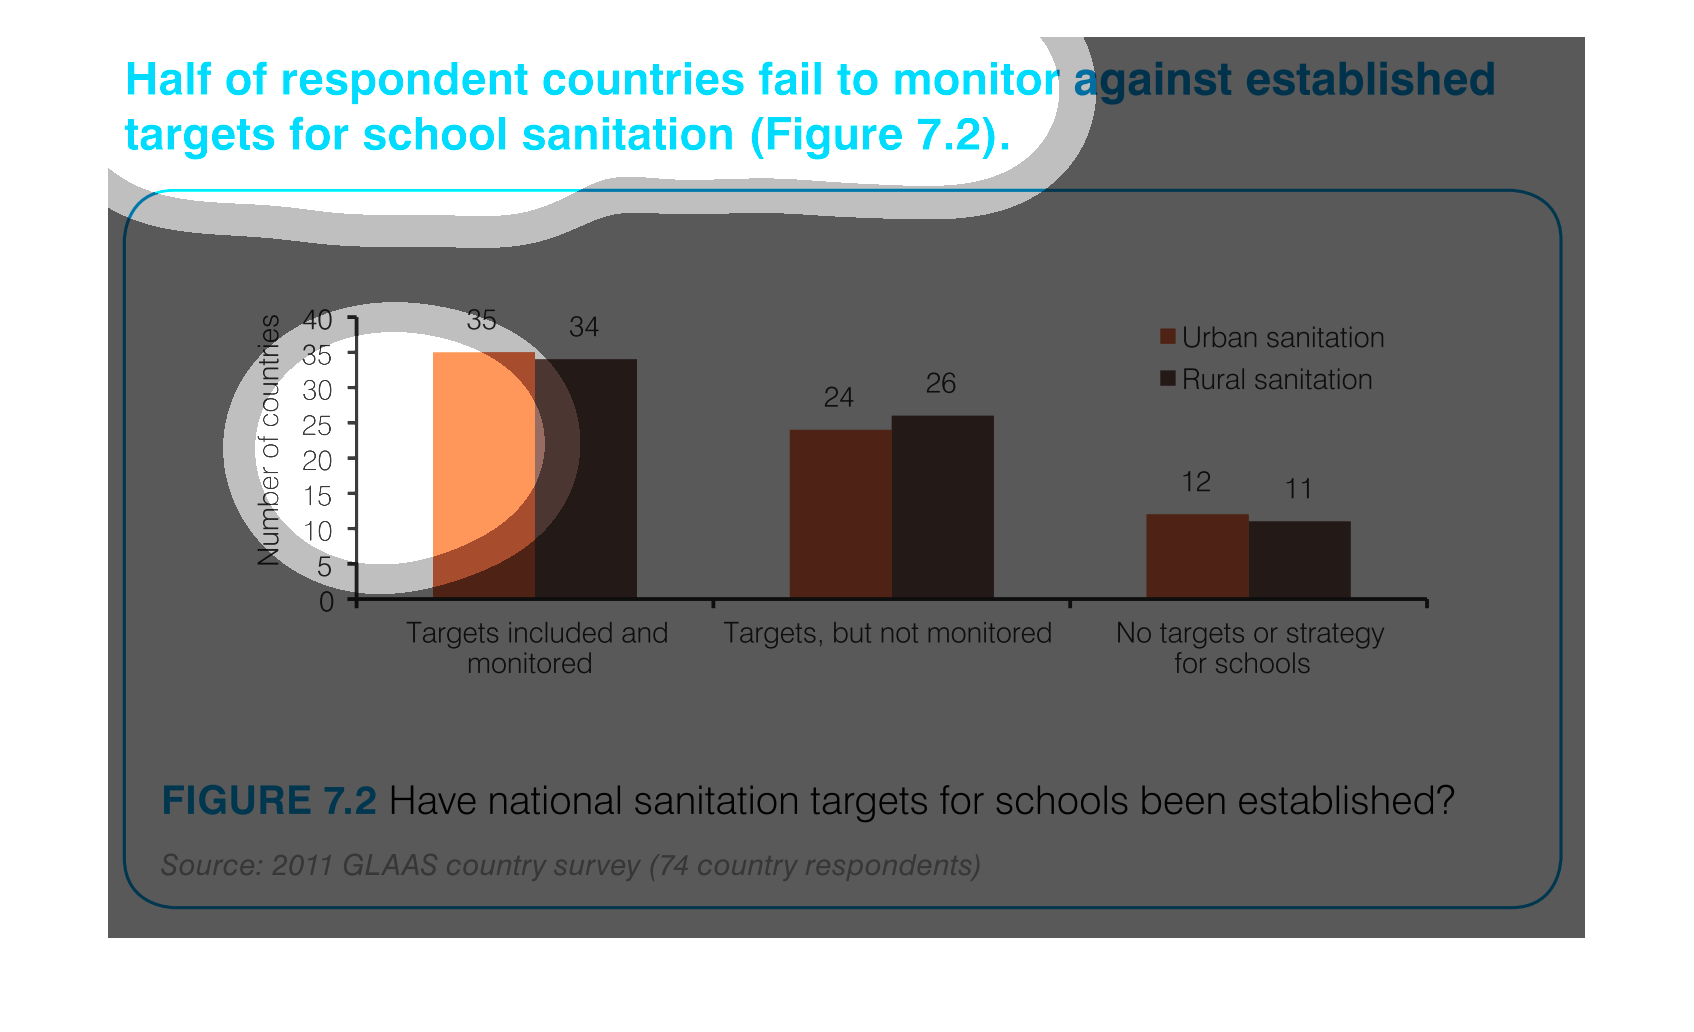
The chart is to show whether schools have national sanitation targets established.    Half
of the respondent countries did not have such programs in place.
The graph depicts the number of countries that have moved to establish proper sanitation in
schools. The chart is broken up into three sections of whether the country has targets and
monitors the situation, one or the other, or none.
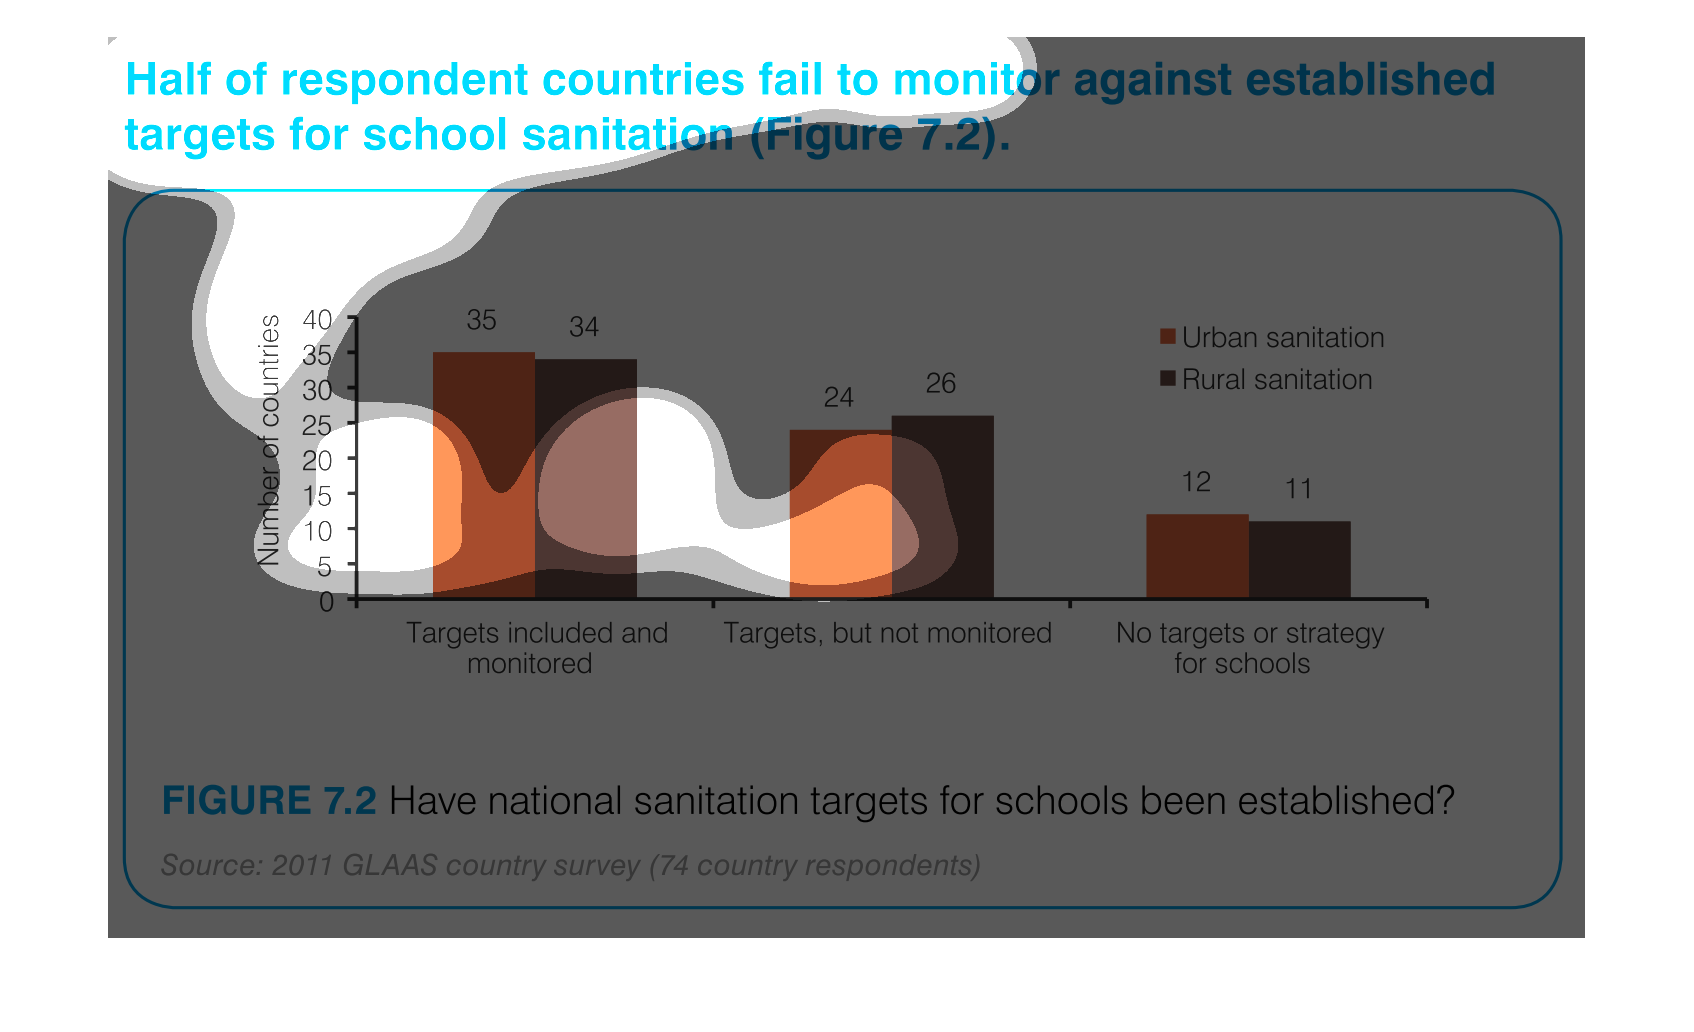
A chart showing how half of respondent countries fail to  monitor against established targets
for school sanitation broken down by urban sanitation and urban sanitation.
This chart describes different countries' responses to monitoring targets for school sanitation.
 It covers both rural and urban sanitation targets.  It asks if targets have been established
and if so, are they monitored.
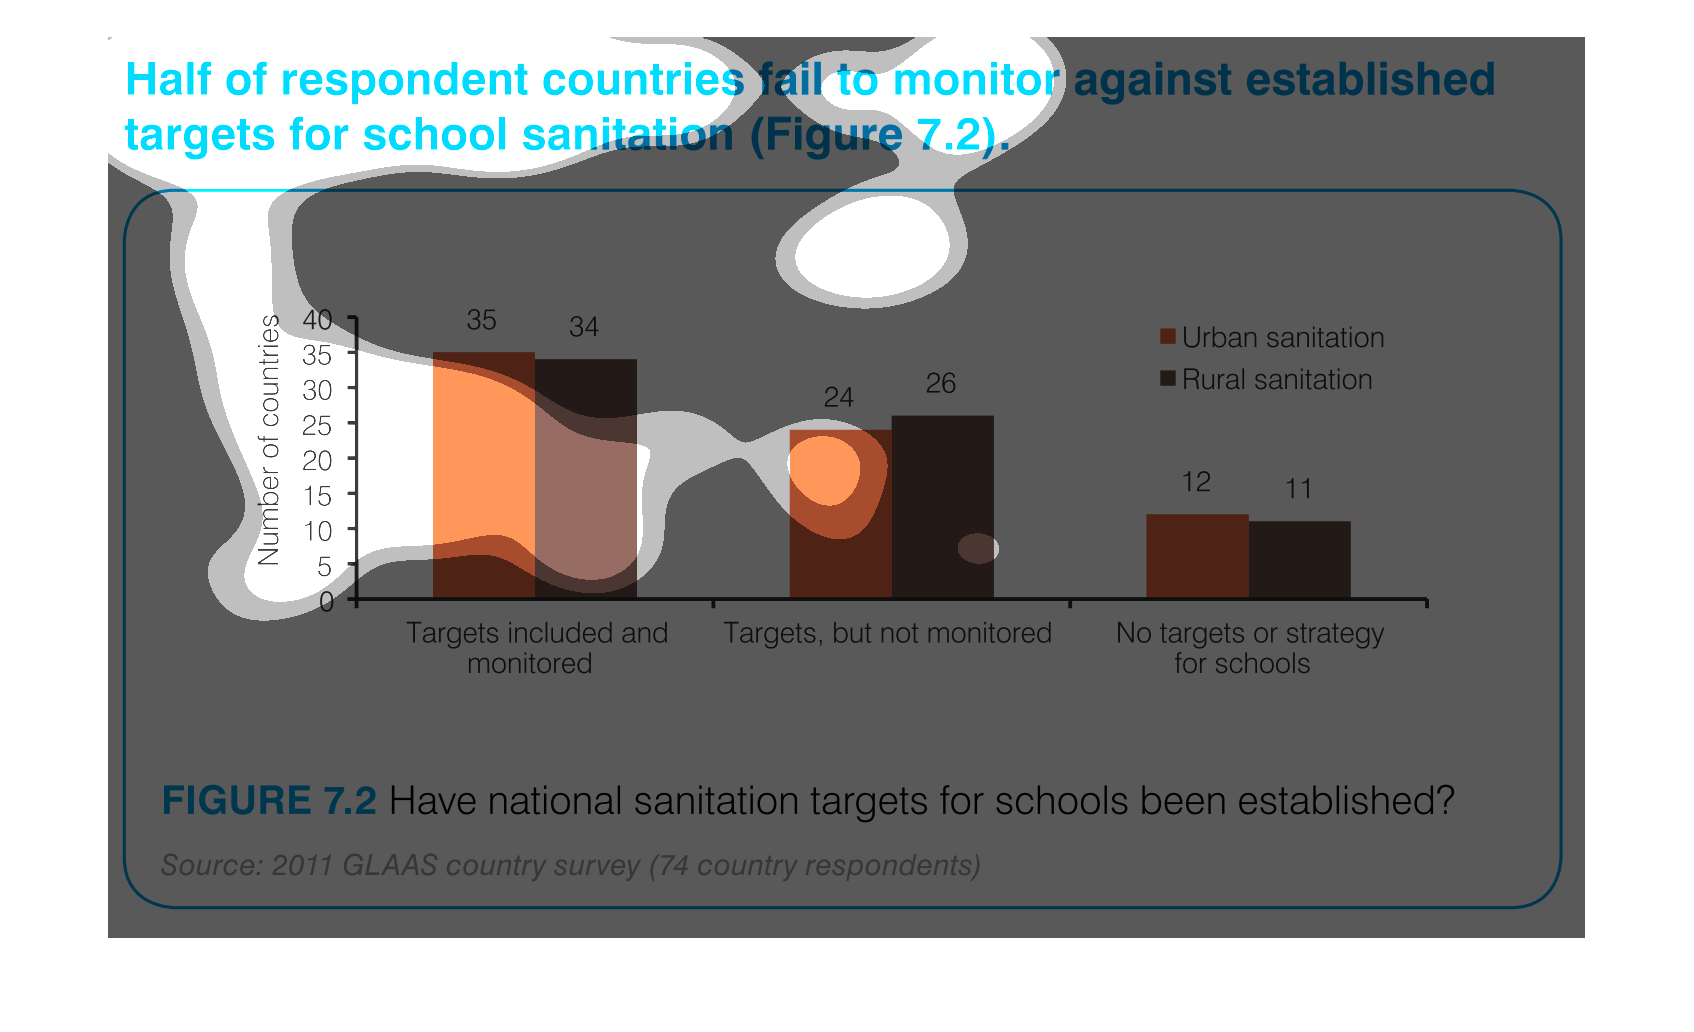
half of respondents countries fail to monitor against established targets for school sanitation
(figure 7.2) Y axis is number of countries, X axis has three distinct sections; targets included
monitored, not monitored, no target or strategy. Each of these three sections has two bars,
urban sanitation and rural sanitation
Shows the number of countries that target and monitor the amount of sanitation that is in
schools.  The chart shows the number of countries that both have targets and monitor them,
have targets but do not monitor them, and those that do not have targets in place at all.
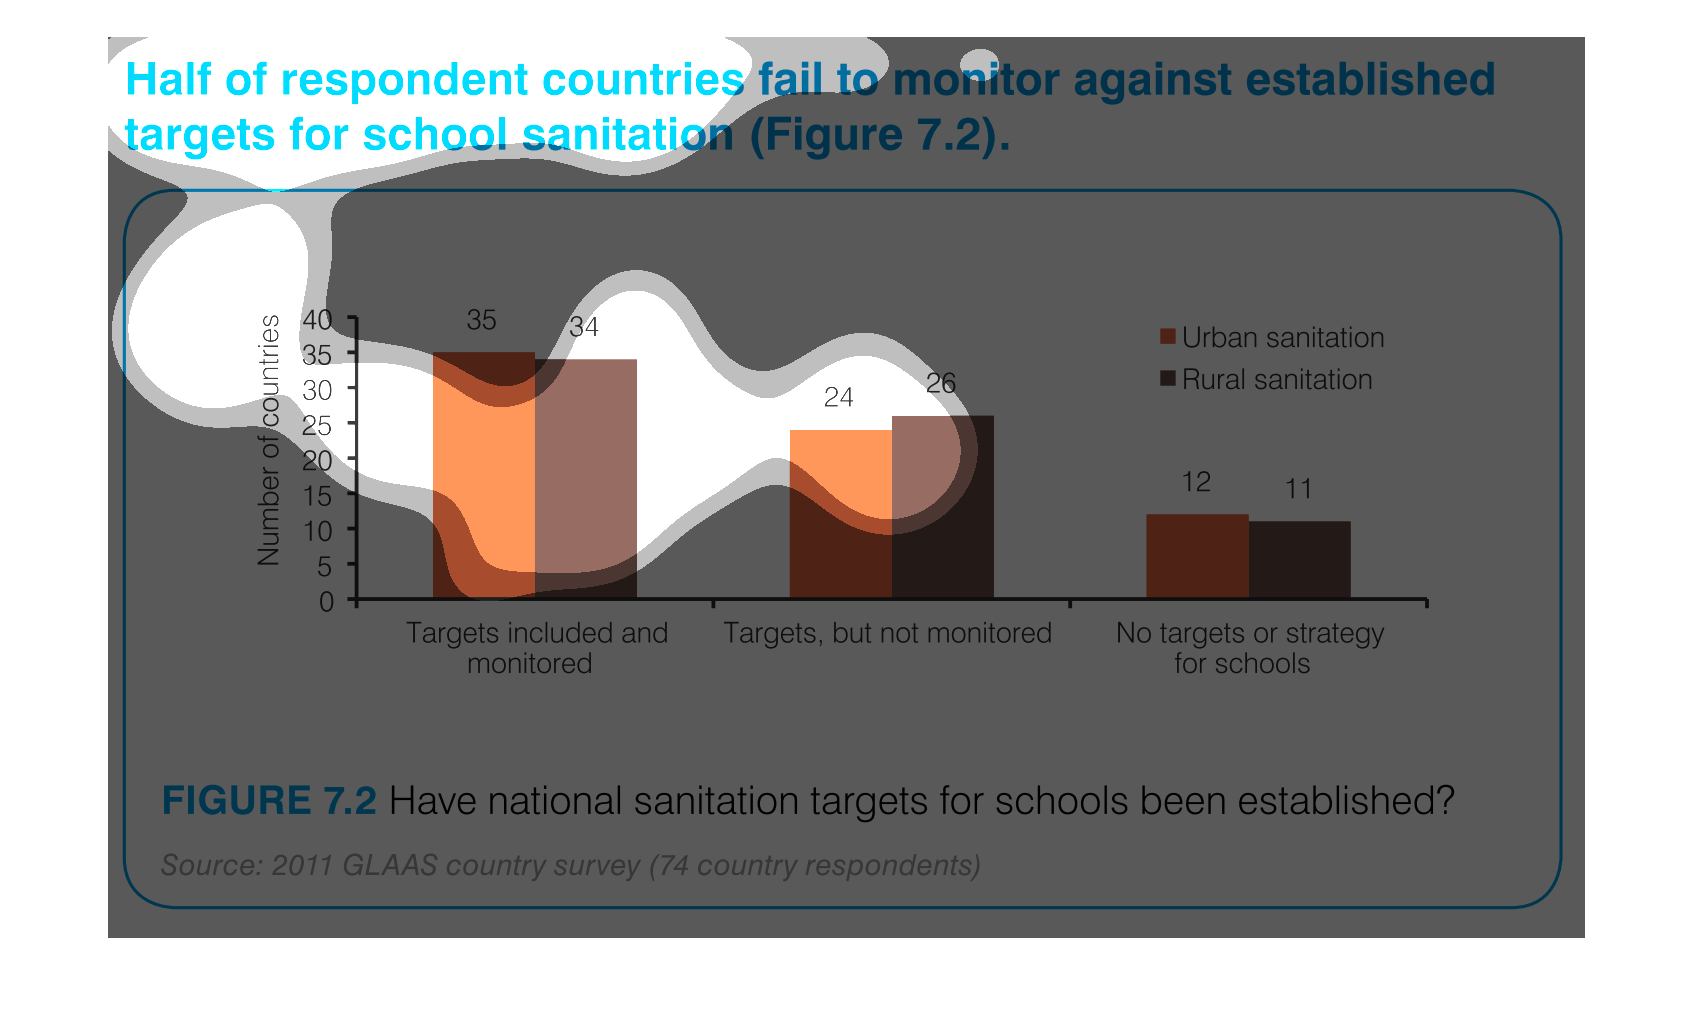
Half of respondent countries fail to monitor against established targets for school sanitation
(figure 7.2) Y axis shows number of countries, X axis shows targets included and monitored,
not monitored, and no targets or strategy for schools. Each category has two bars one for
urban and one for rural.
THIS PLOT SHOWS THE NUMBER OF COUNTRIES THAT HAVE SET AND ACTIVELY MONITOR SANITATION STANDARDS
FOR SCHOOLS. THE DEGREE OF STANDARDS/MONITORING ARE SHOWN IN THE 3 SECTIONS, AND EACH COLOR
REPRESENTS URBAN AND RURAL SCHOOLS.
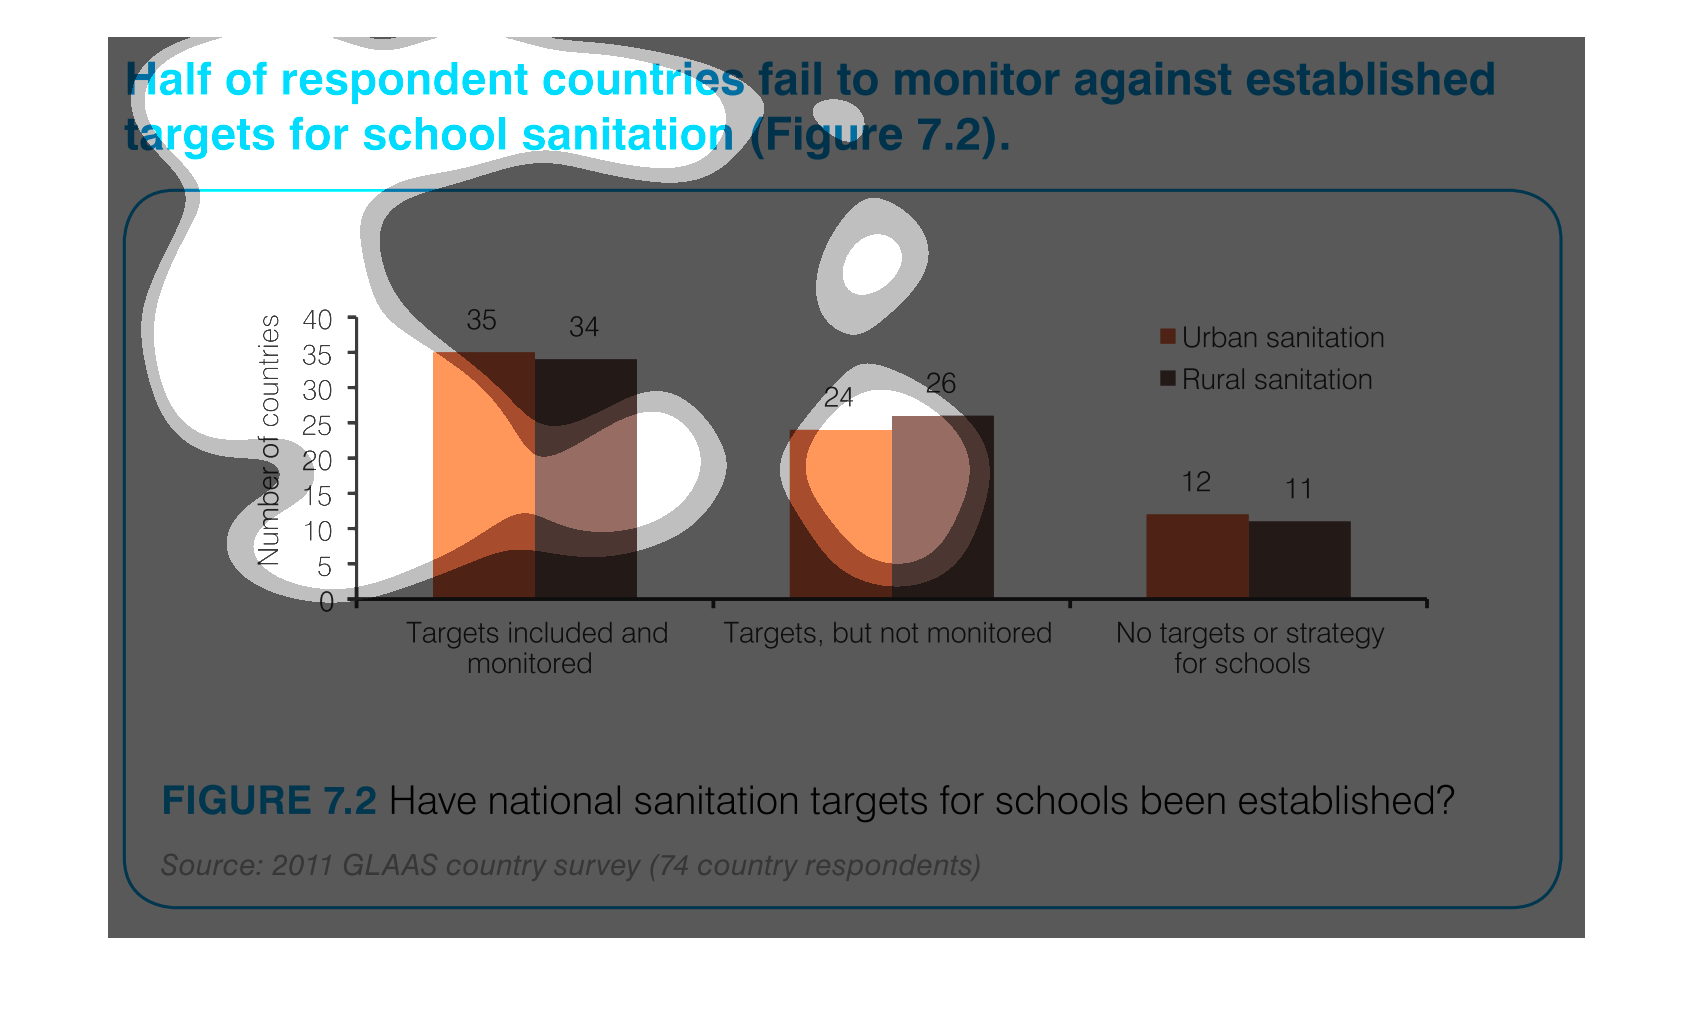
This is a graph that shows if school sanitation is monitored or not. It shows it for urban
and rural areas. It also shows that over half are not monitored.
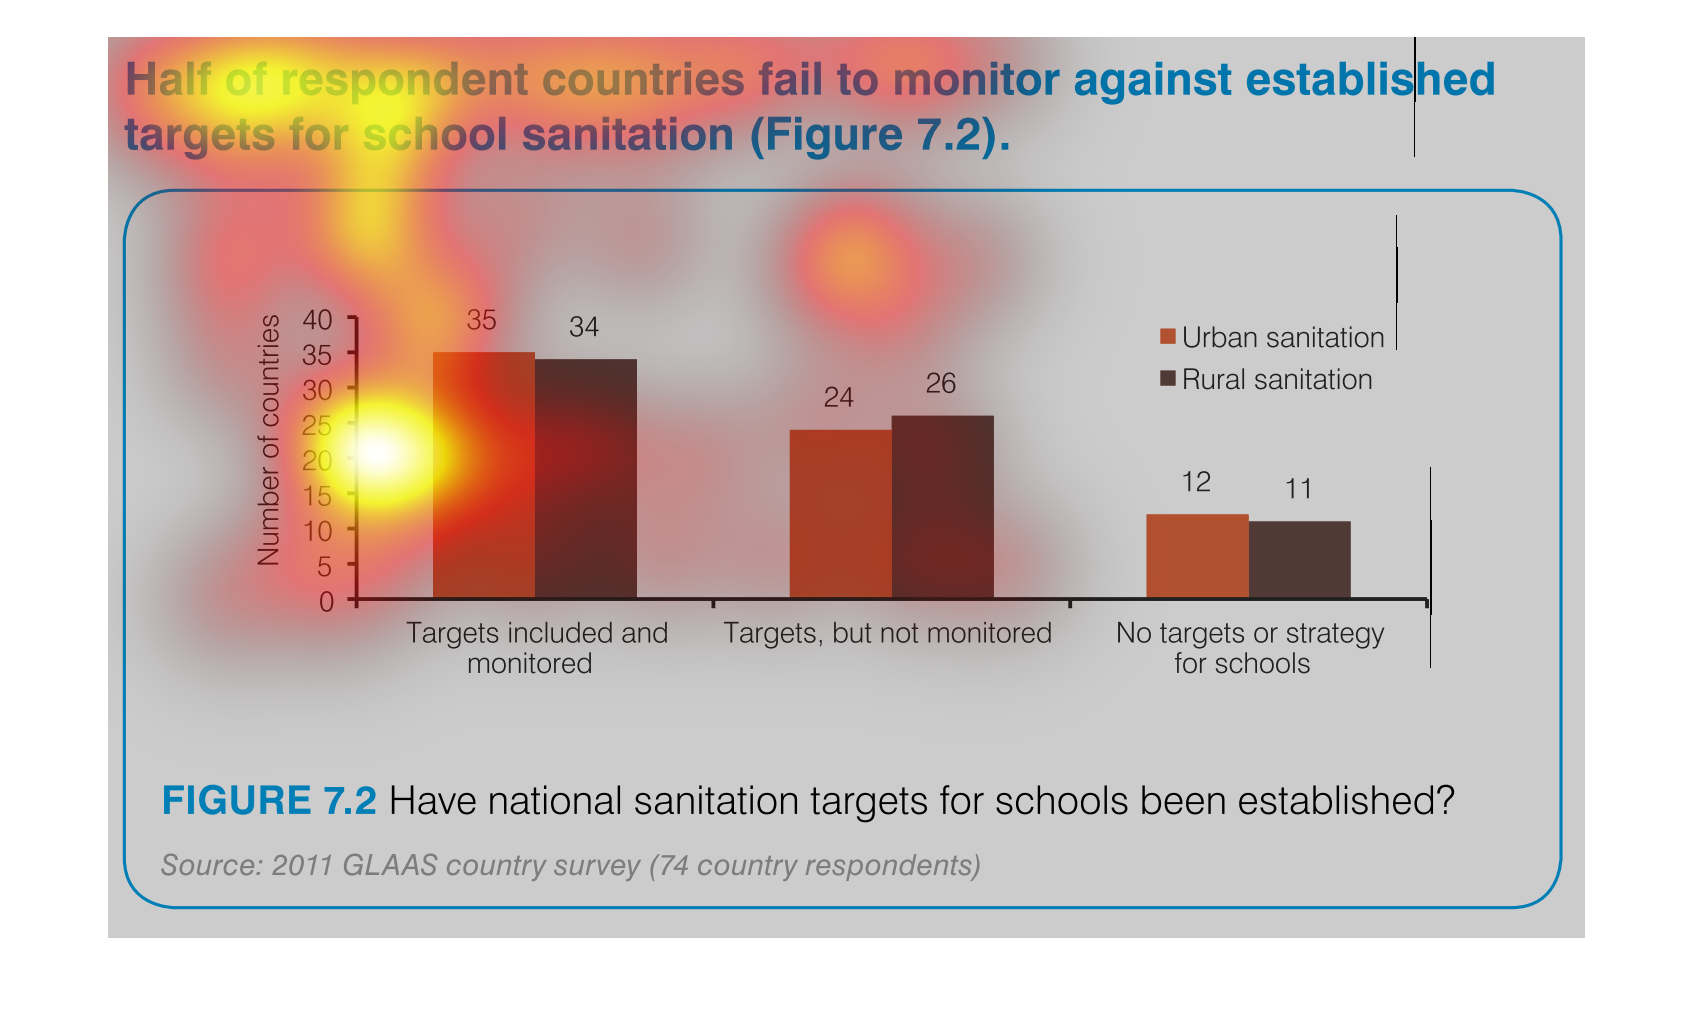
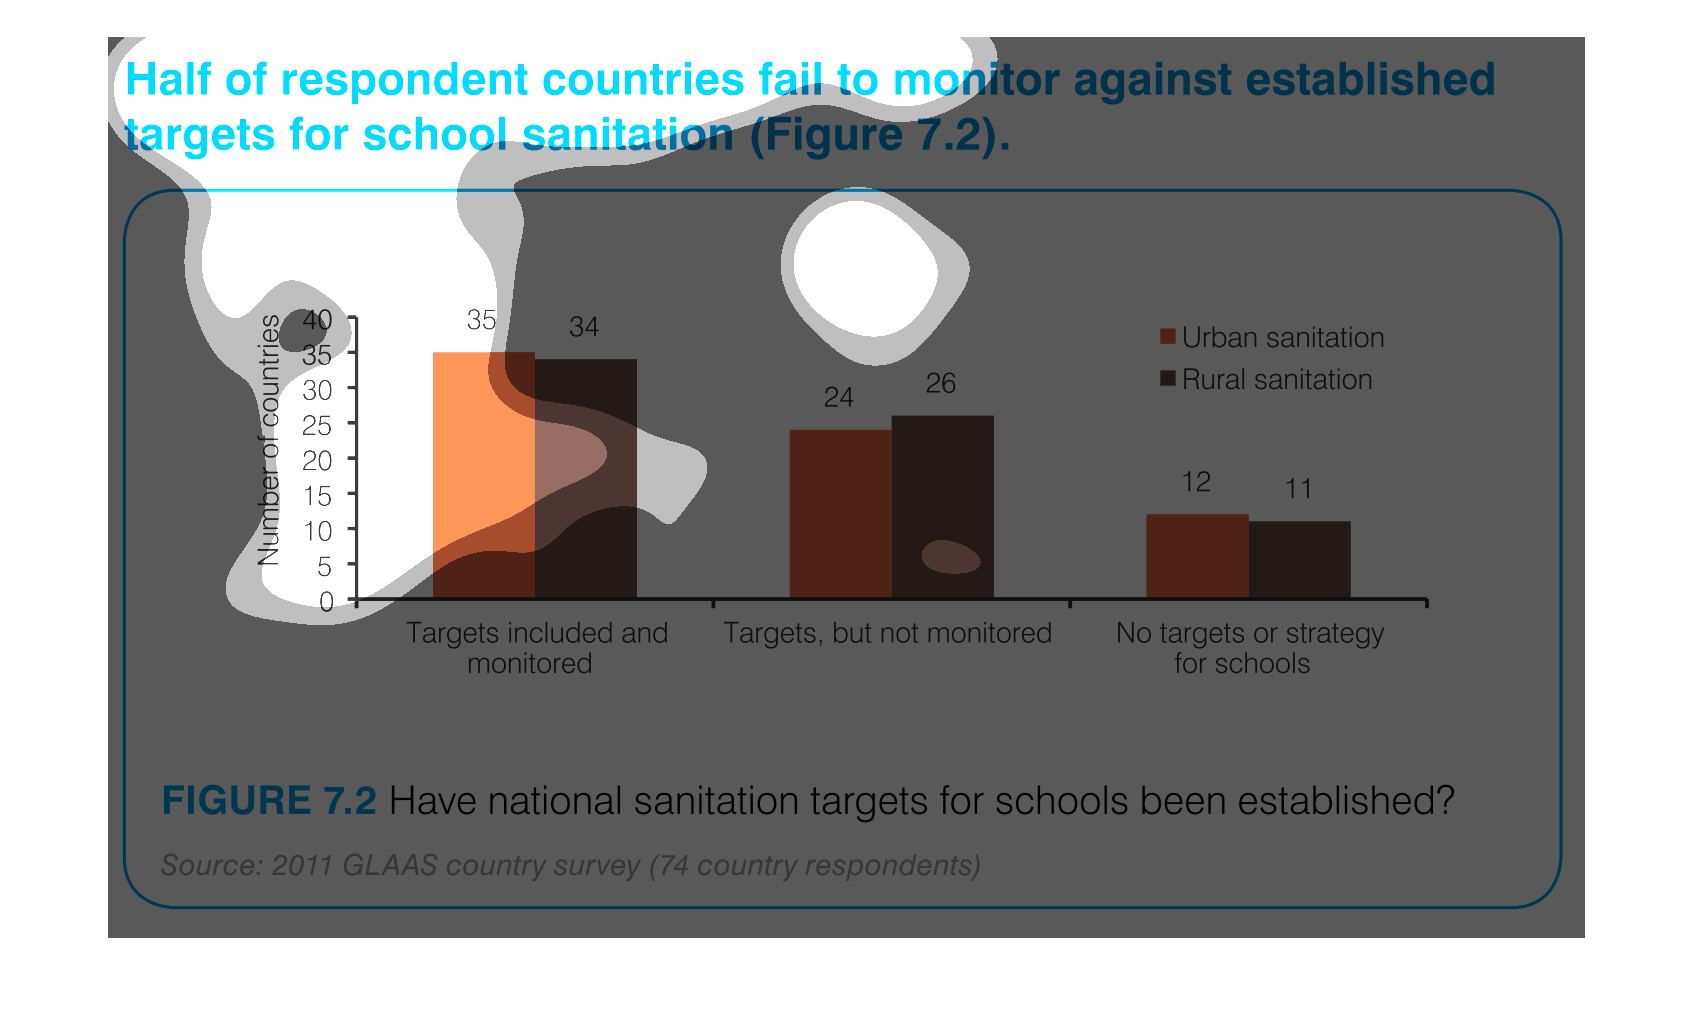
The figure presented is titled half of respondent countries fail to monitor against established
targets for school sanitation (figure 7.2).  The figure shows bar graphs.
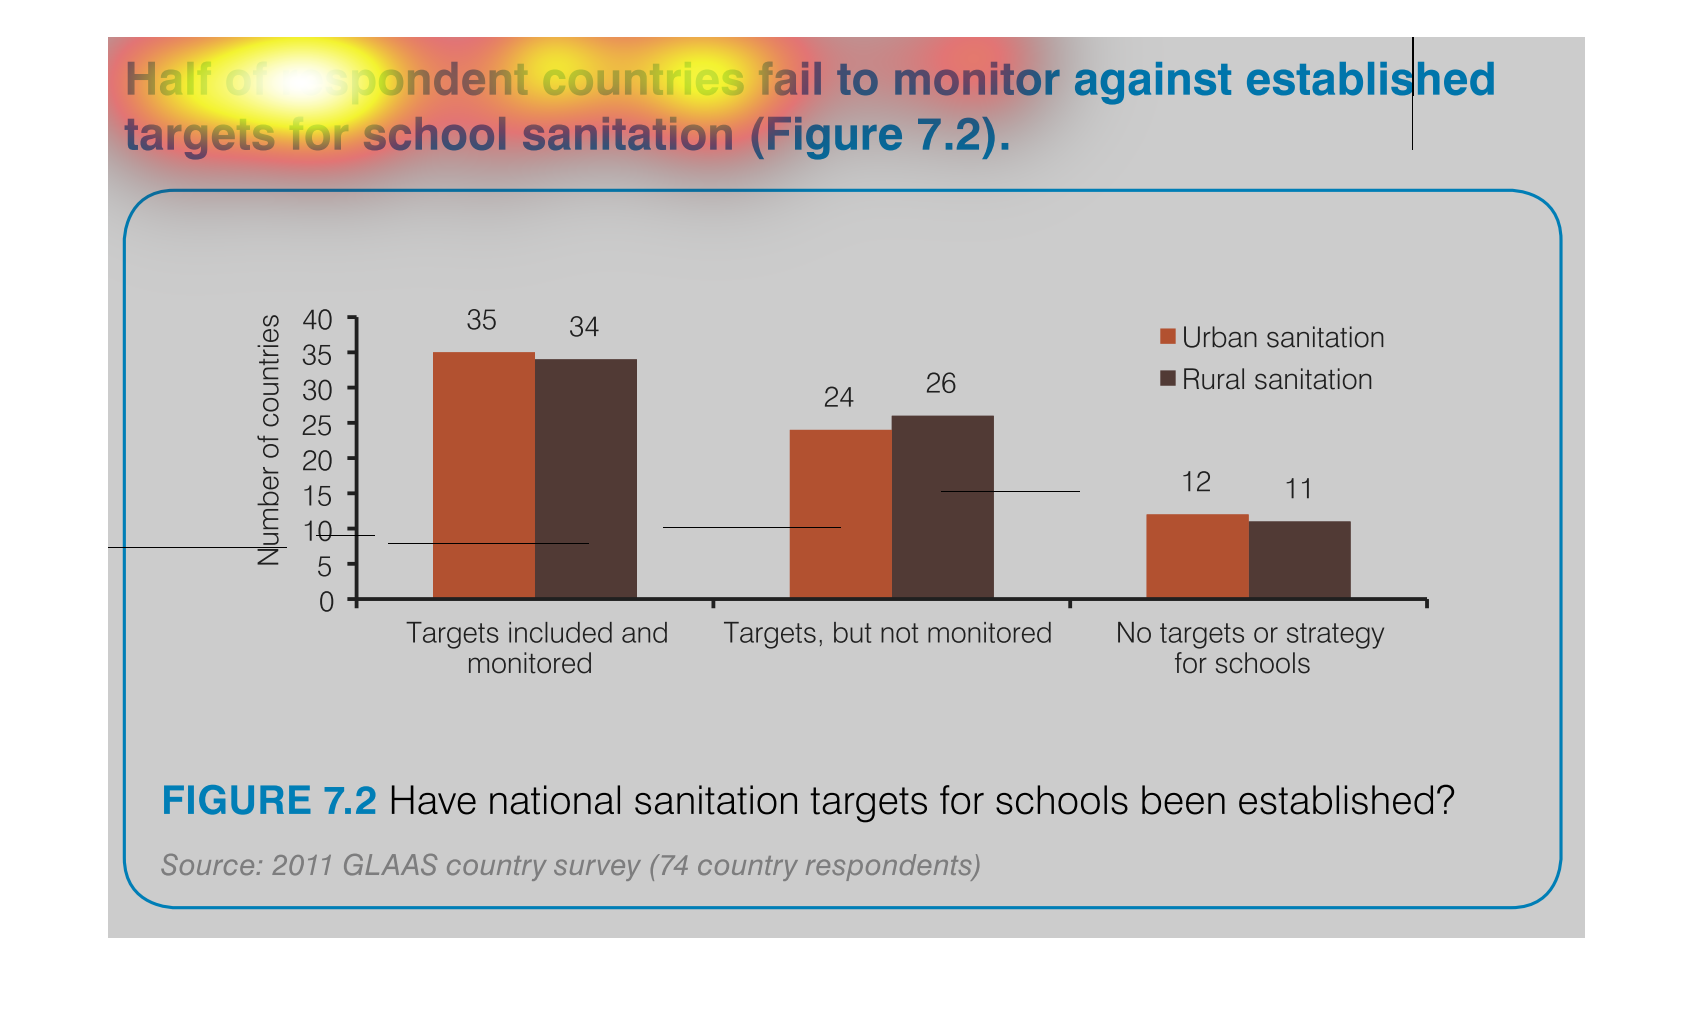
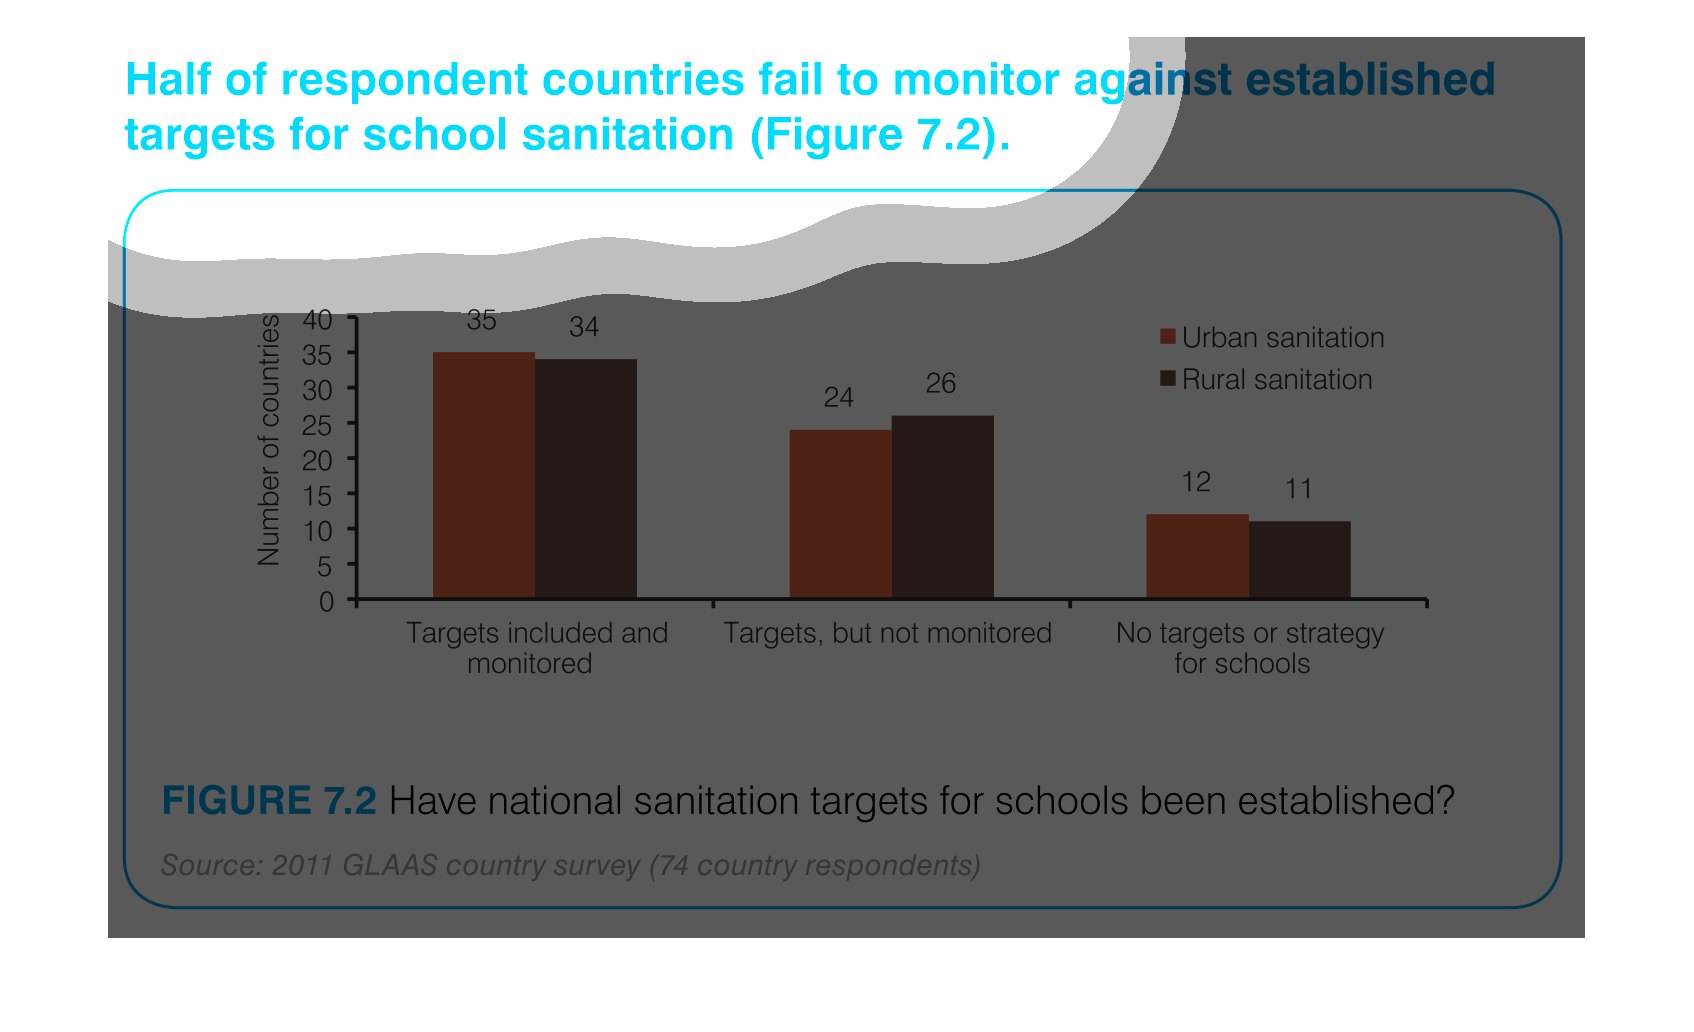
Sometimes the institutions we hold to a certain standard don't quite make the cut, so we have
to constantly monitor and safe guard against letting slip up. This graph shows how a lot of
schools around the world fail at keeping a clean environment for the children.
Figure 7.2 School Sanitation Targets  Source 2011 GLAAS Country Survey chart shows half of
respondent countries (37 out of 74) fail to monitor against established School Sanitation
Targets.