This chart describes only one third of countries estimate that hygiene promotion programs
are scaled up in primary schools. Different categories are represented by different colors.

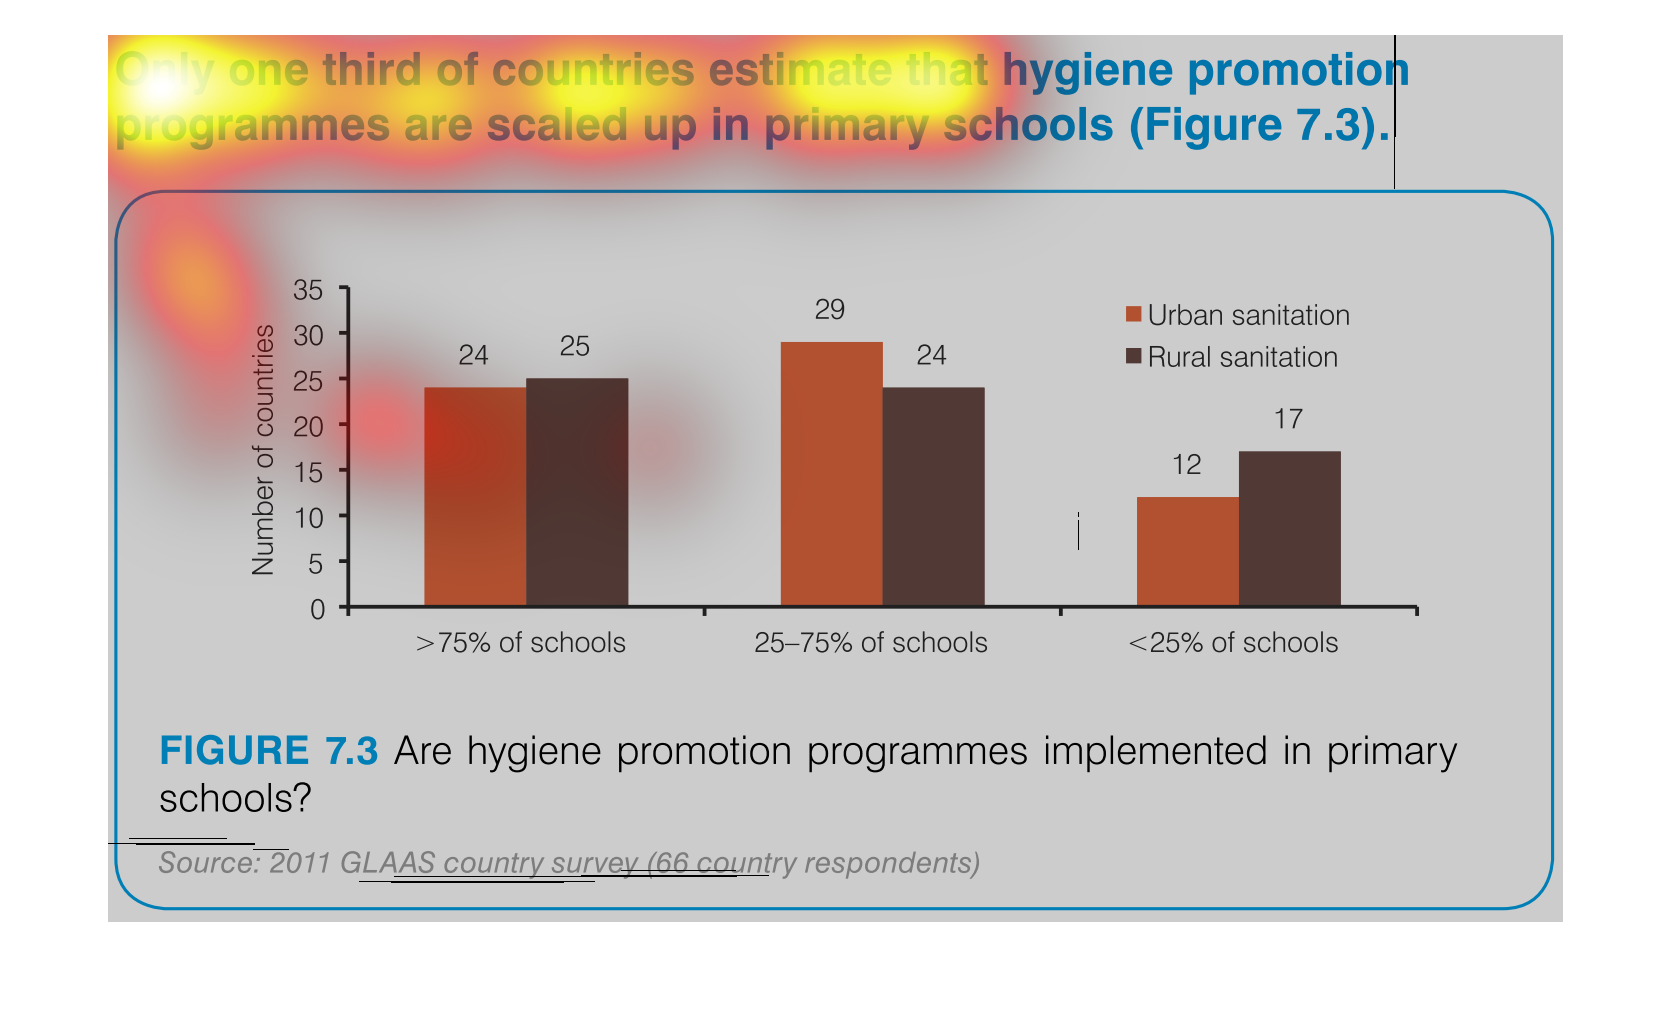
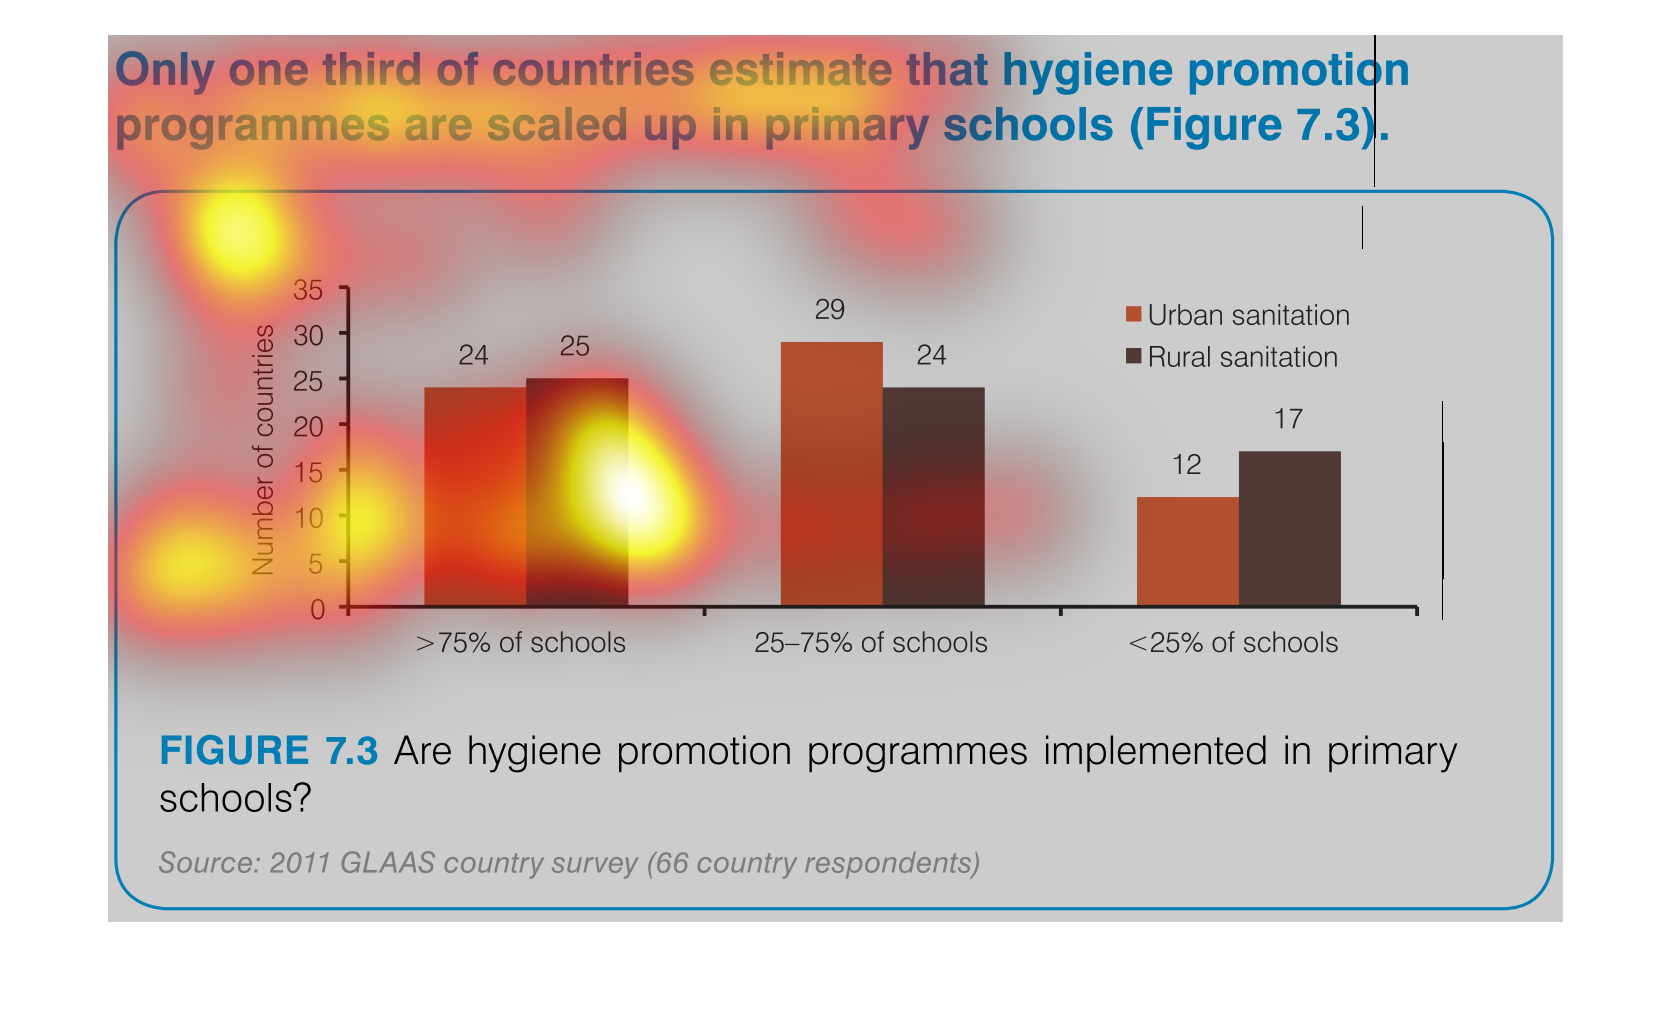
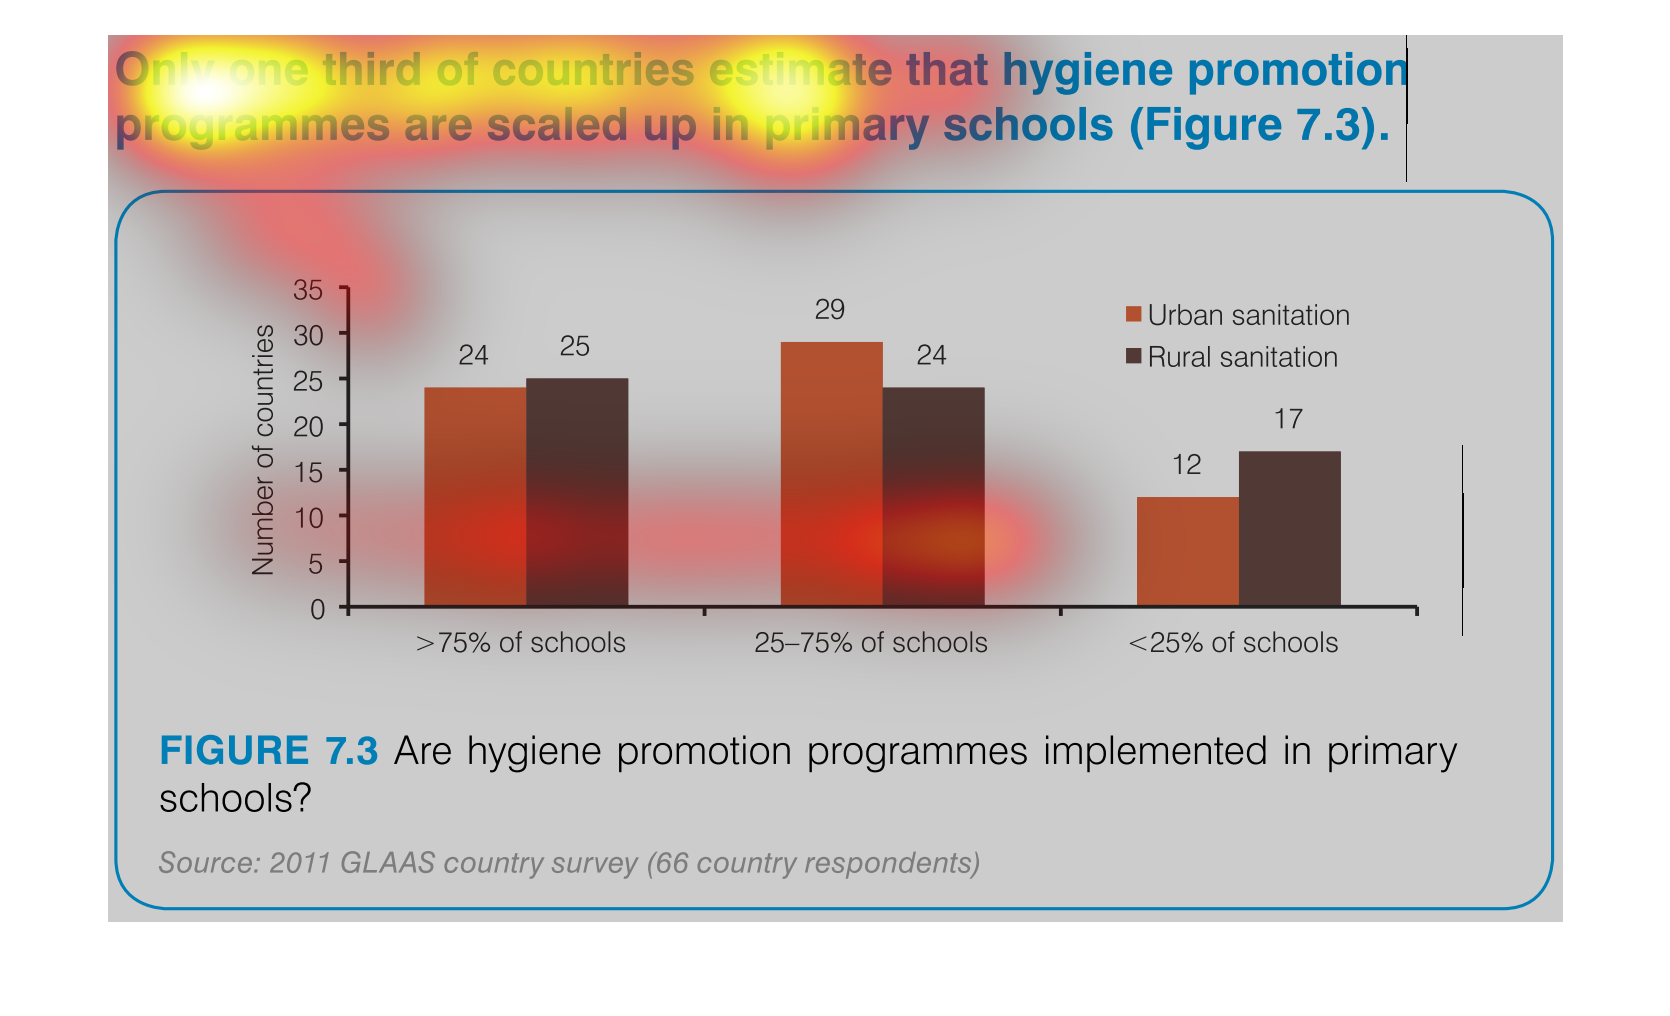
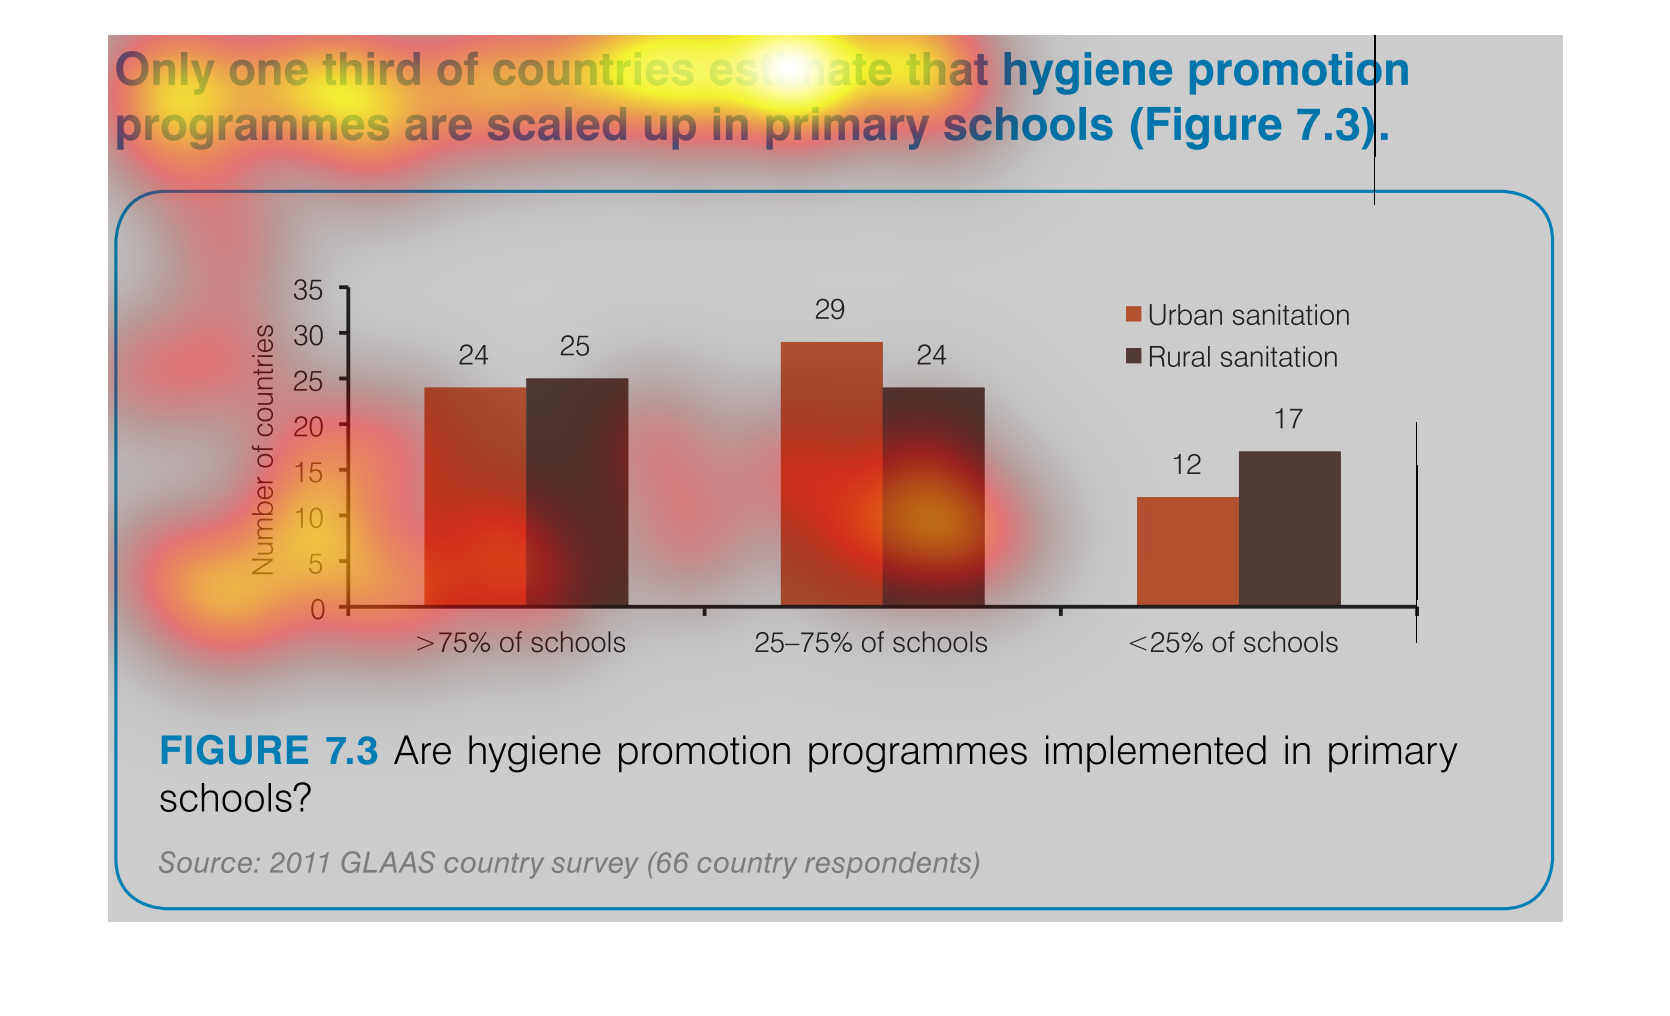
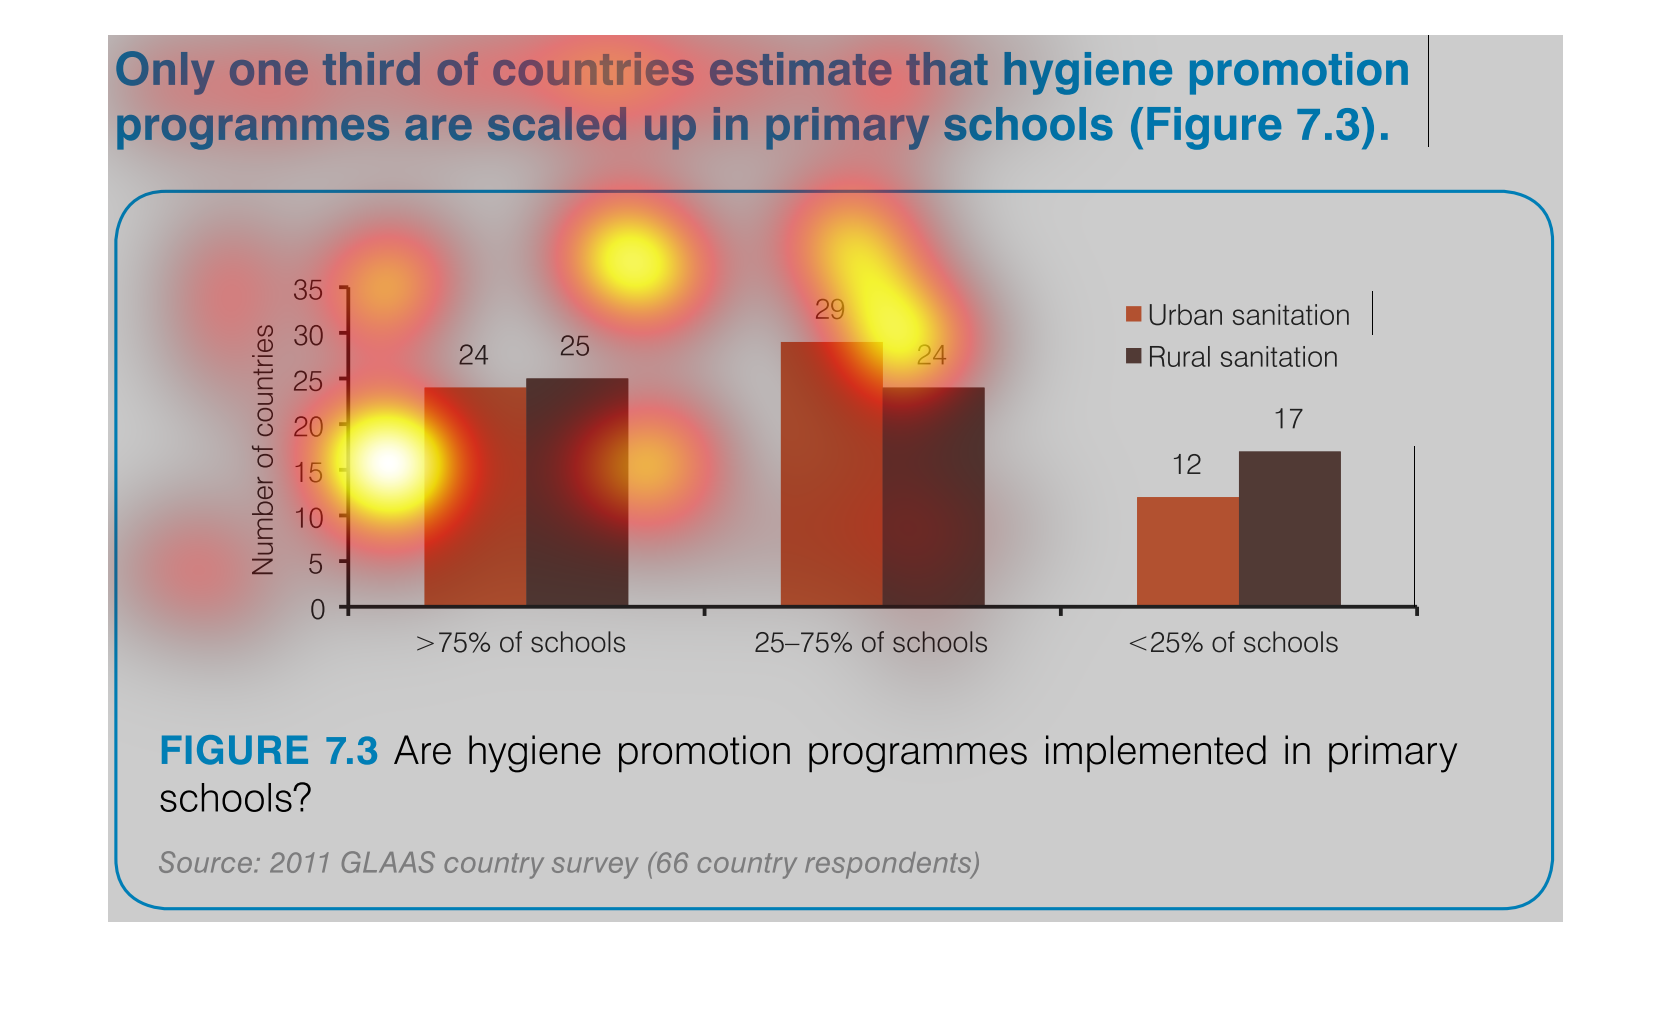
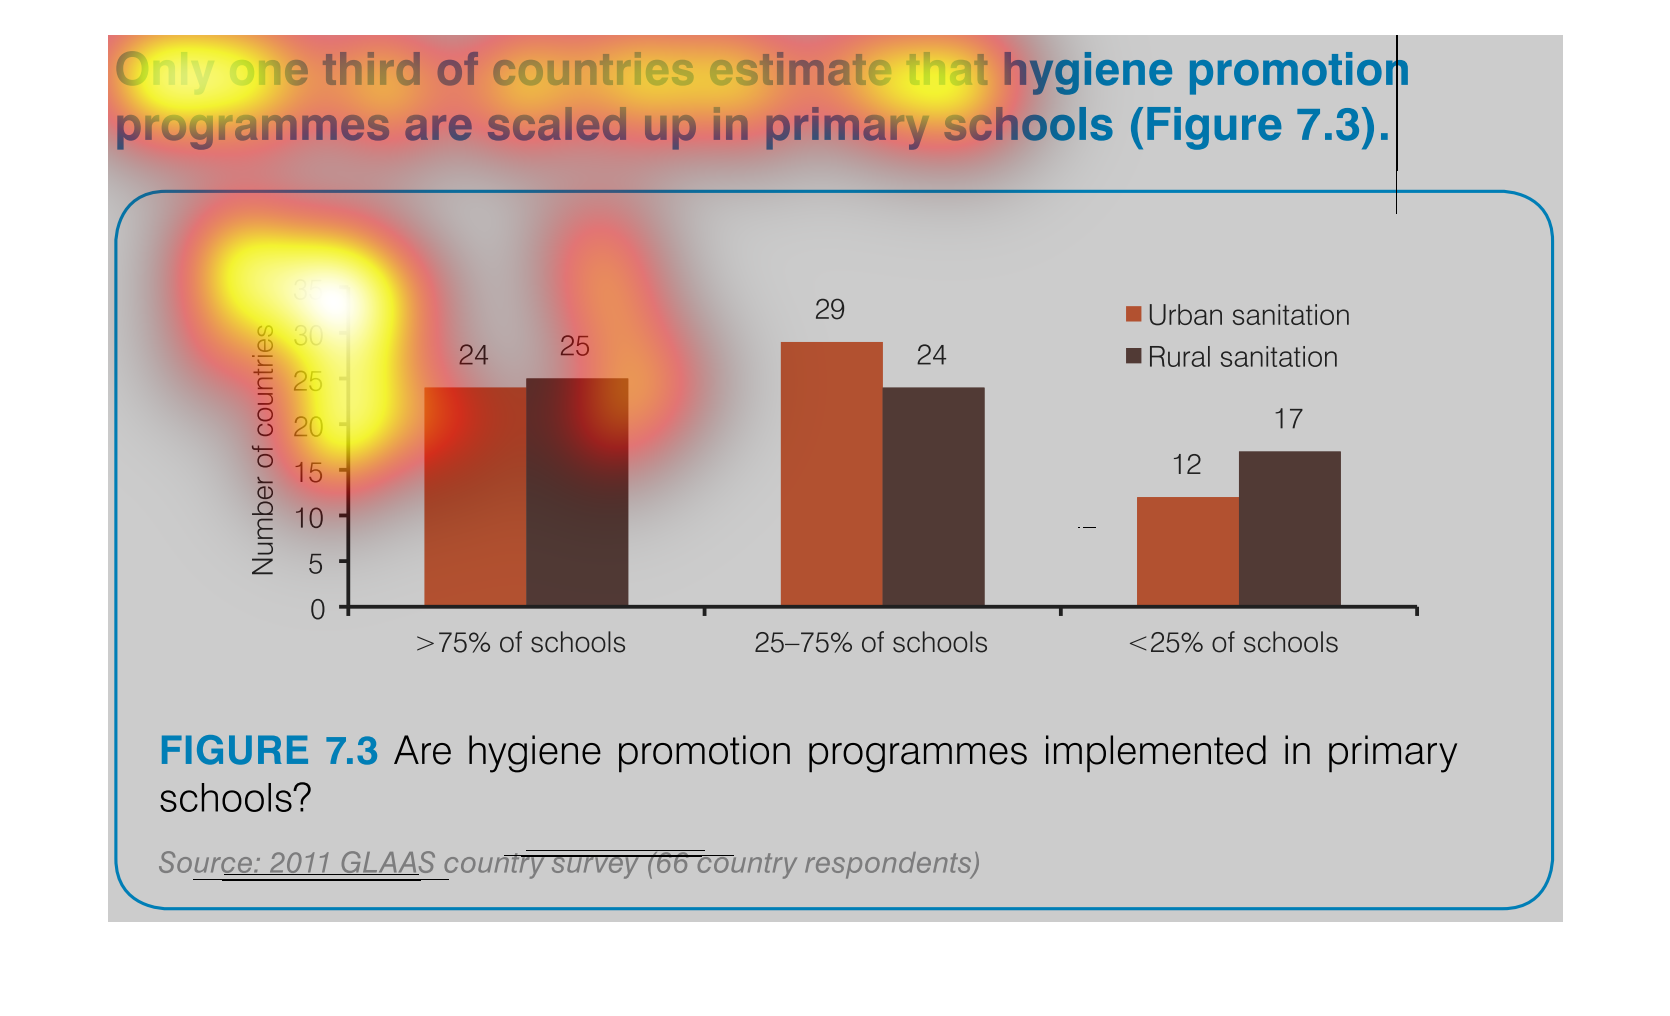
only one third of countries estimated that hygiene promotion programmes are scaled up primary
schools. Y axis is number of countries, X axis is three separate categories, >75%,  25-75%,
and <25%, each of these three categories has two bars representing urban and rural sanitation
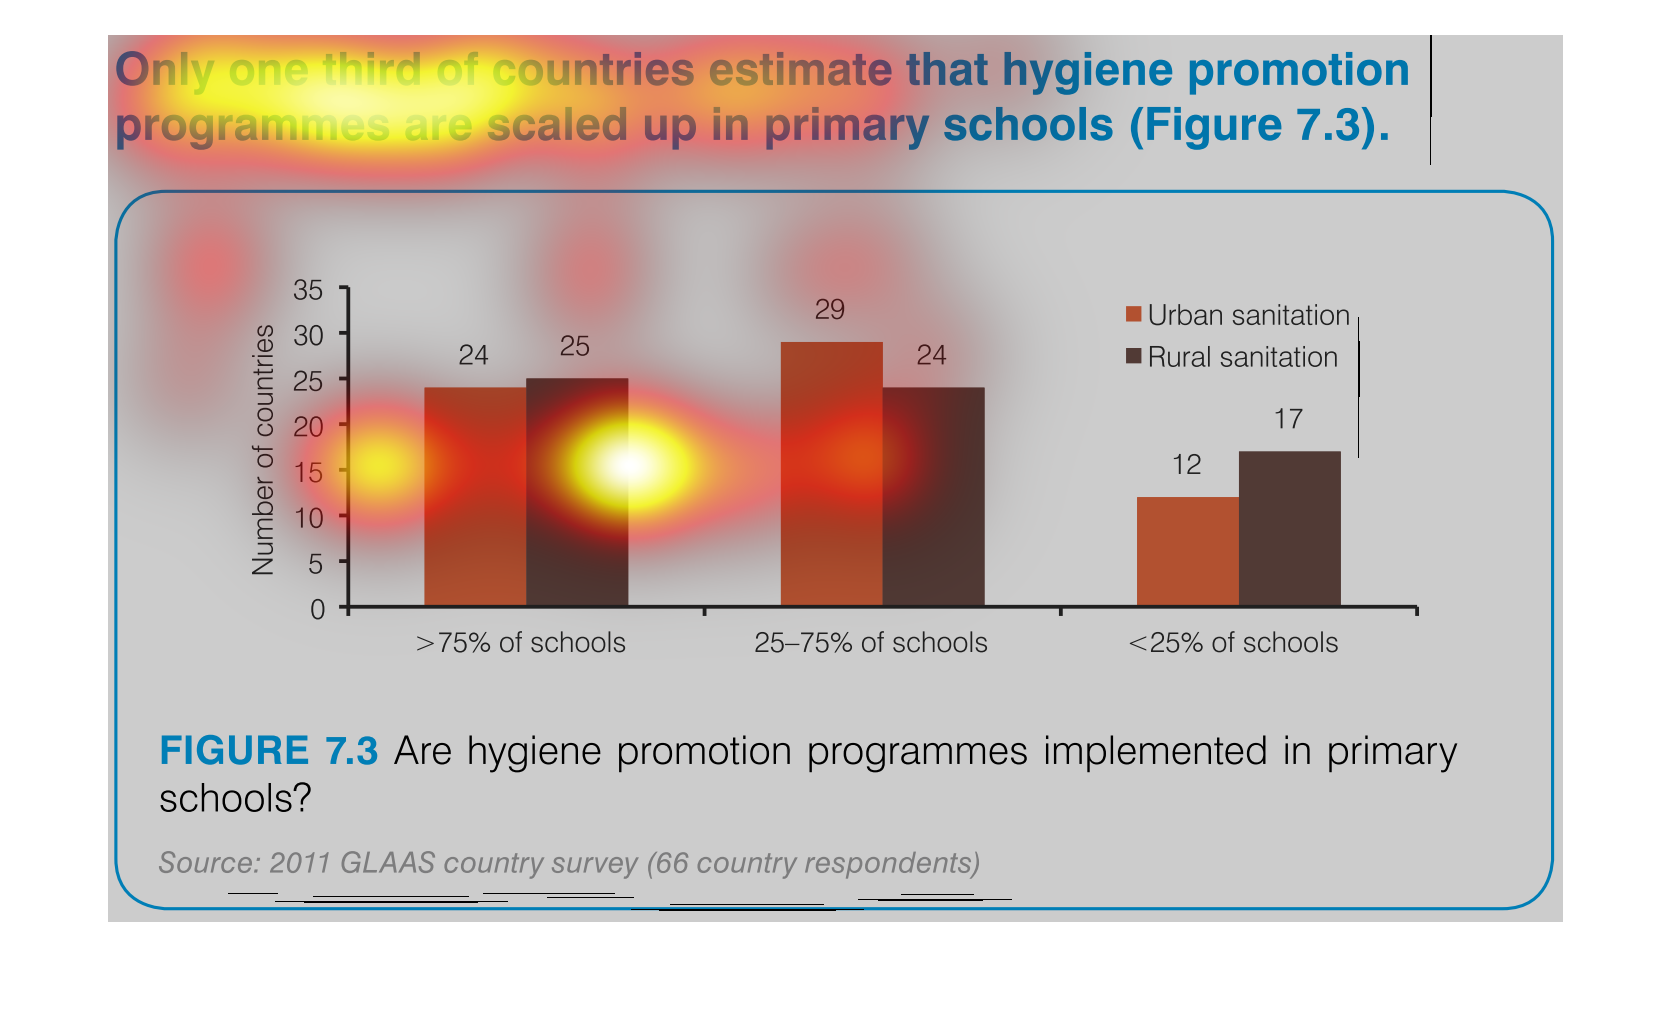
This is a graph showing how only one third of countries estimate that hygiene promotion programs
are scaled up in primary schools. it shows that in 29 countries there are programs between
25-75% of schools.
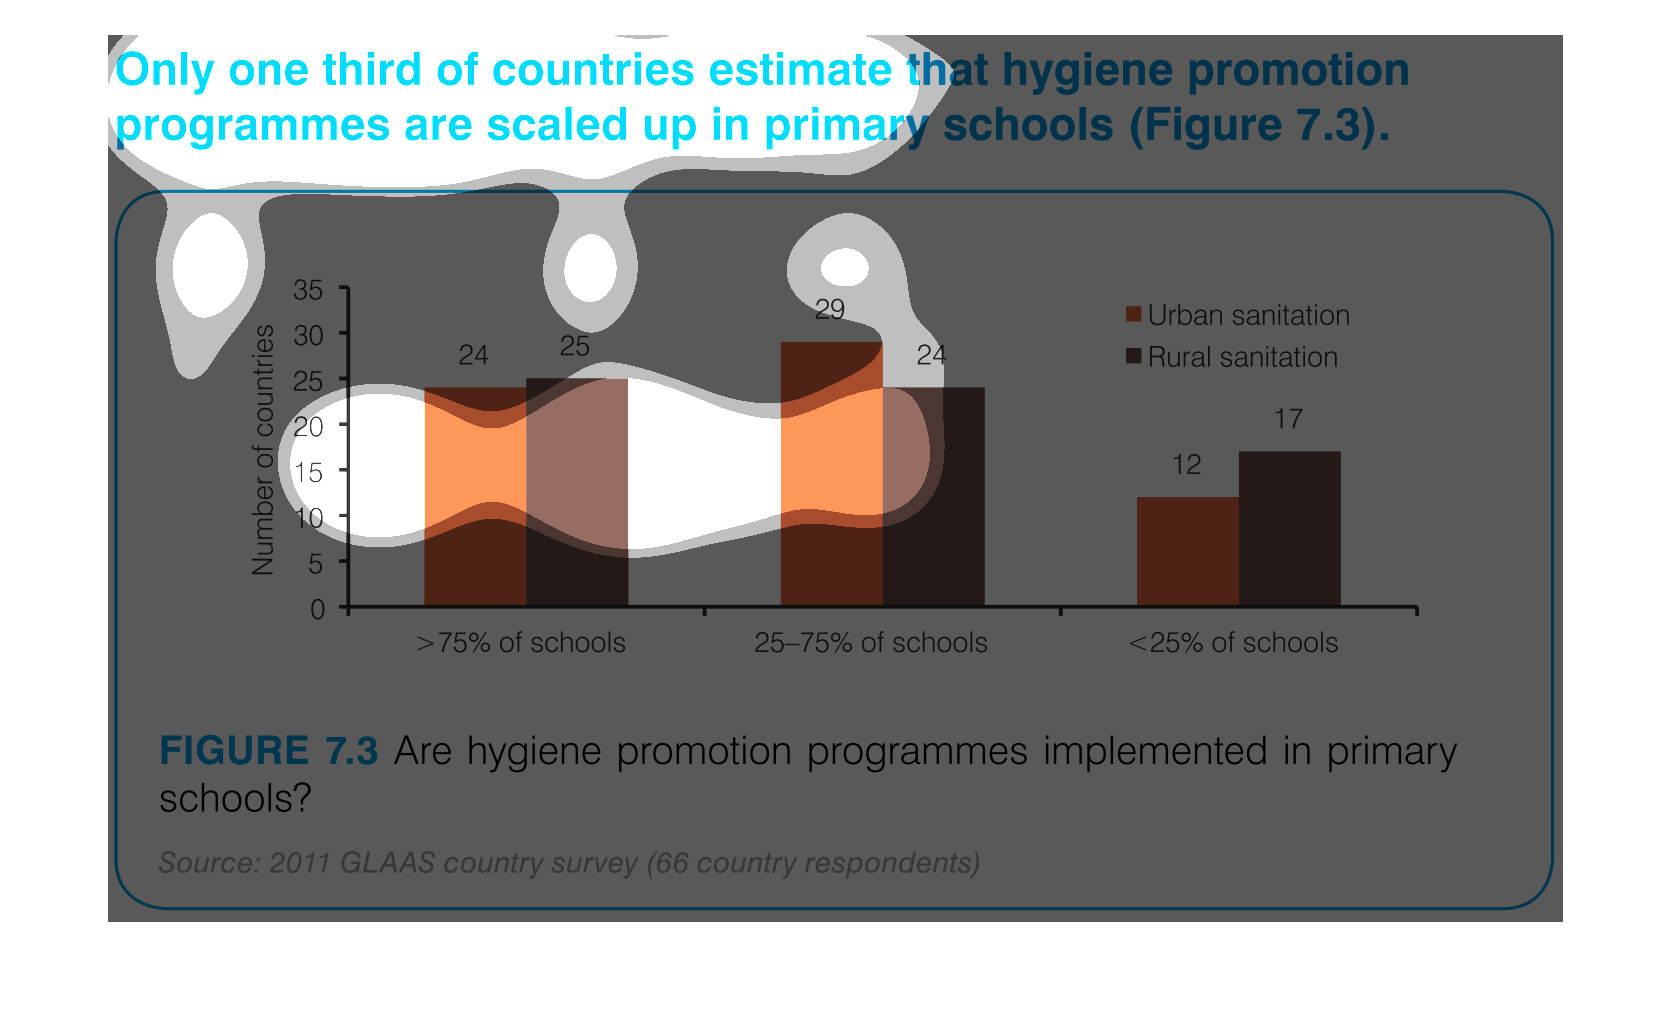
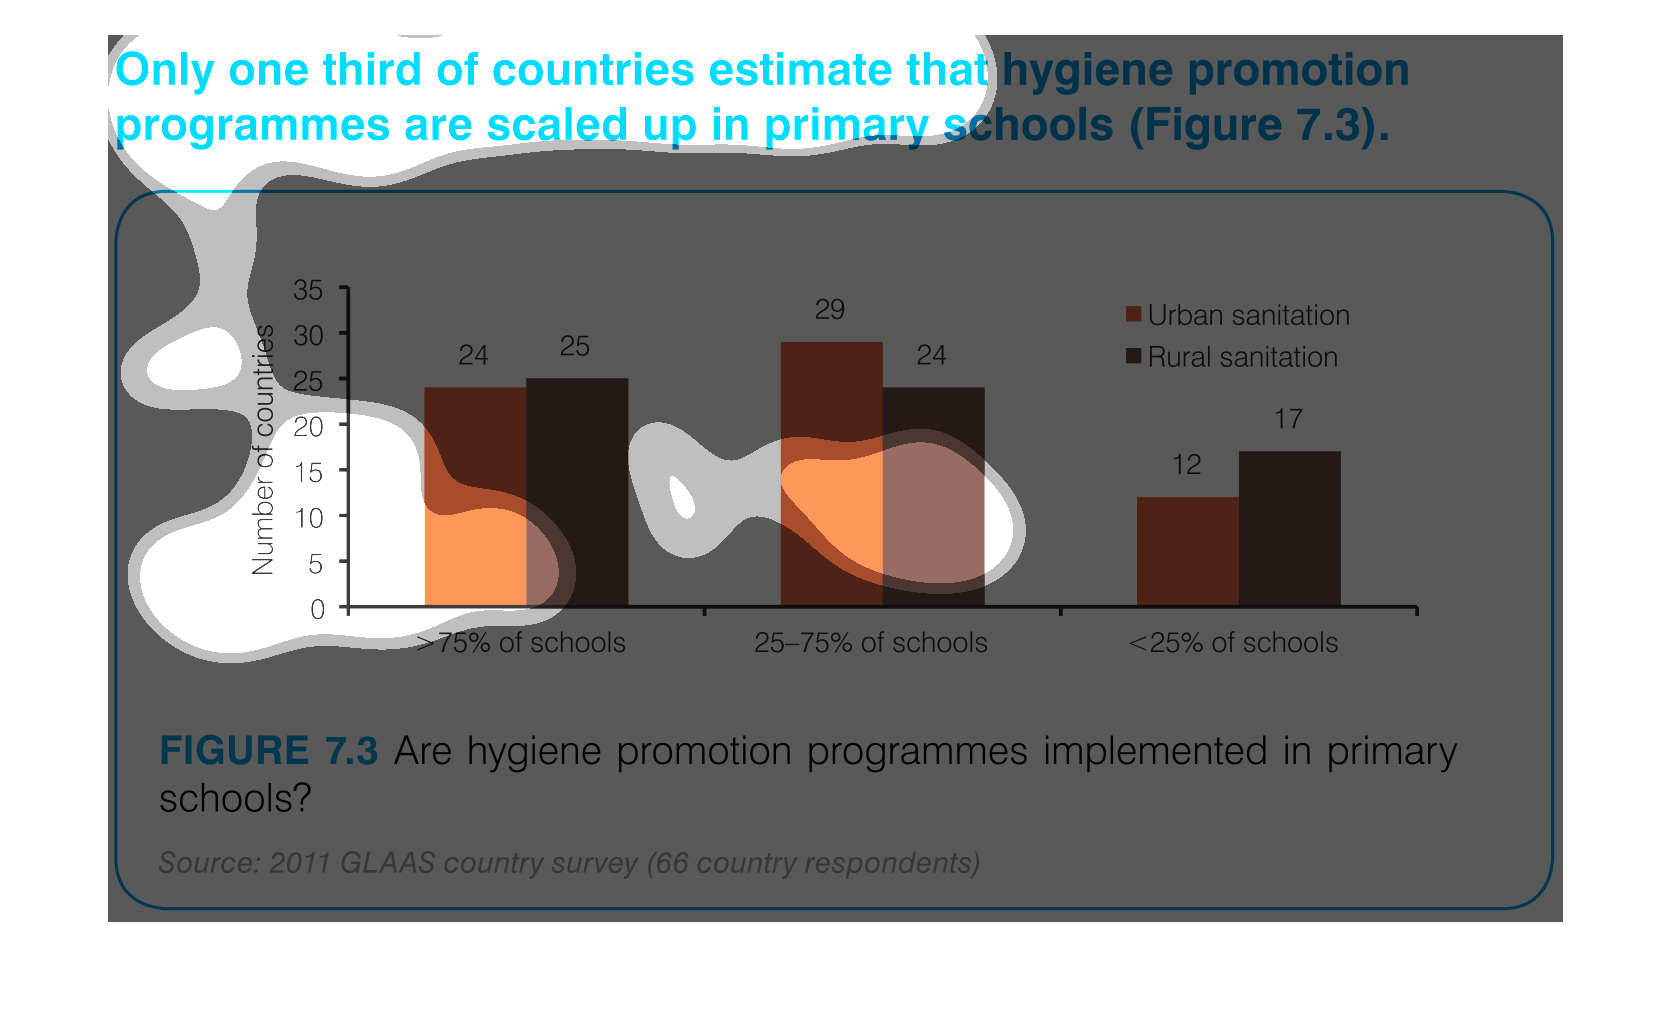
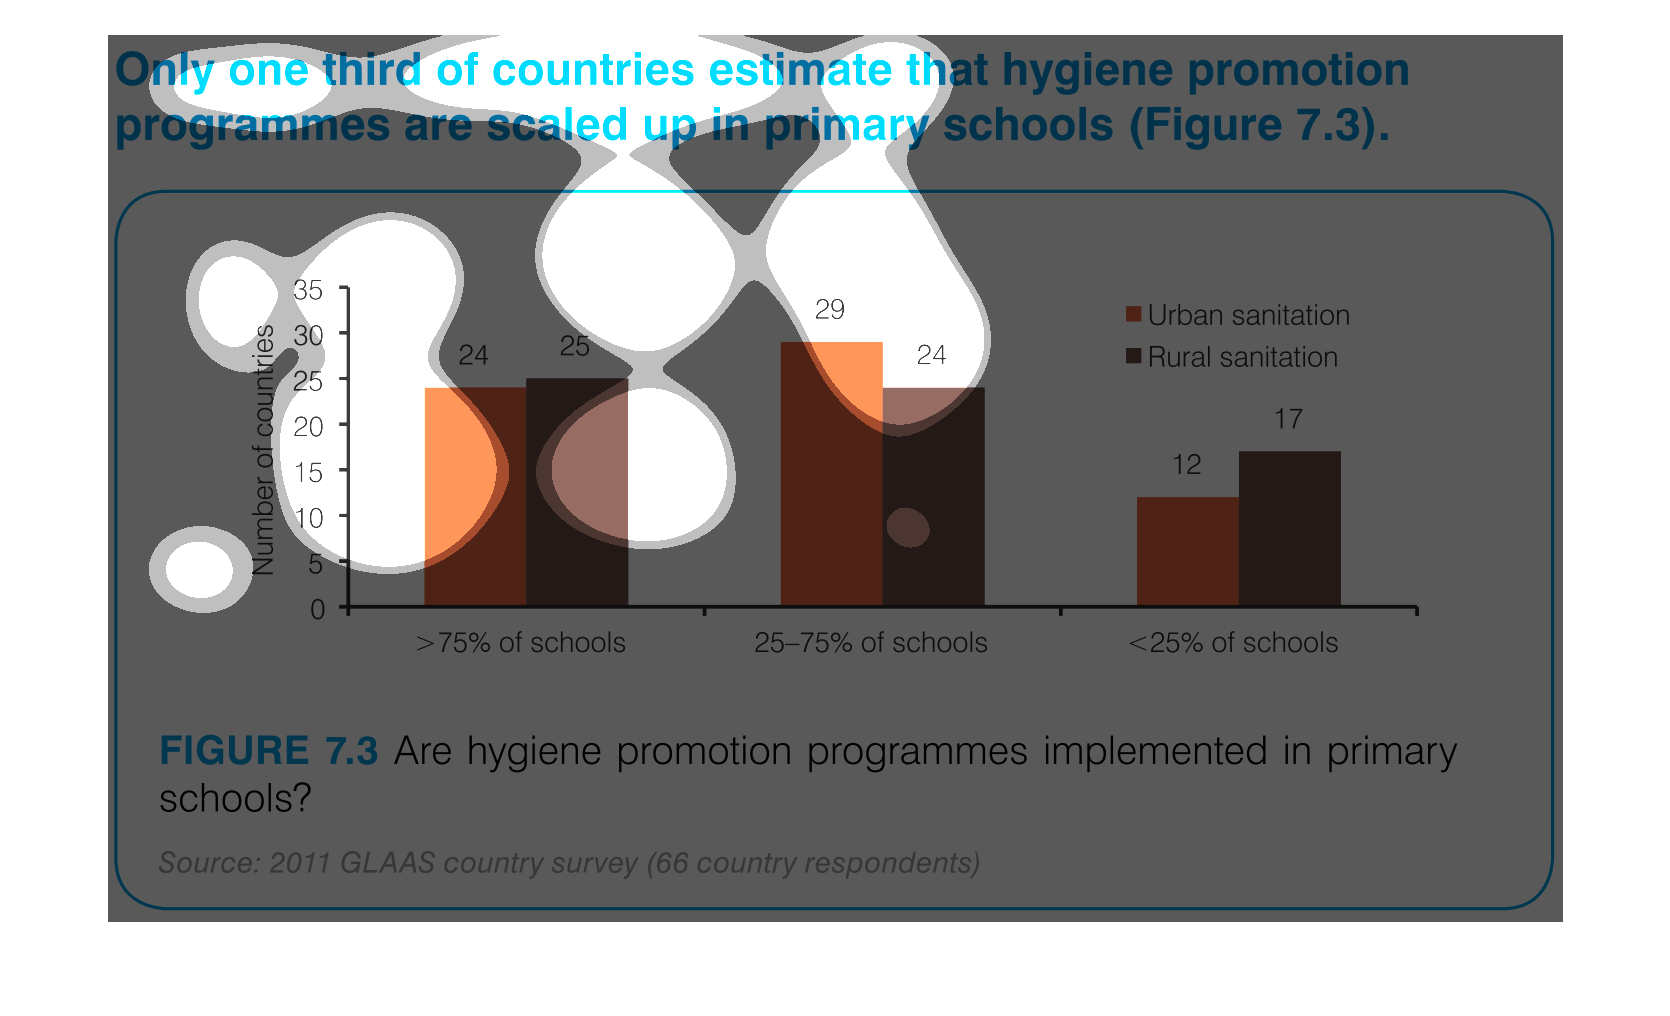
This infographic shows how sanitation programs are implemented in elementary schools. The
data are broken down by rural and suburban areas. We can't tell which countries are represented.
This chart describes only one third of countries estimate that hygiene promotion programs
are scaled up in primary schools.Different percentages are represented by different colors.
A infographic concerning promotion of hygiene in primary schools. Shows only one third of
countries have hygiene promotions programs in primary schools.
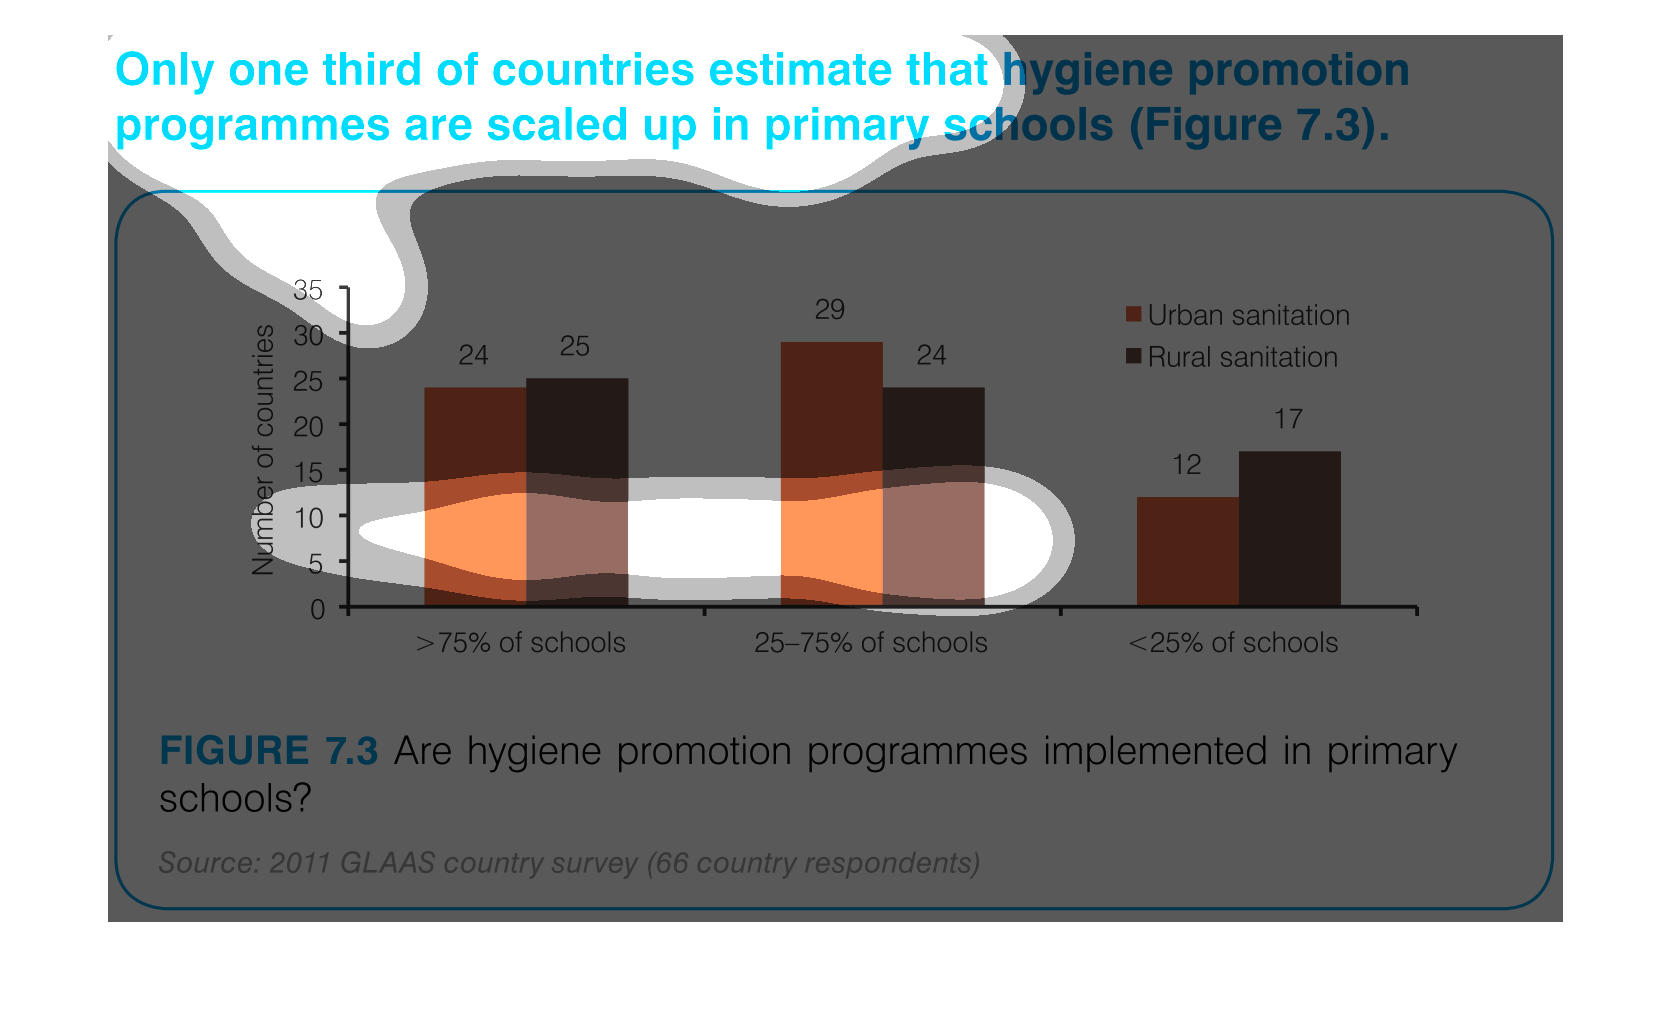
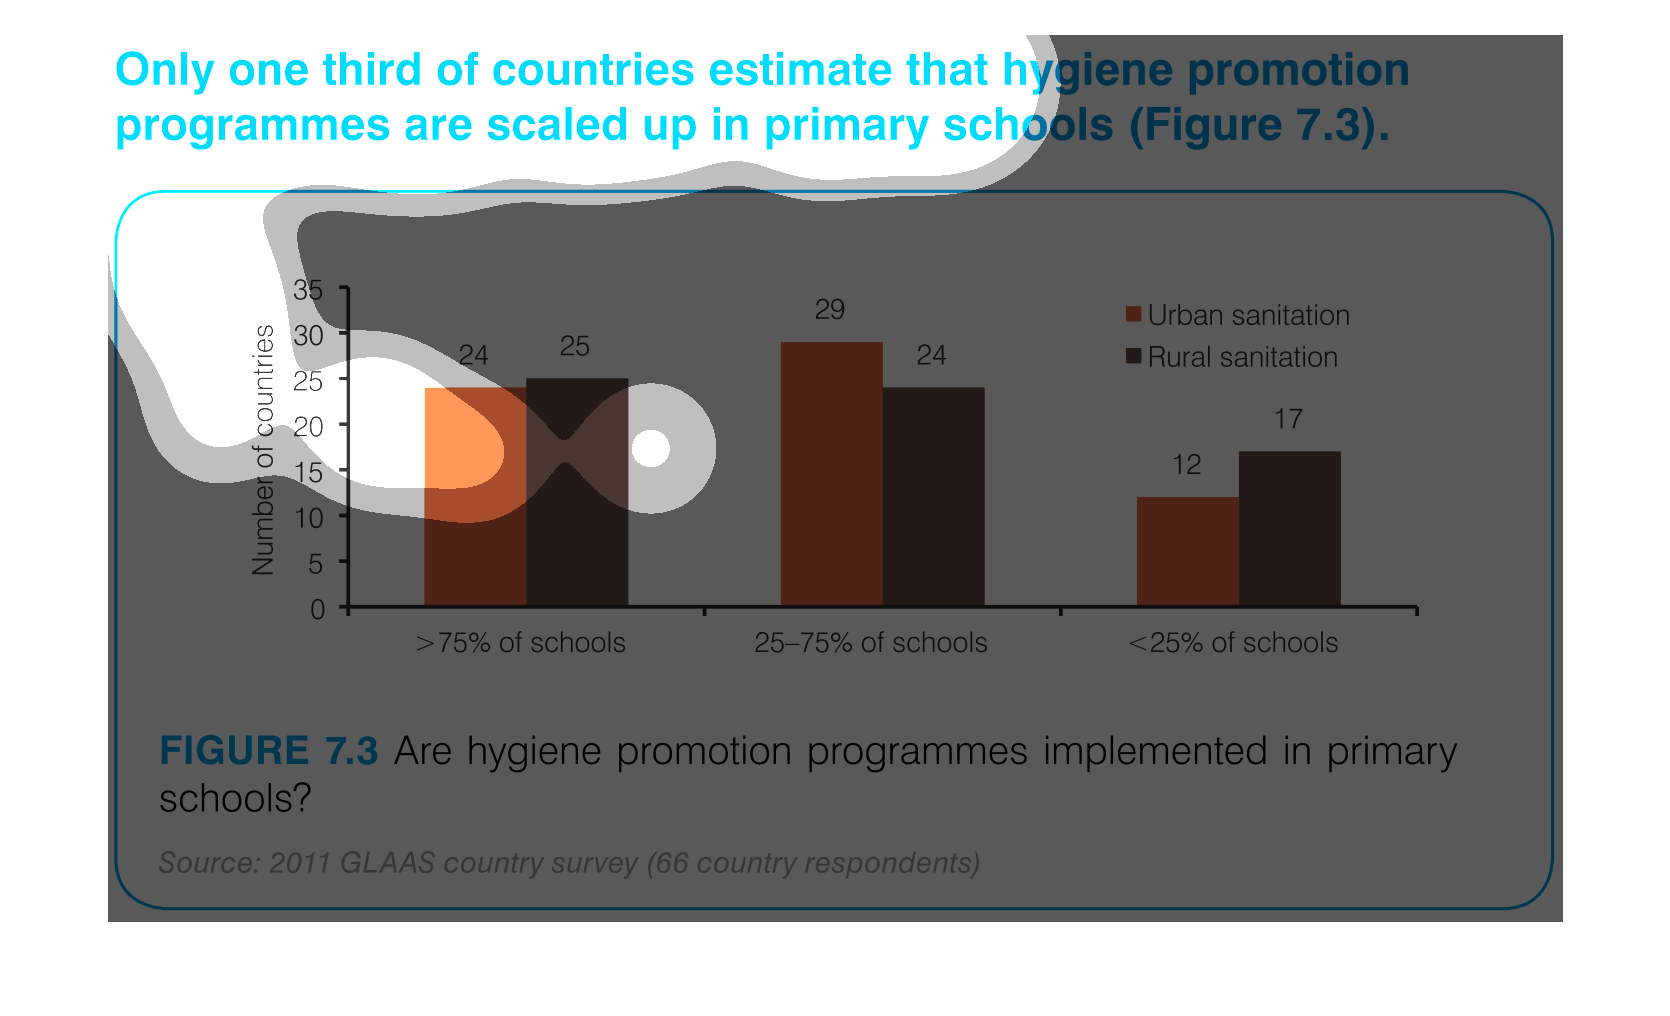
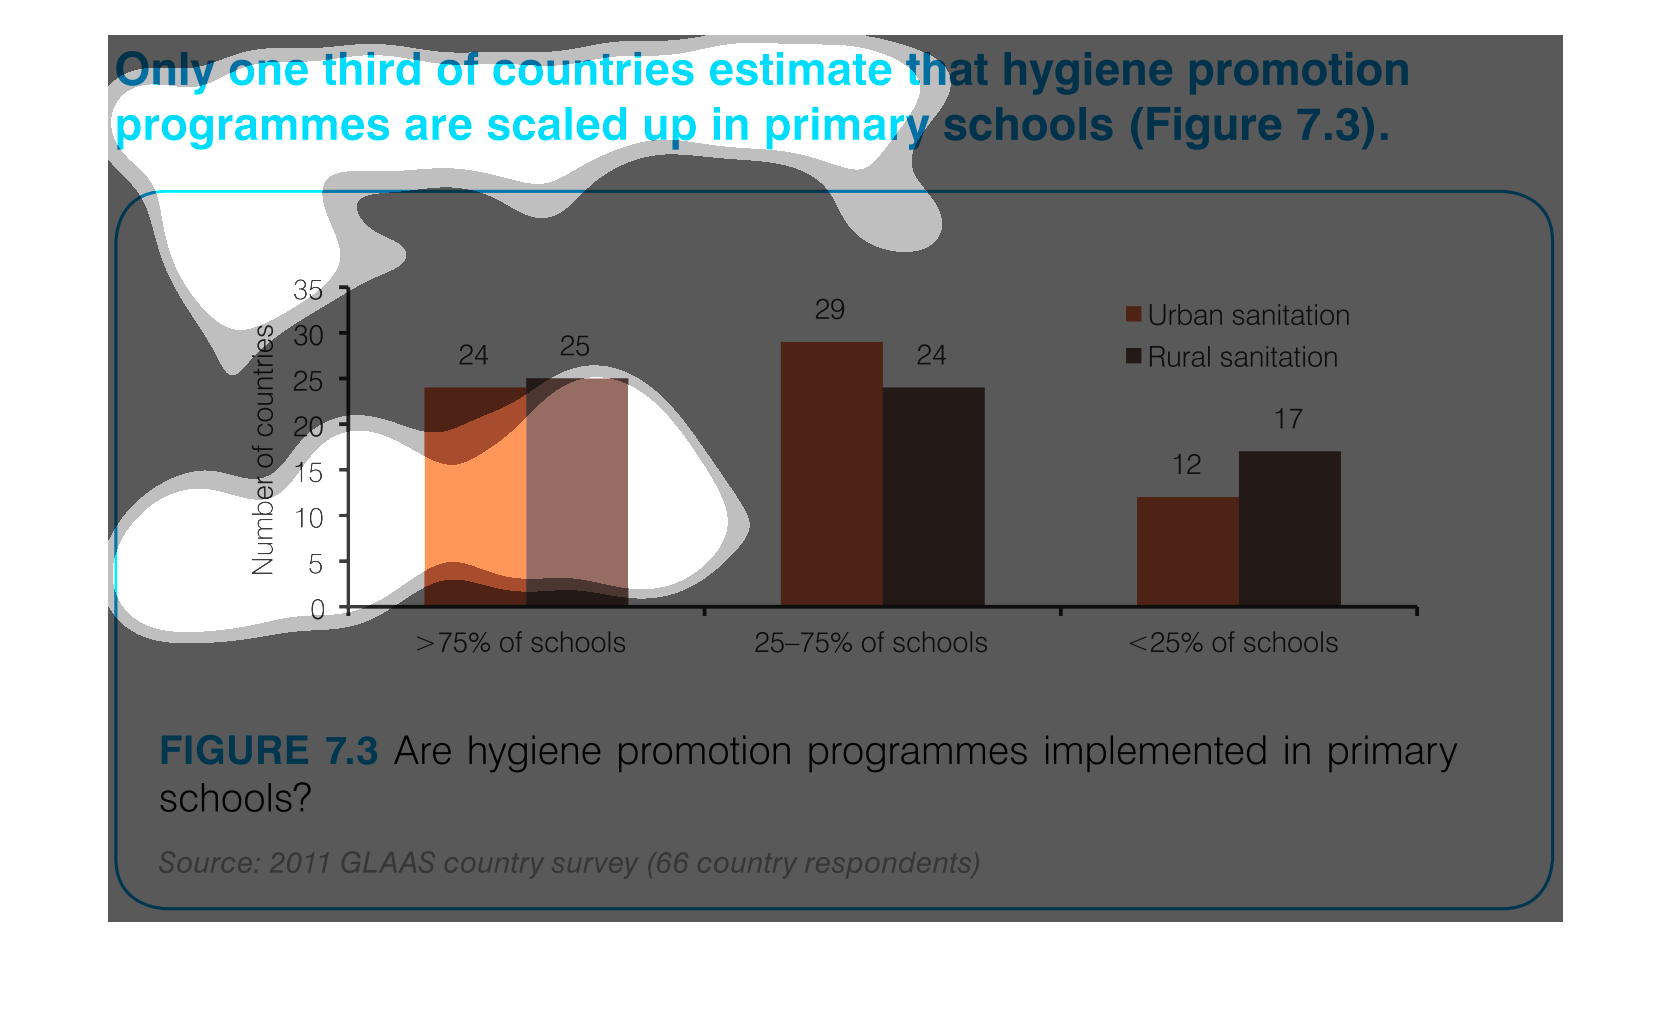
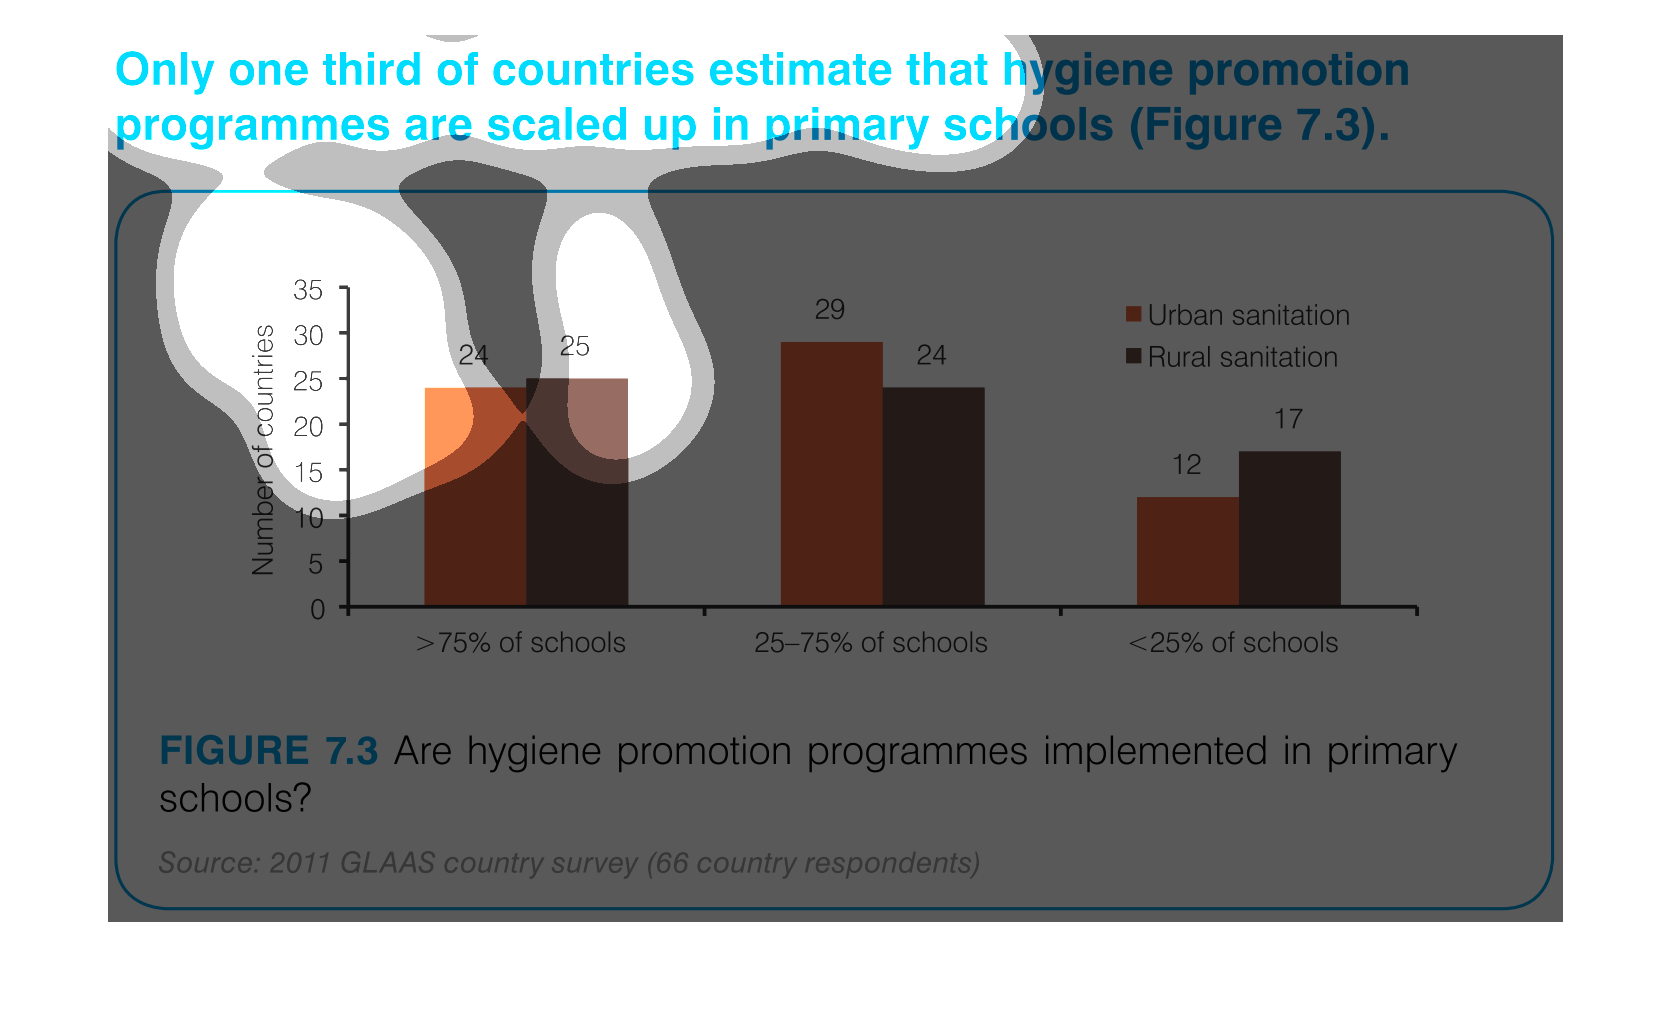
This chart shows that only 1/3 of countries estimate that hygiene promotion programs are scaled
up in primary schools. It is further broken down by urban sanitation in orange bars and rural
sanitation in dark brown.
This is a graph that shows that only one third of the countries estimate that hygiene promotion
programs are scaled up in primary schools and it covers the year 2011.
The figure presented is titled only one third of the countries estimate that hygiene promotion
programs are scaled up.  The data for this figure is a bar graph.
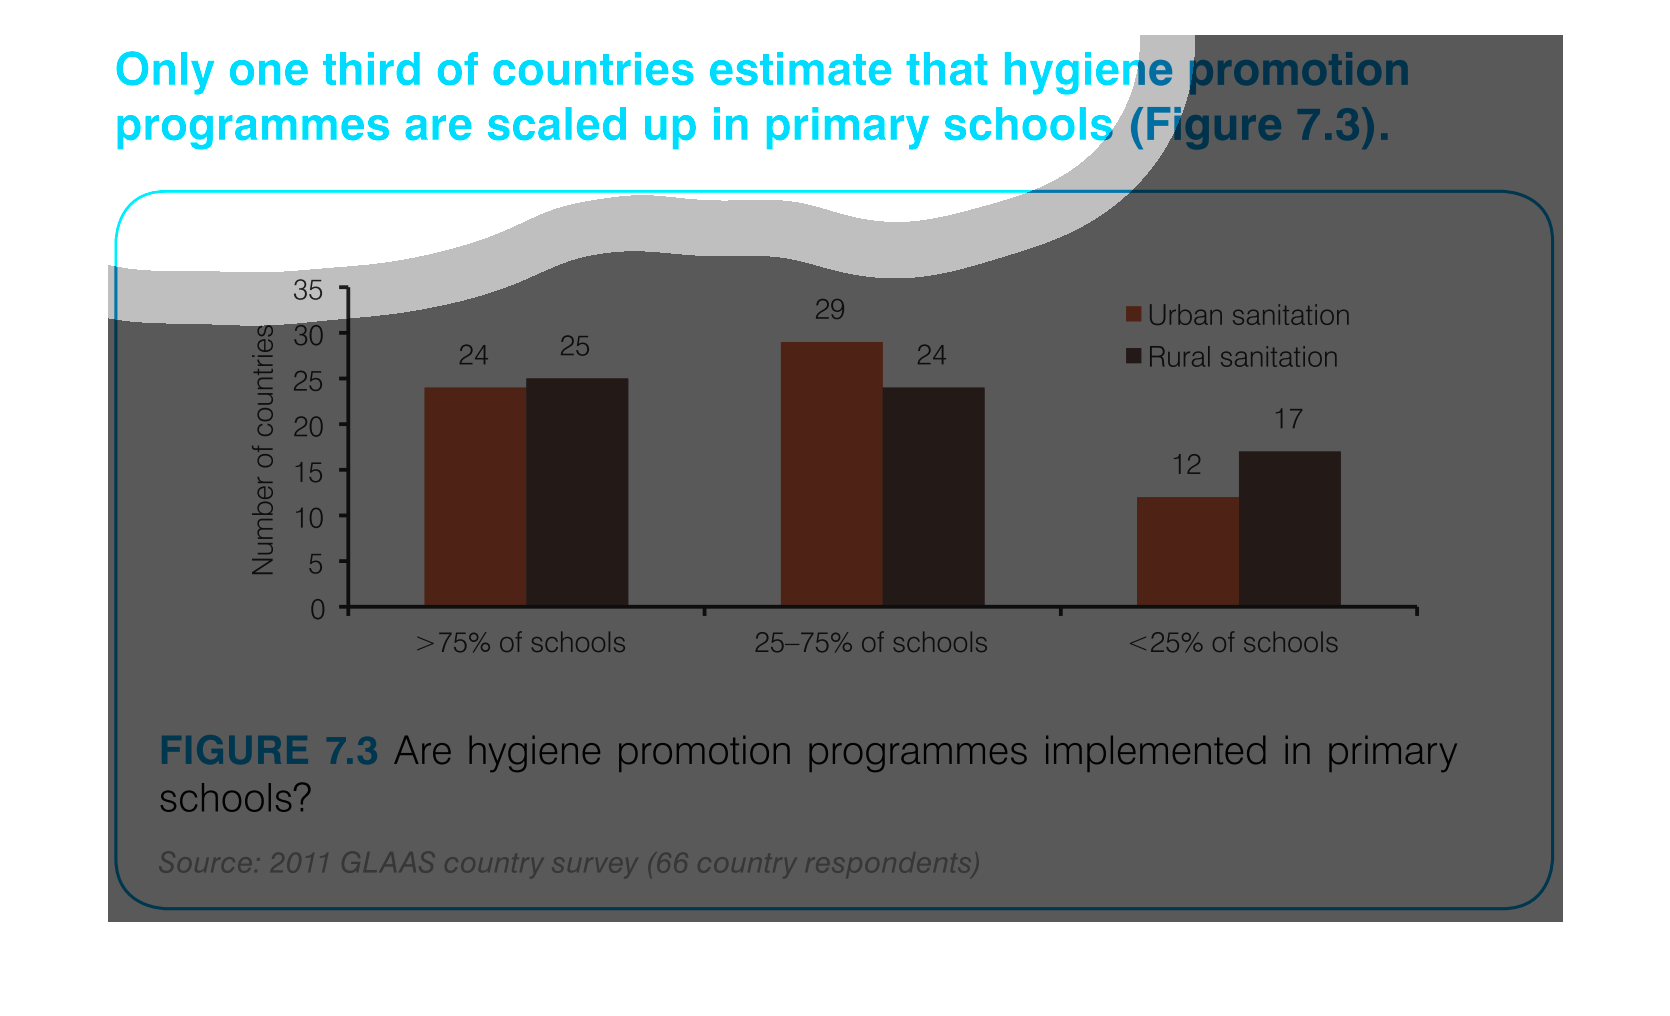
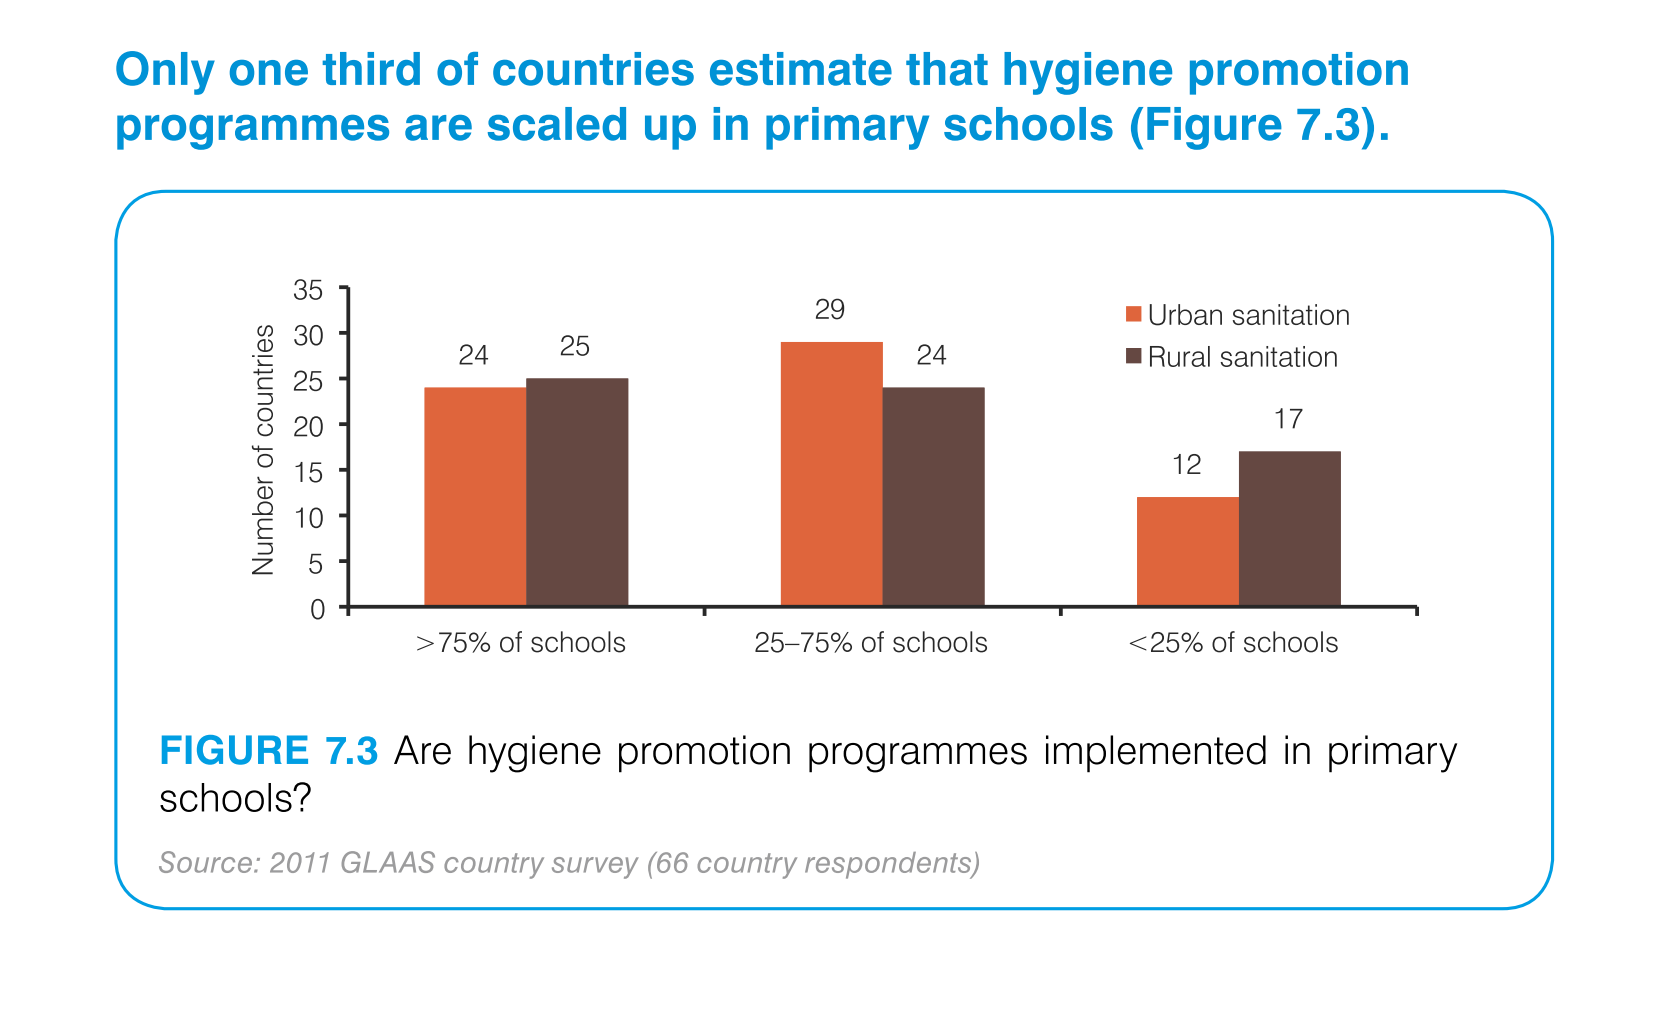
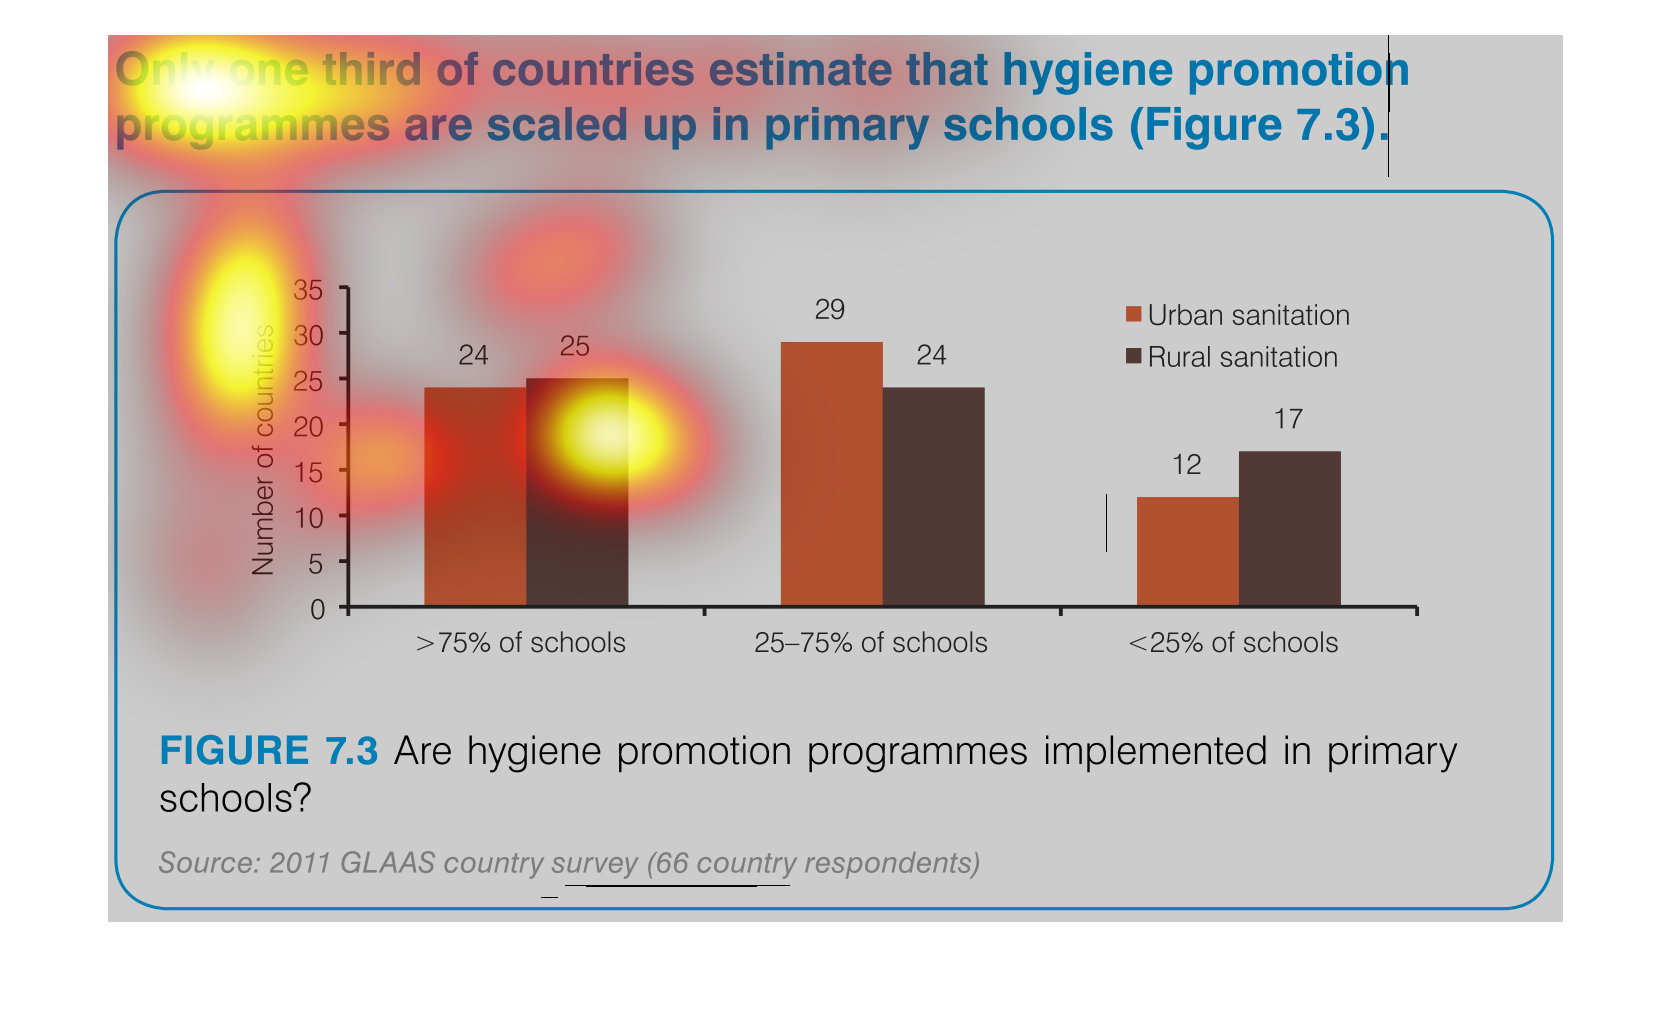
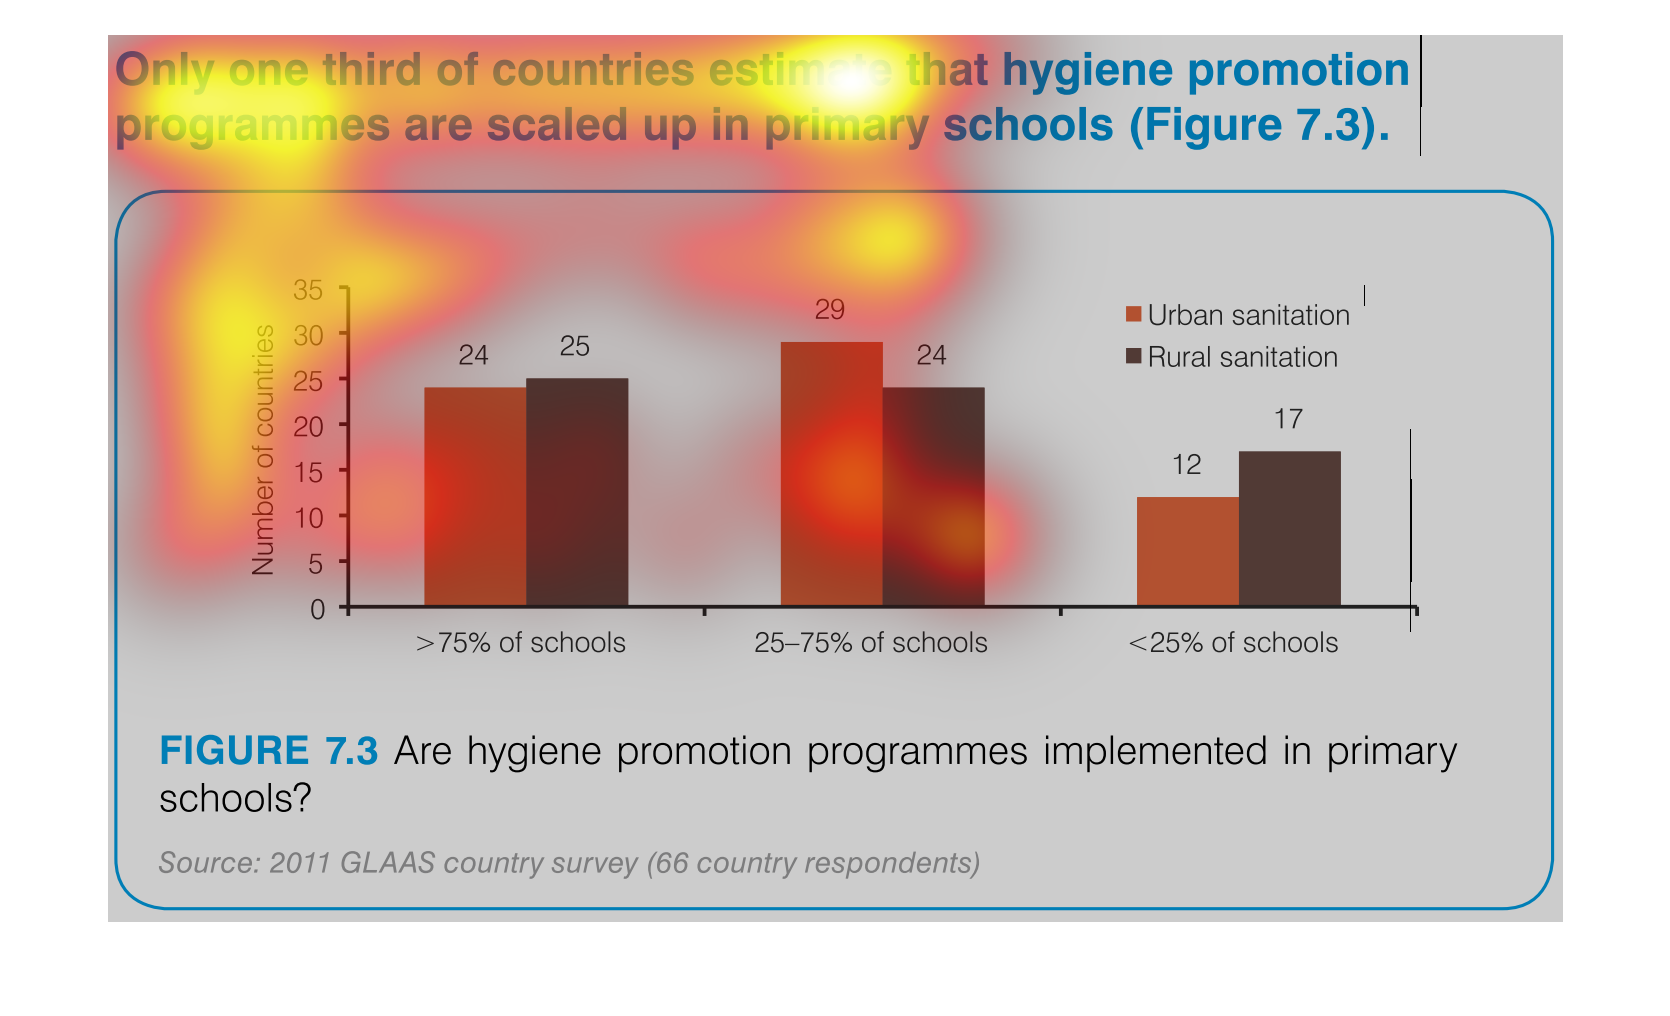
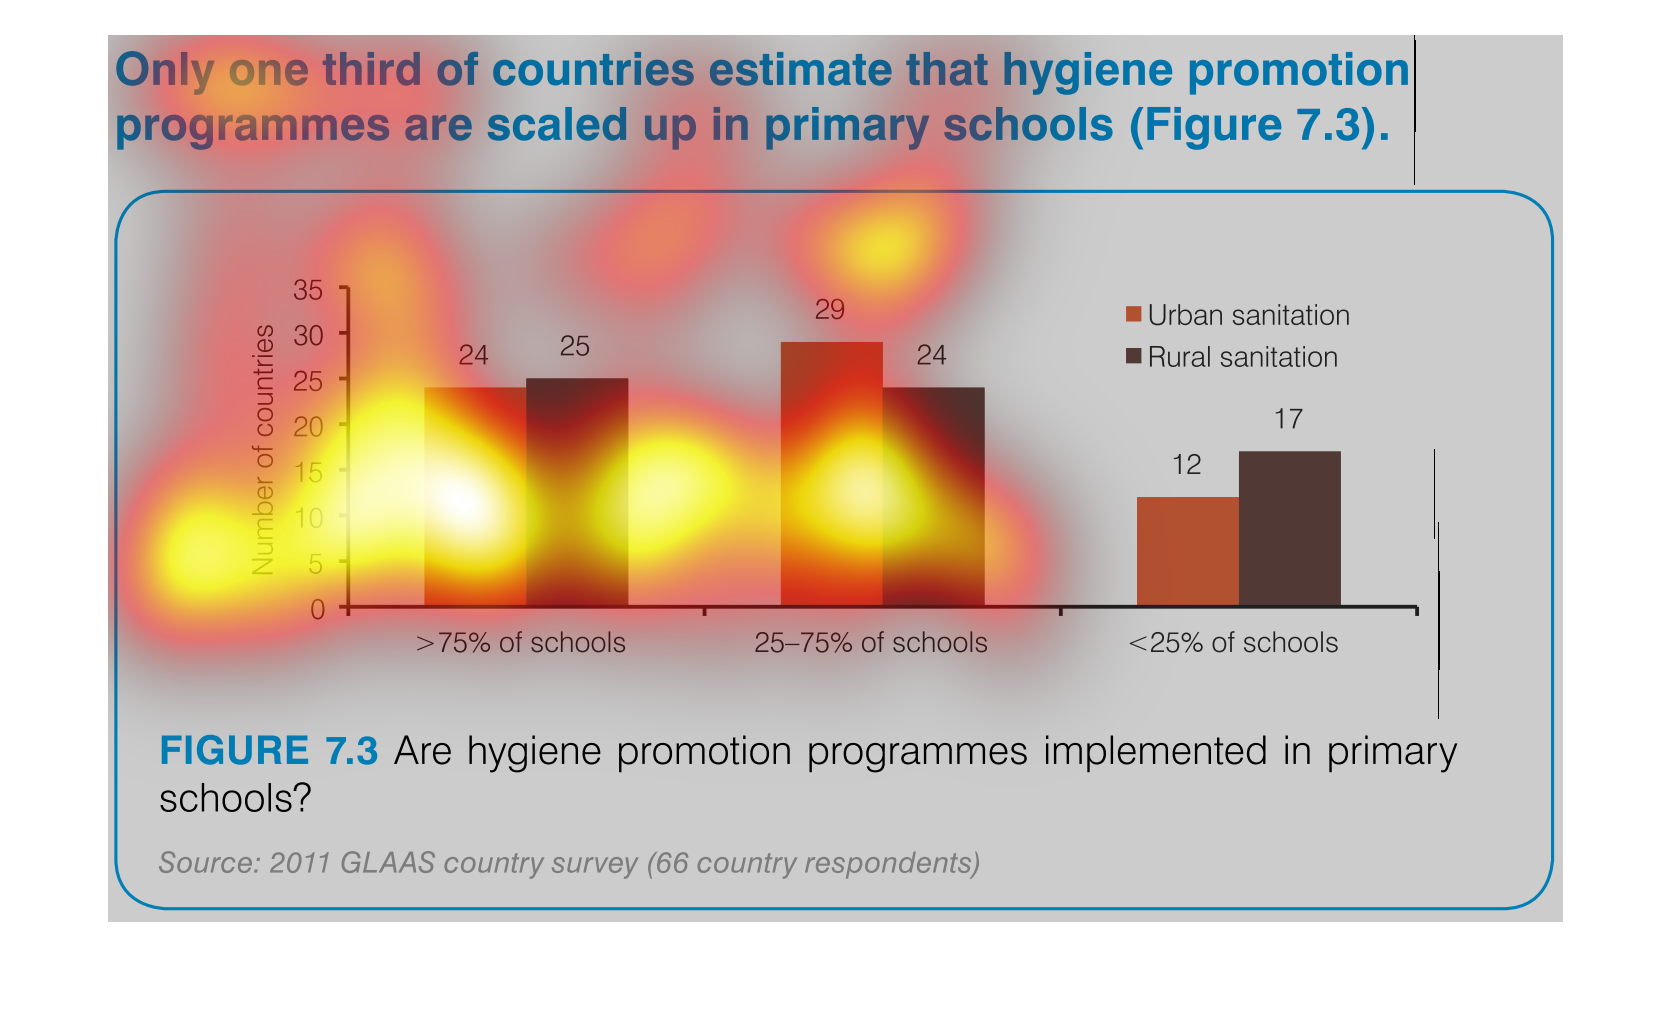
The image depicts a bar graph citing only one third of countries estimating that hygiene promotion
programs are scaled up in primary schools. Stats cite urban sanitation versus rural sanitation,
with somewhat similar and comparable stats for both urban and rural promotion.
This is a series of bar graphs depicting that only one third of countries estimate that hygiene
promotion programmes are scaled up in primary schools.
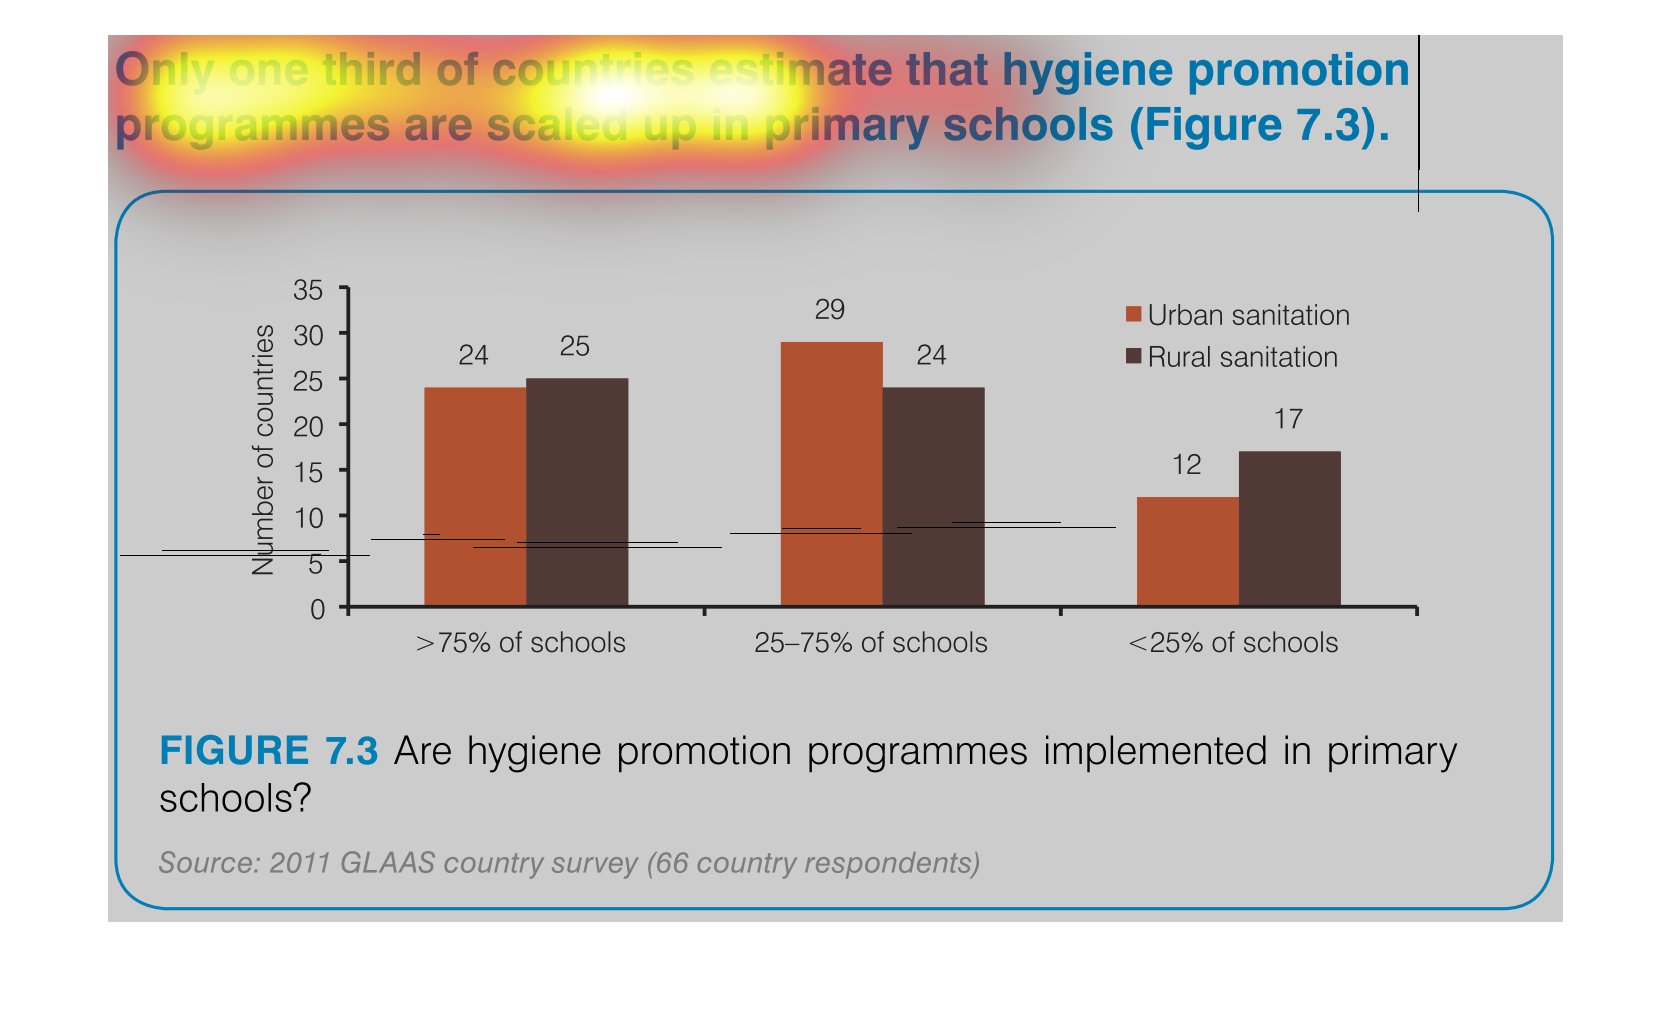
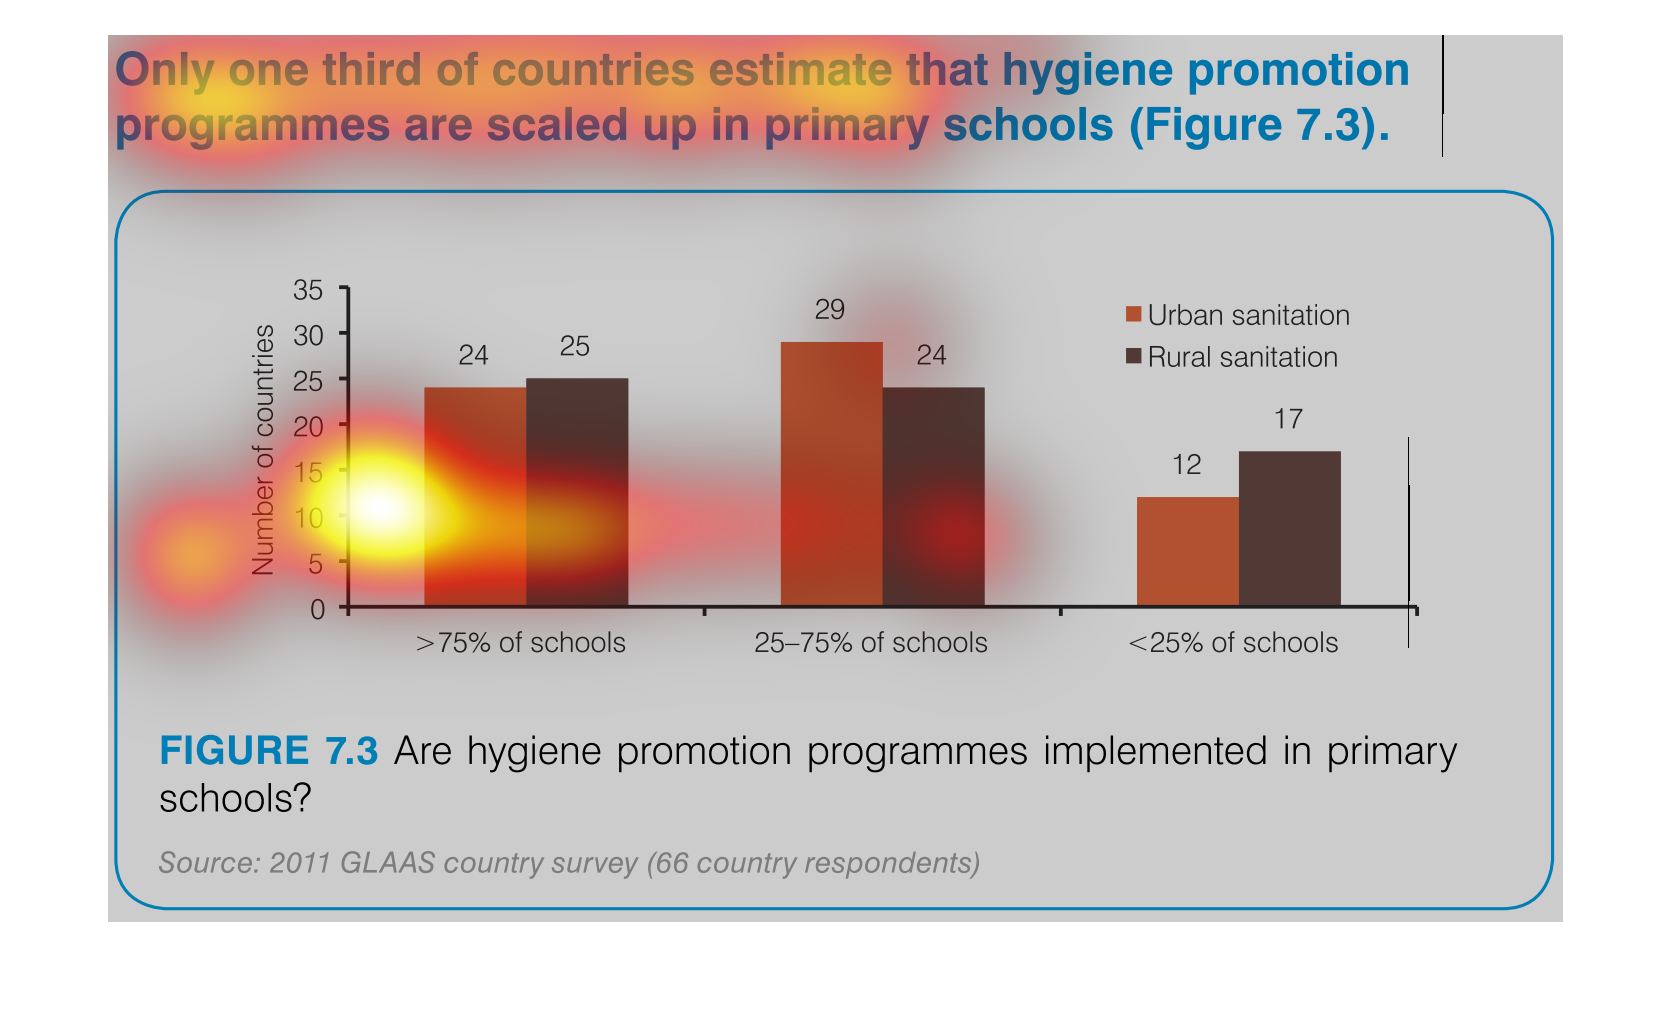
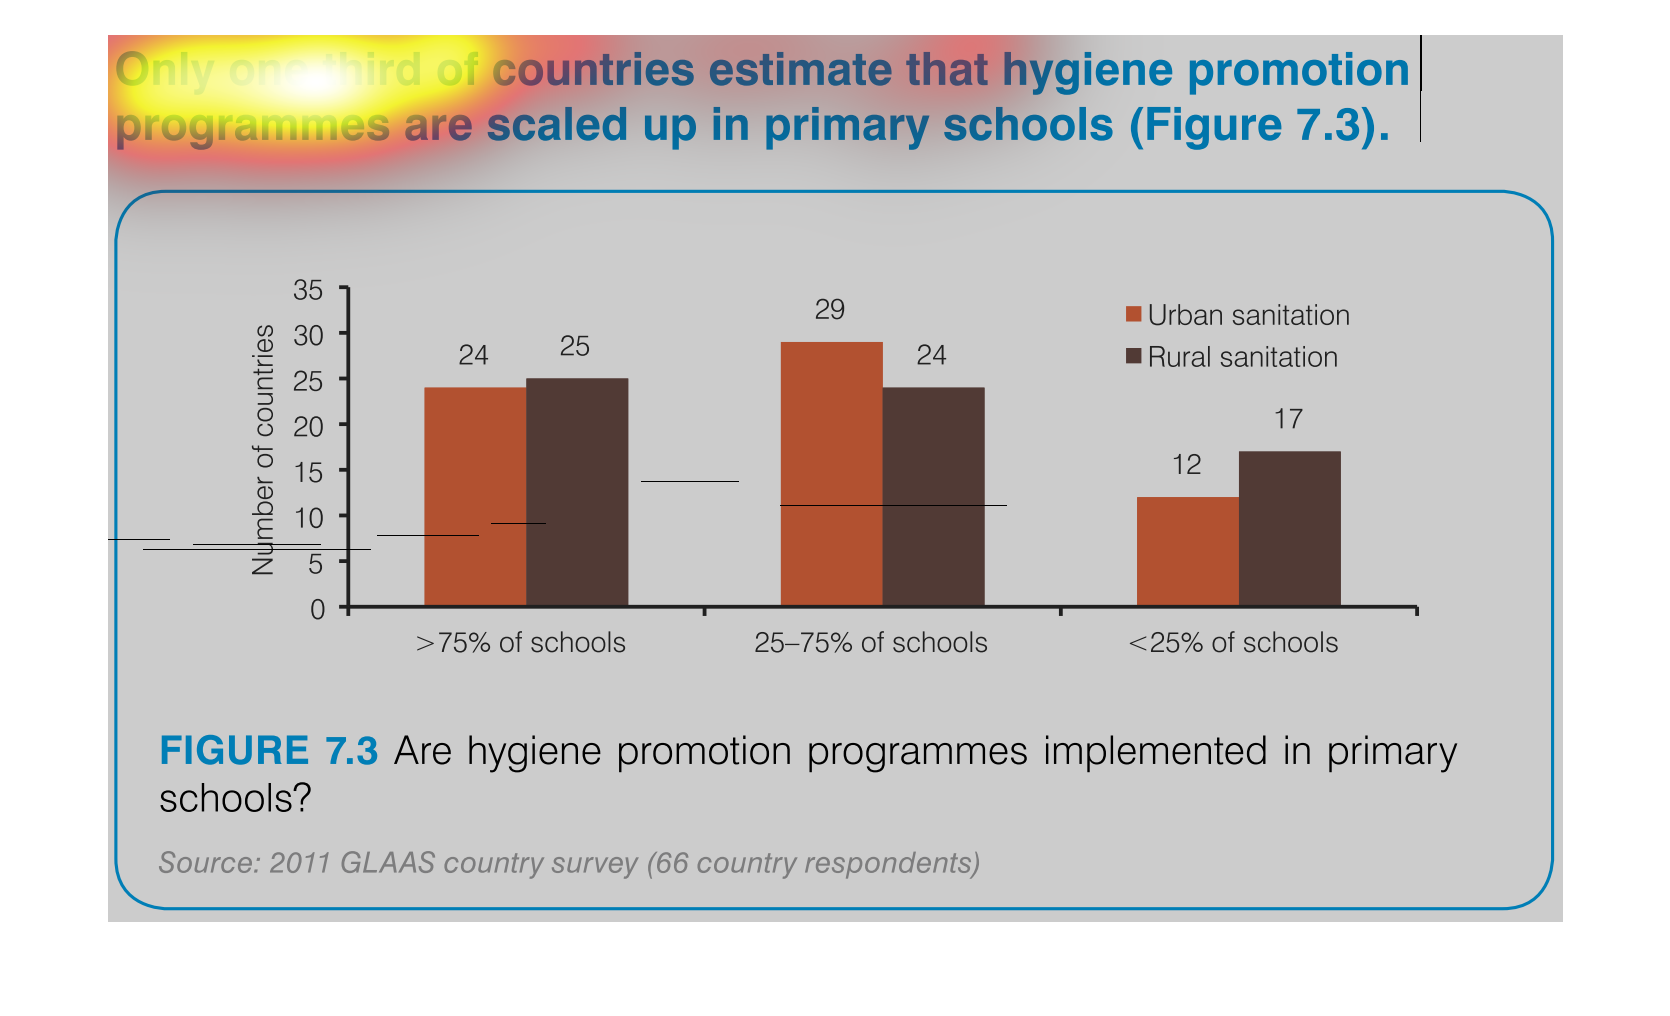
Only 1/3 of countries estimate that hygiene promotion programmes are scaled up in primary
schools (Figure 7.3)  The left scale lists "number of countries." The bars correspond with
the percentage.
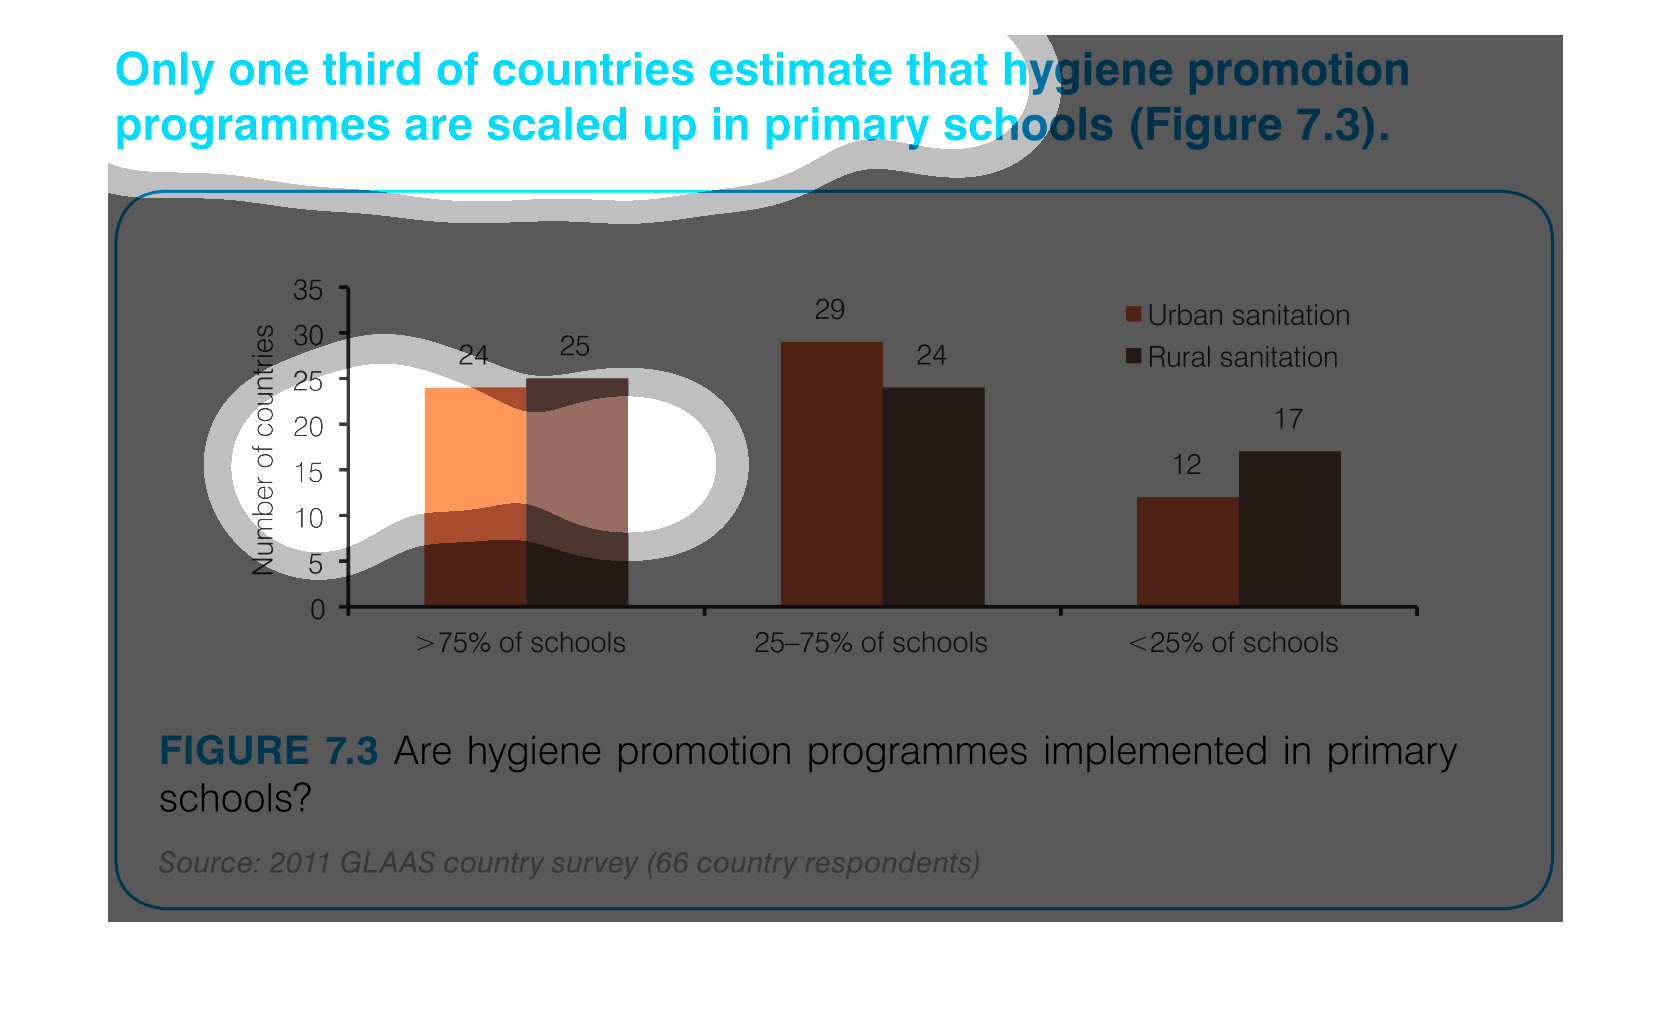
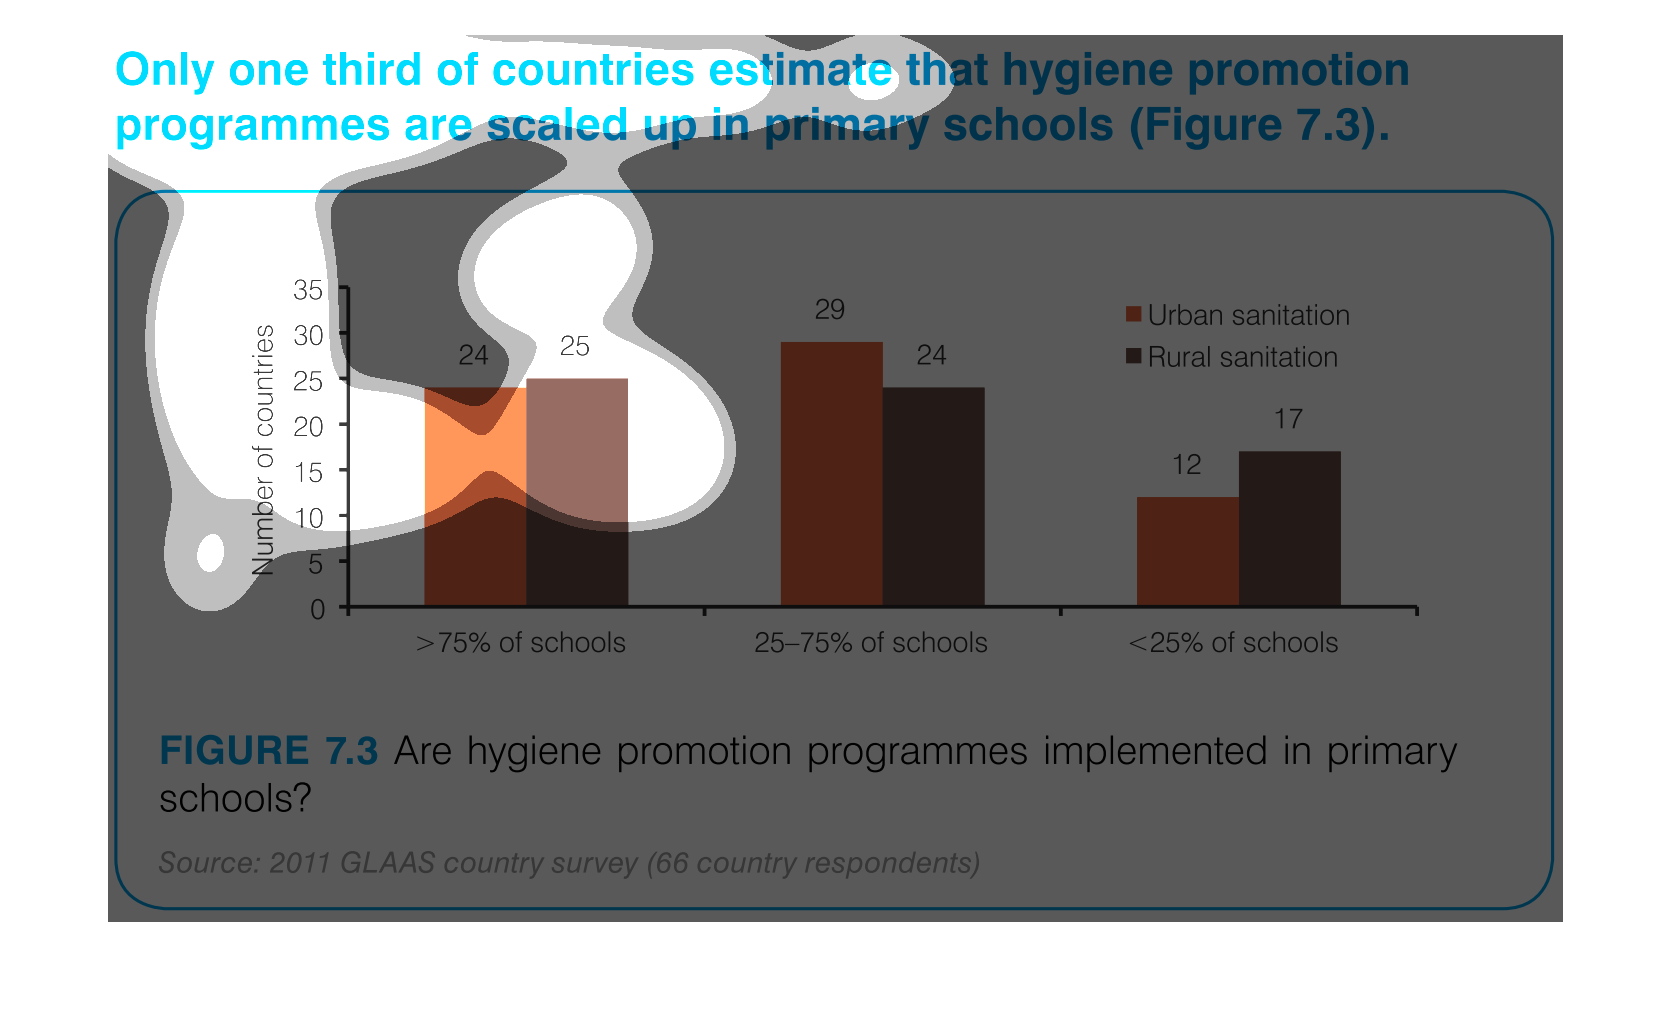
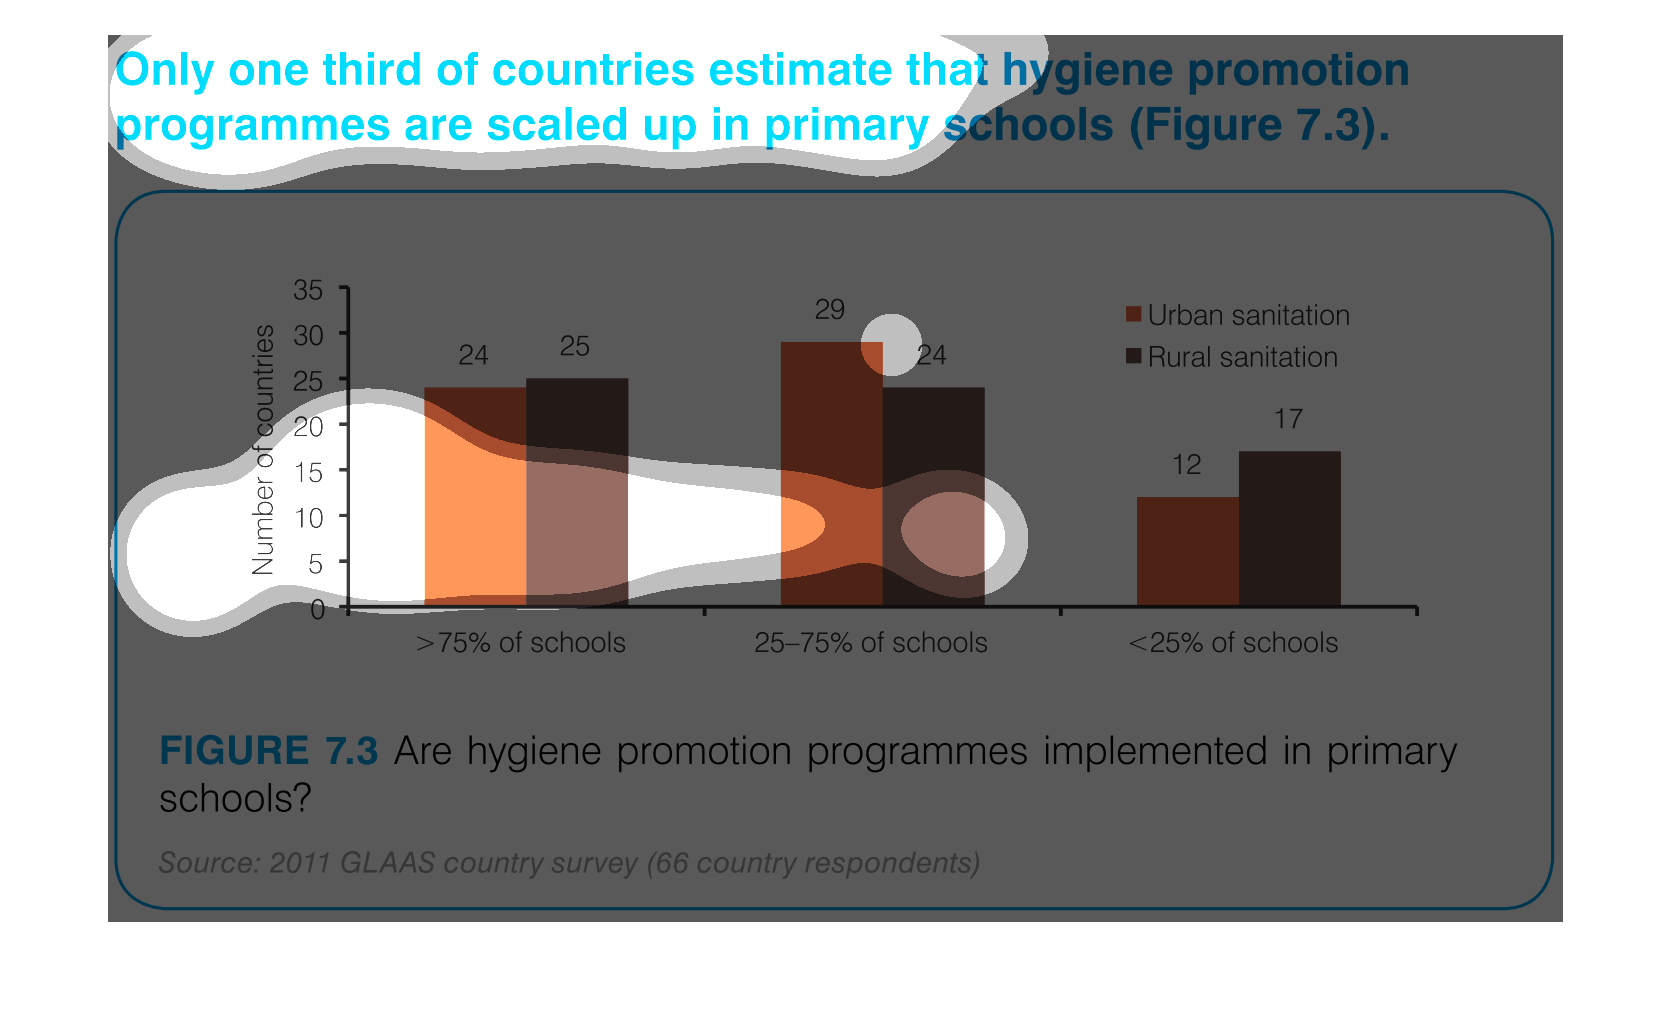
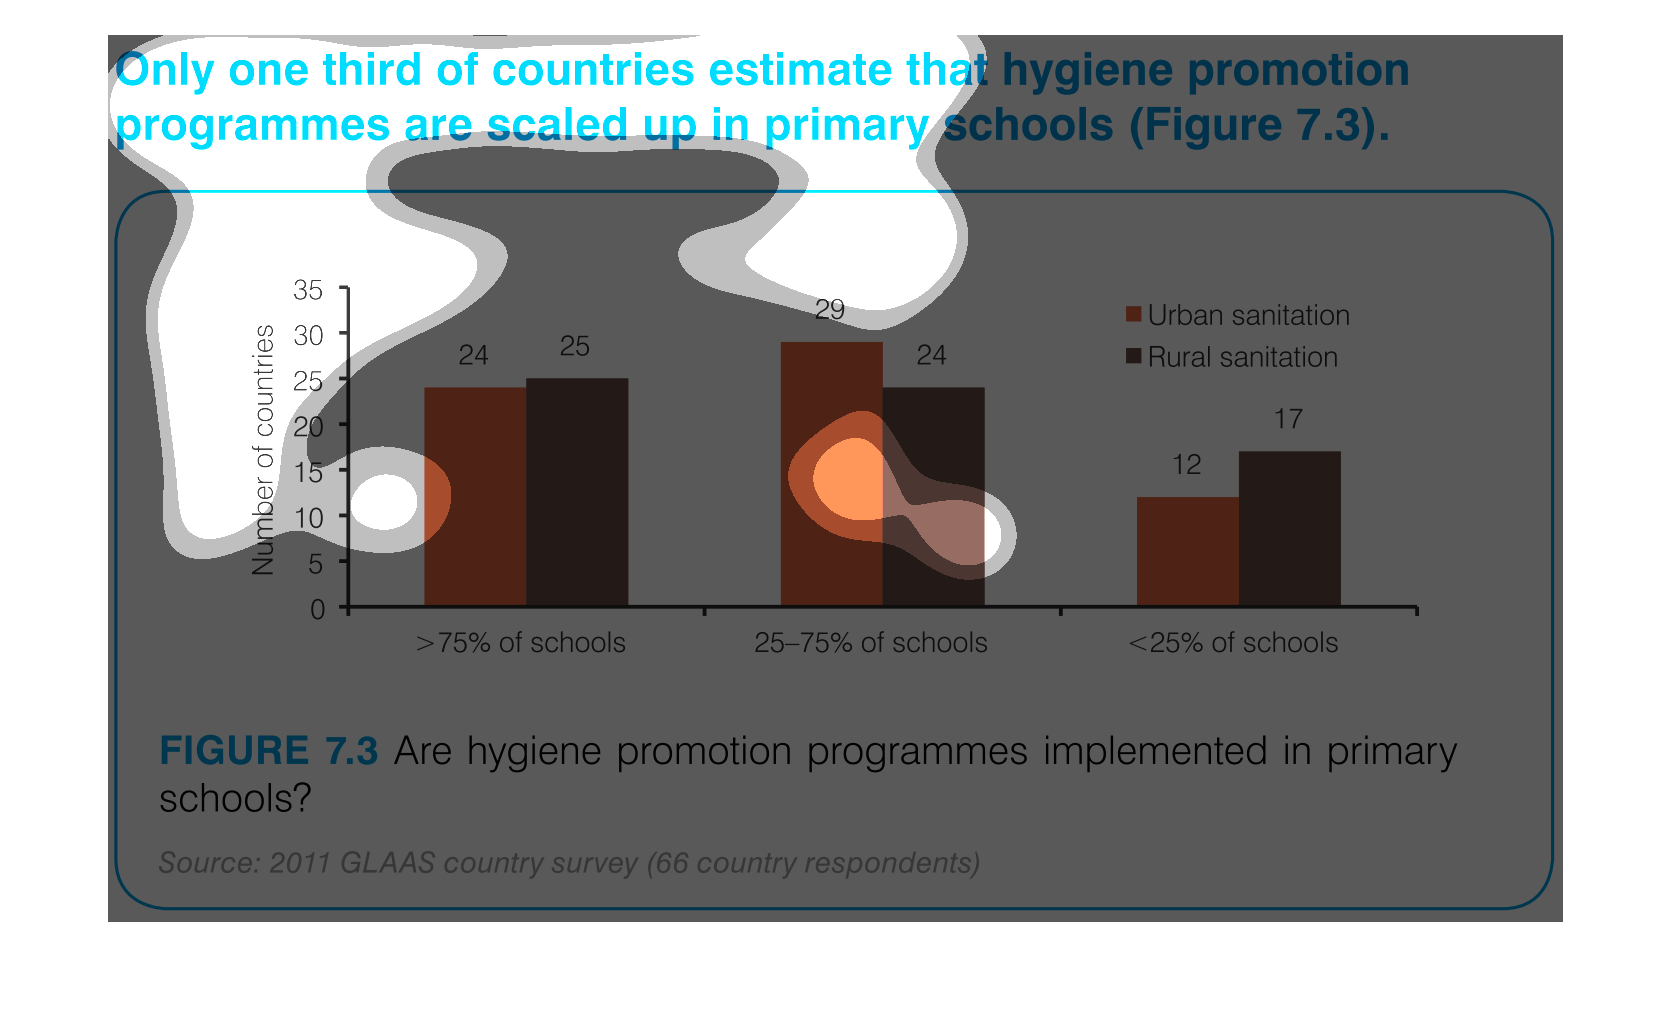
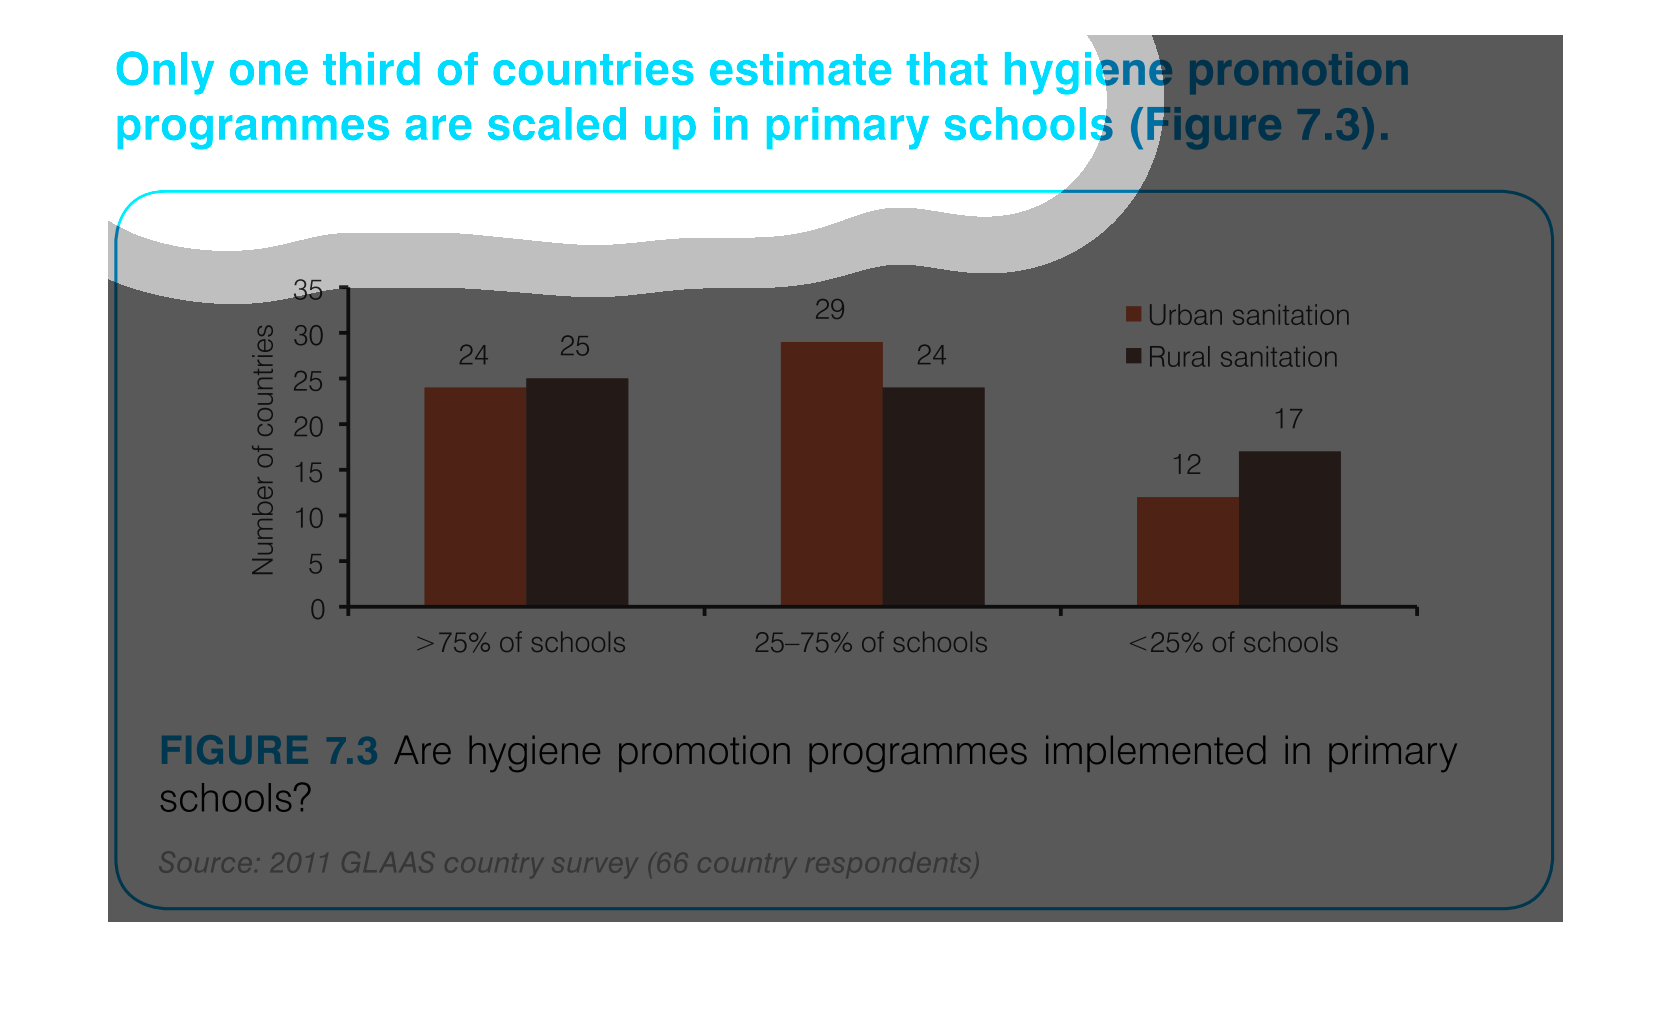
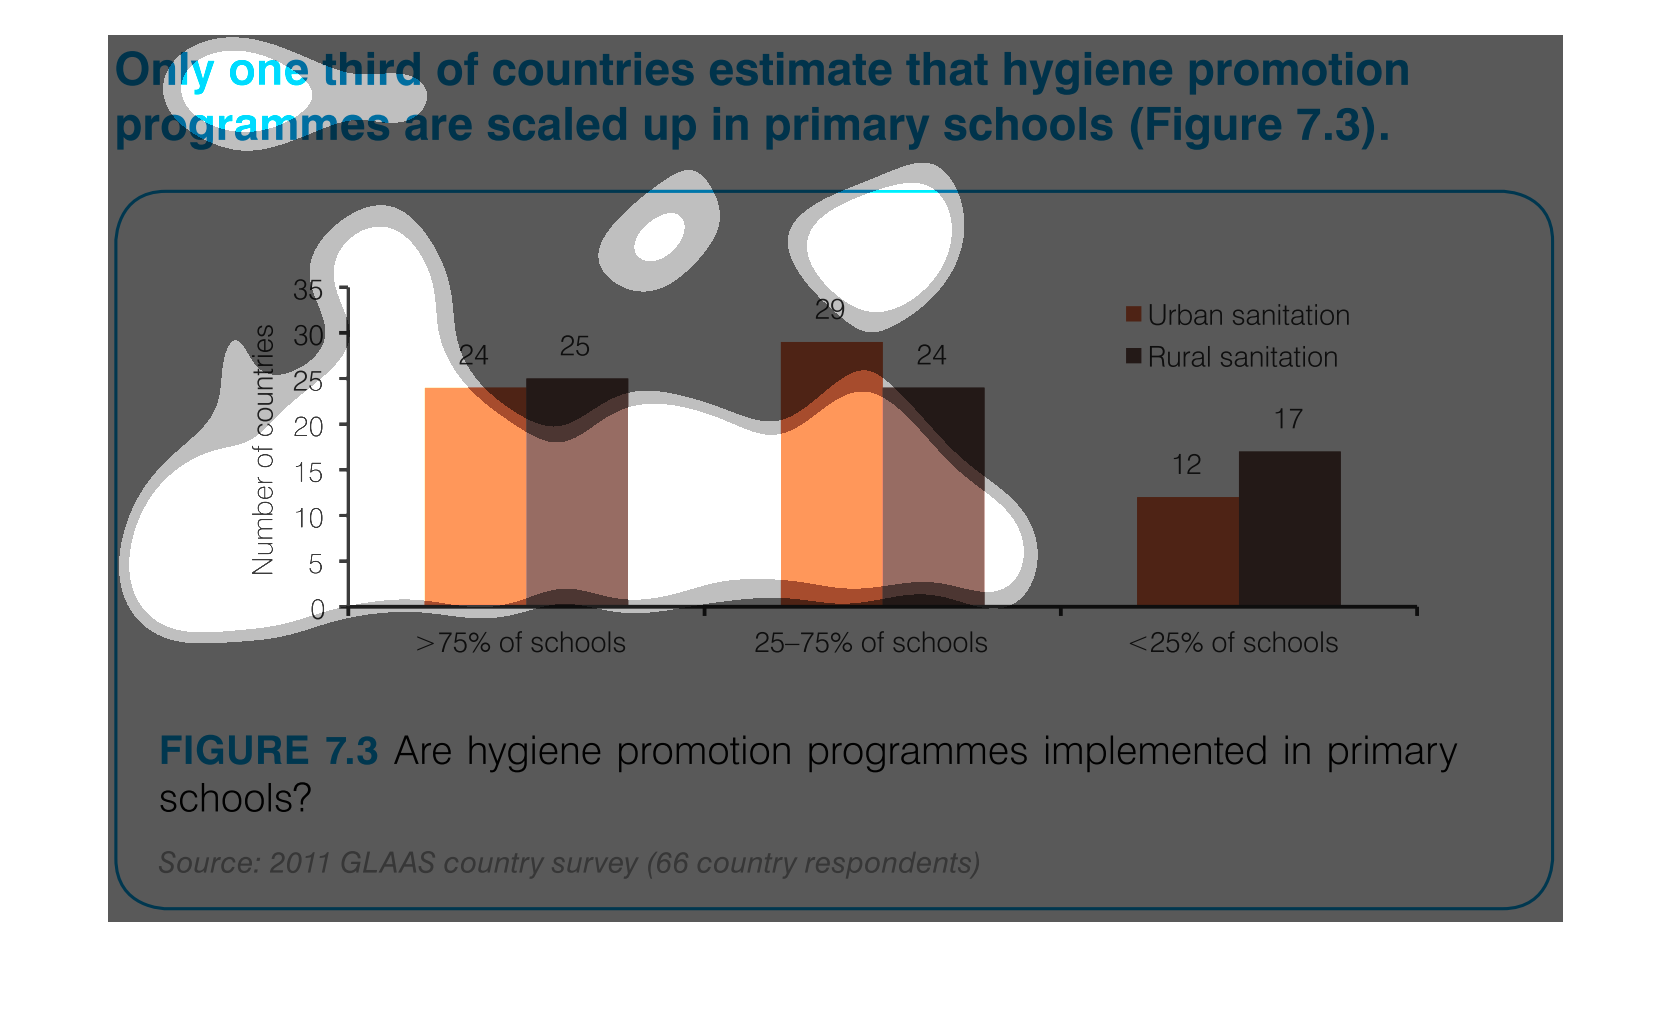
This is a chart that shows the amount of countries that have programs in primary schools that
emphasize the importance of proper hygiene and sanitation. Data is broken down by countries
that have >75%, <75%, and <25% implemented, and in rural and urban settings.
This graph depicts that only one third of countries estimate that hygiene promotion programs
are scaled up  in primary schools. It shows country by country