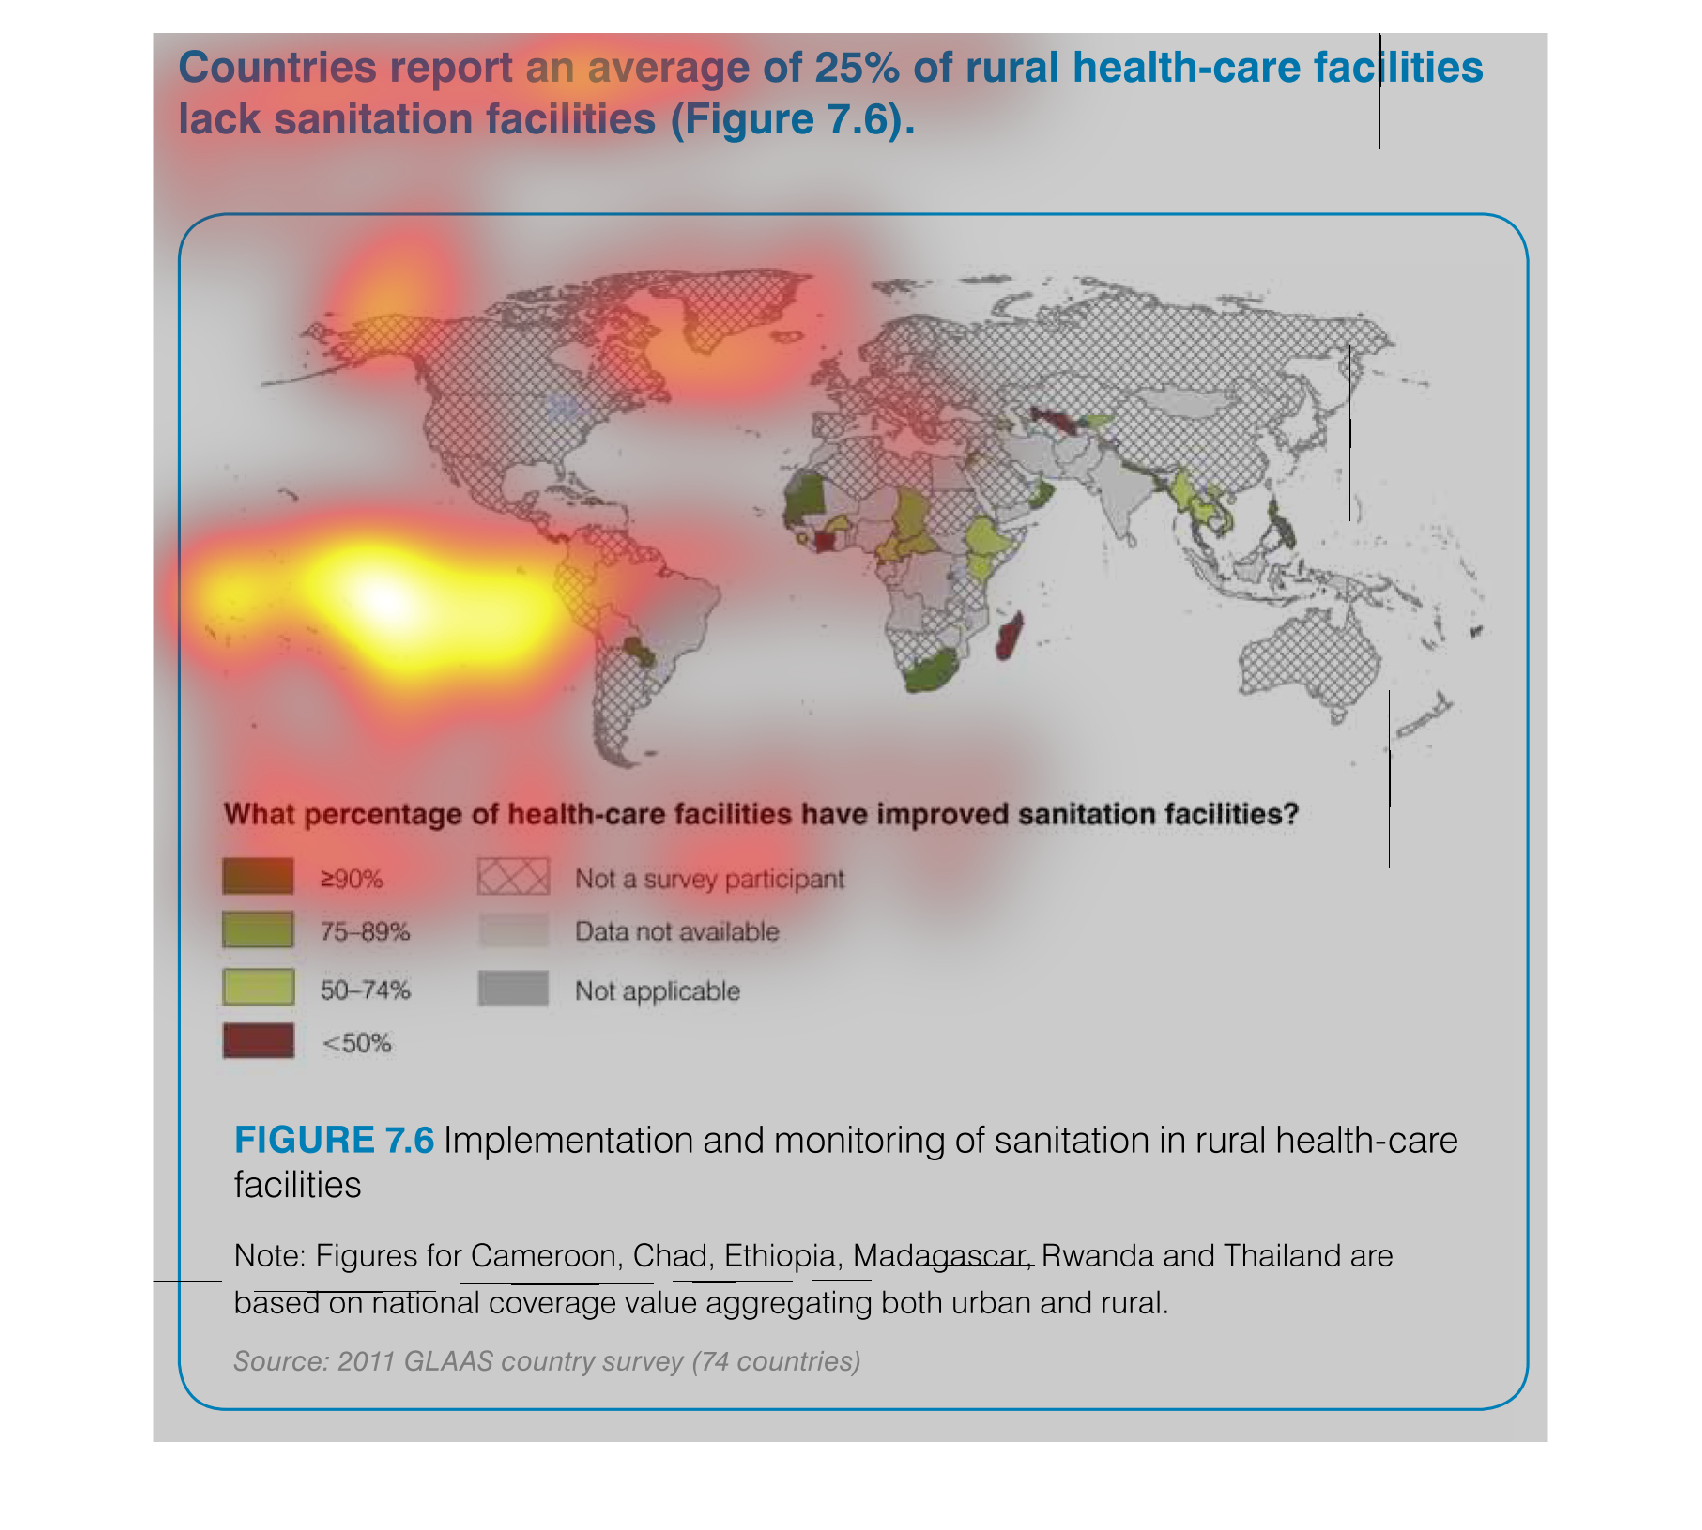
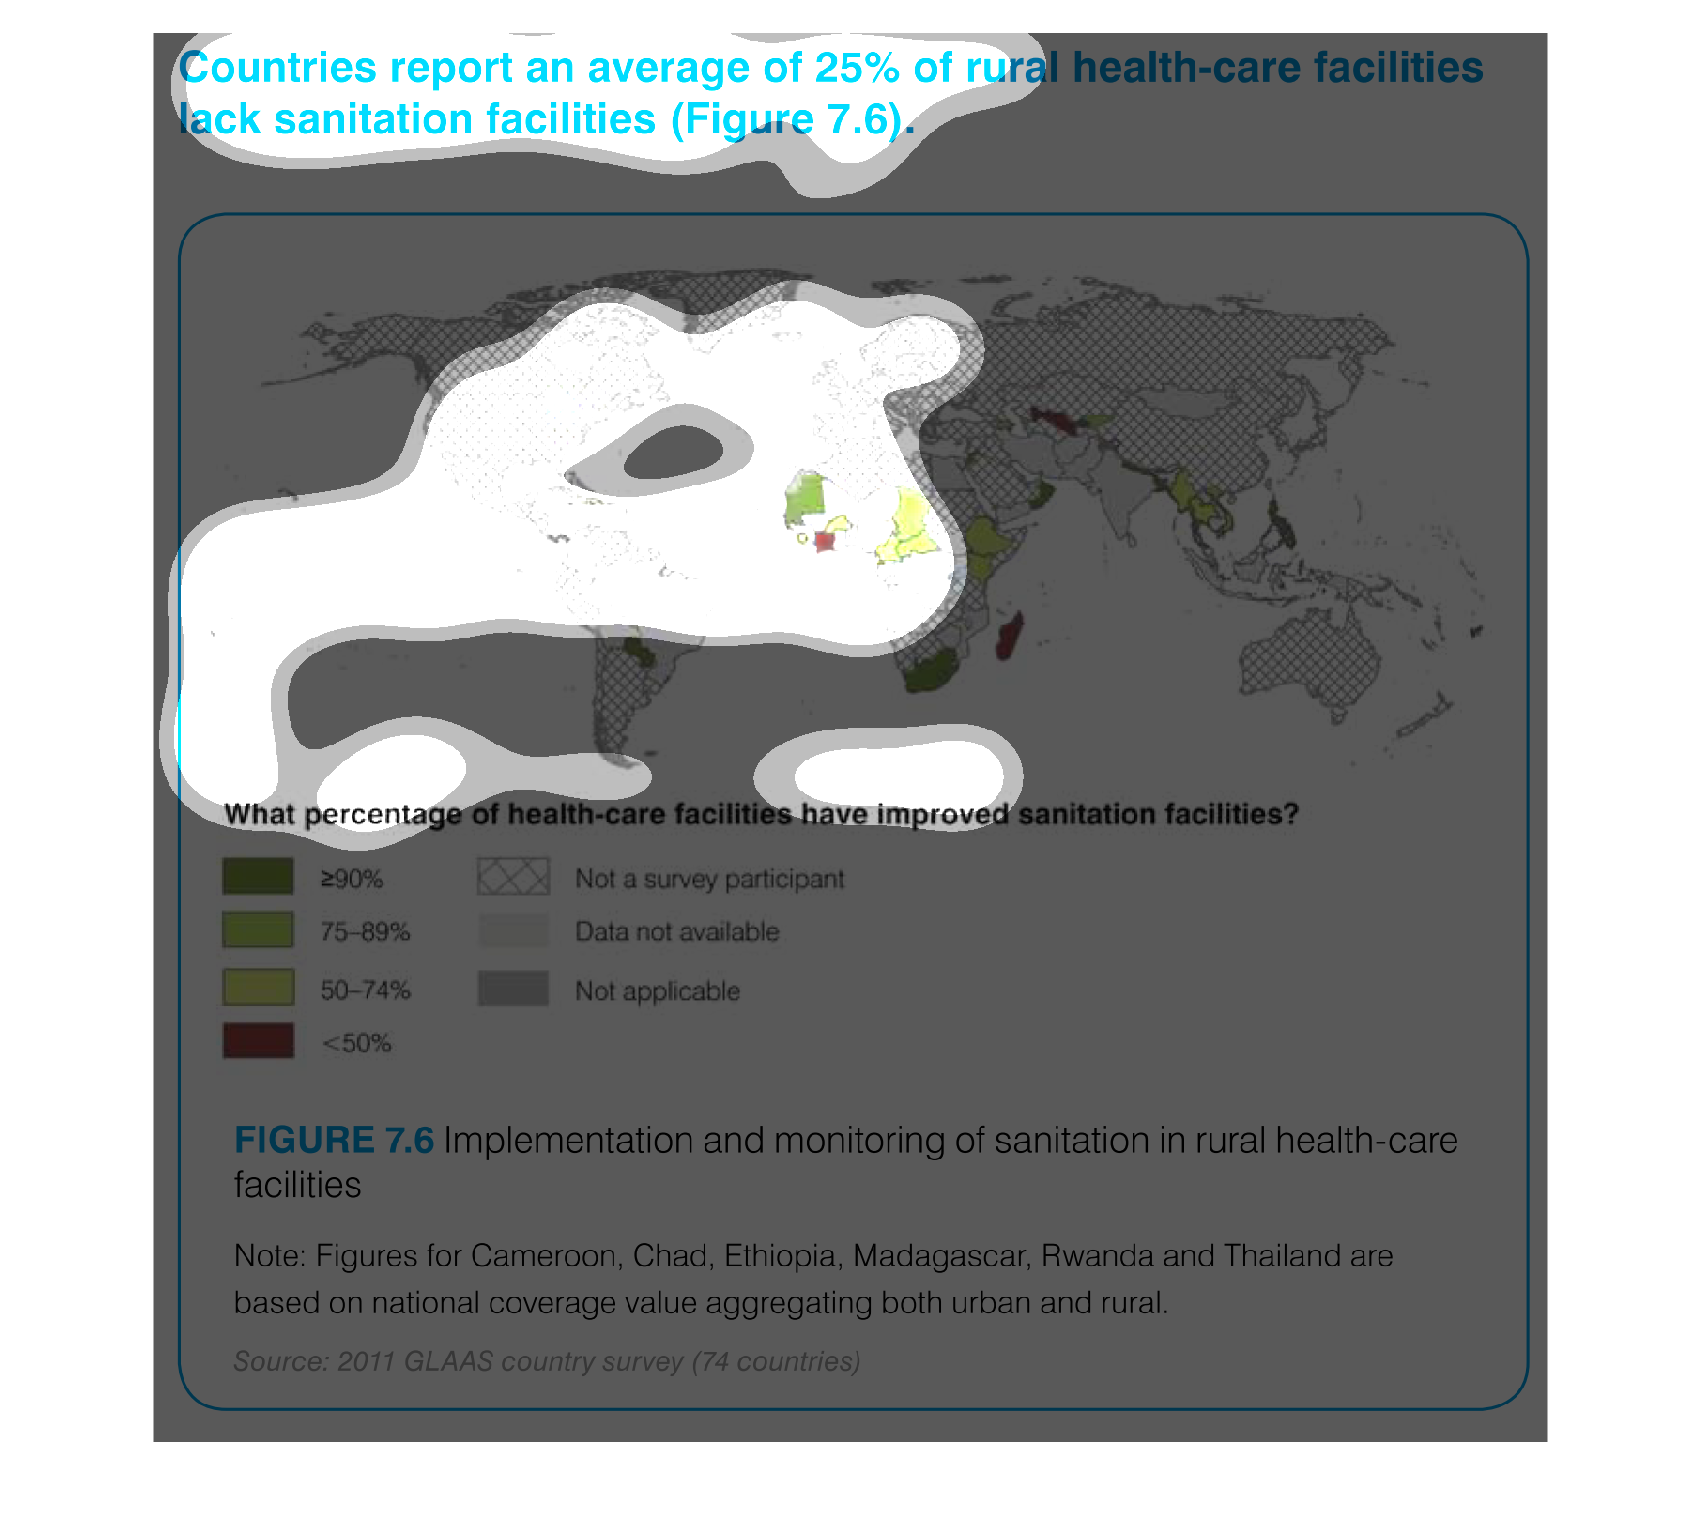
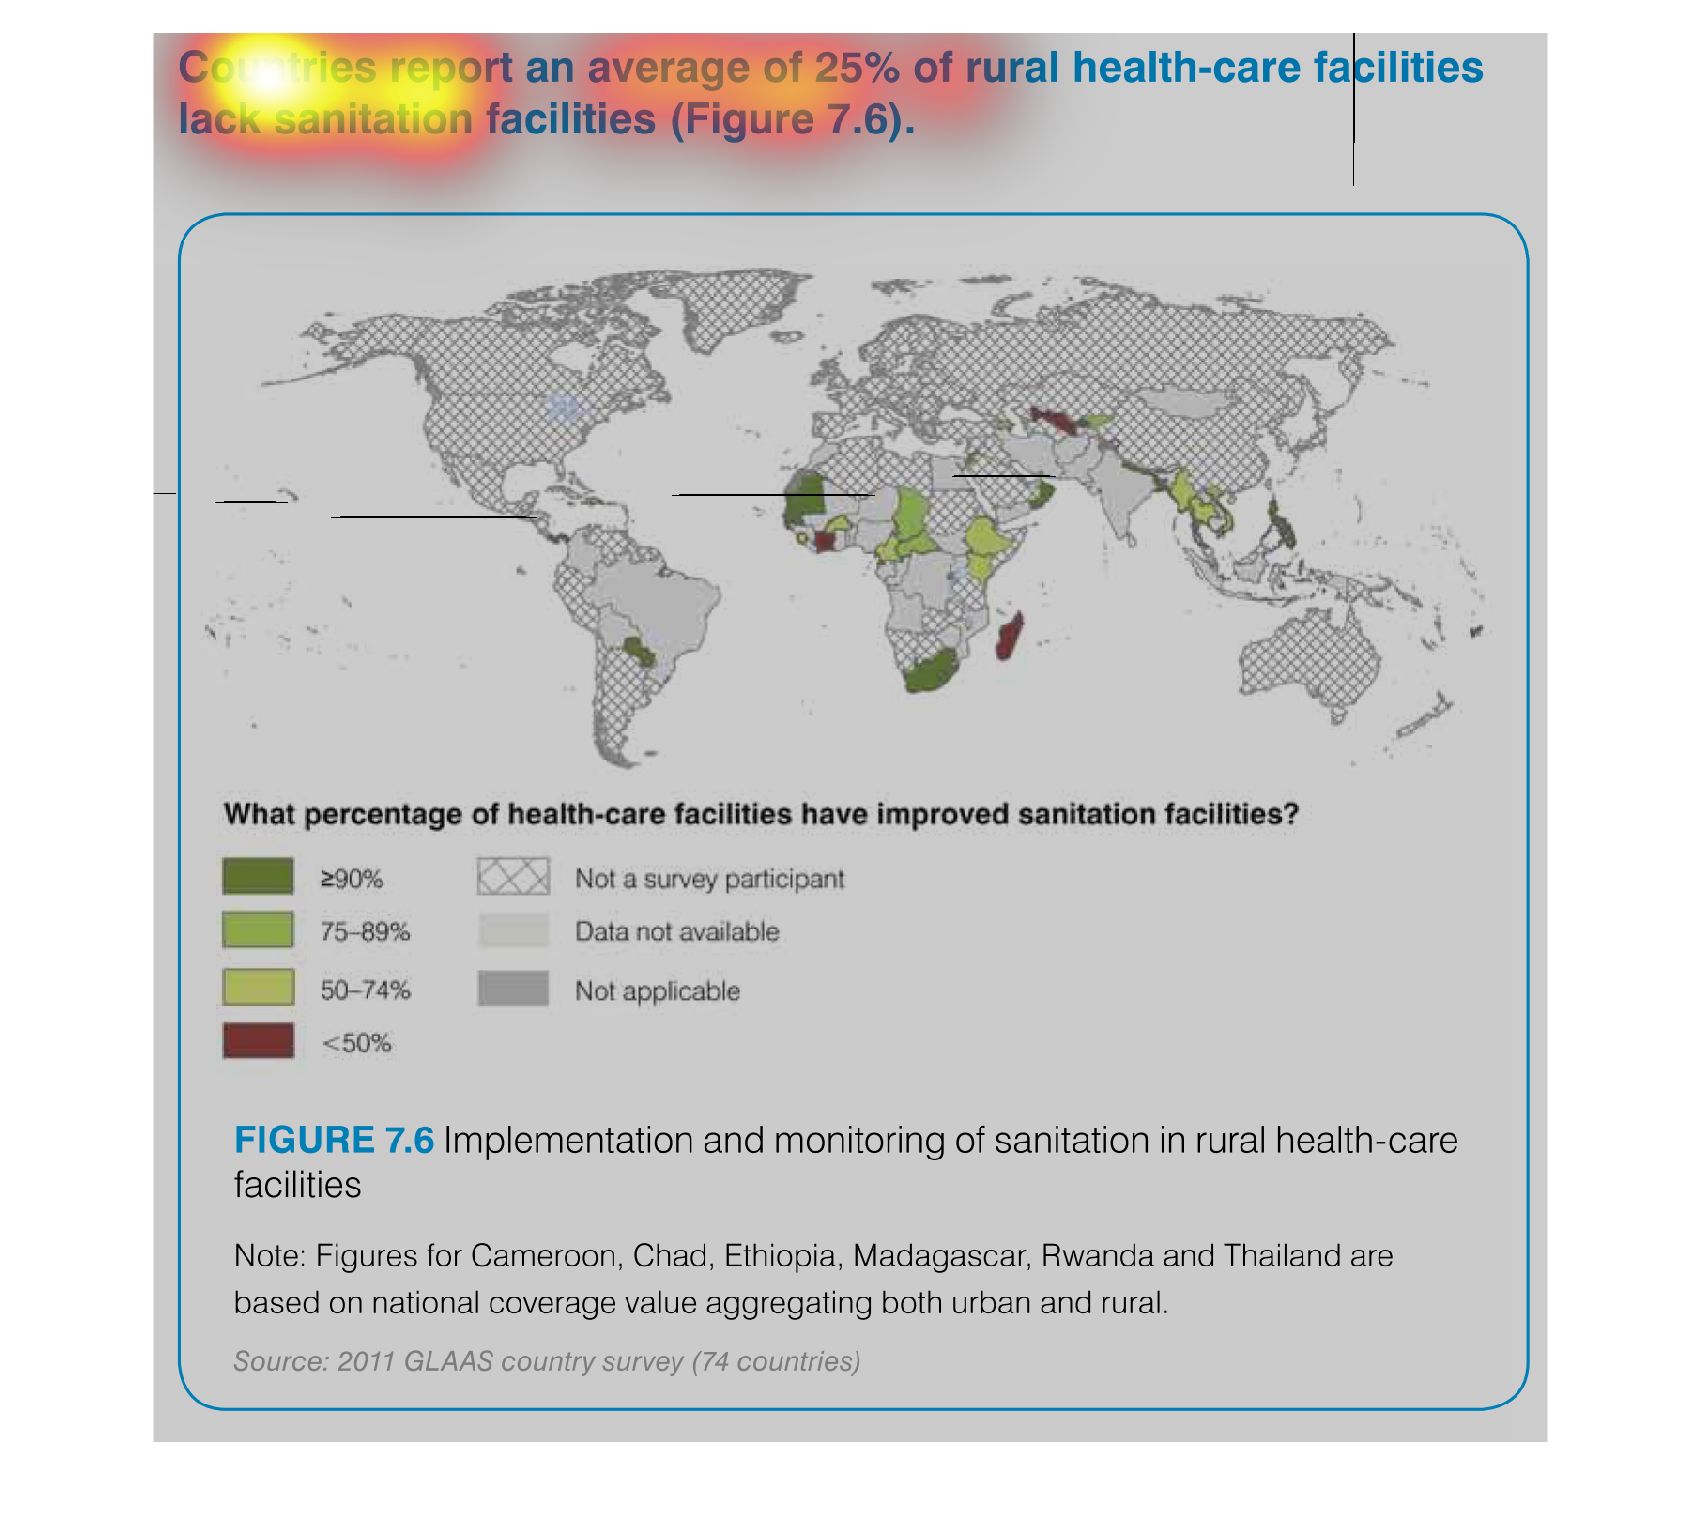
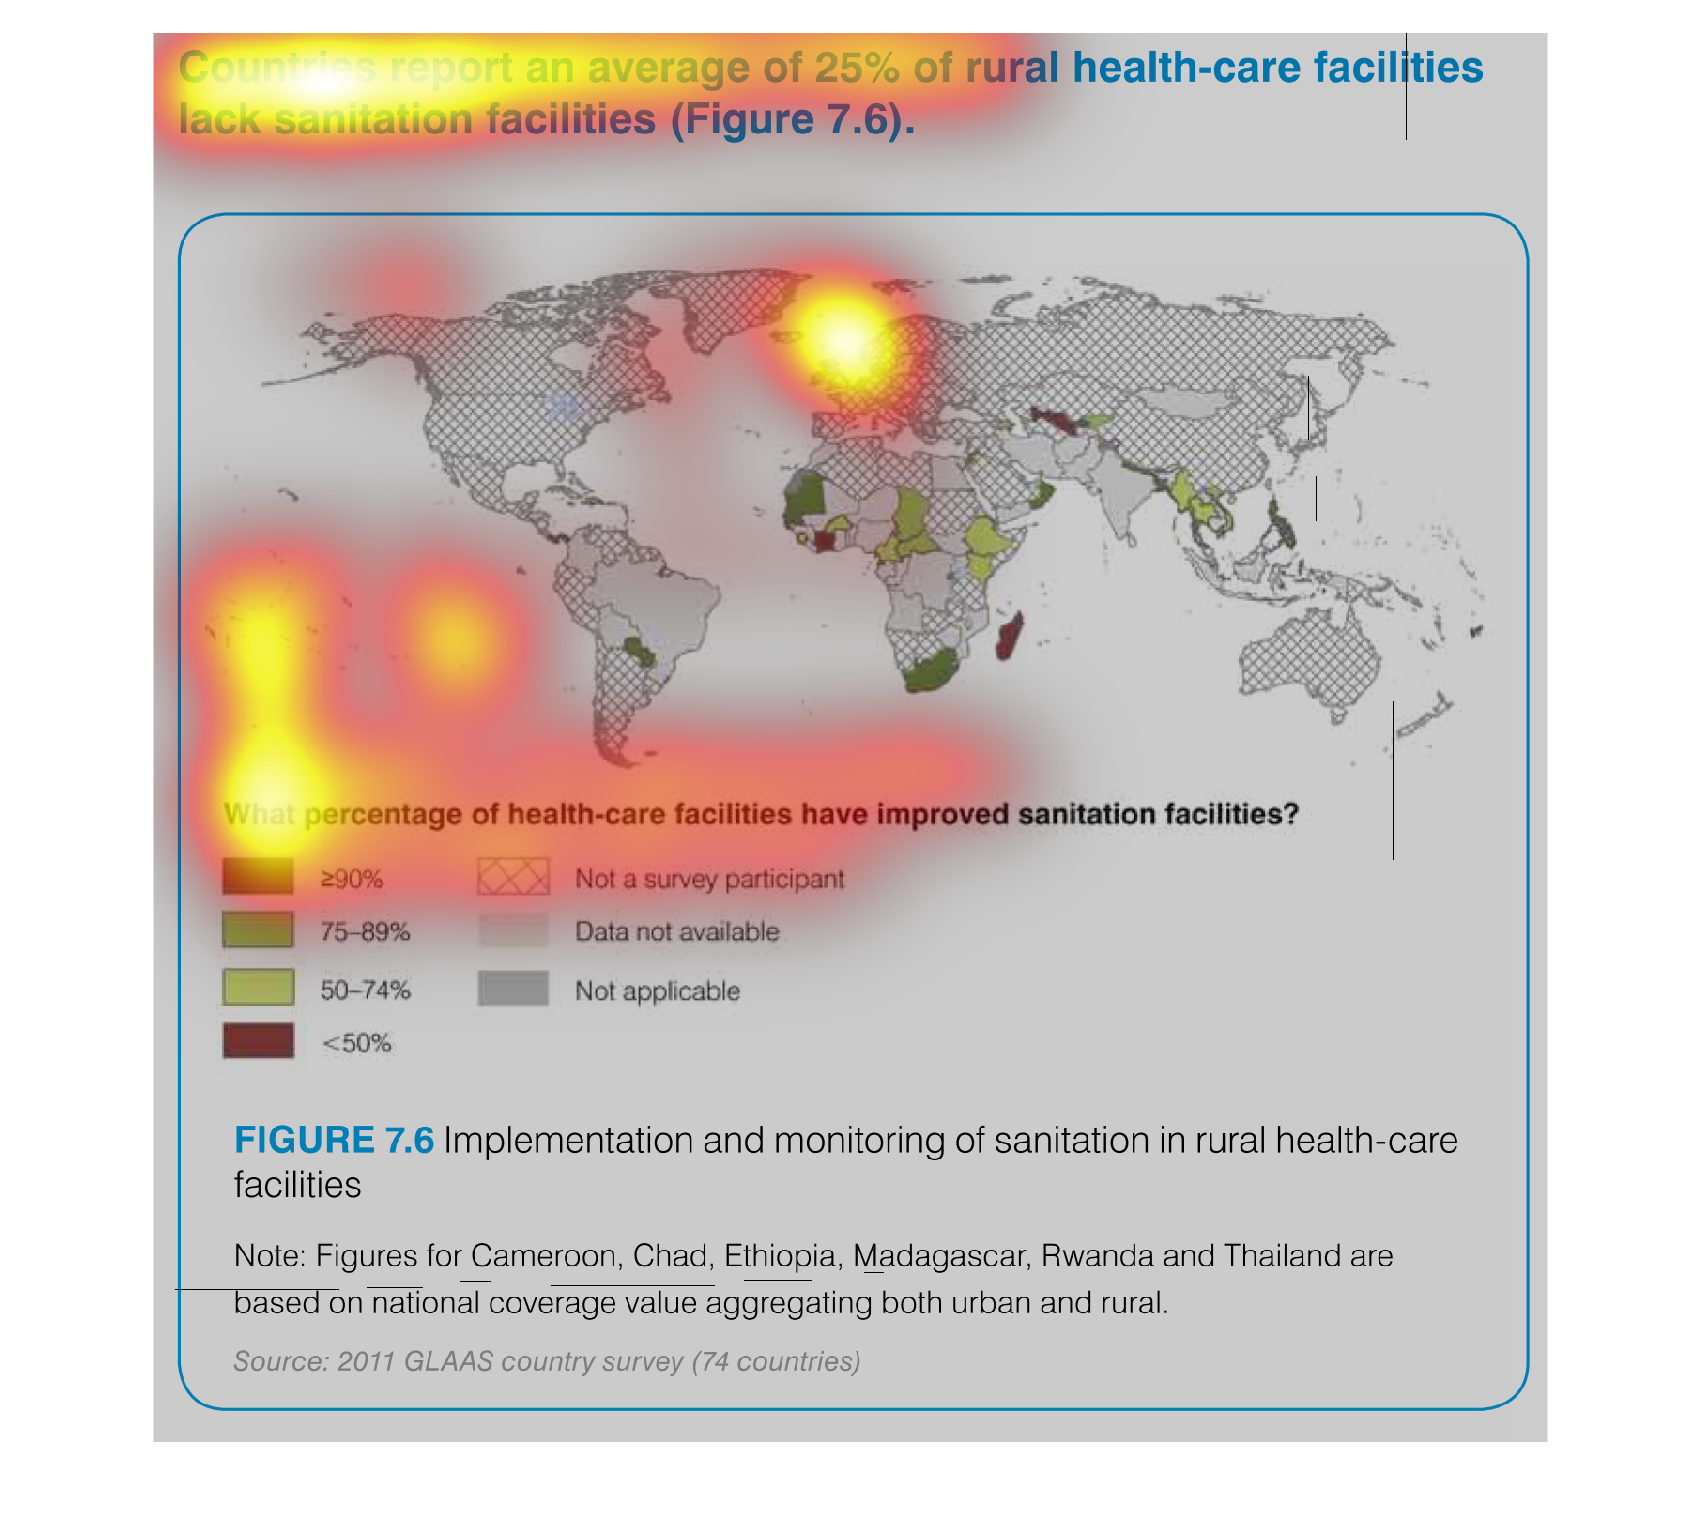
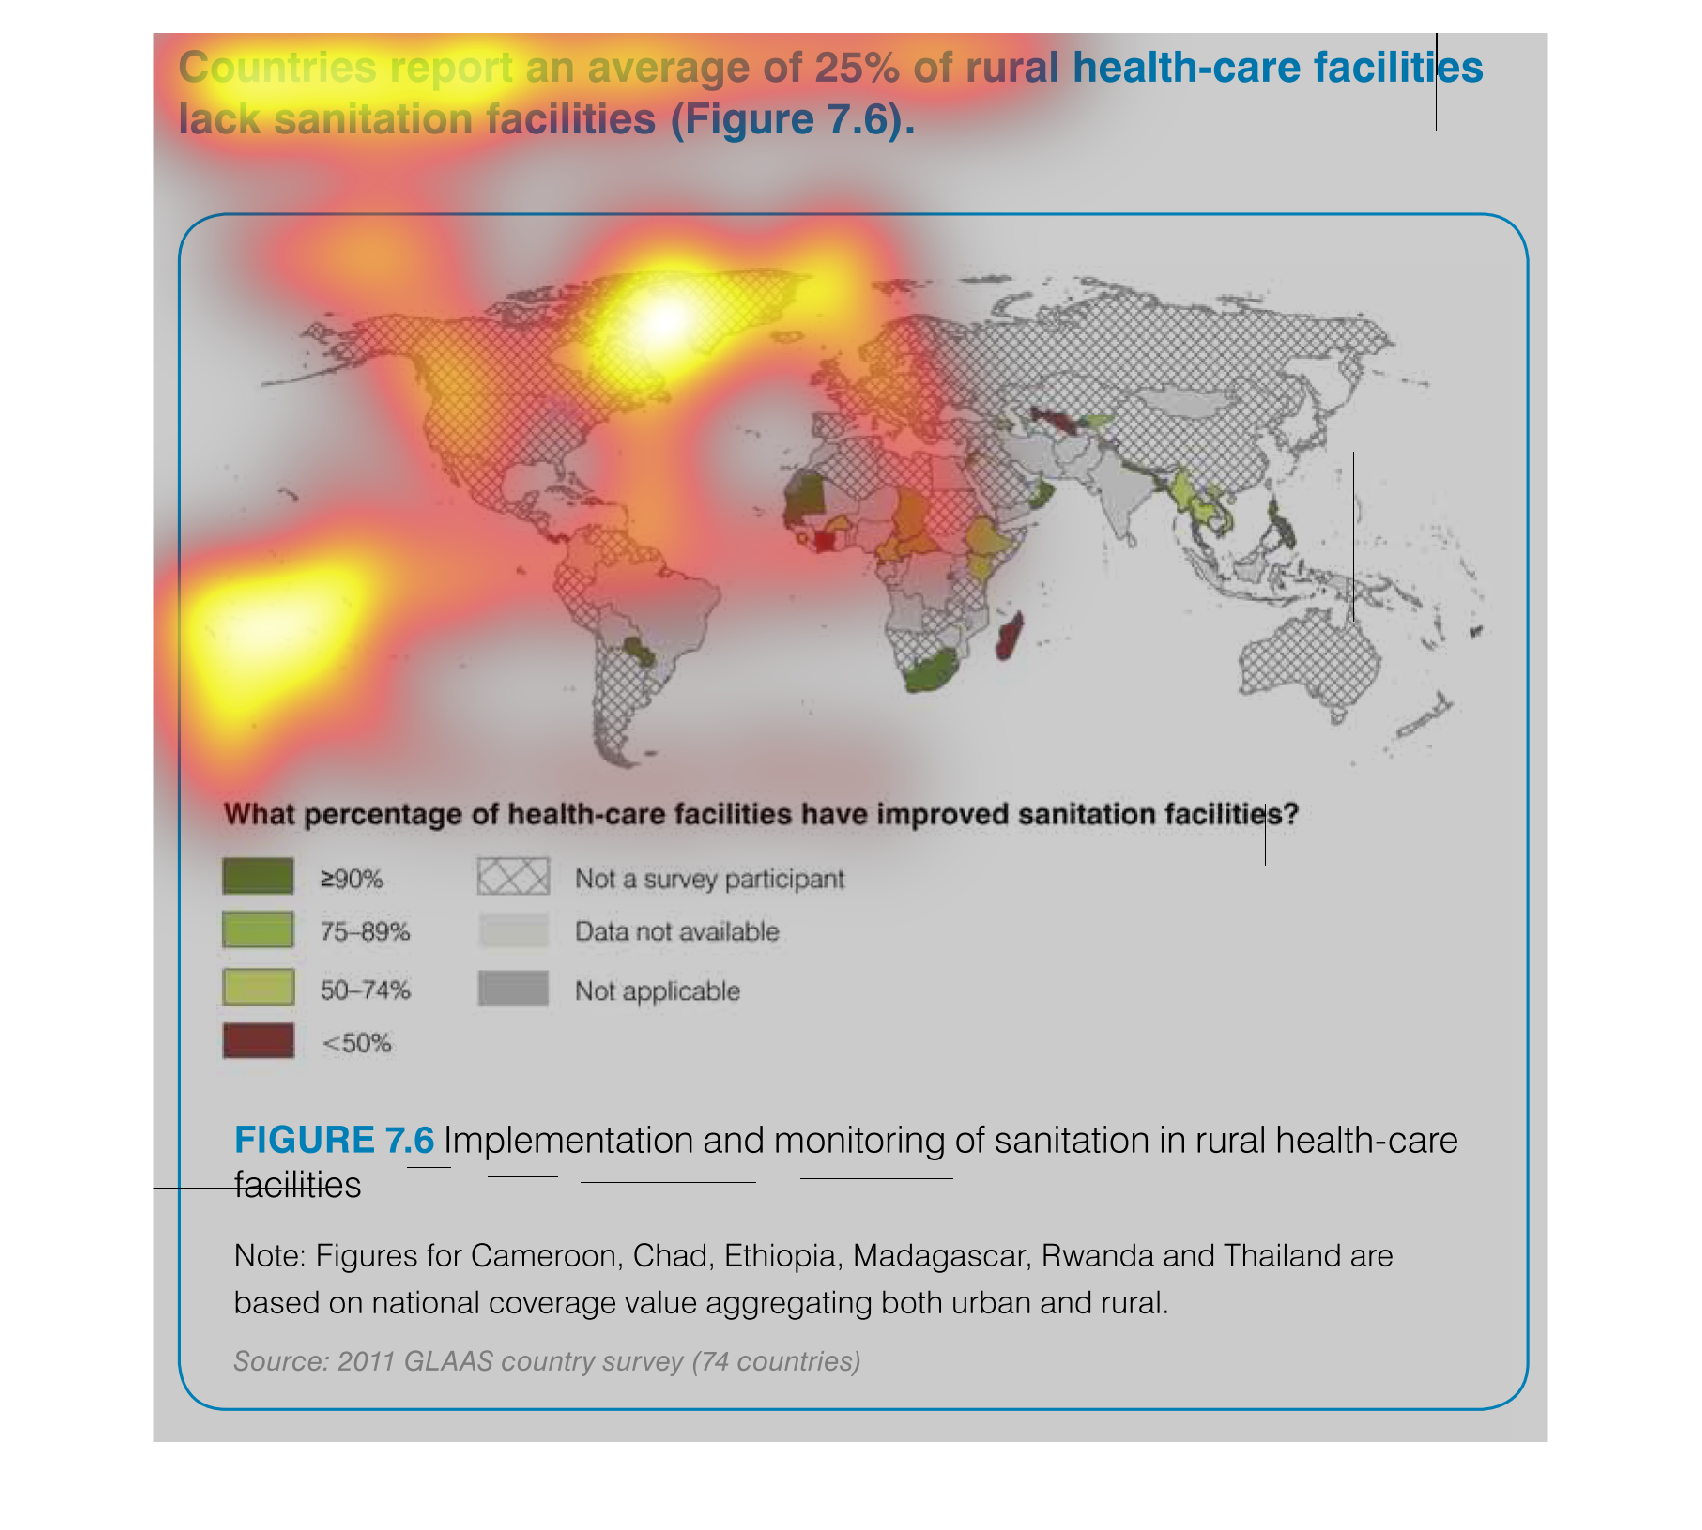
On this chart are countries that report an average of 25% of rural health-care facilities
that lack sanitation facilities. Most countries are reporting out of Africa and Asia.
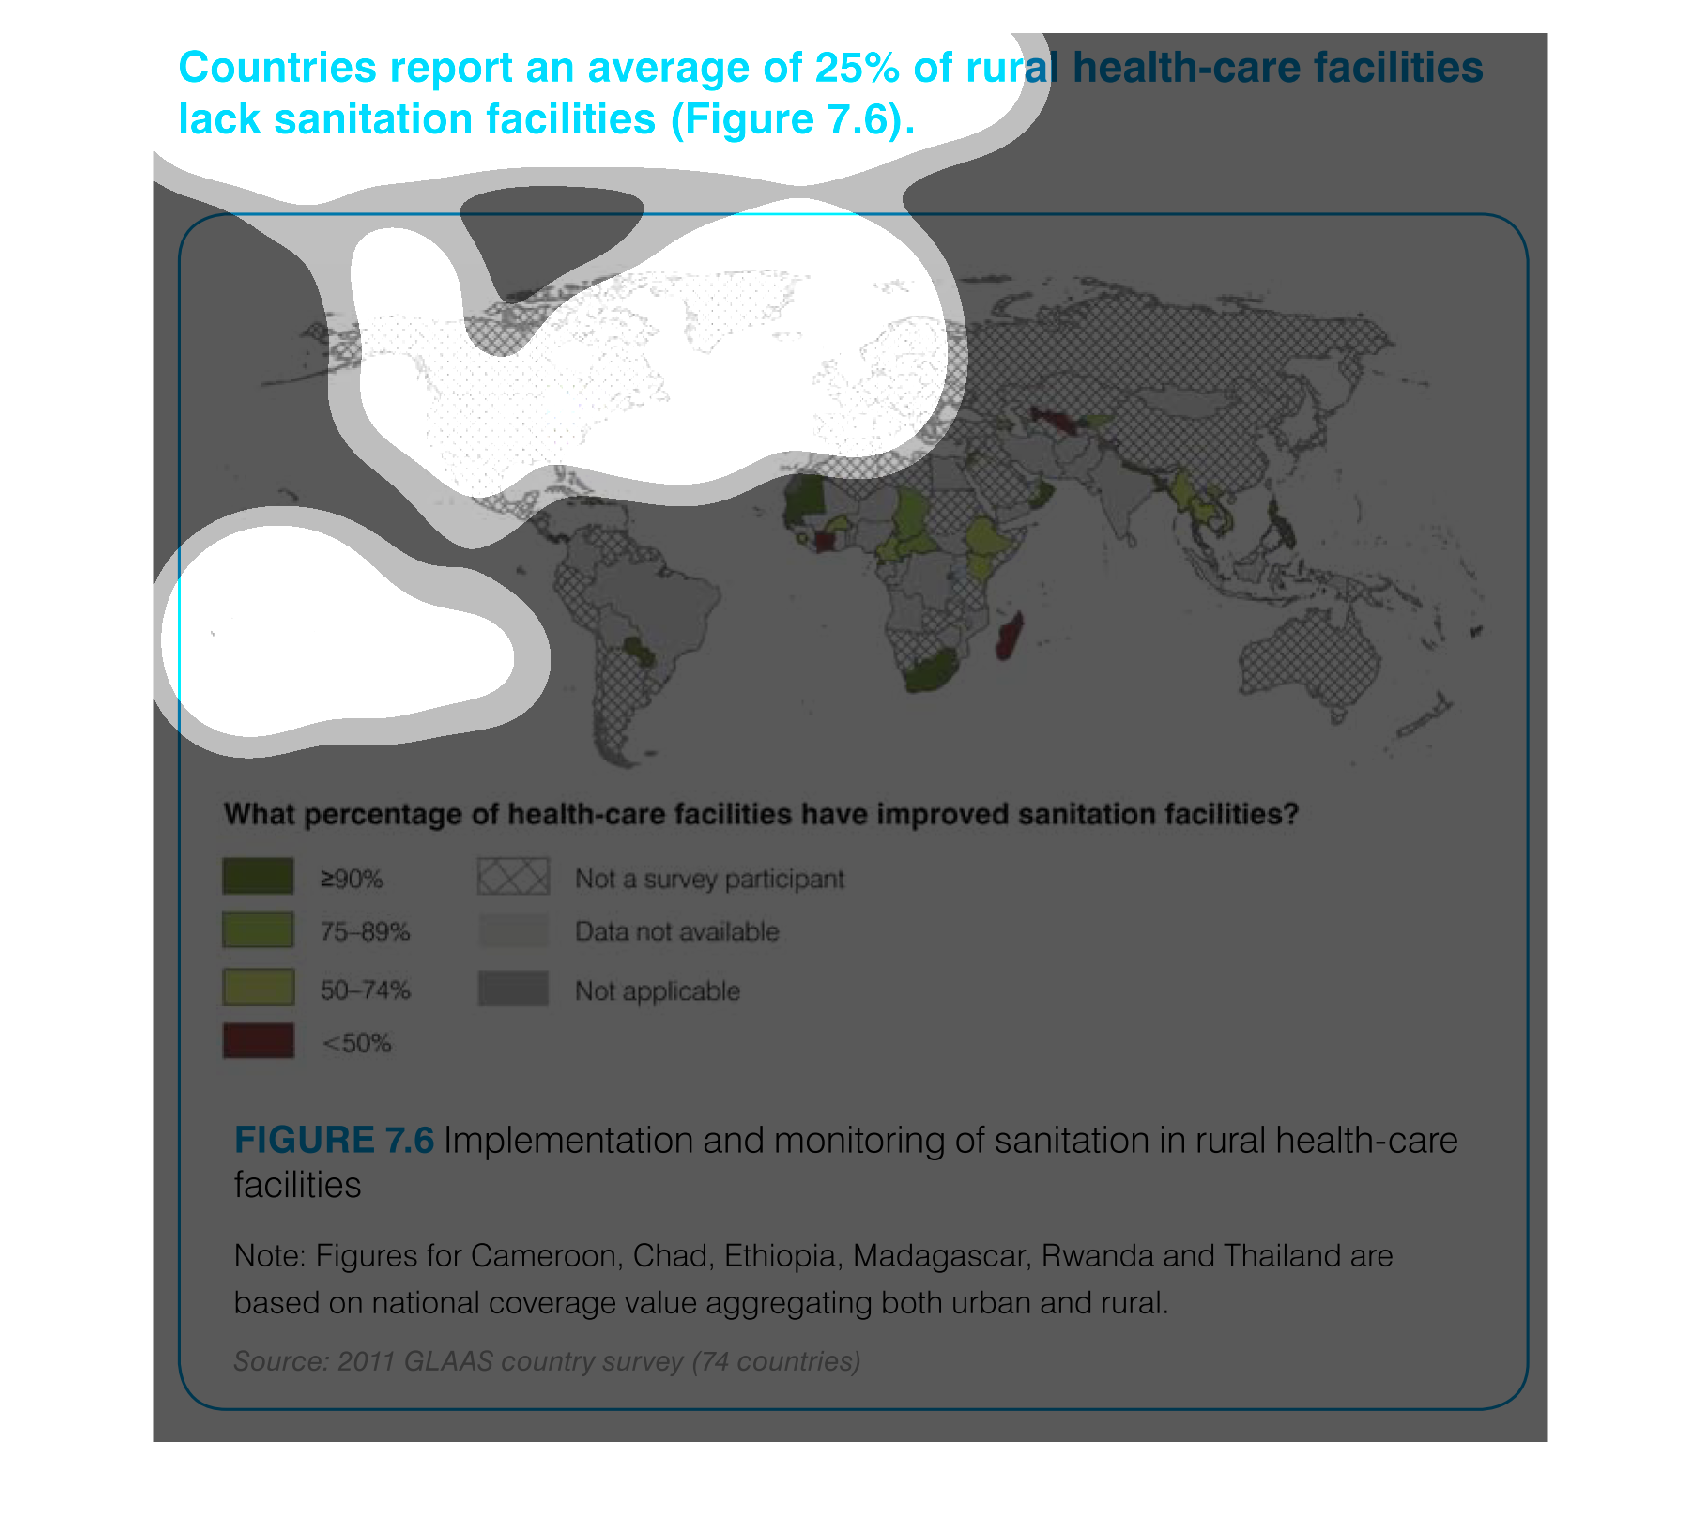
This graph illustrates- mostly in the African and Asian territories-  how basic sanitation
needs are not been met, and because of it many people in the region are suffering,
The figure presented is titled Countries report an average percent of 25% of rural health-care
facilities lack sanitation facilities.  The data is shown on a map.
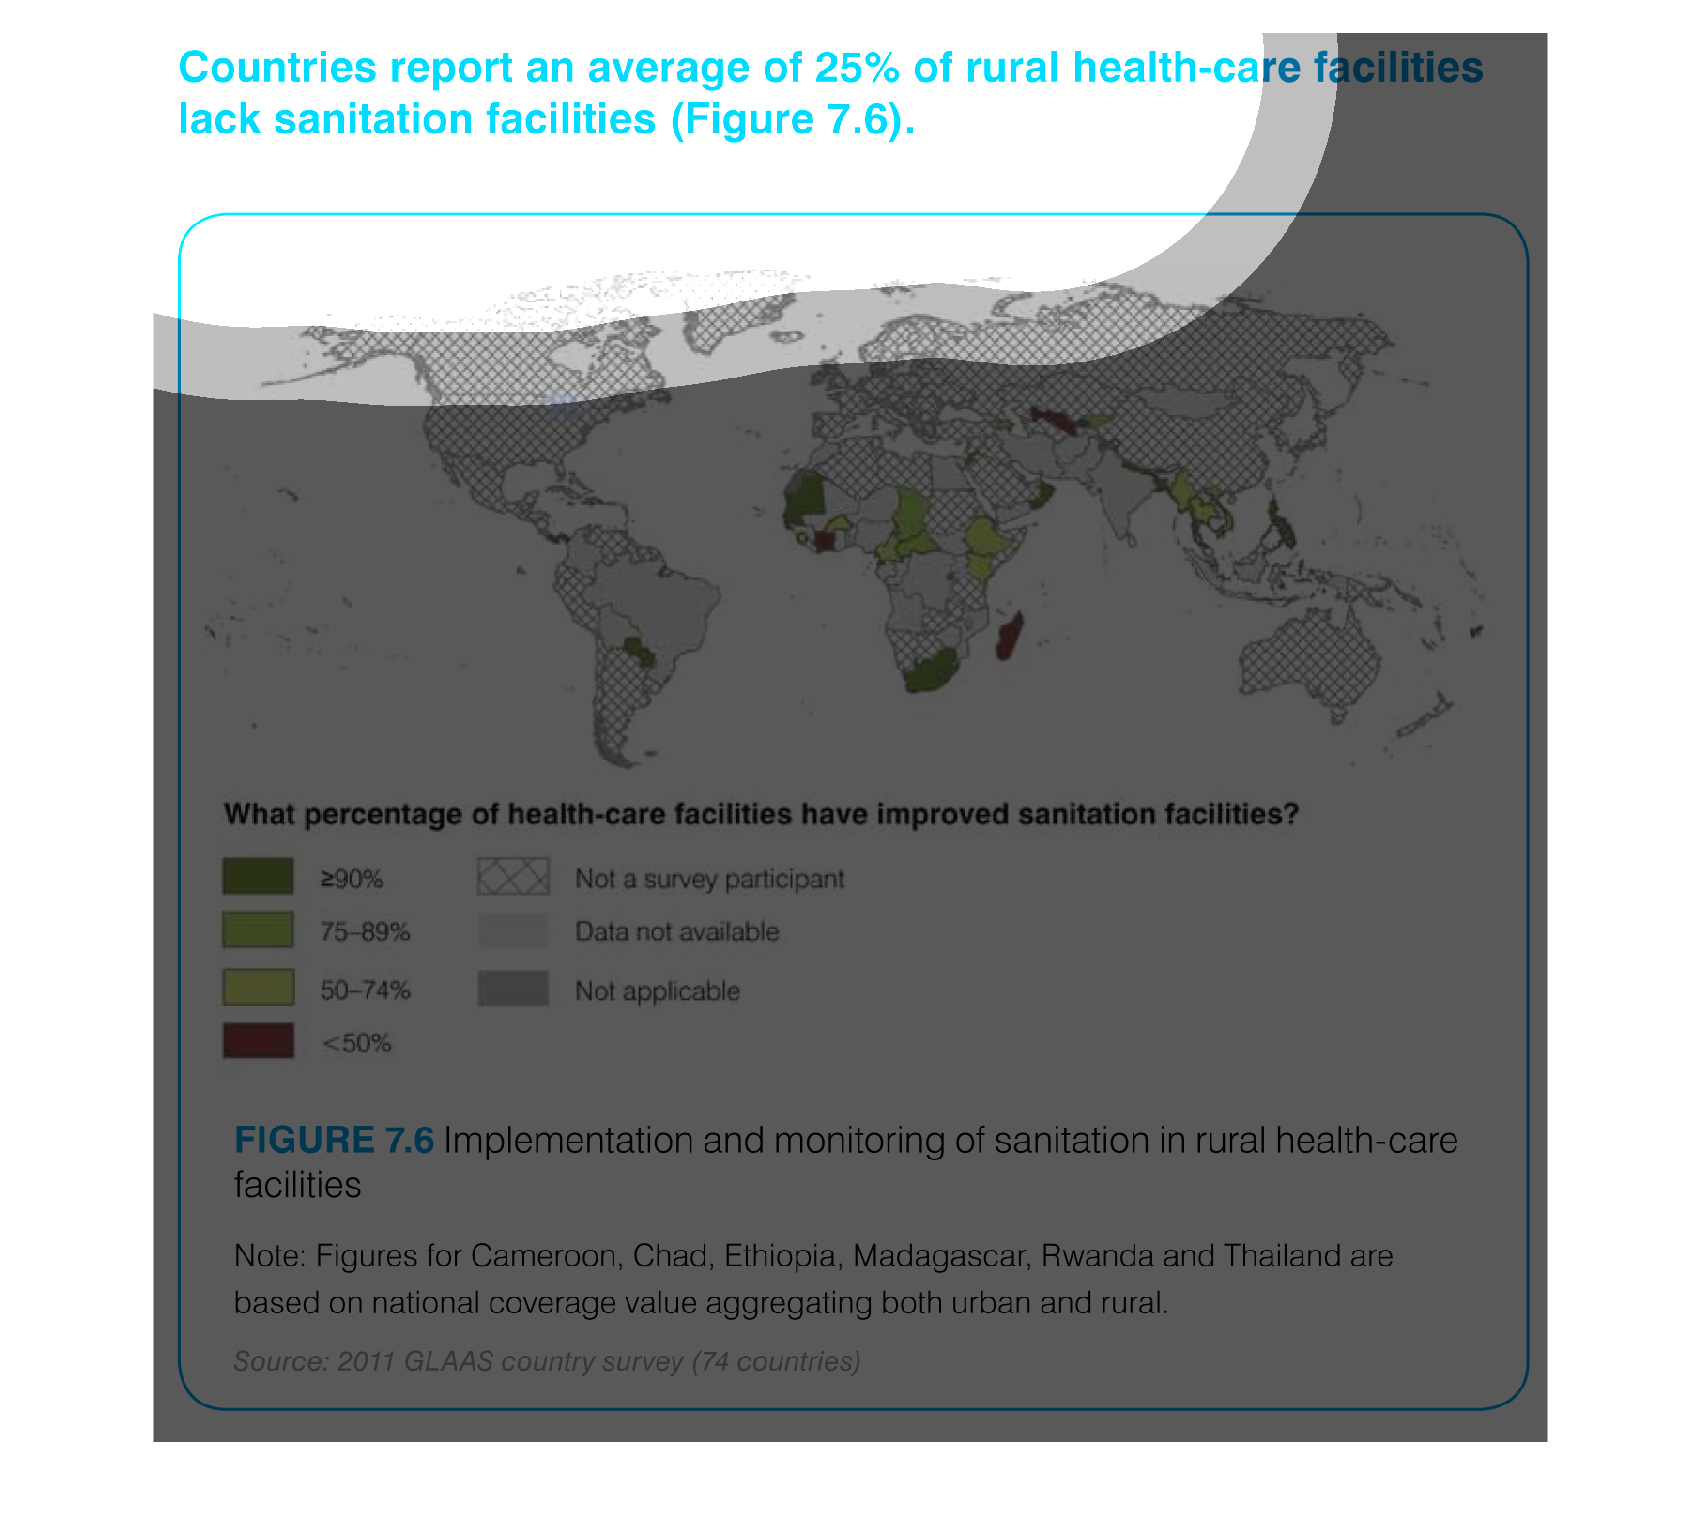
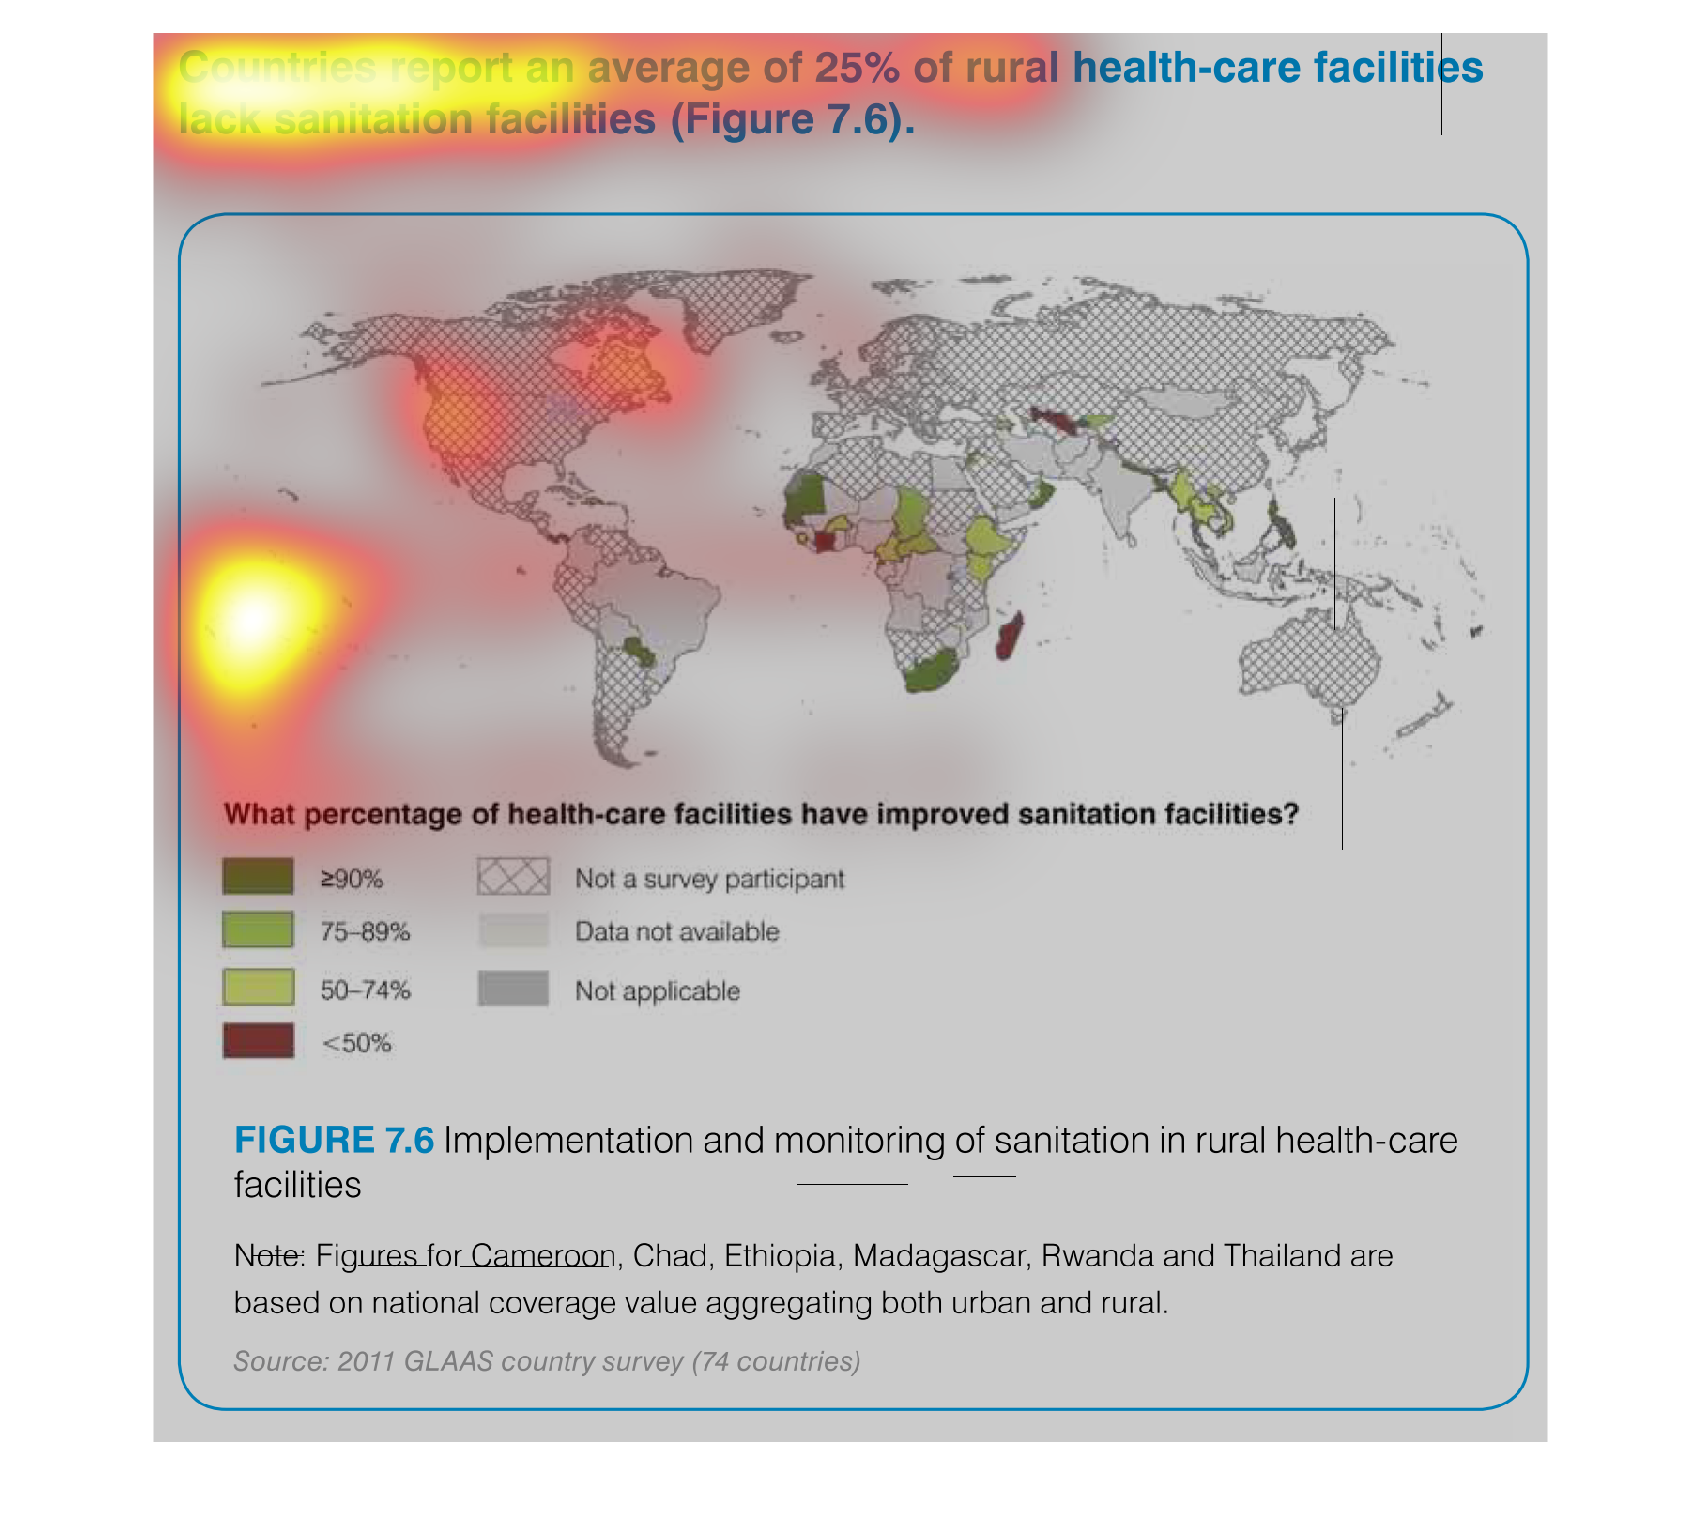
This world map shows the state of improved sanitation at healthcare facilities. Each nation
is colored and shaded, representing percentage, with crosshatched nations denoting non-participants
in the survey this data was taken from.
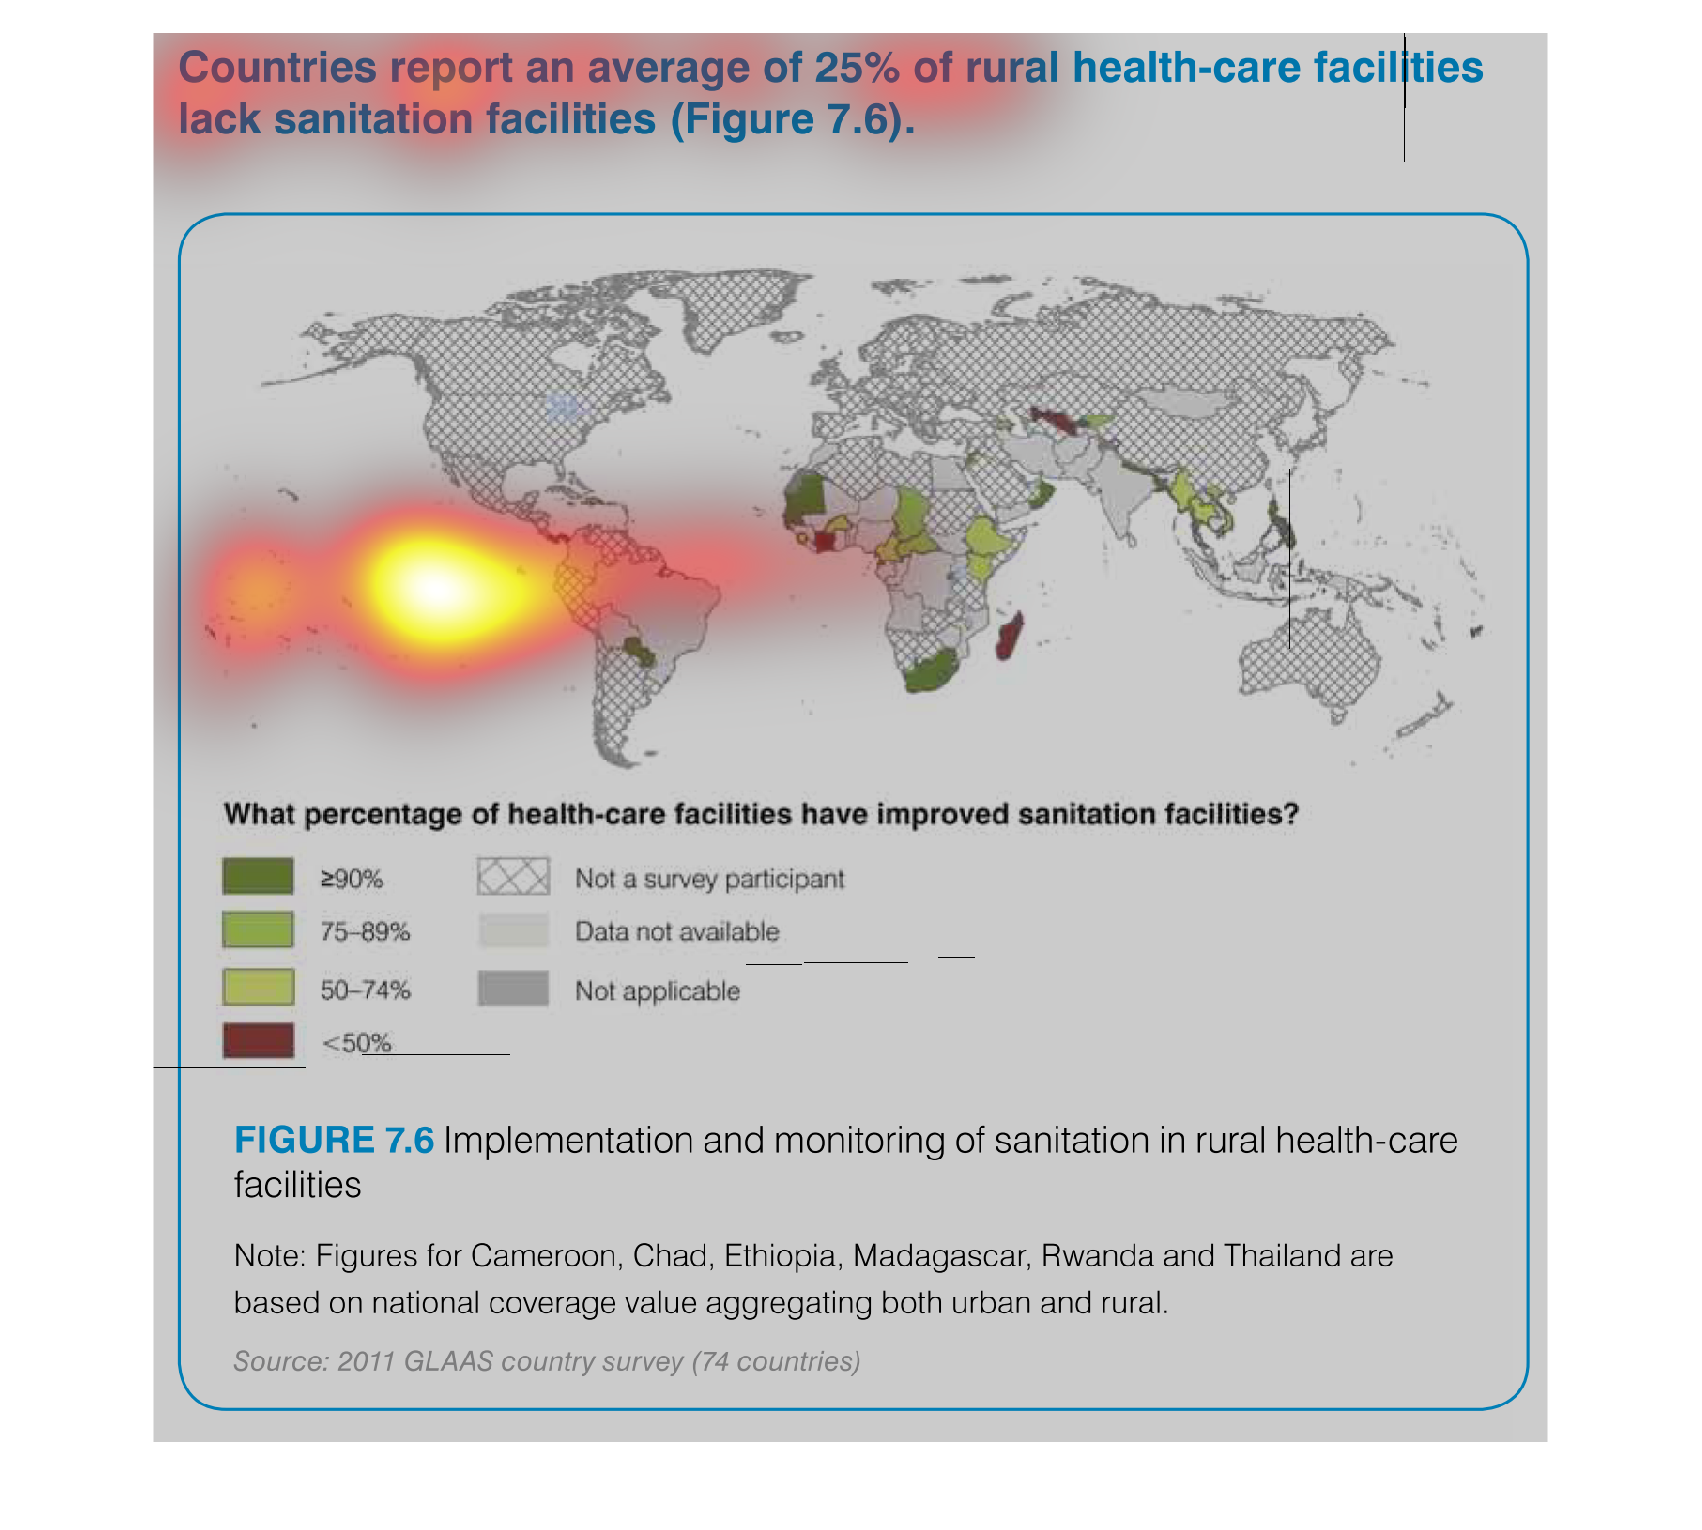
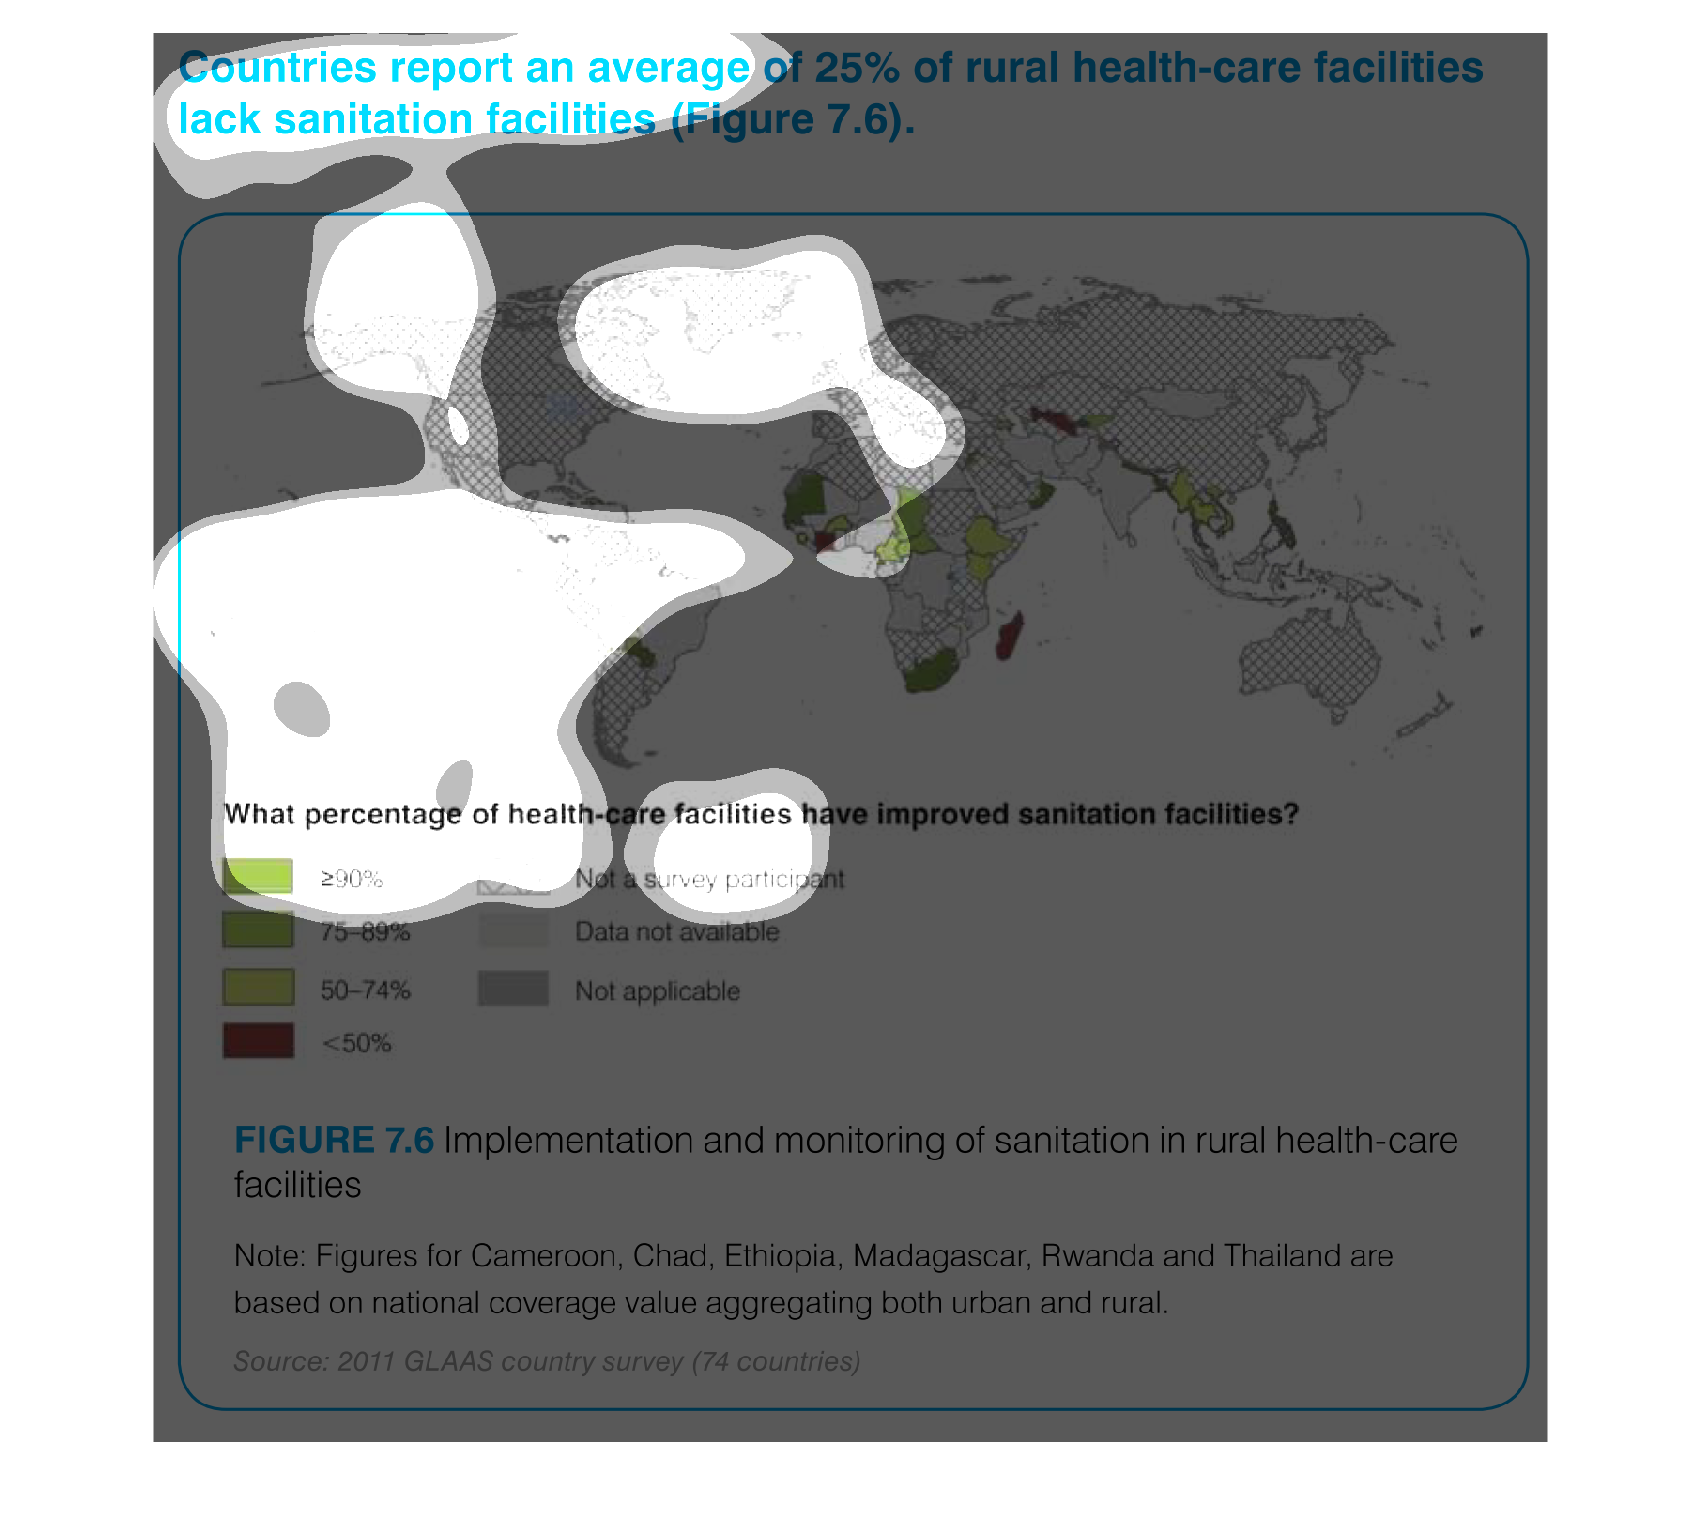
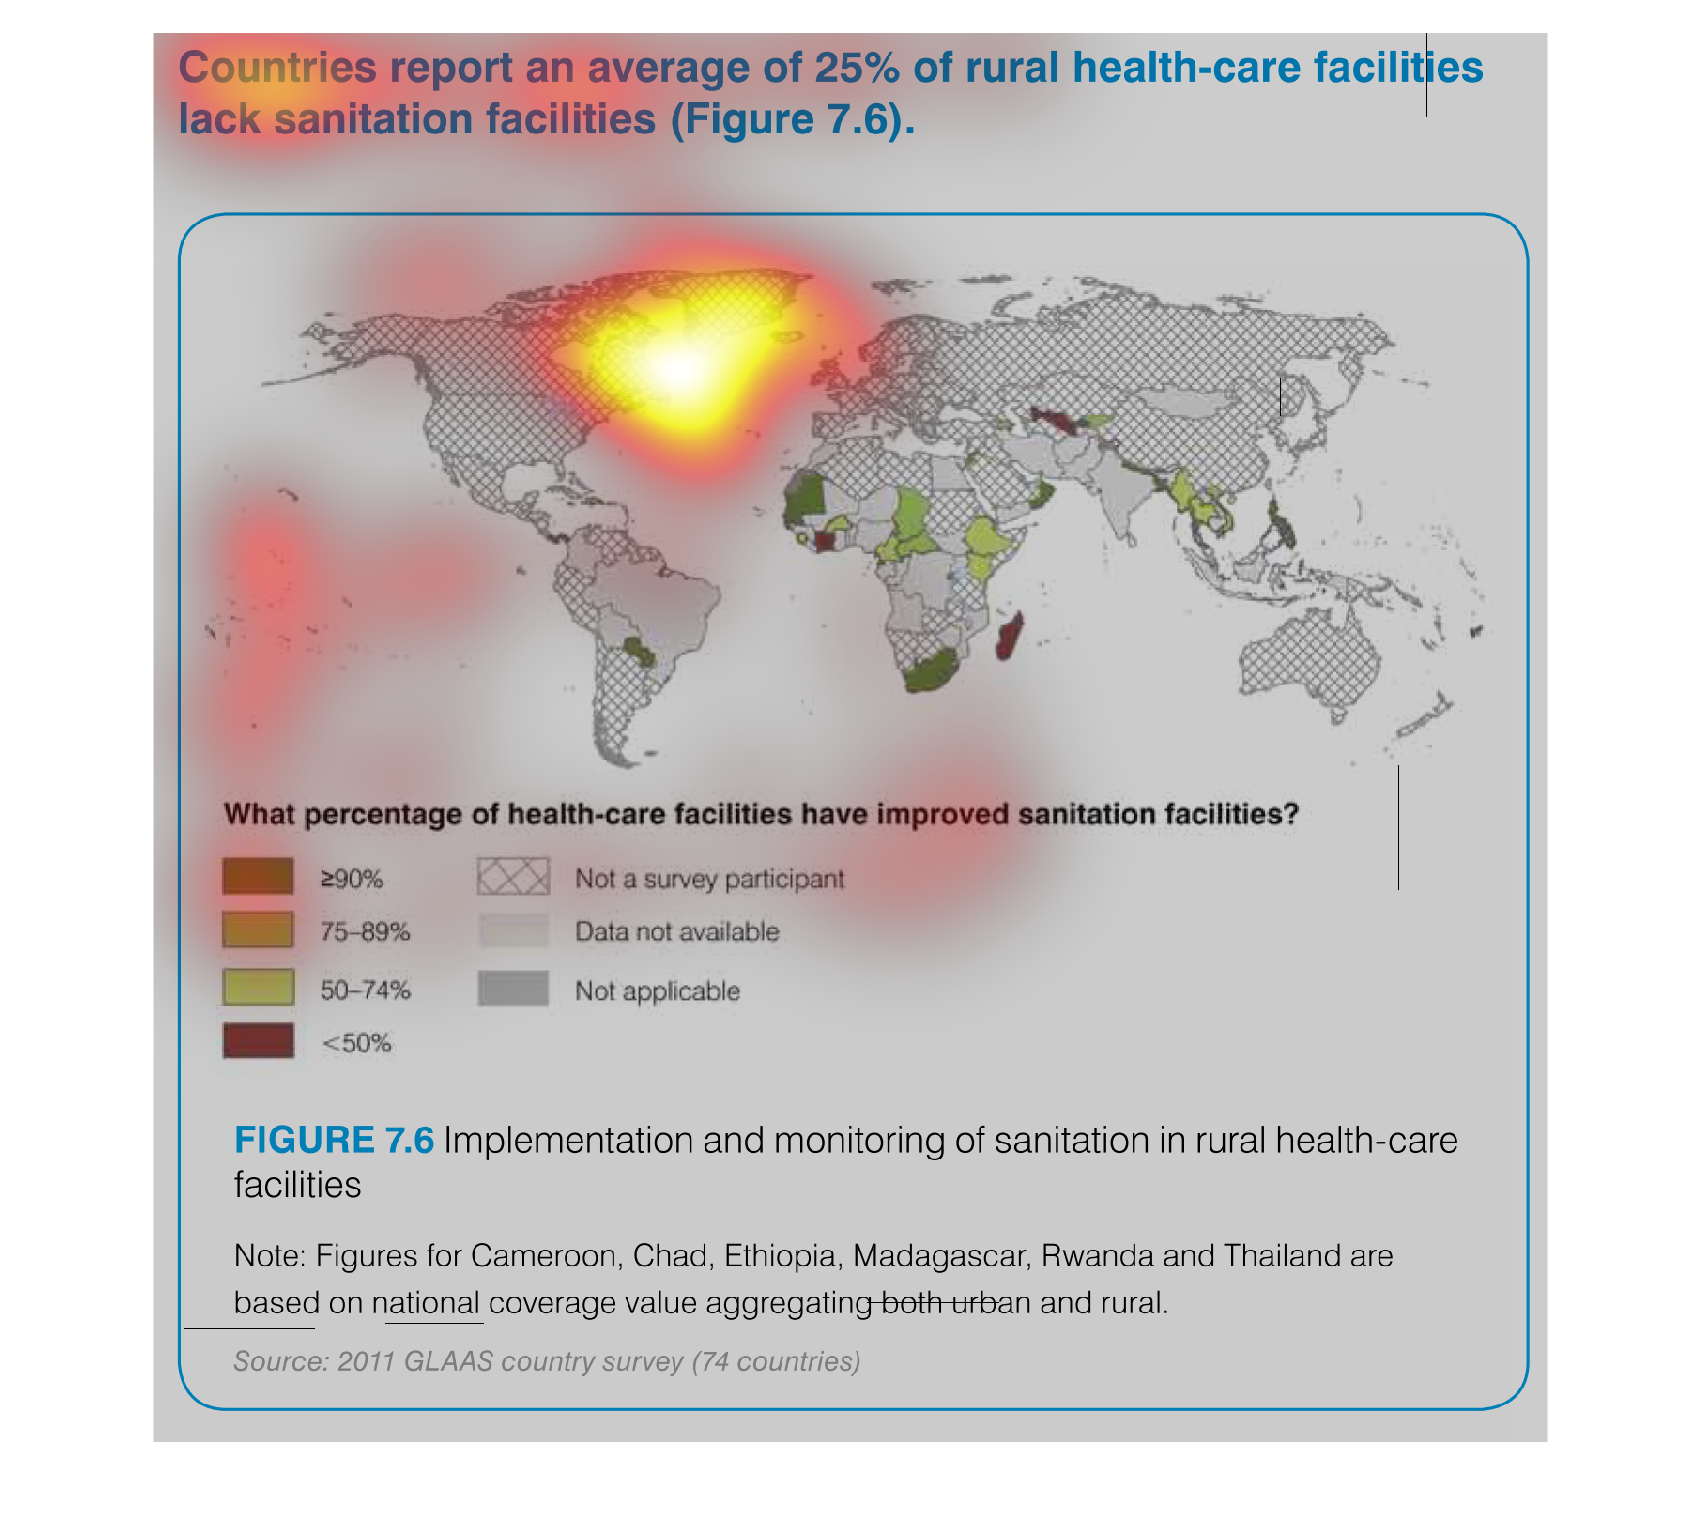
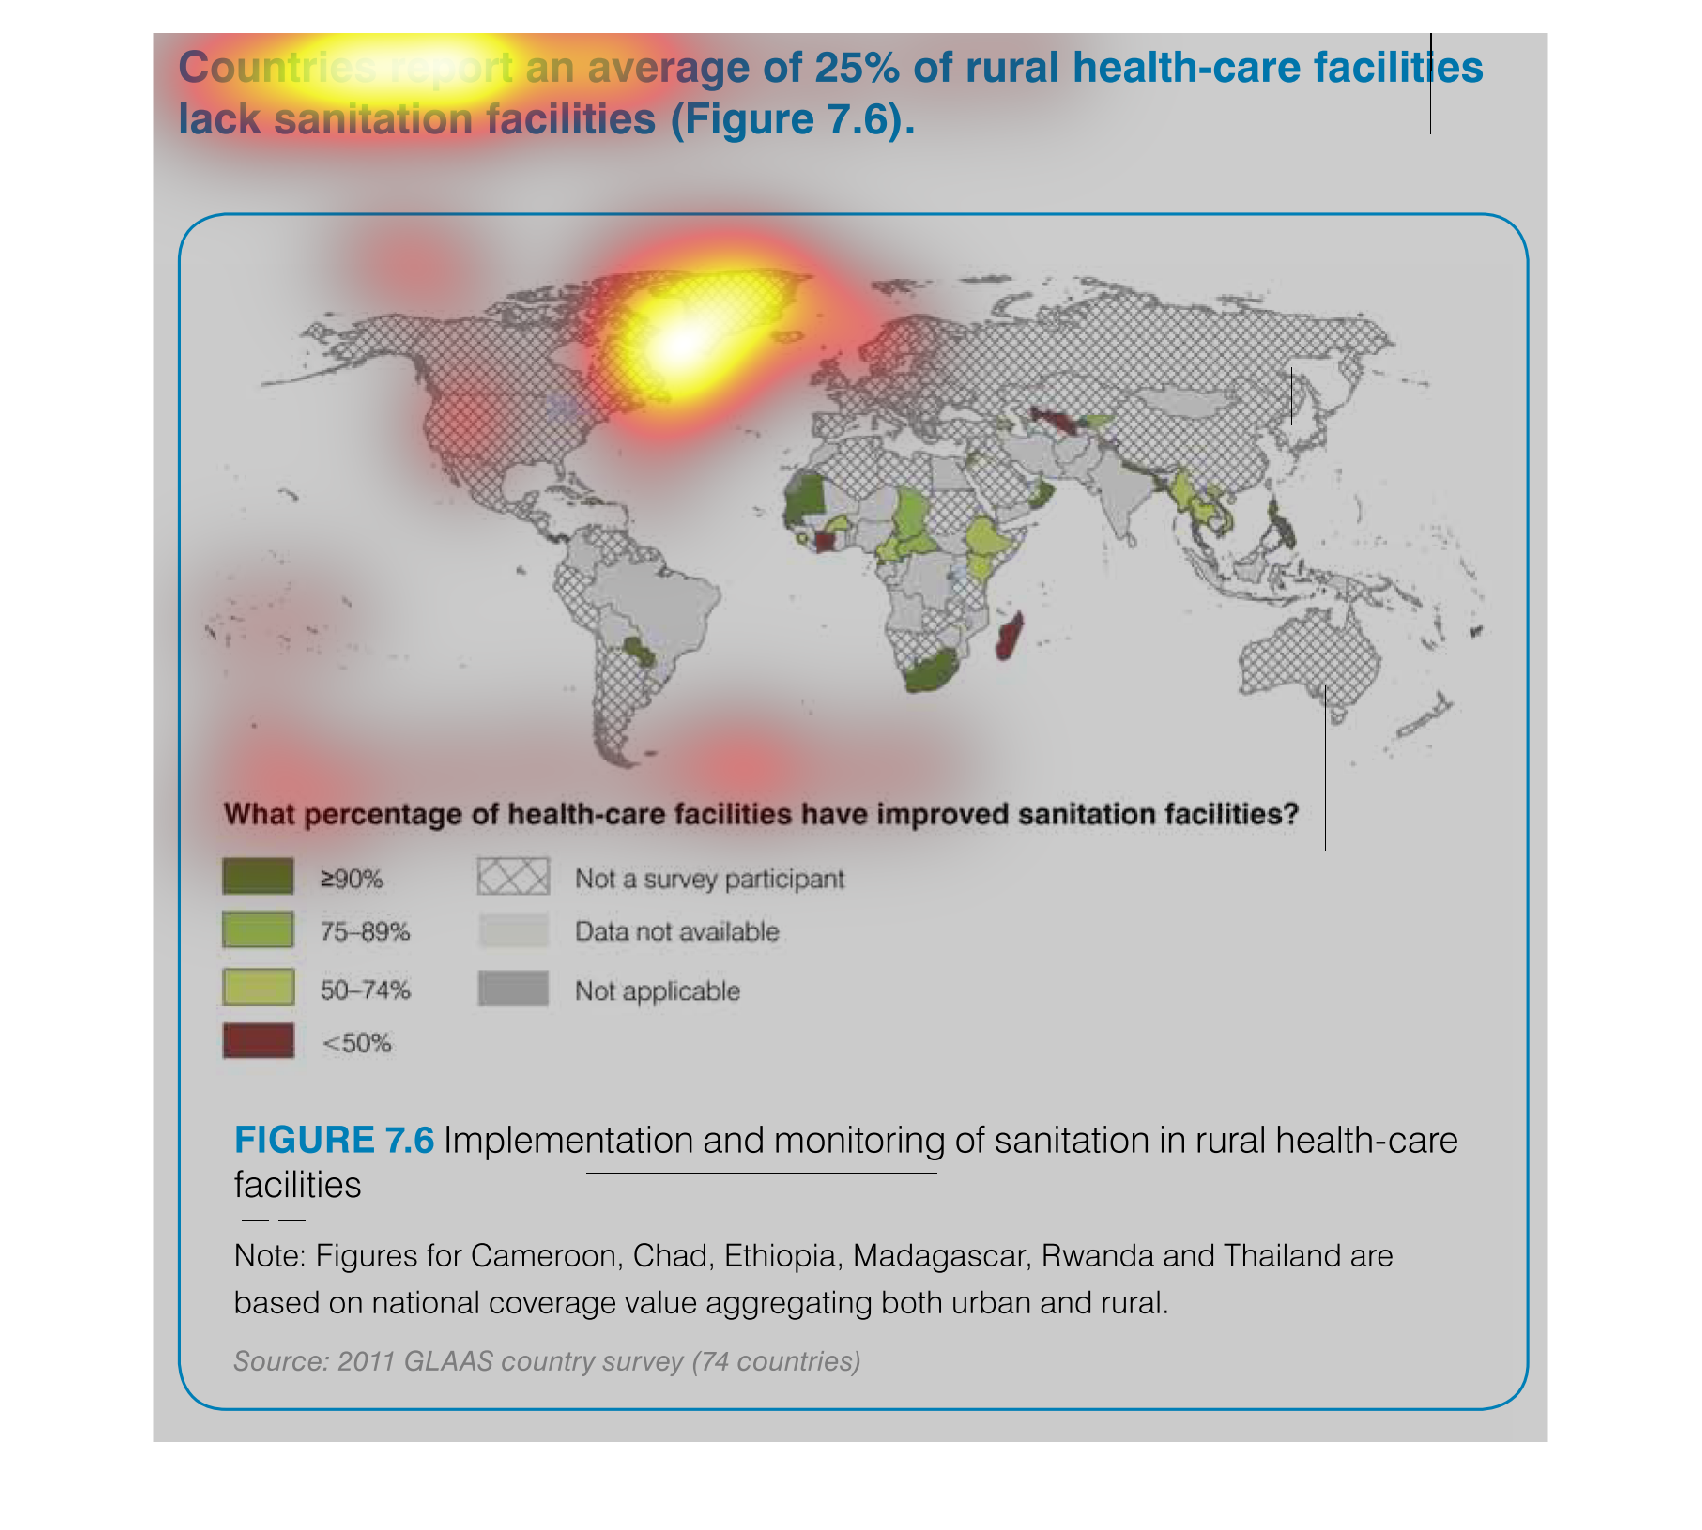
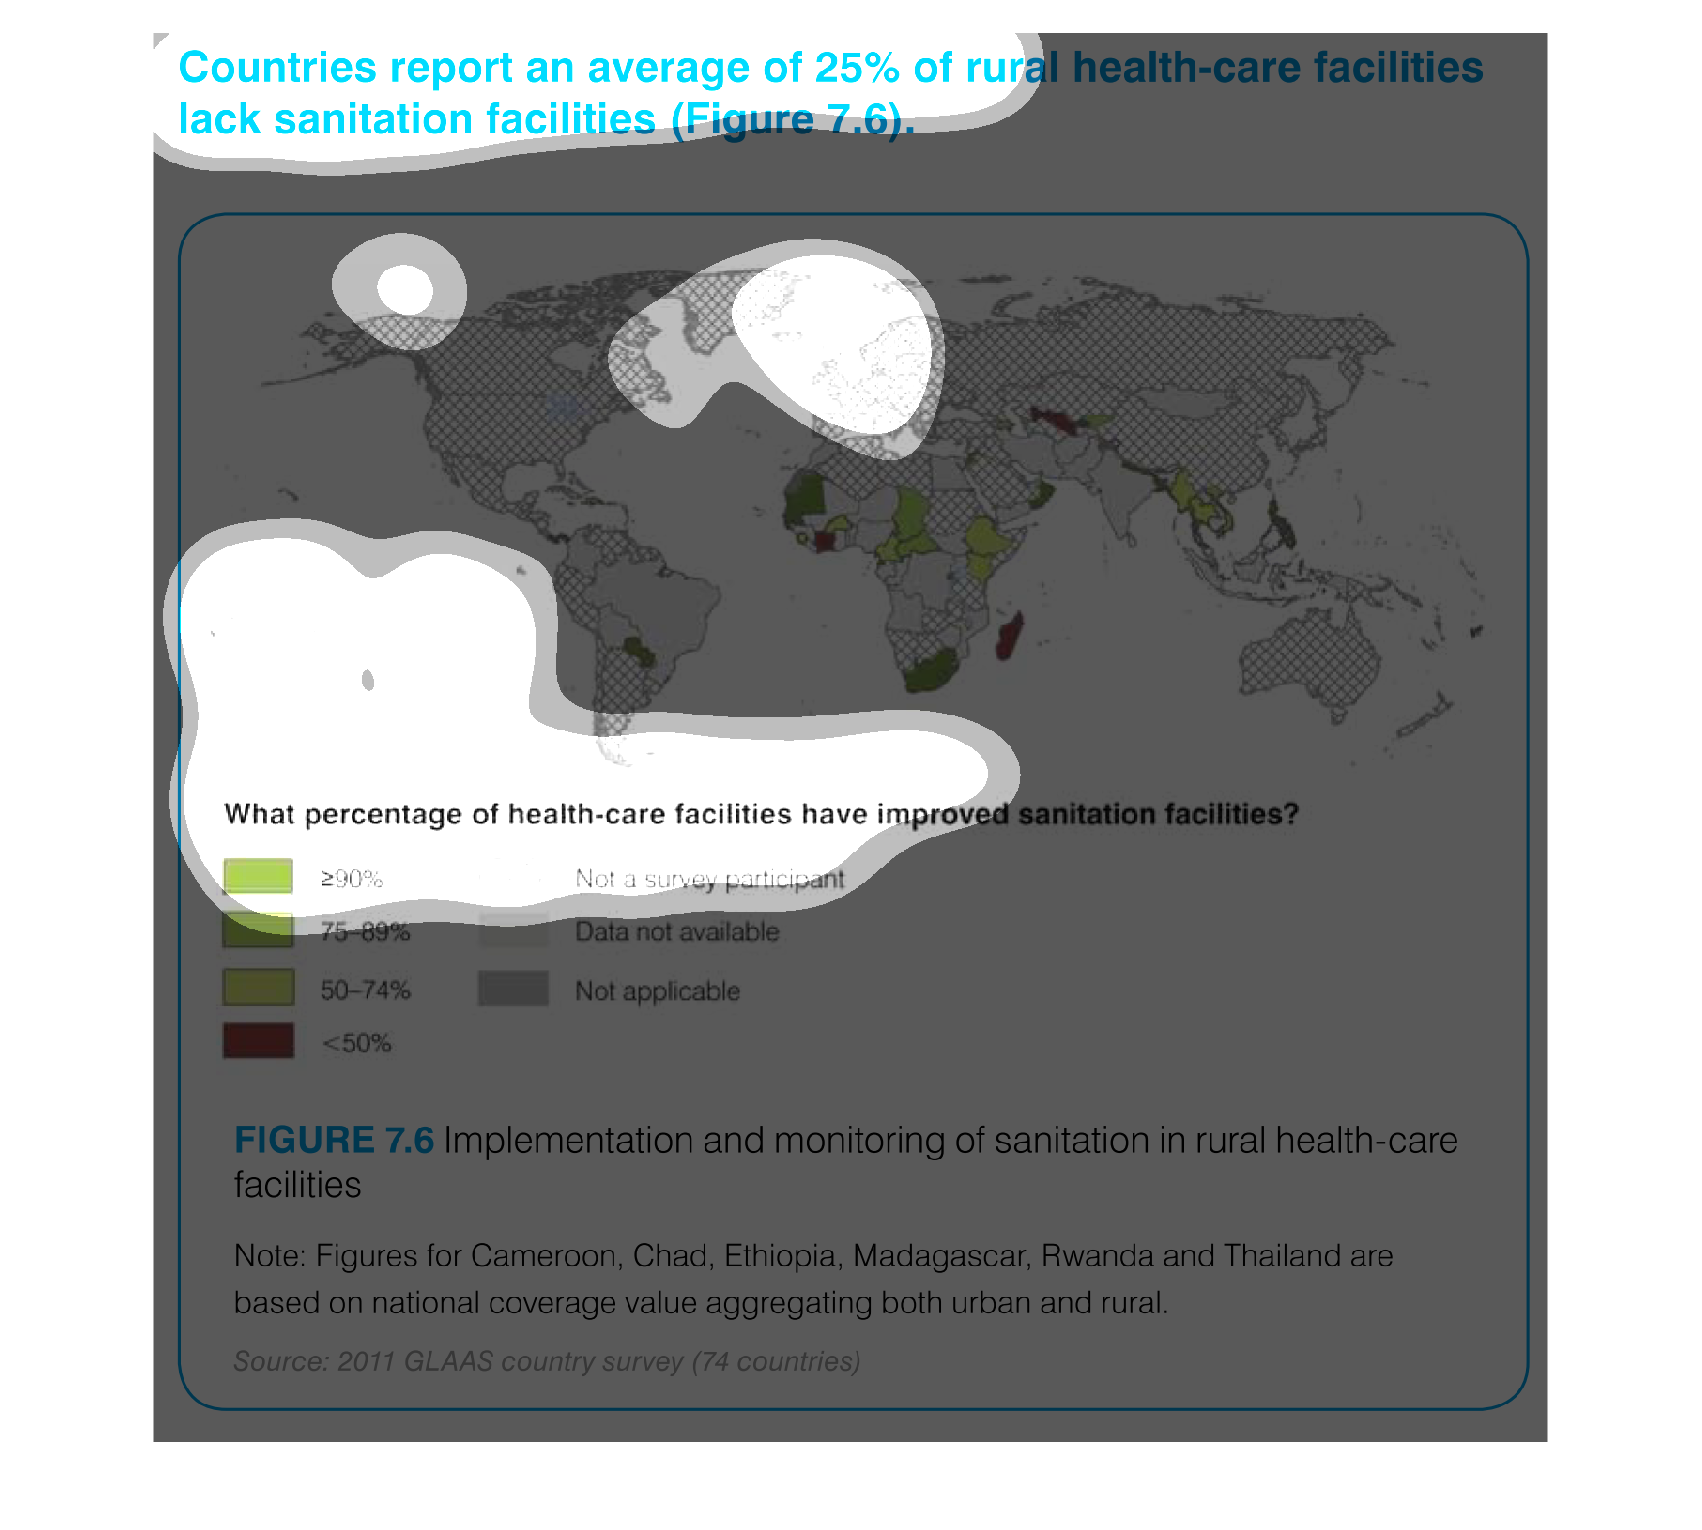
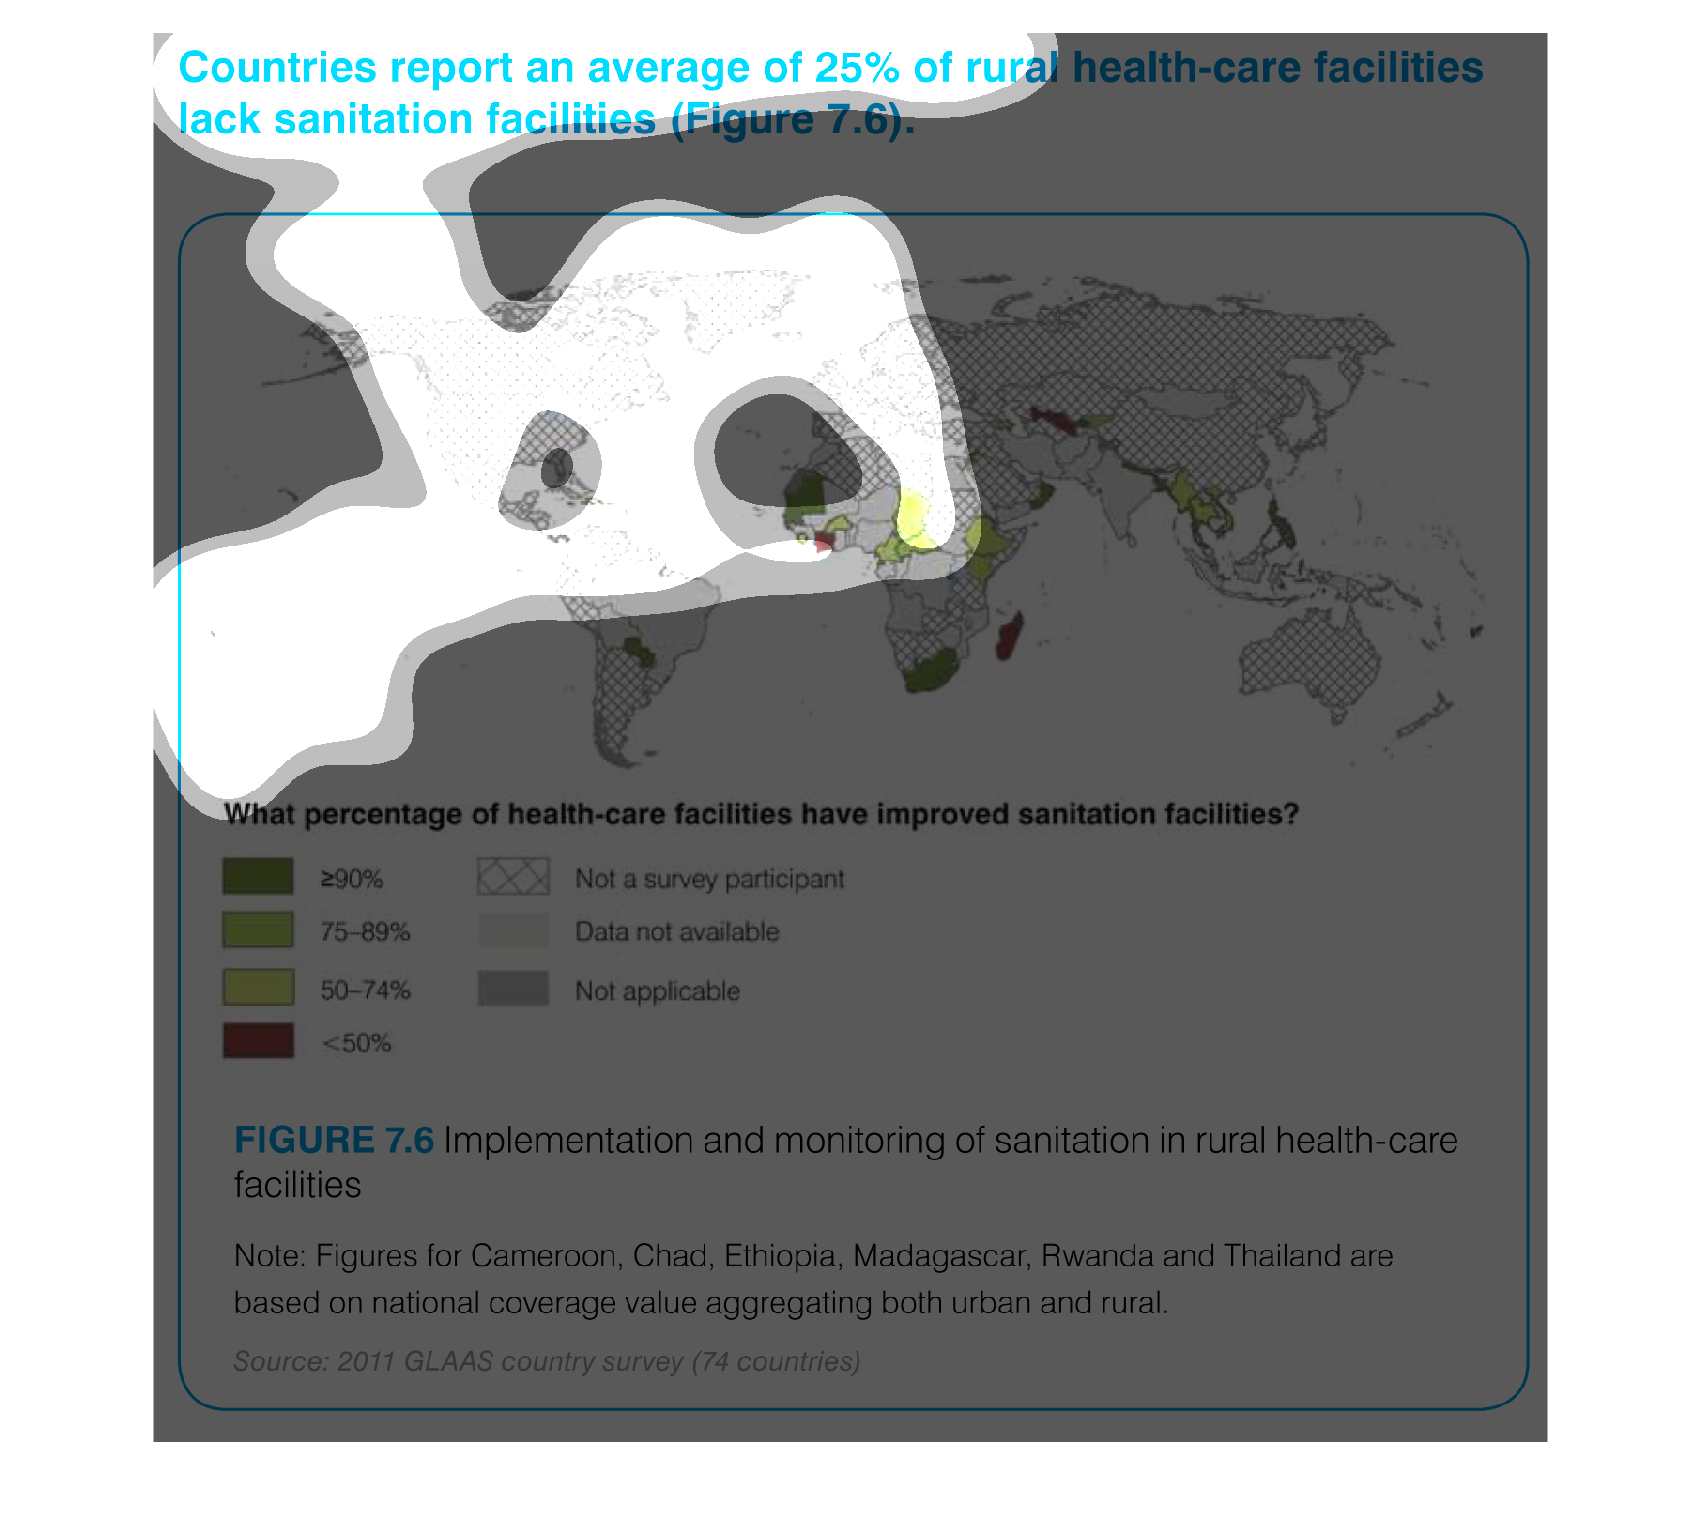
The chart shows the percentage of rural health care facilities that have improved sanitation
methods throughout the world.  Most of the least improved sanitation methods are found in
the Southern Hemisphere.
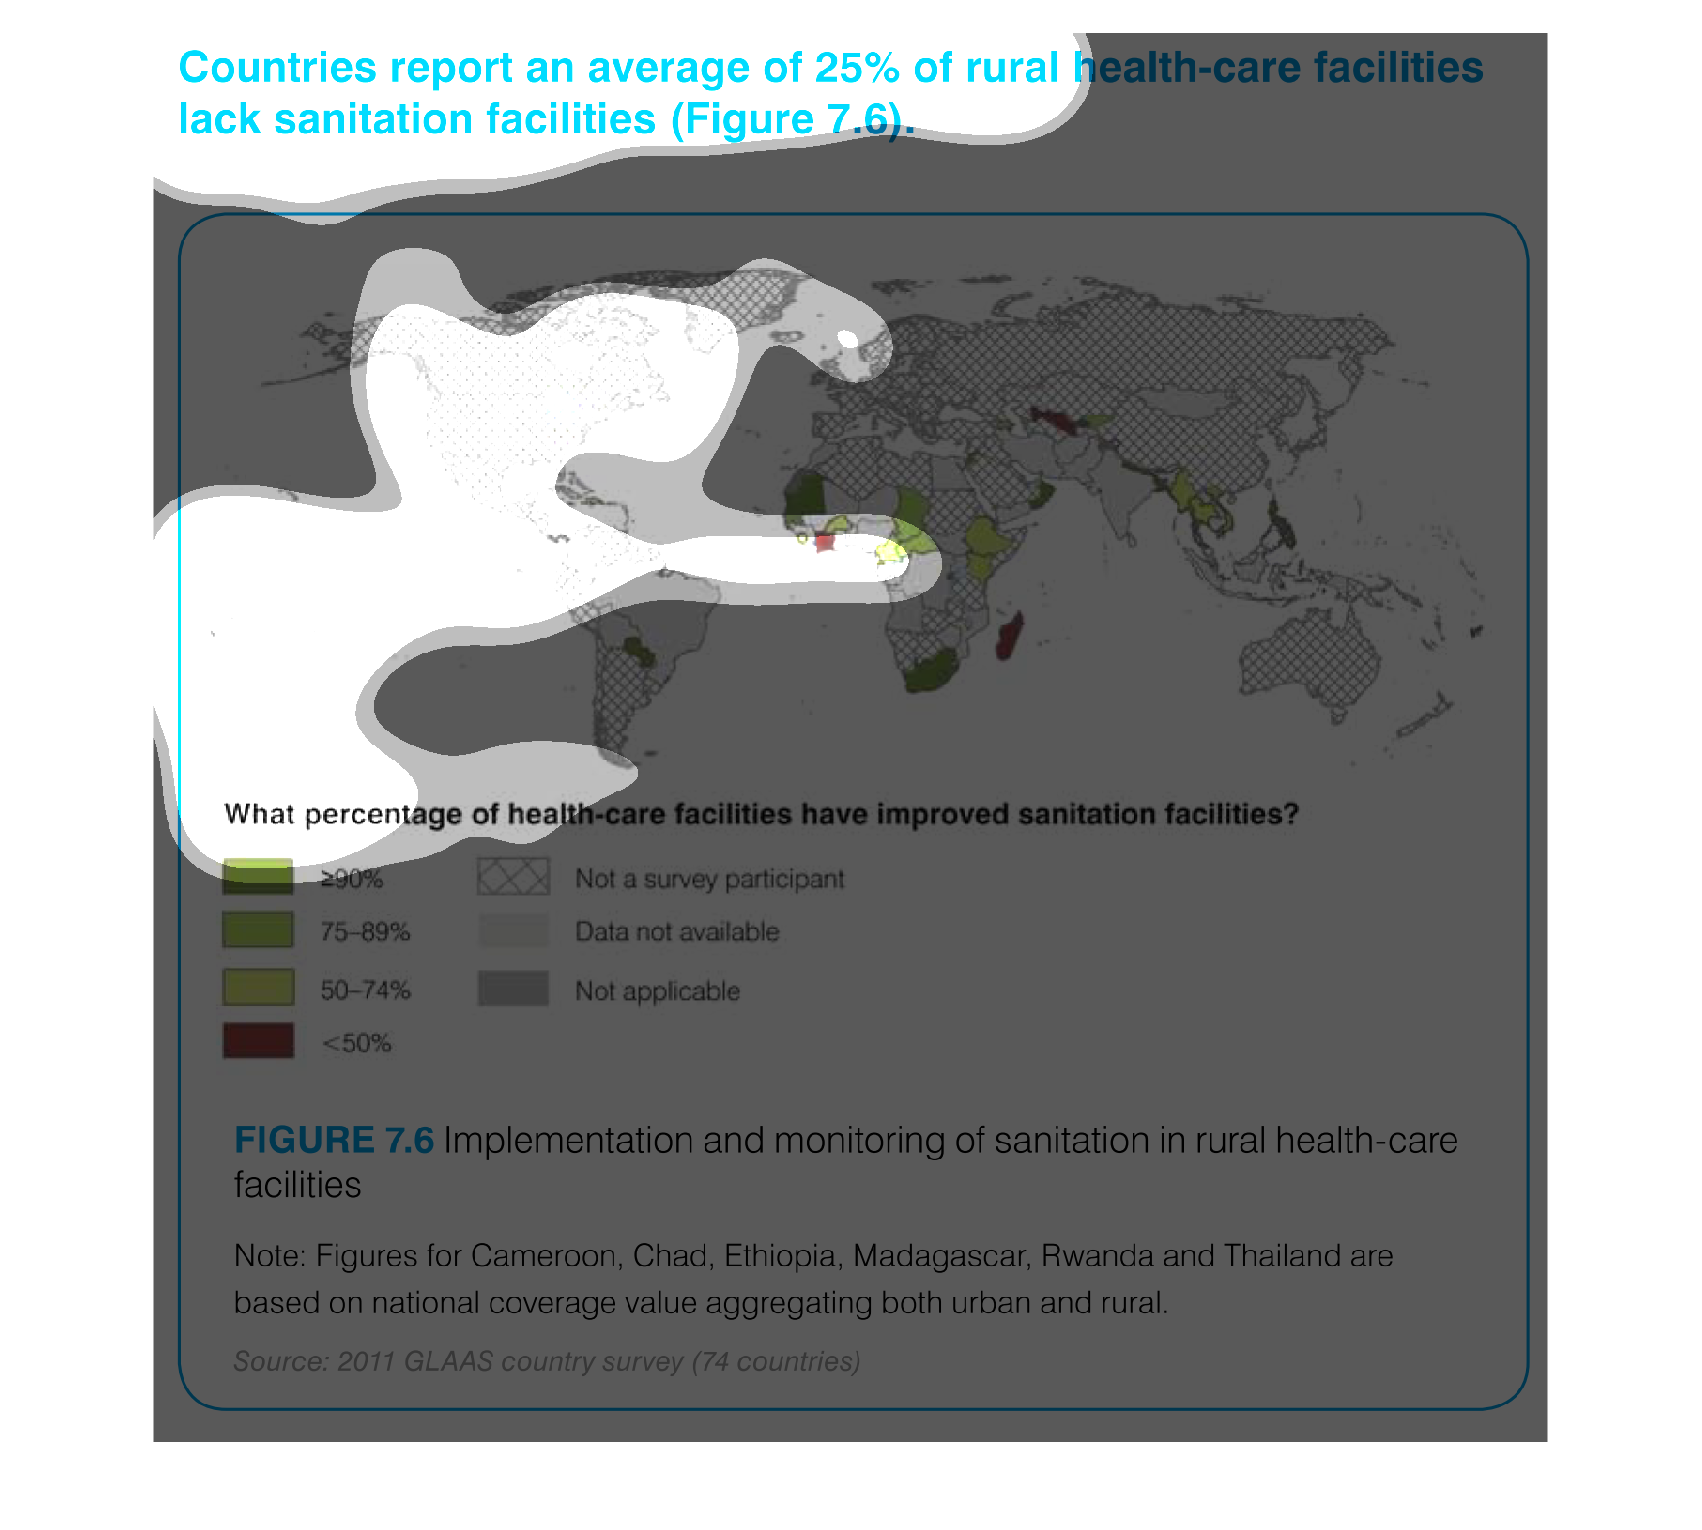
The image depicts countries reporting an average of 25% of rural healthcare facilities lacking
sanitation facilities. The majority of countries are located in Africa, China, parts of South
America as well as parts of the Middle East.
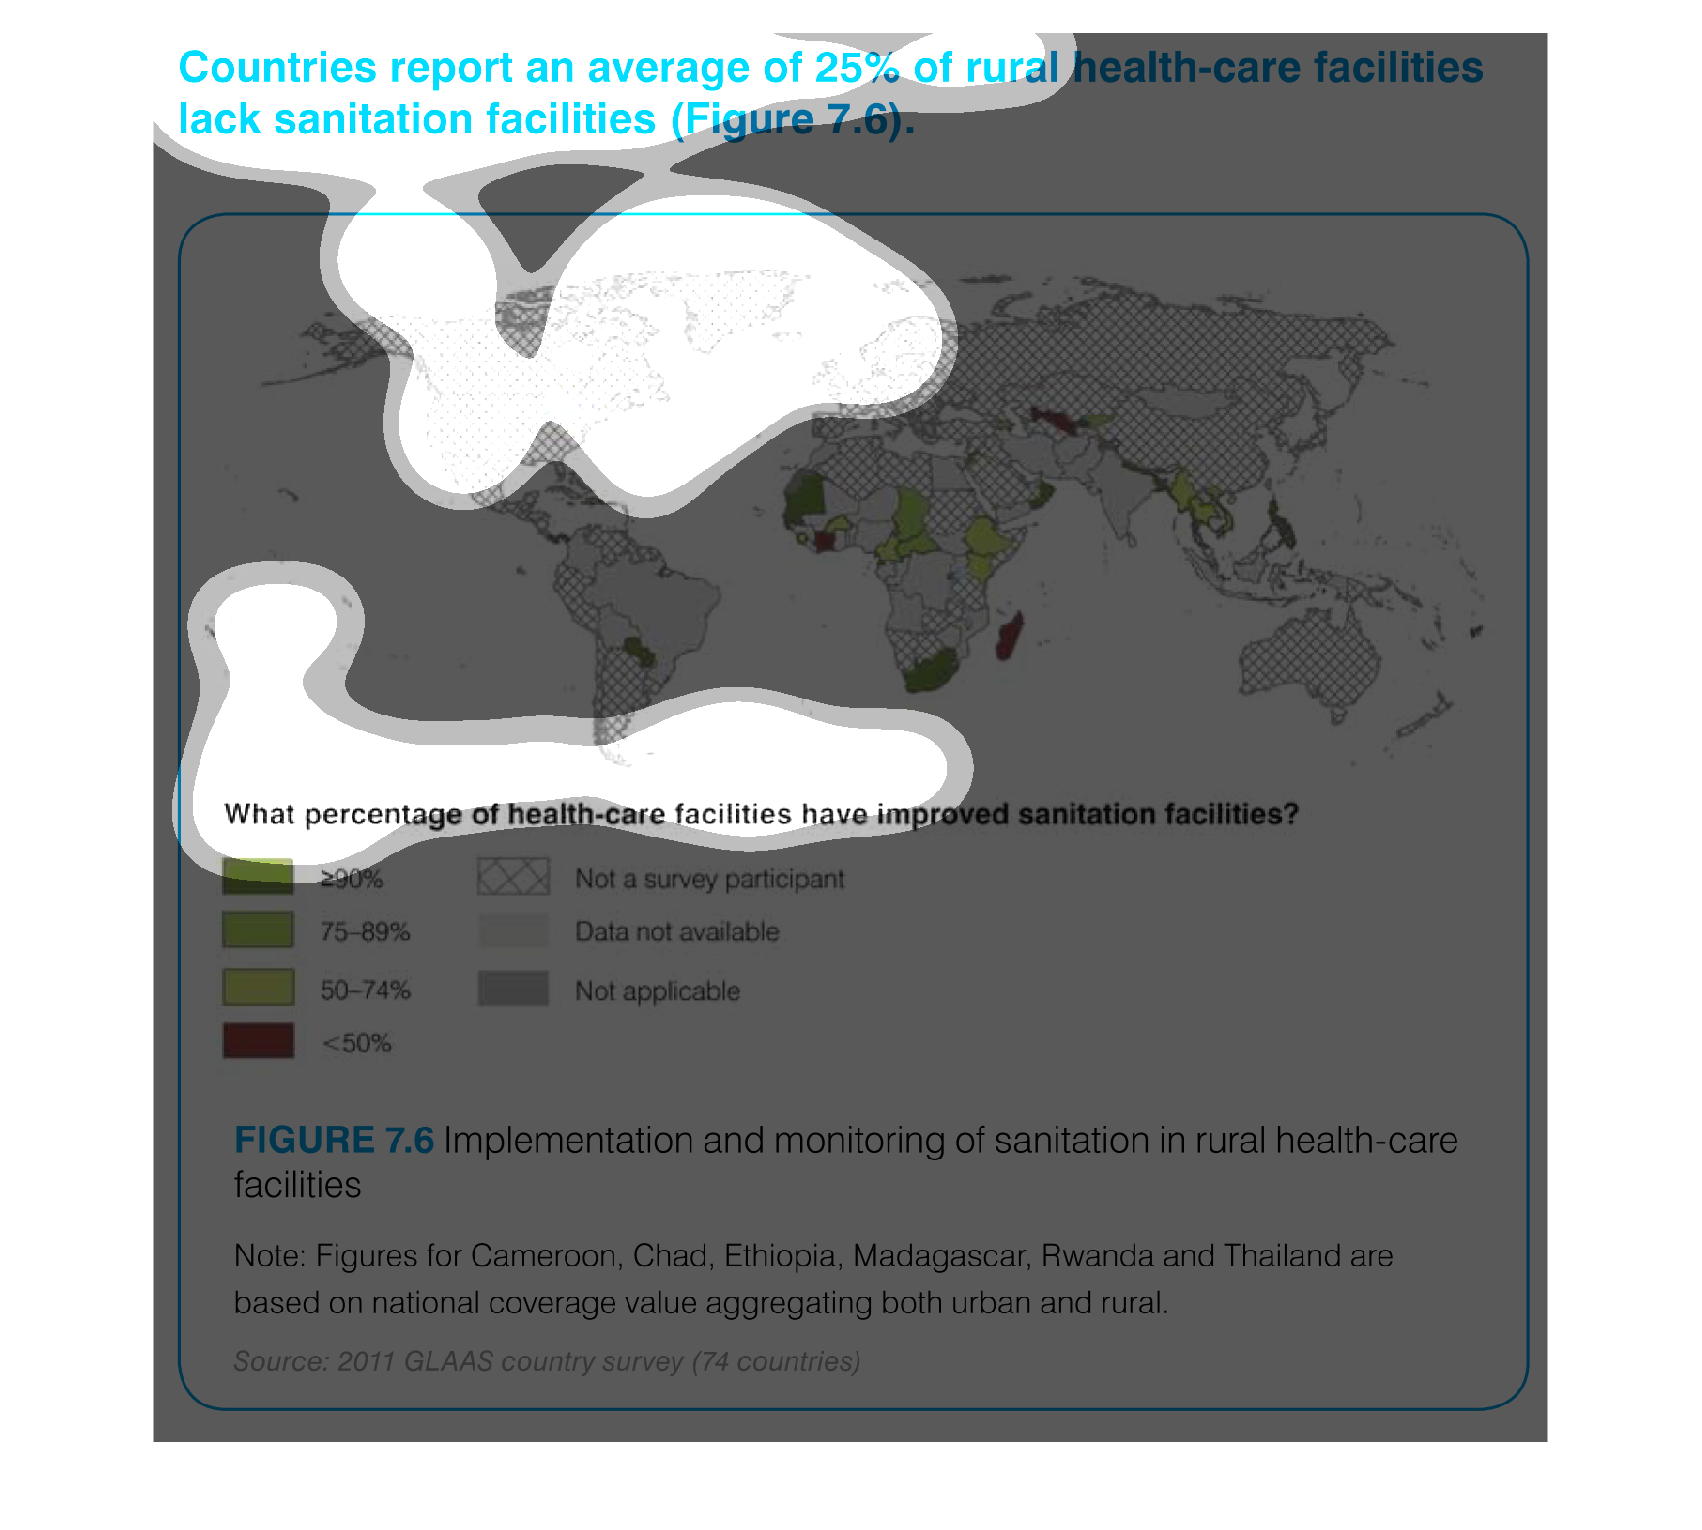
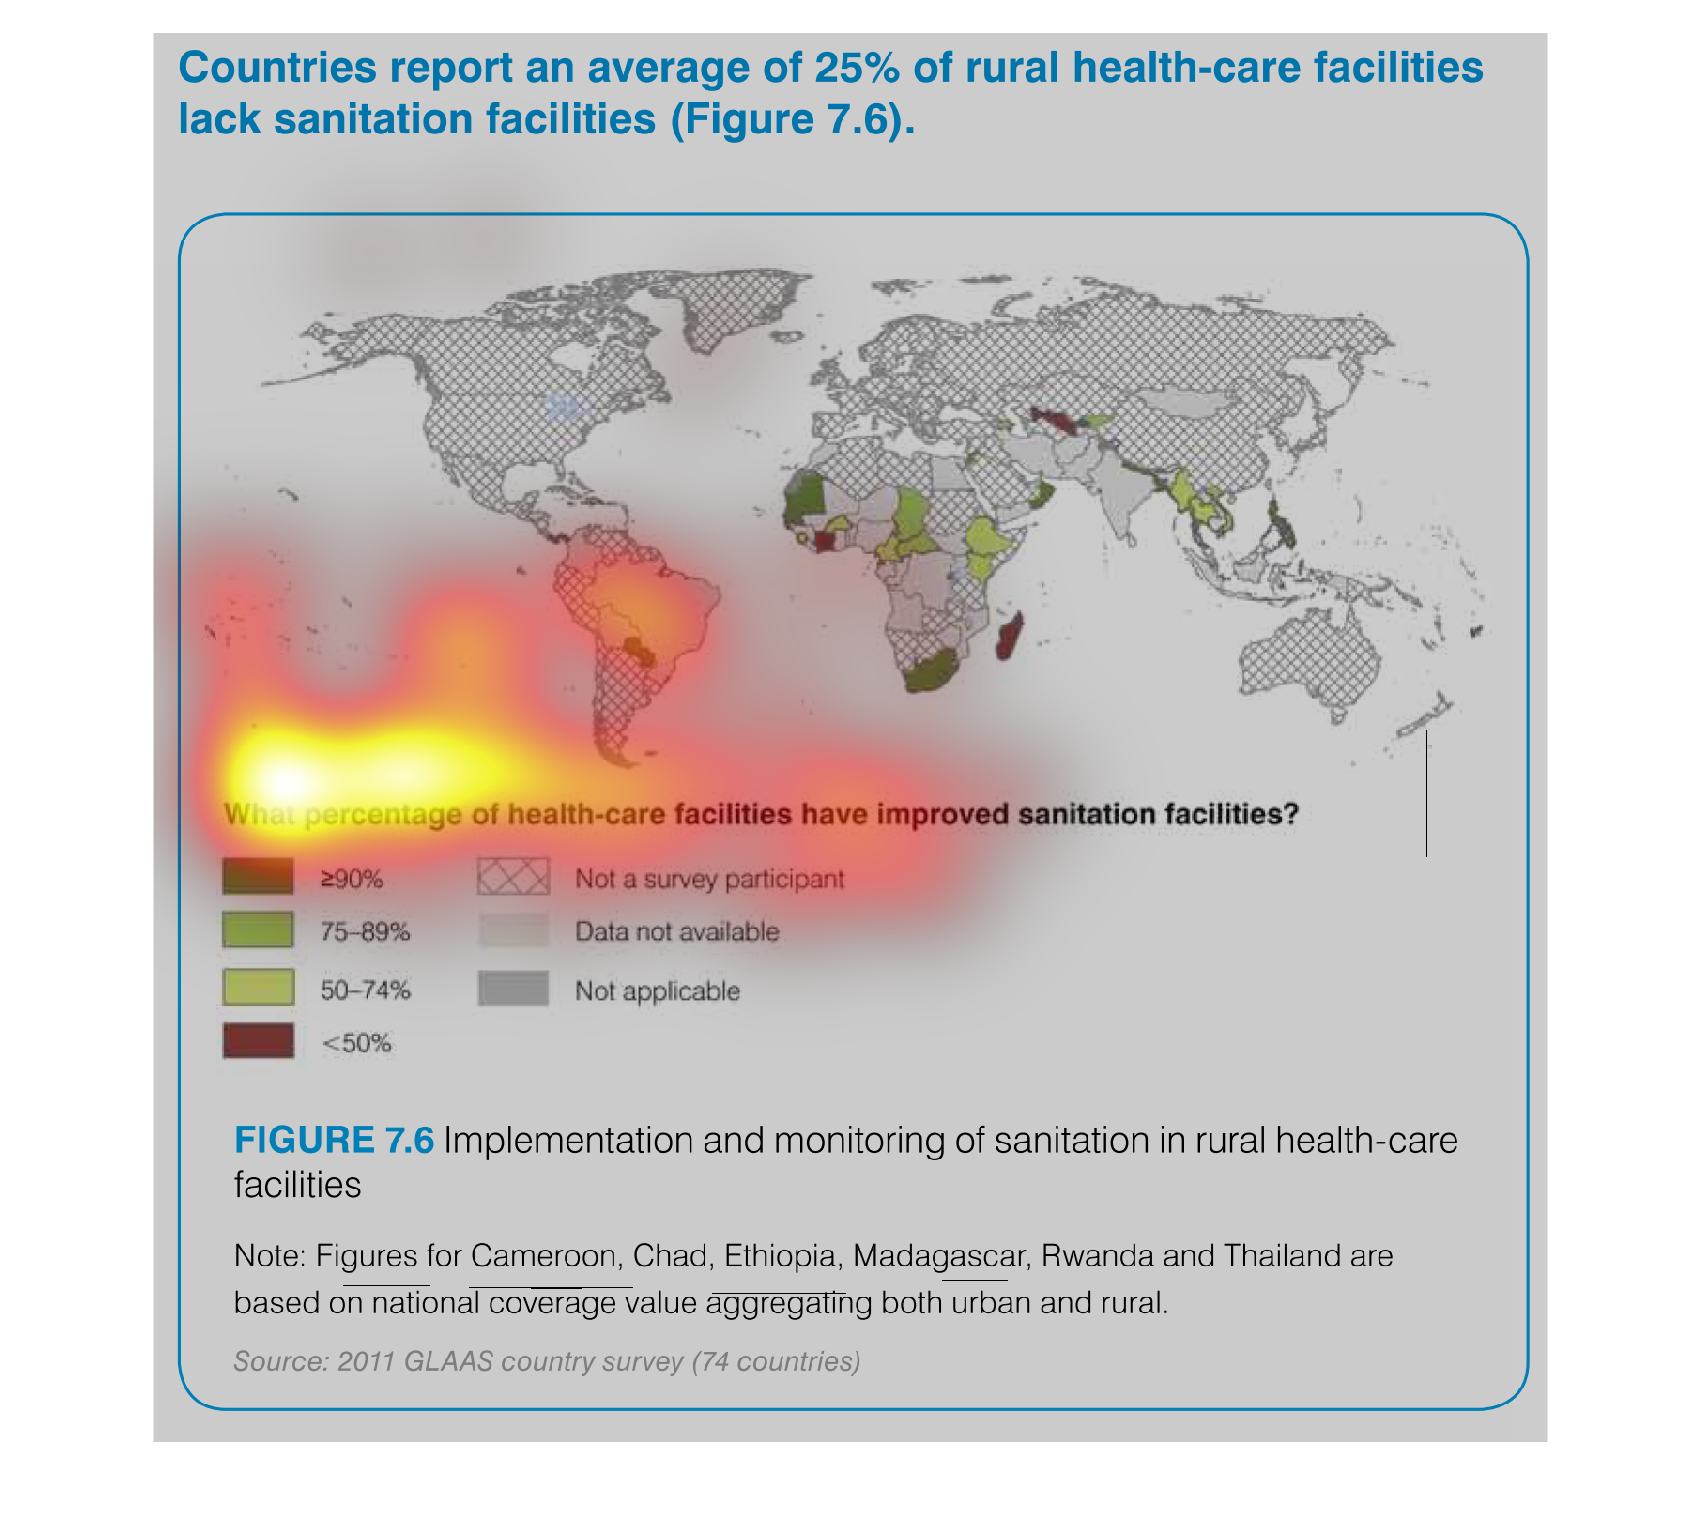
This chart describes countries report an average of twenty five percent of rural health-care
facilities lack sanitation facilities. Different categories on the chart are represented by
different colors.

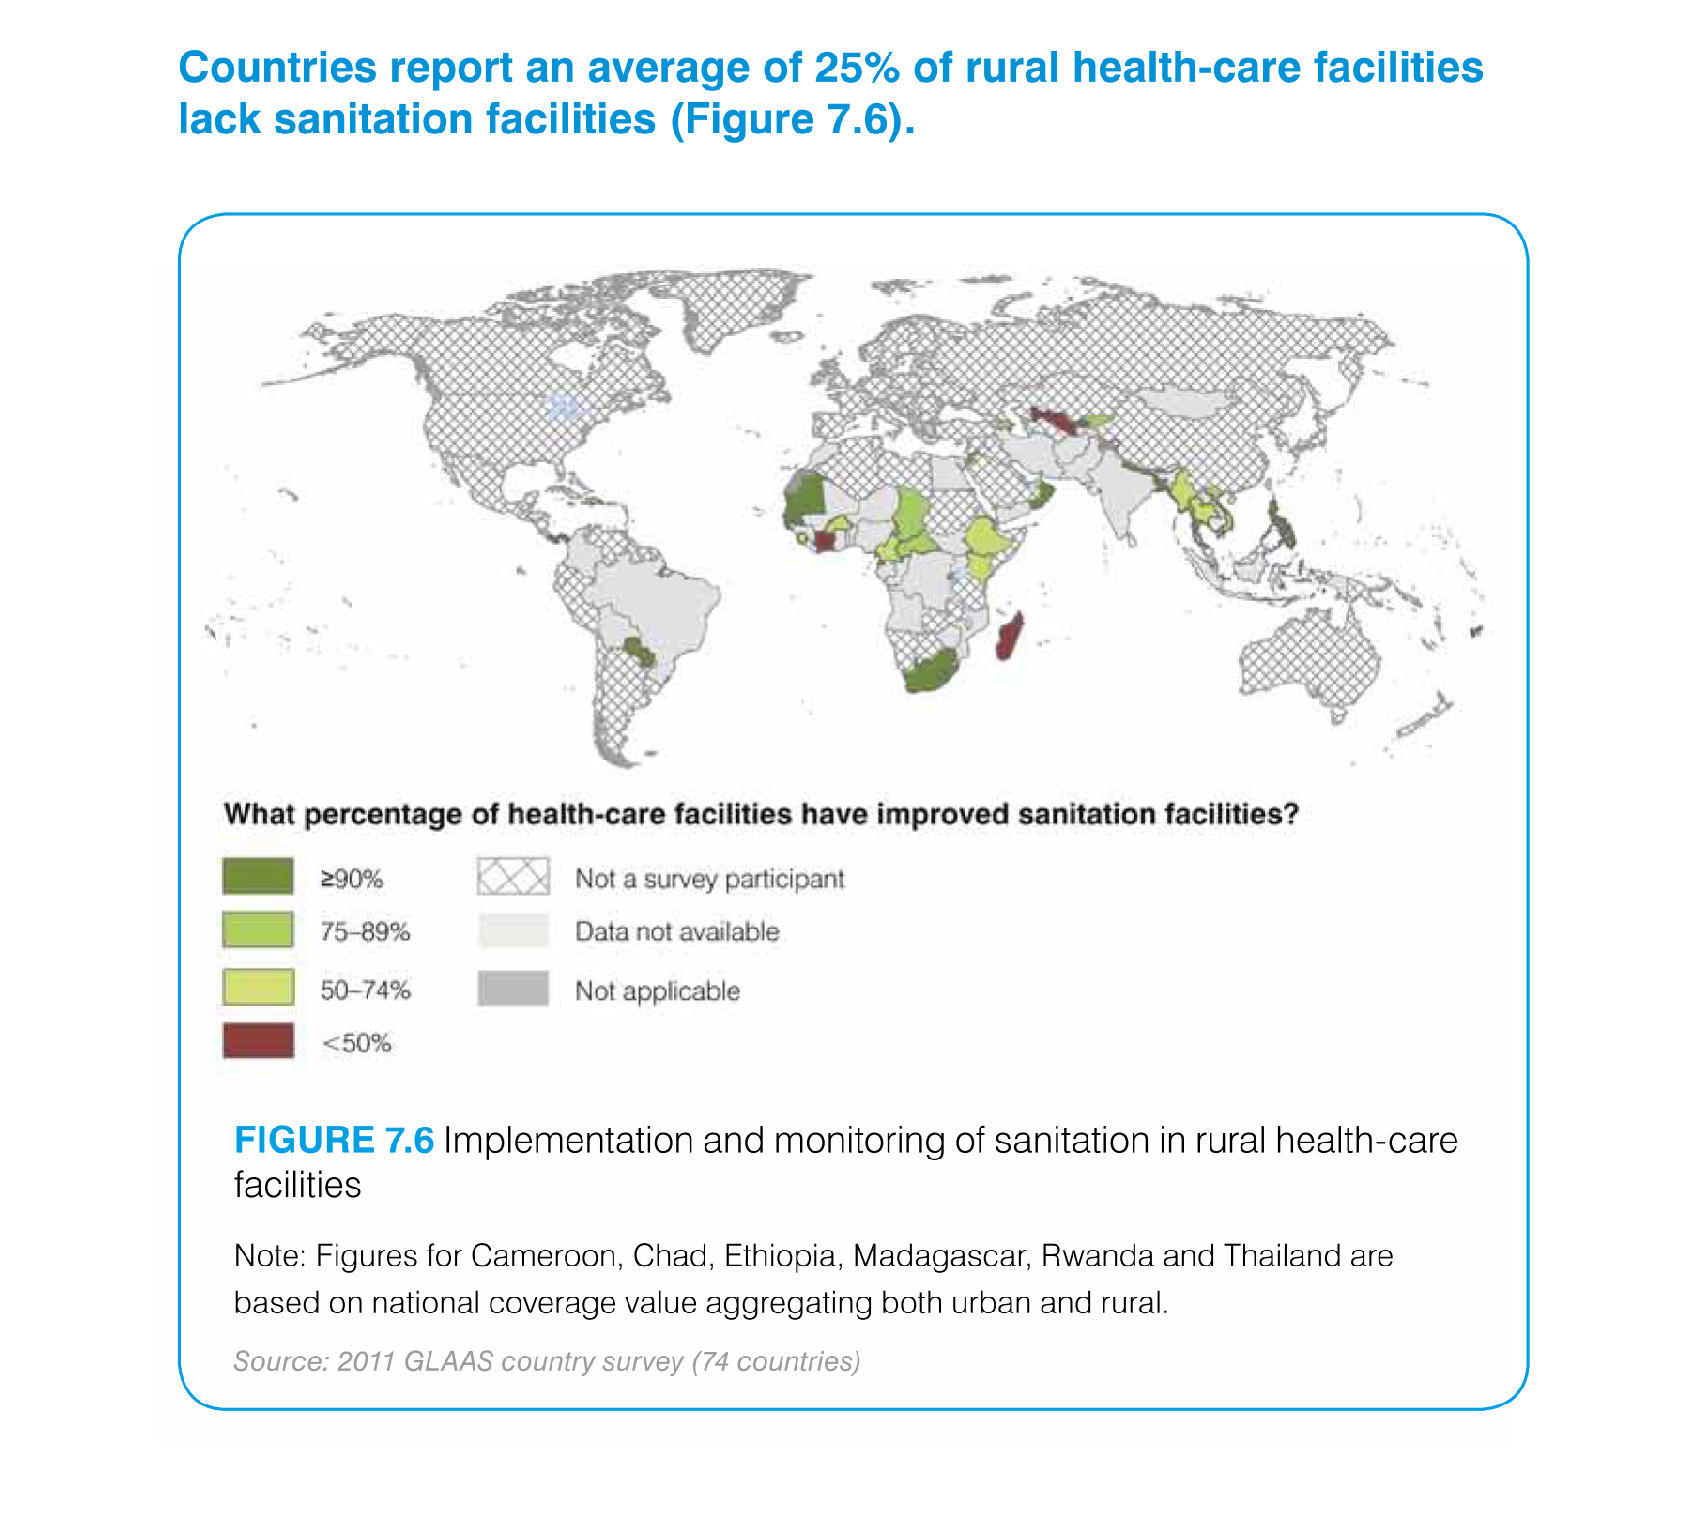
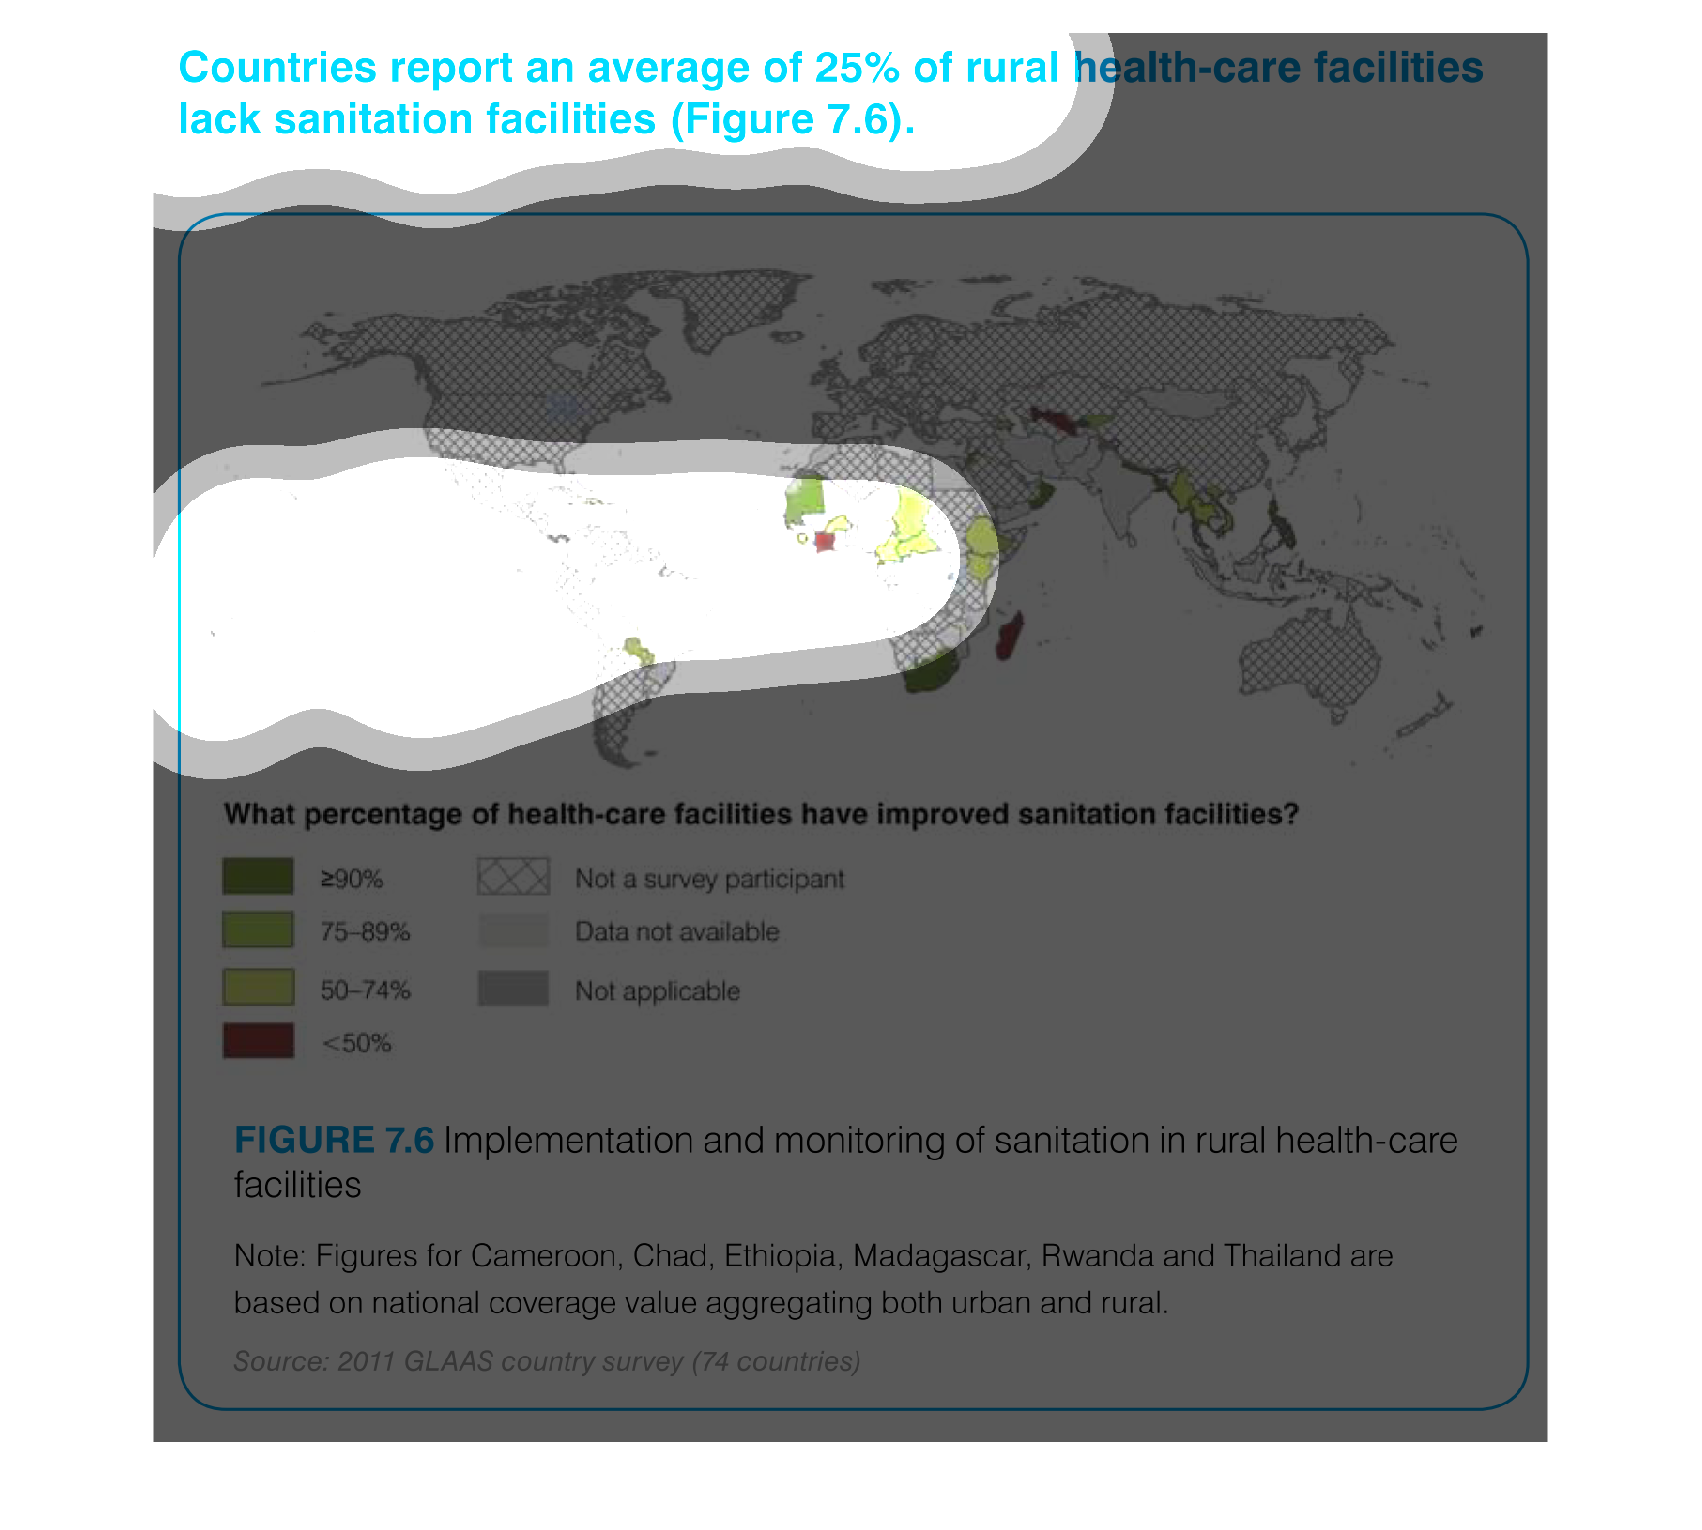
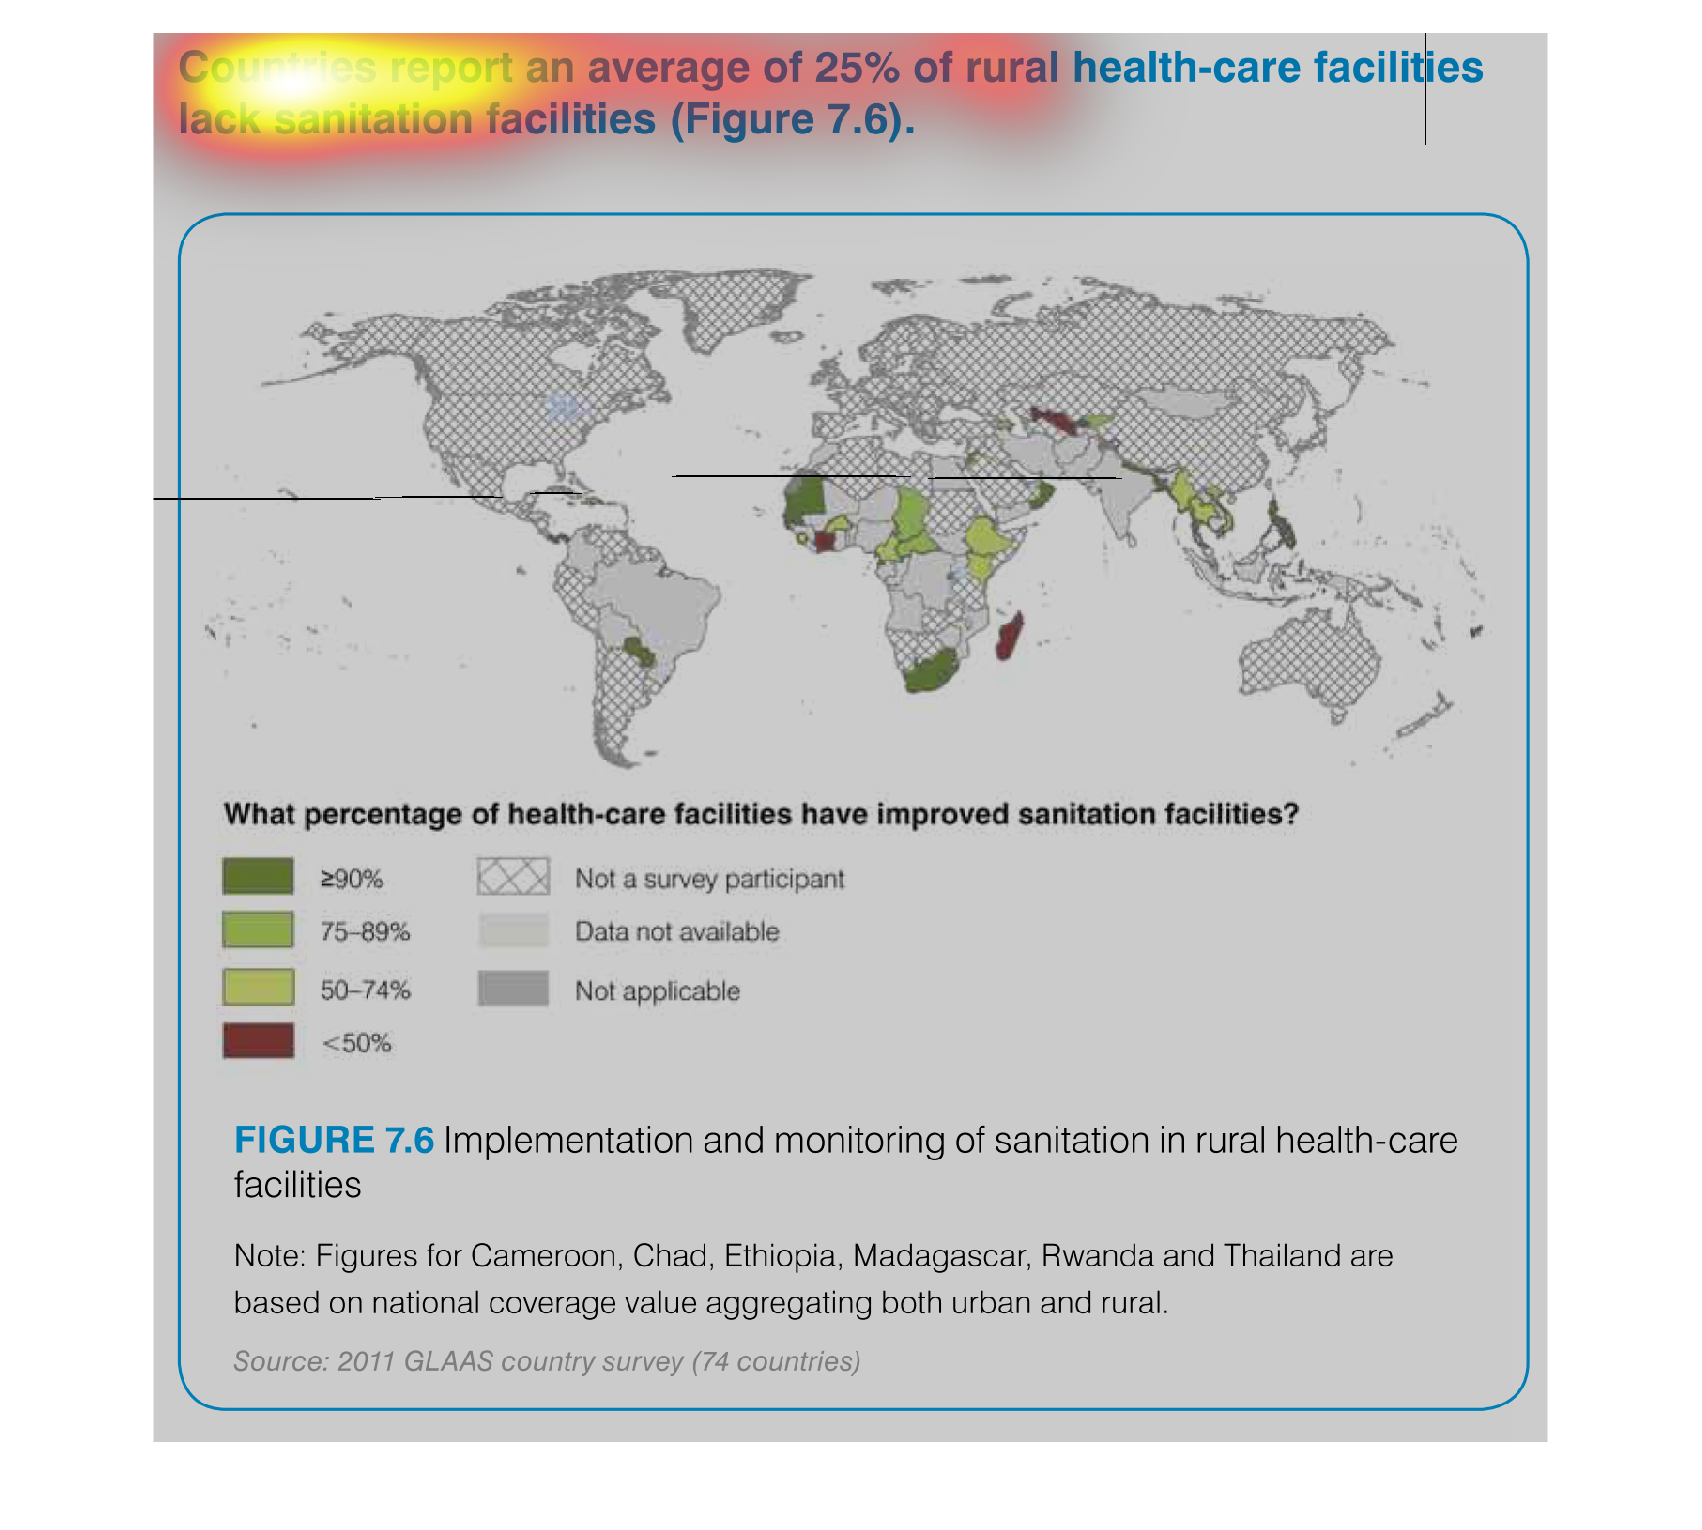
This is a heat map showing rural health care facilities and sanitation facilities globally
and claiming that as much as 25% of health care facilities lack appropriate sanitation.
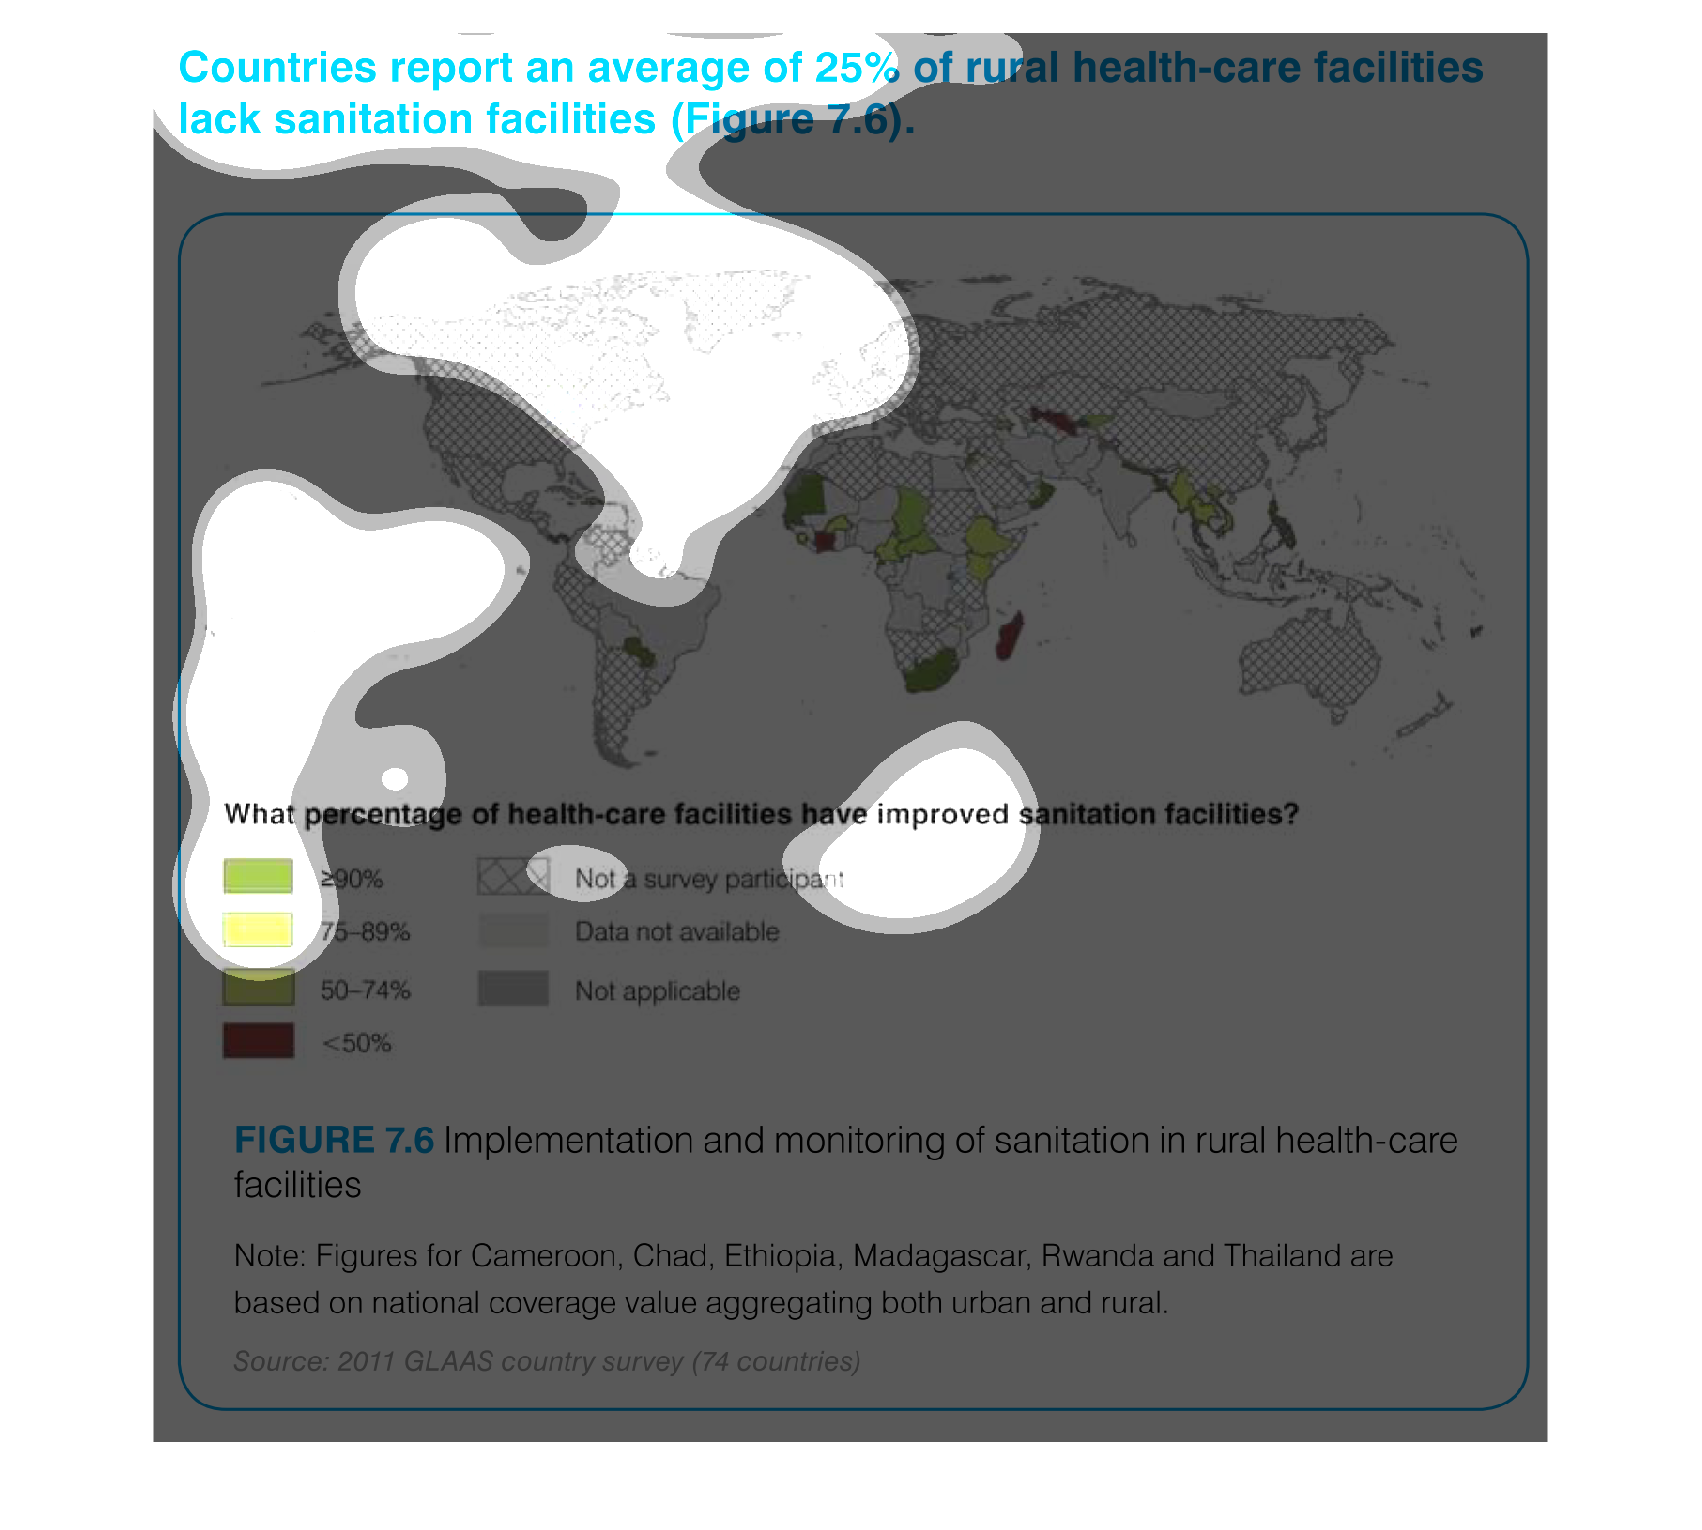
countries report an average of 25% of rural health care facilities lack sanitation facilities,
figure 7.6. we see a color coded world map highlighting the mediocrity of rural african nations
and south asian countries
The image depicts the lack of sanitation facilities in rural healthcare facilities in a number
of countries within Africa as well as parts of China. Overall, 25% of rural healthcare facilities
lack sanitation facilities. Africa struggles with low numbers of sanitation facilities, while
parts of China also lack sanitation facilities.
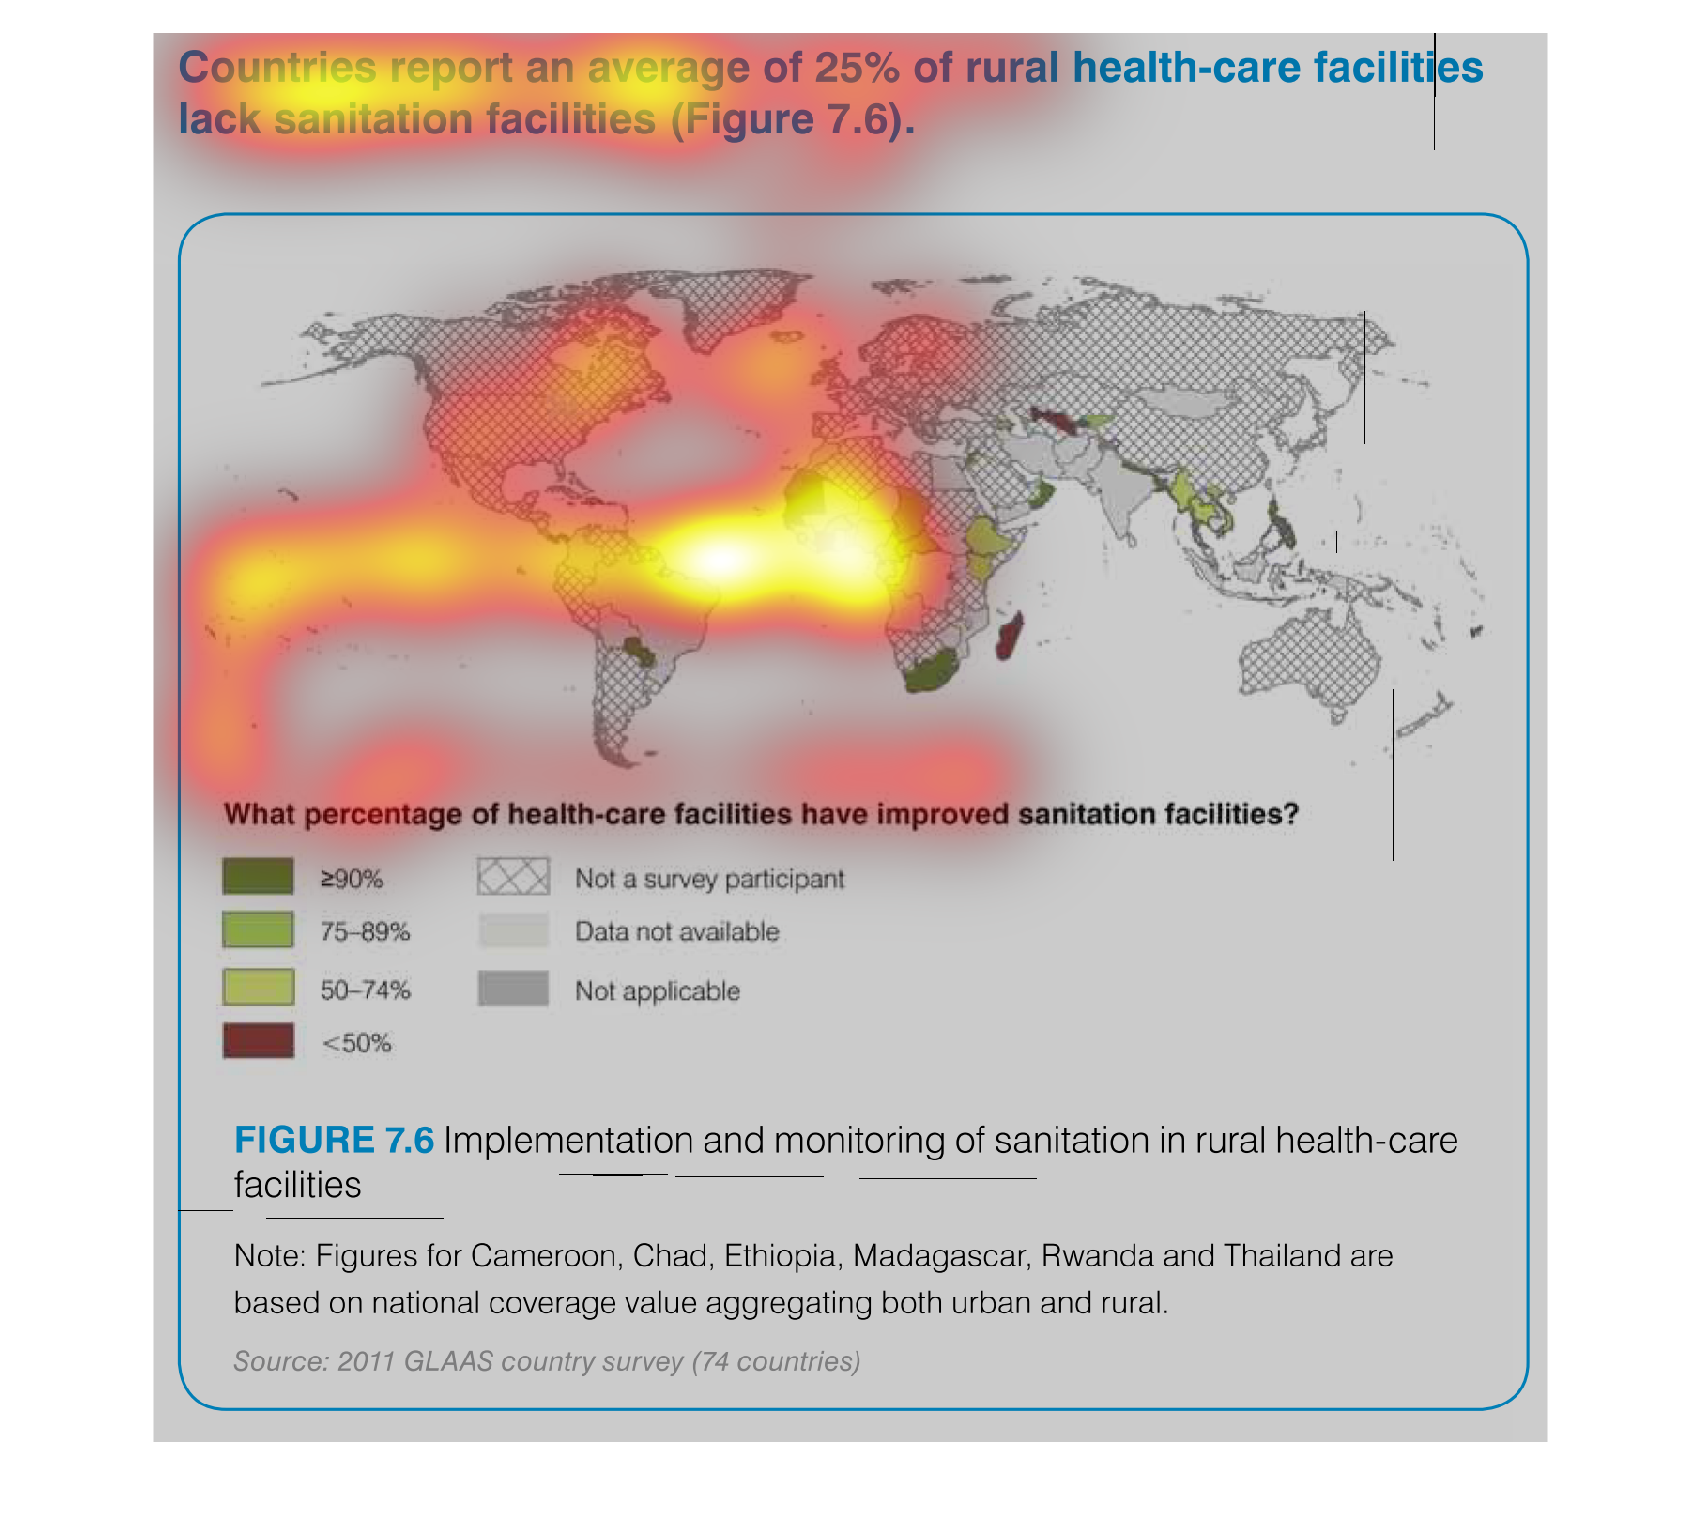
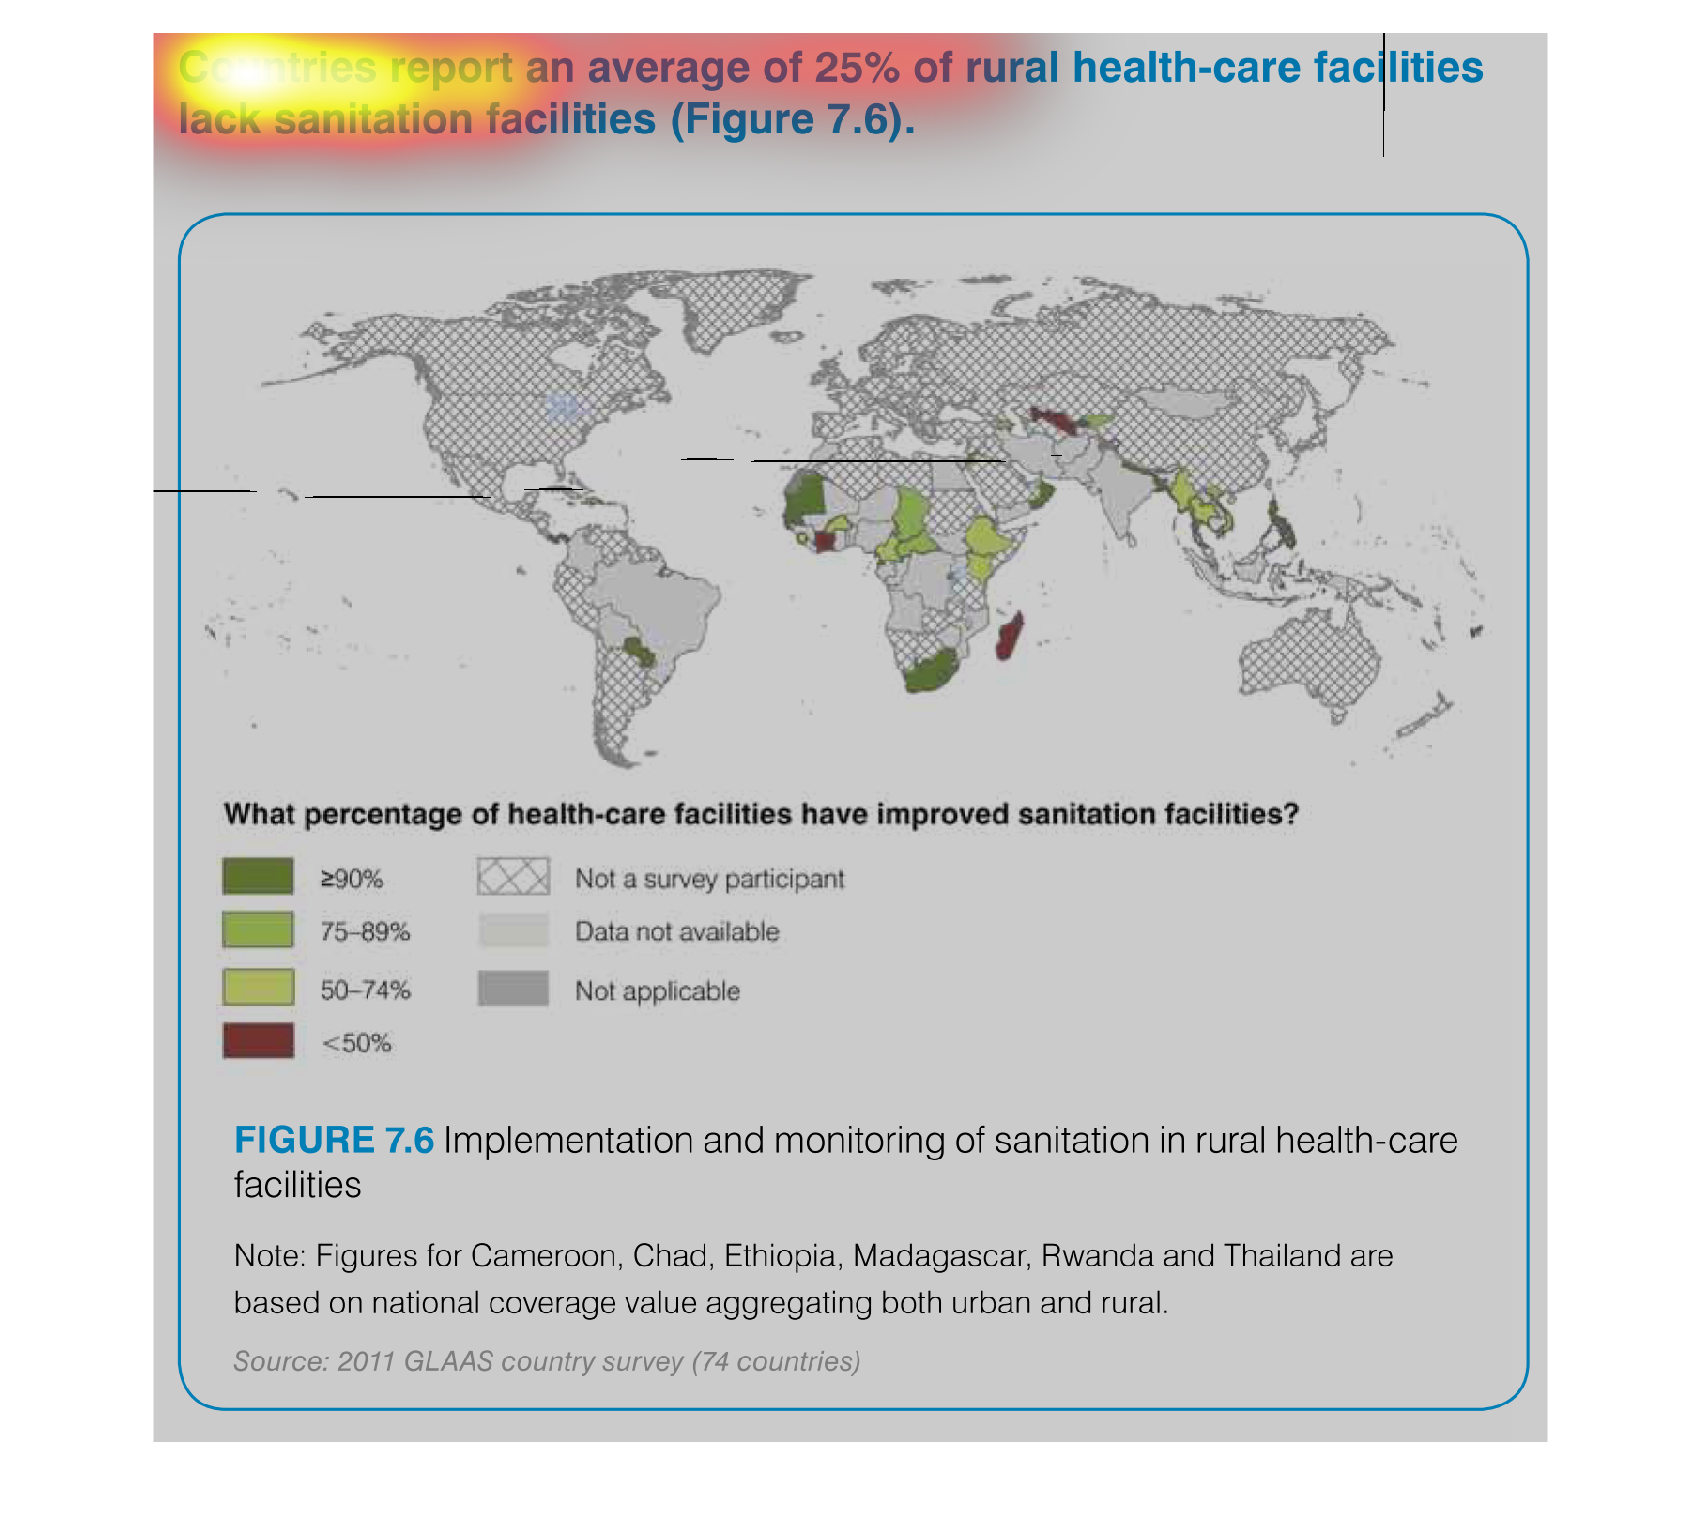
This chart describes countries report an average of twenty-five percent of rural health care
facilities lack of sanitation facilities. Categories are represented by different colors.
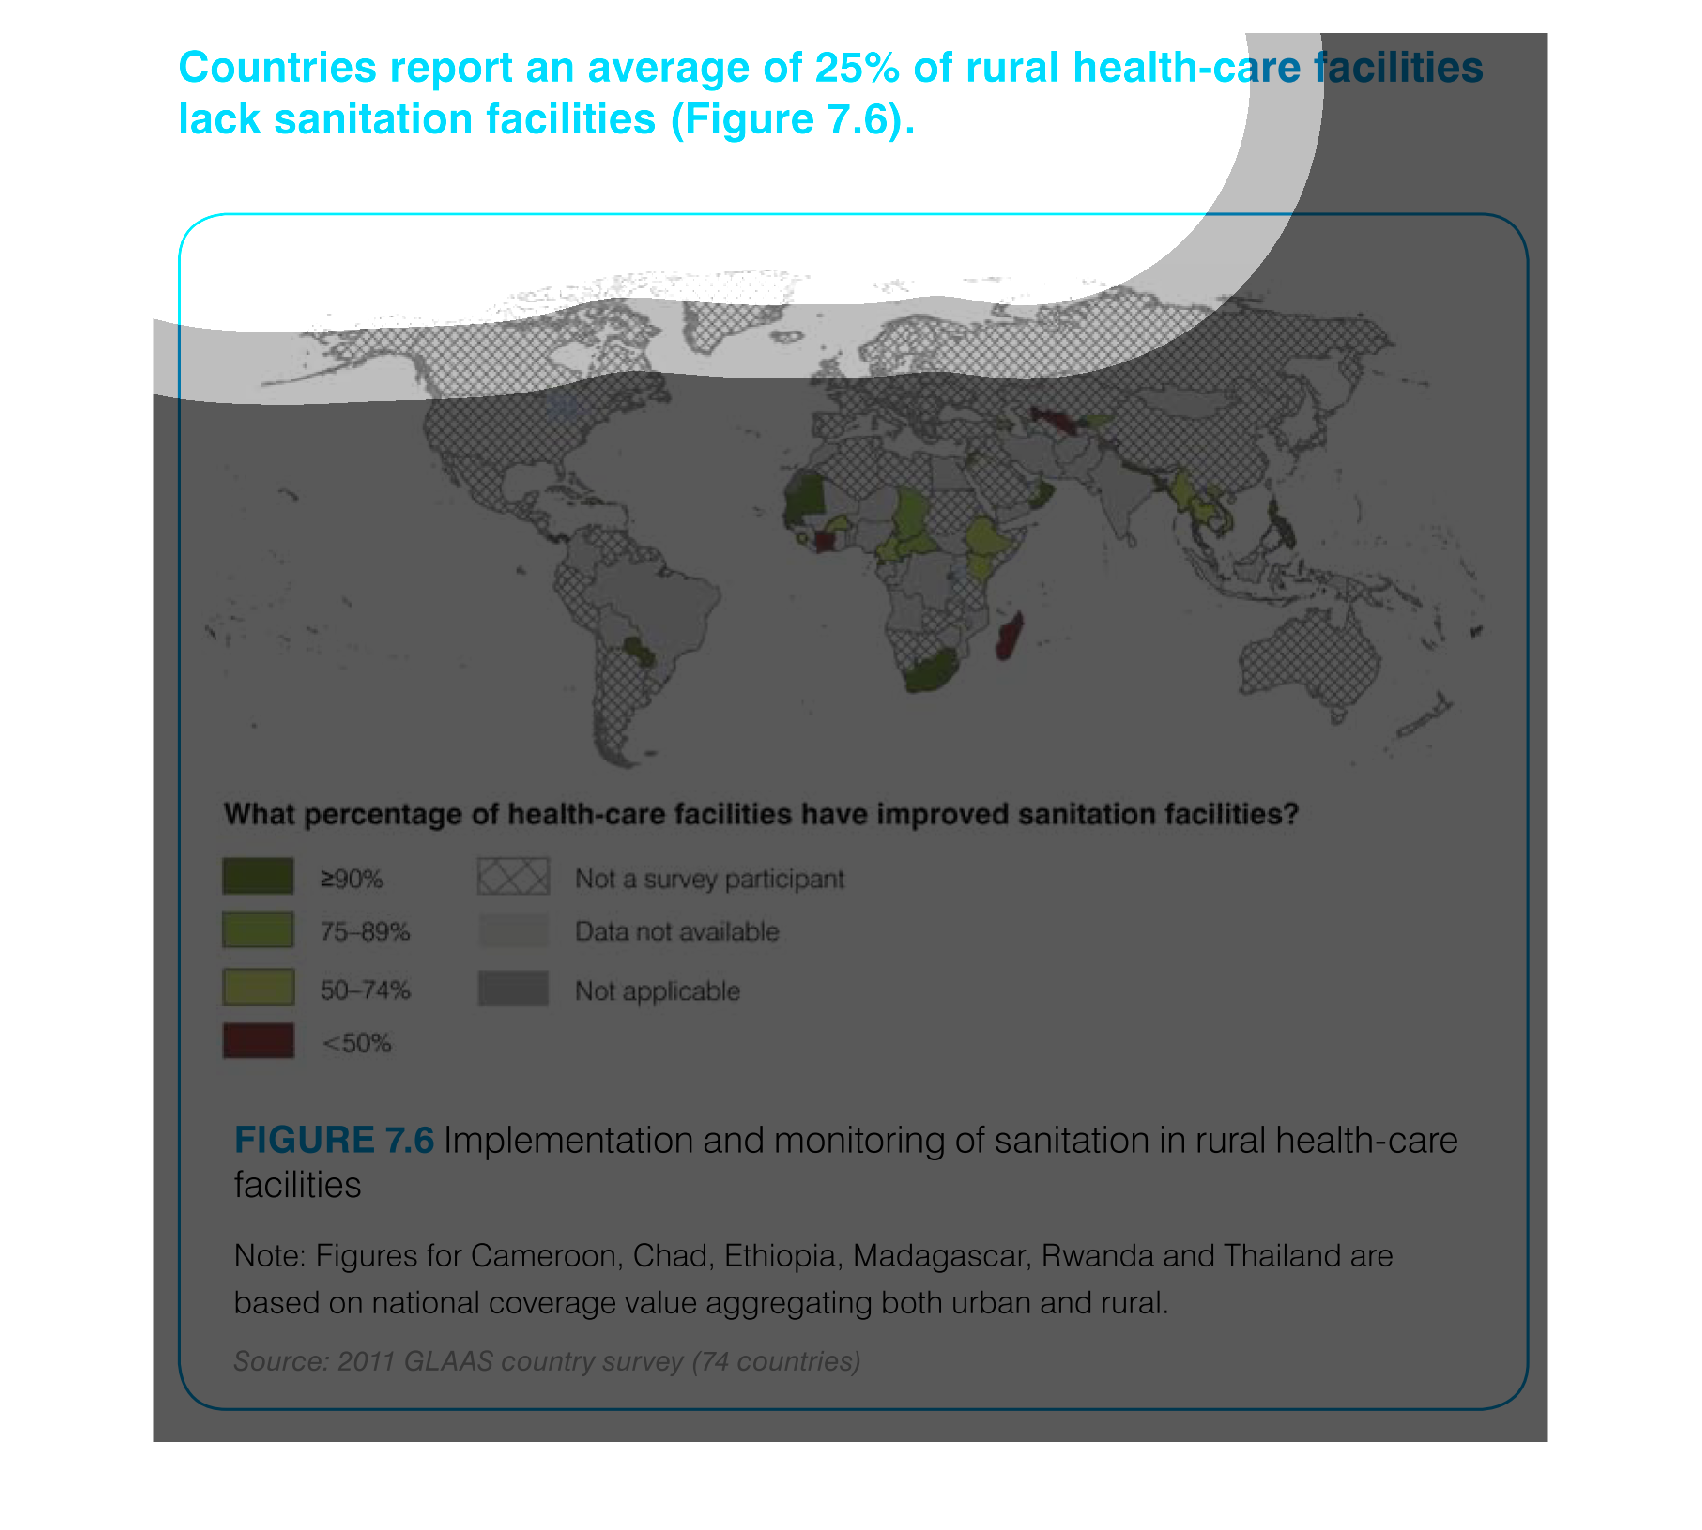
The graph shows what countries increased and improved the number of sanitation facilities
in rural health-care facilities. We can see that some countries in Africa improved and increased
by 290%, while others only improved and increased by less than 50%. We can see that across
the globe, excluding Africa, there was not much improvement.
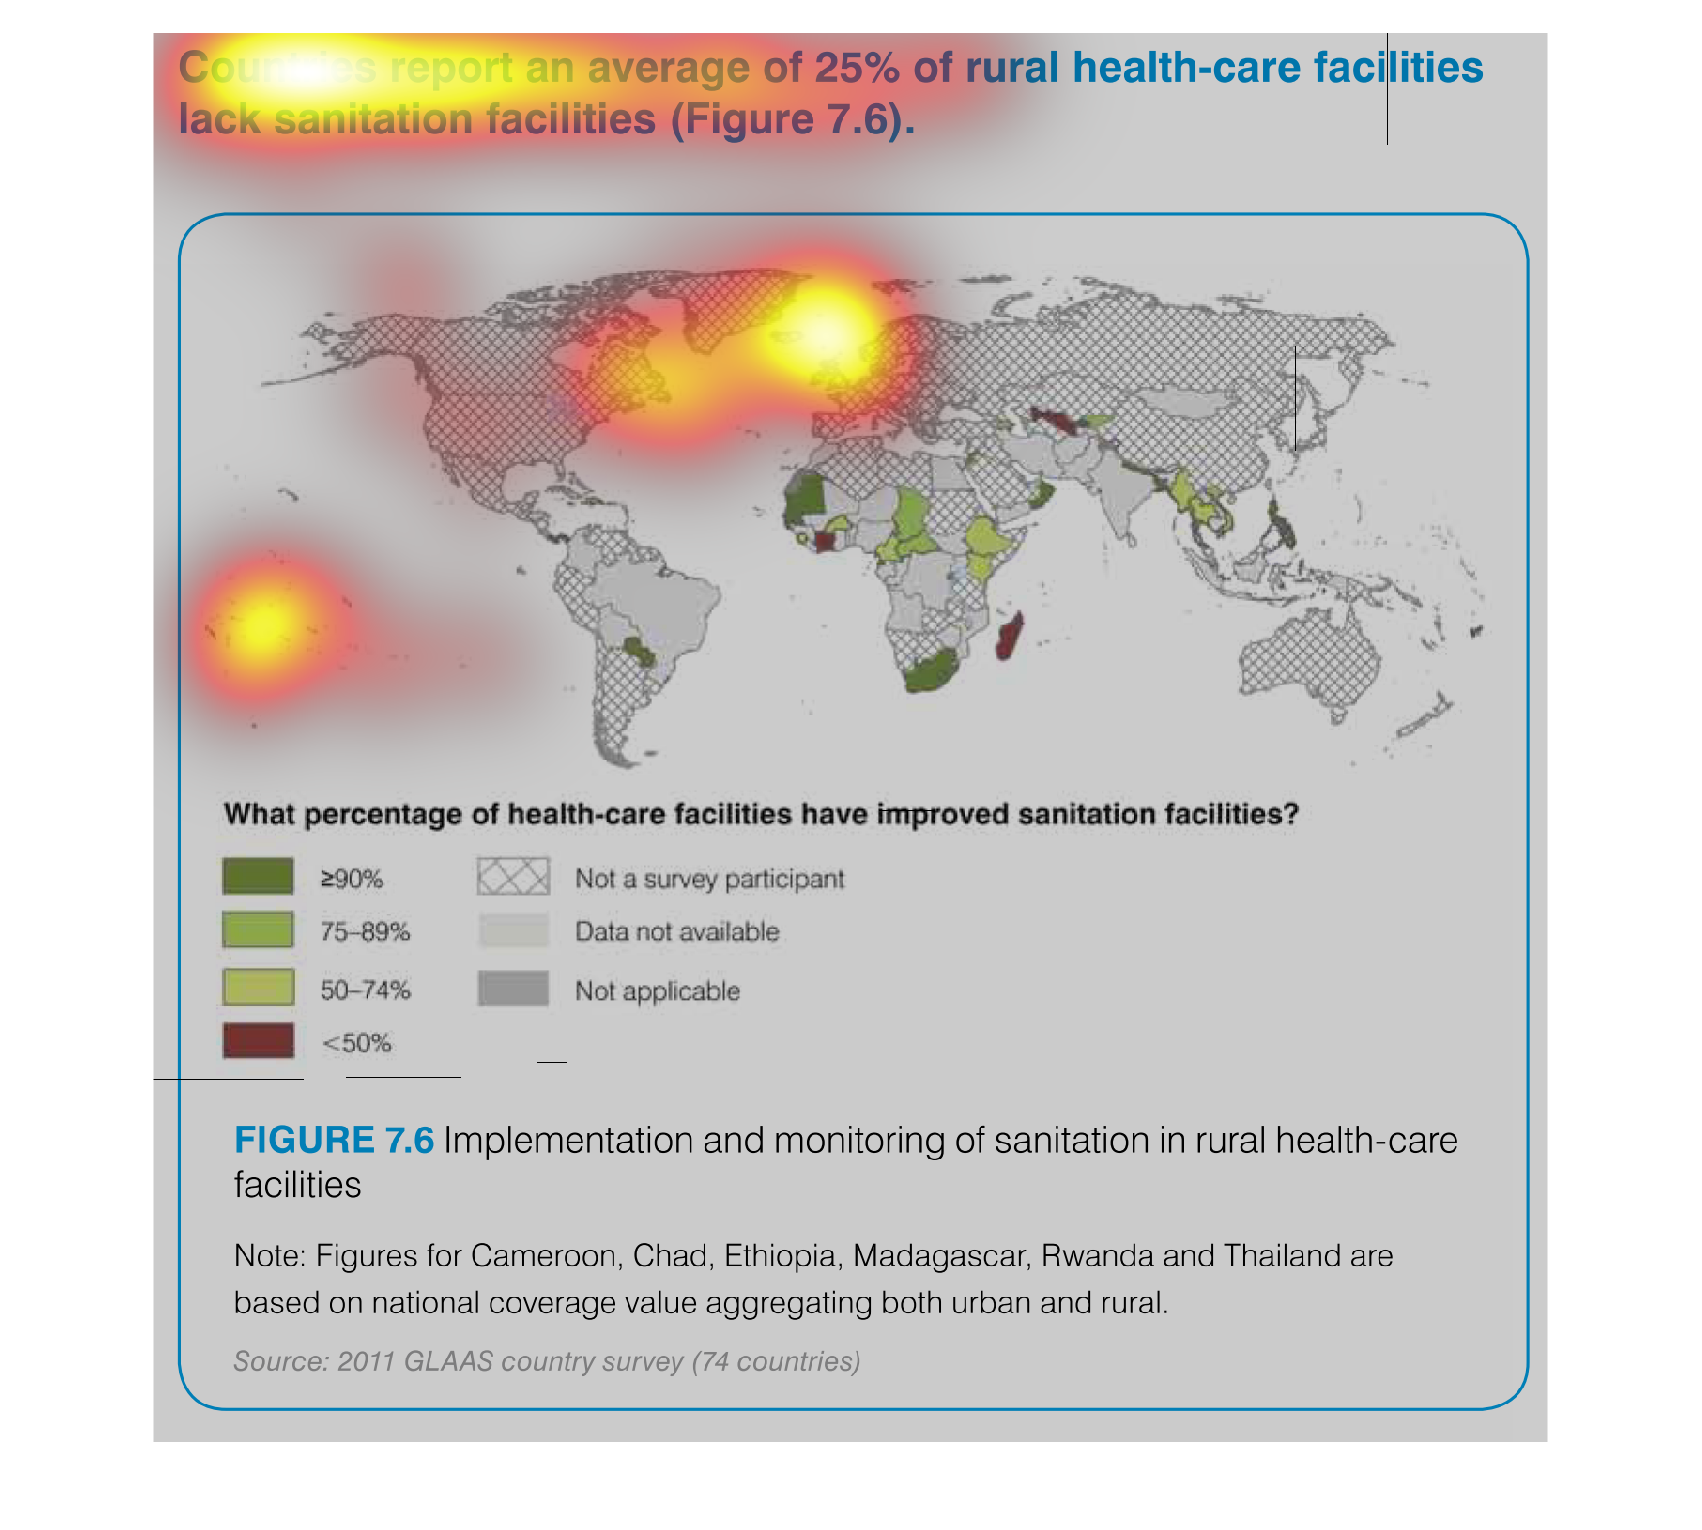
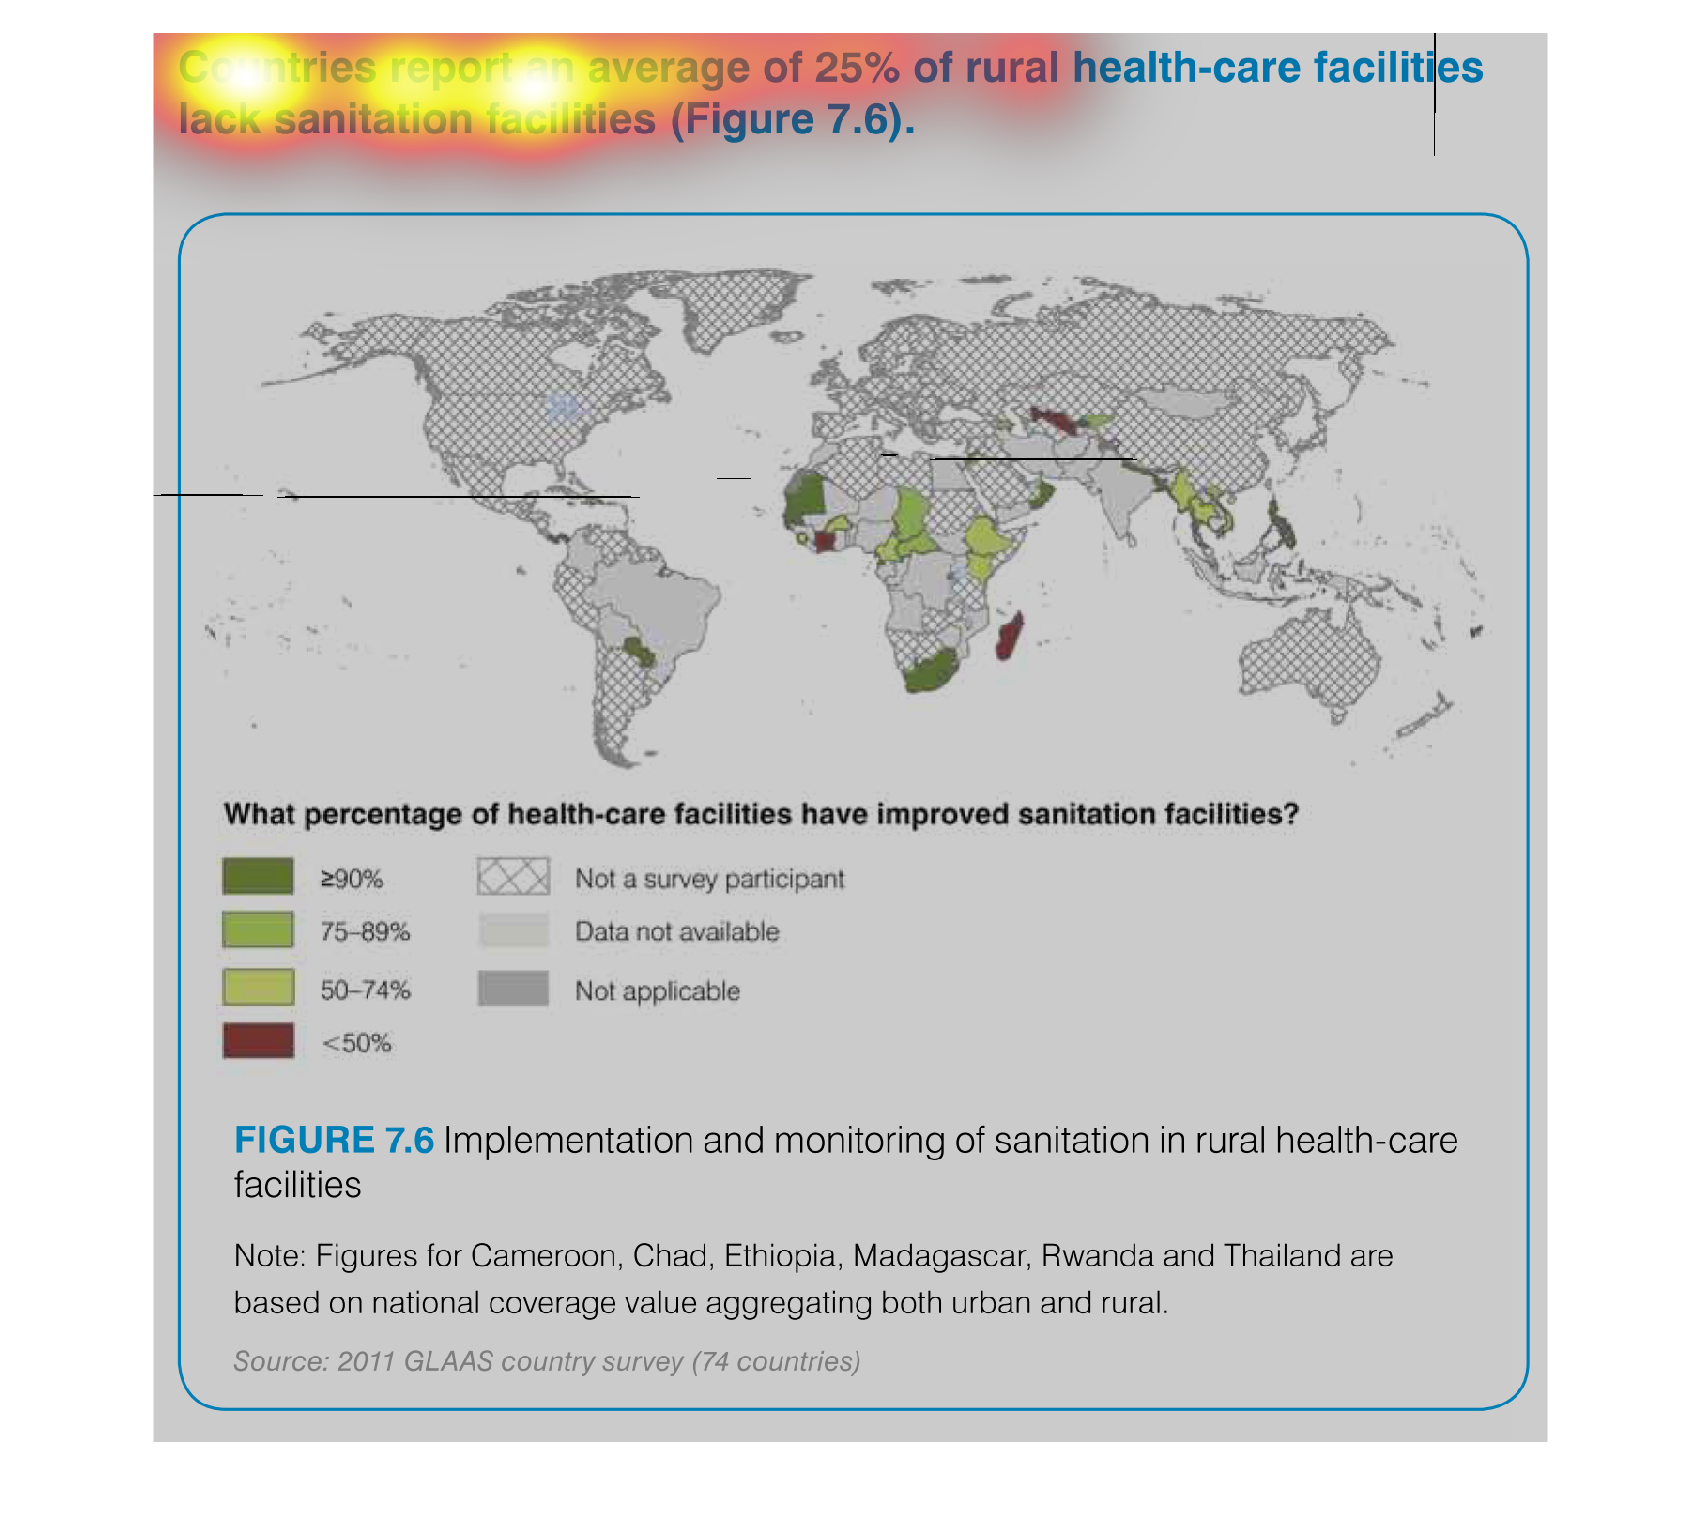
this is a chart on the percentage of health care facilities that have improved sanitation
across the world. The chart is color coded to show the percentage of facilities implementing
sanitation.
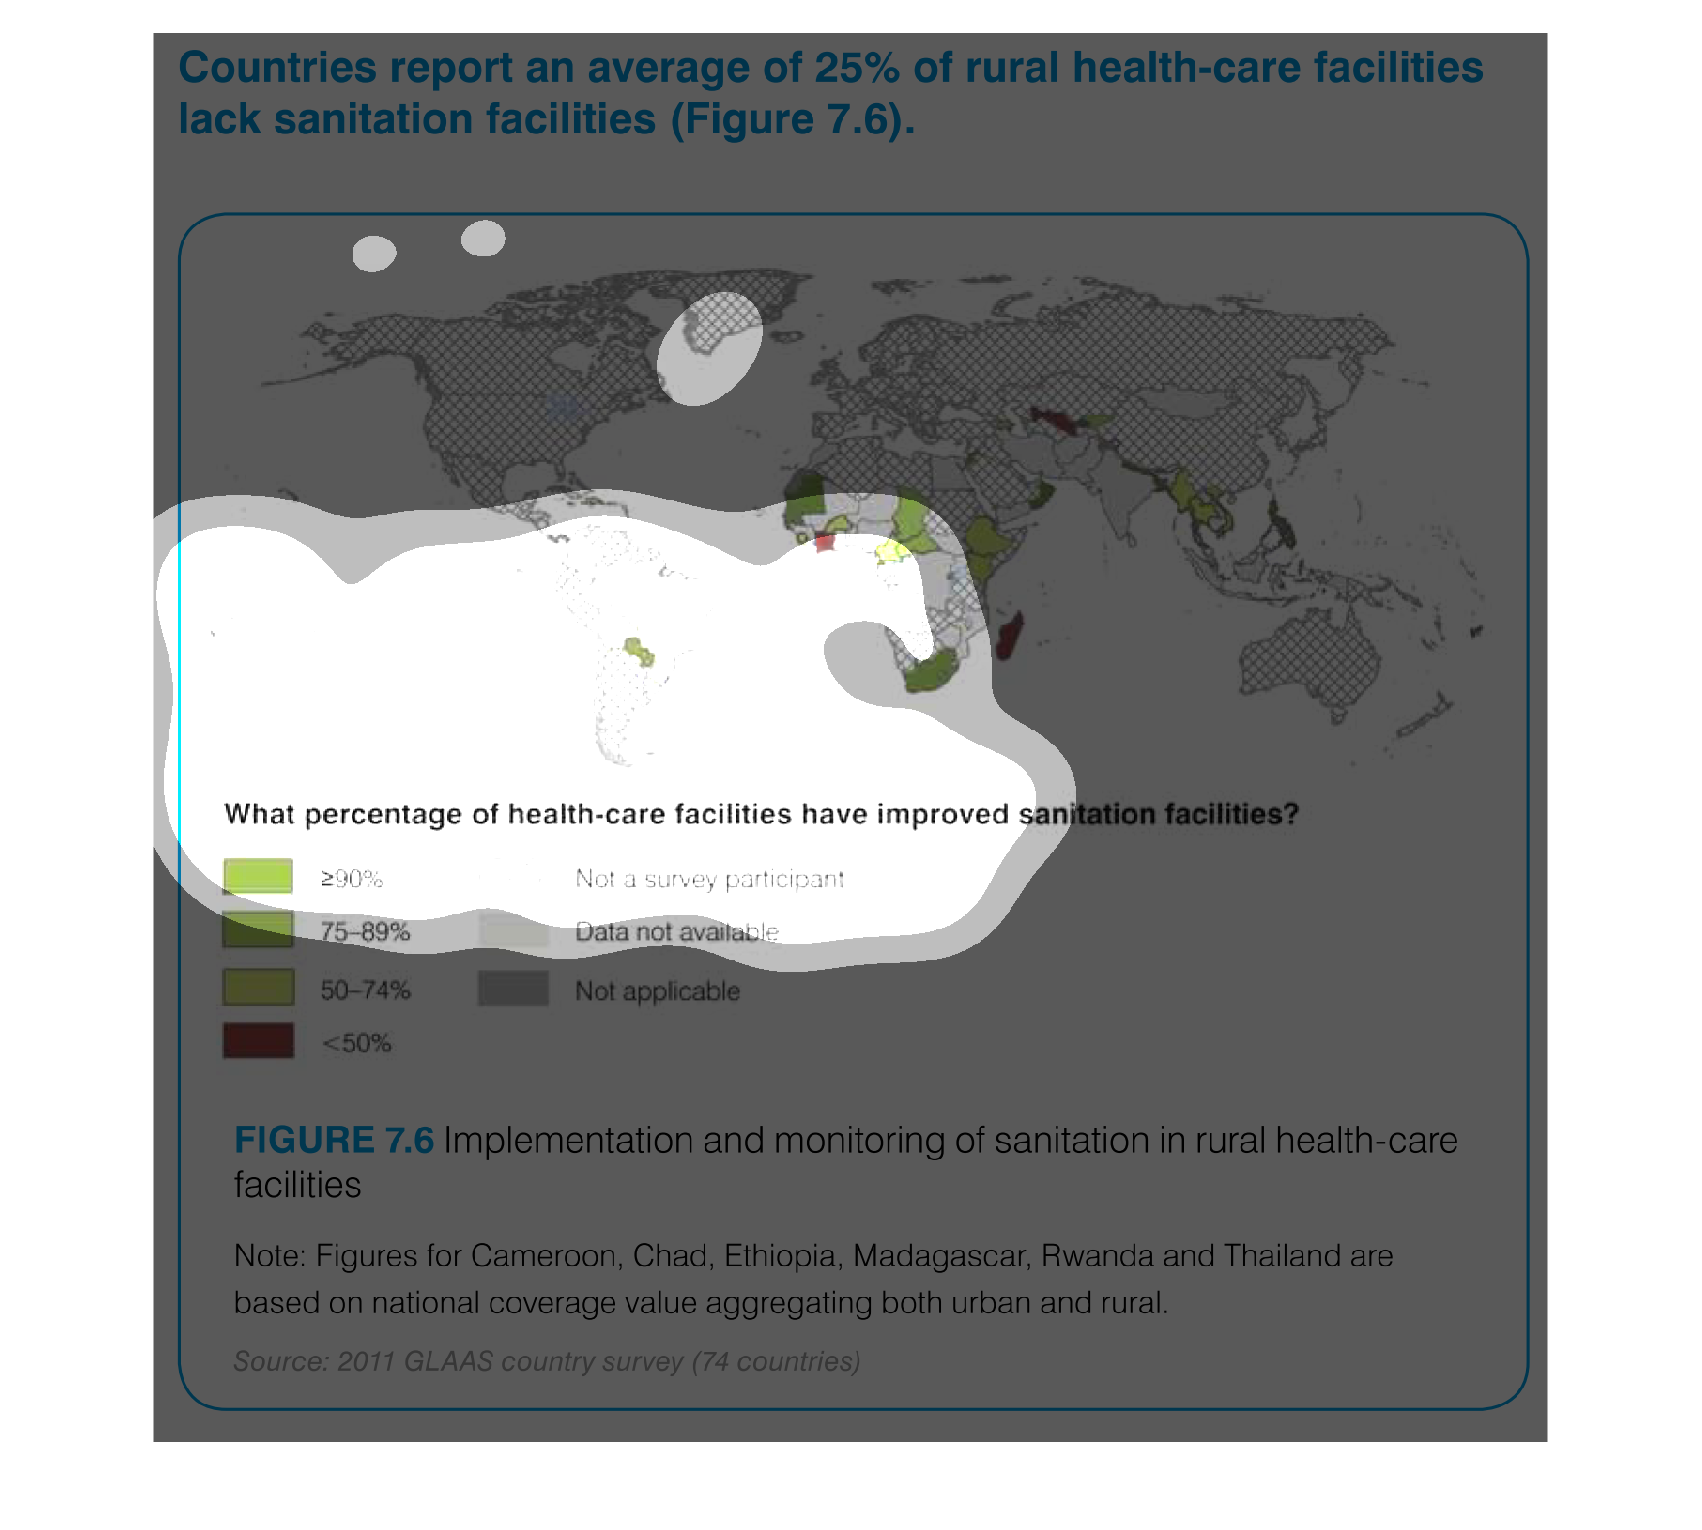
This chart shows the percentage of improvement in sanitation facilities in some countries
in the world map, this char only refers to those countries who have reported an average of
25% of lack of sanitation facilities in their rural health facilities .We can see Paraguay
is the only country in America Continent that has big numbers regarding this matter and some
countries in Africa and in South Asia also show big numbers of improvement
The map included shows images, by country, of how much improvement each country has in reference
to the sanitation of their medical facilities. Survey consists mainly of African and Eastern
European nations. United States was not a participant.