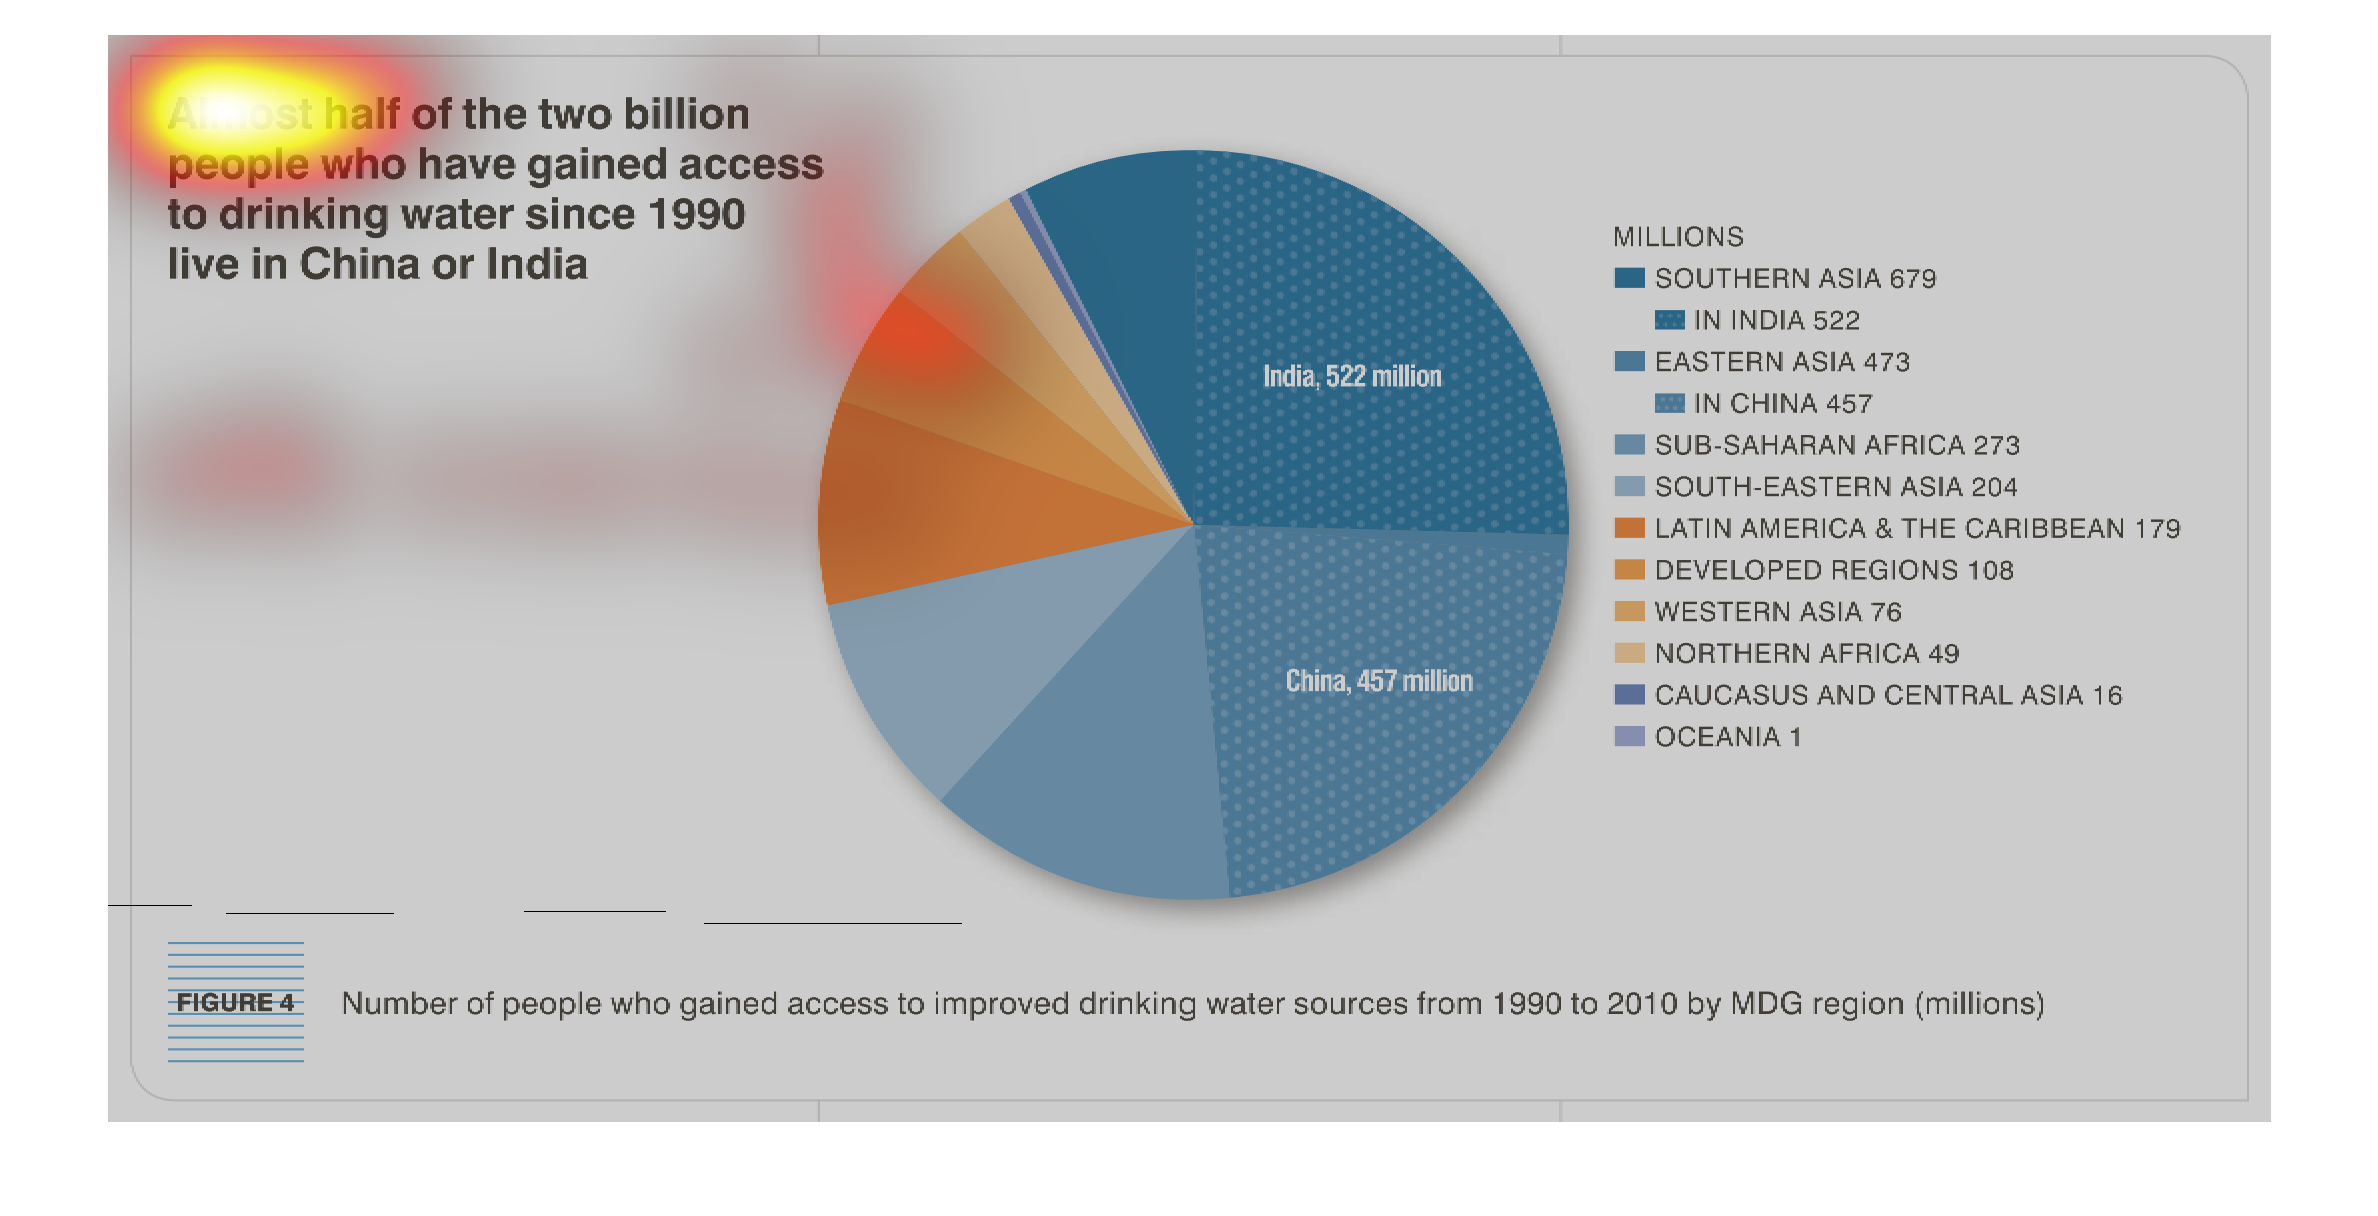
This pie chart shows the distrubition of population that has gained access to clean drinking
water since 1990 until 2010. It denotes that almost half life in india and china.
This is a circle chart of the percentage of people that have gained access to drinking water
since 2002. The majority of the chart is made up and India.
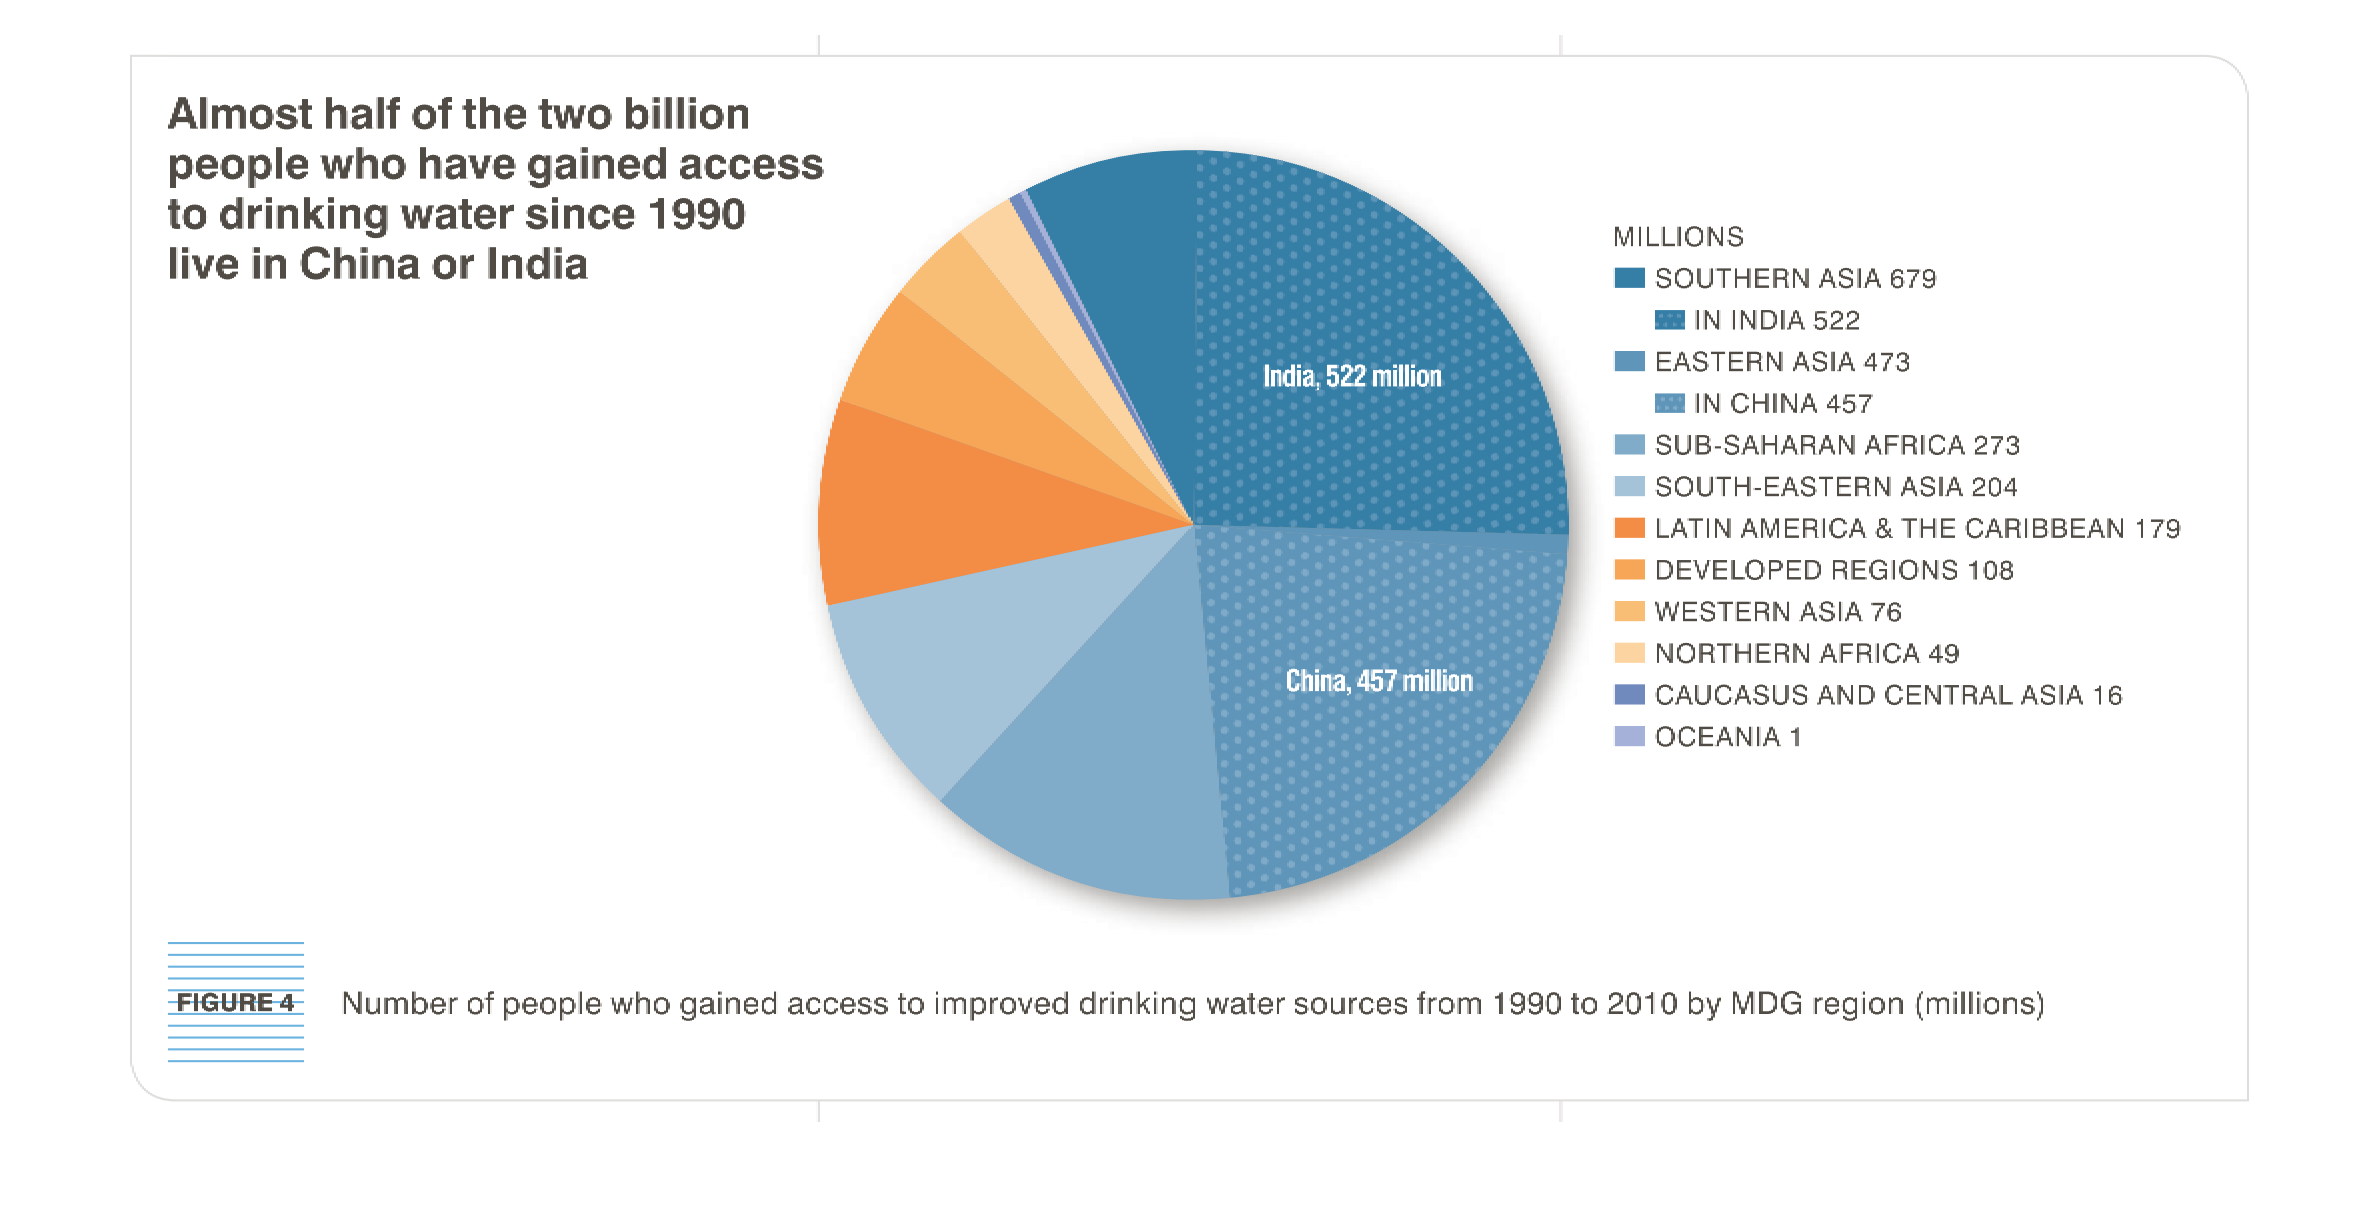
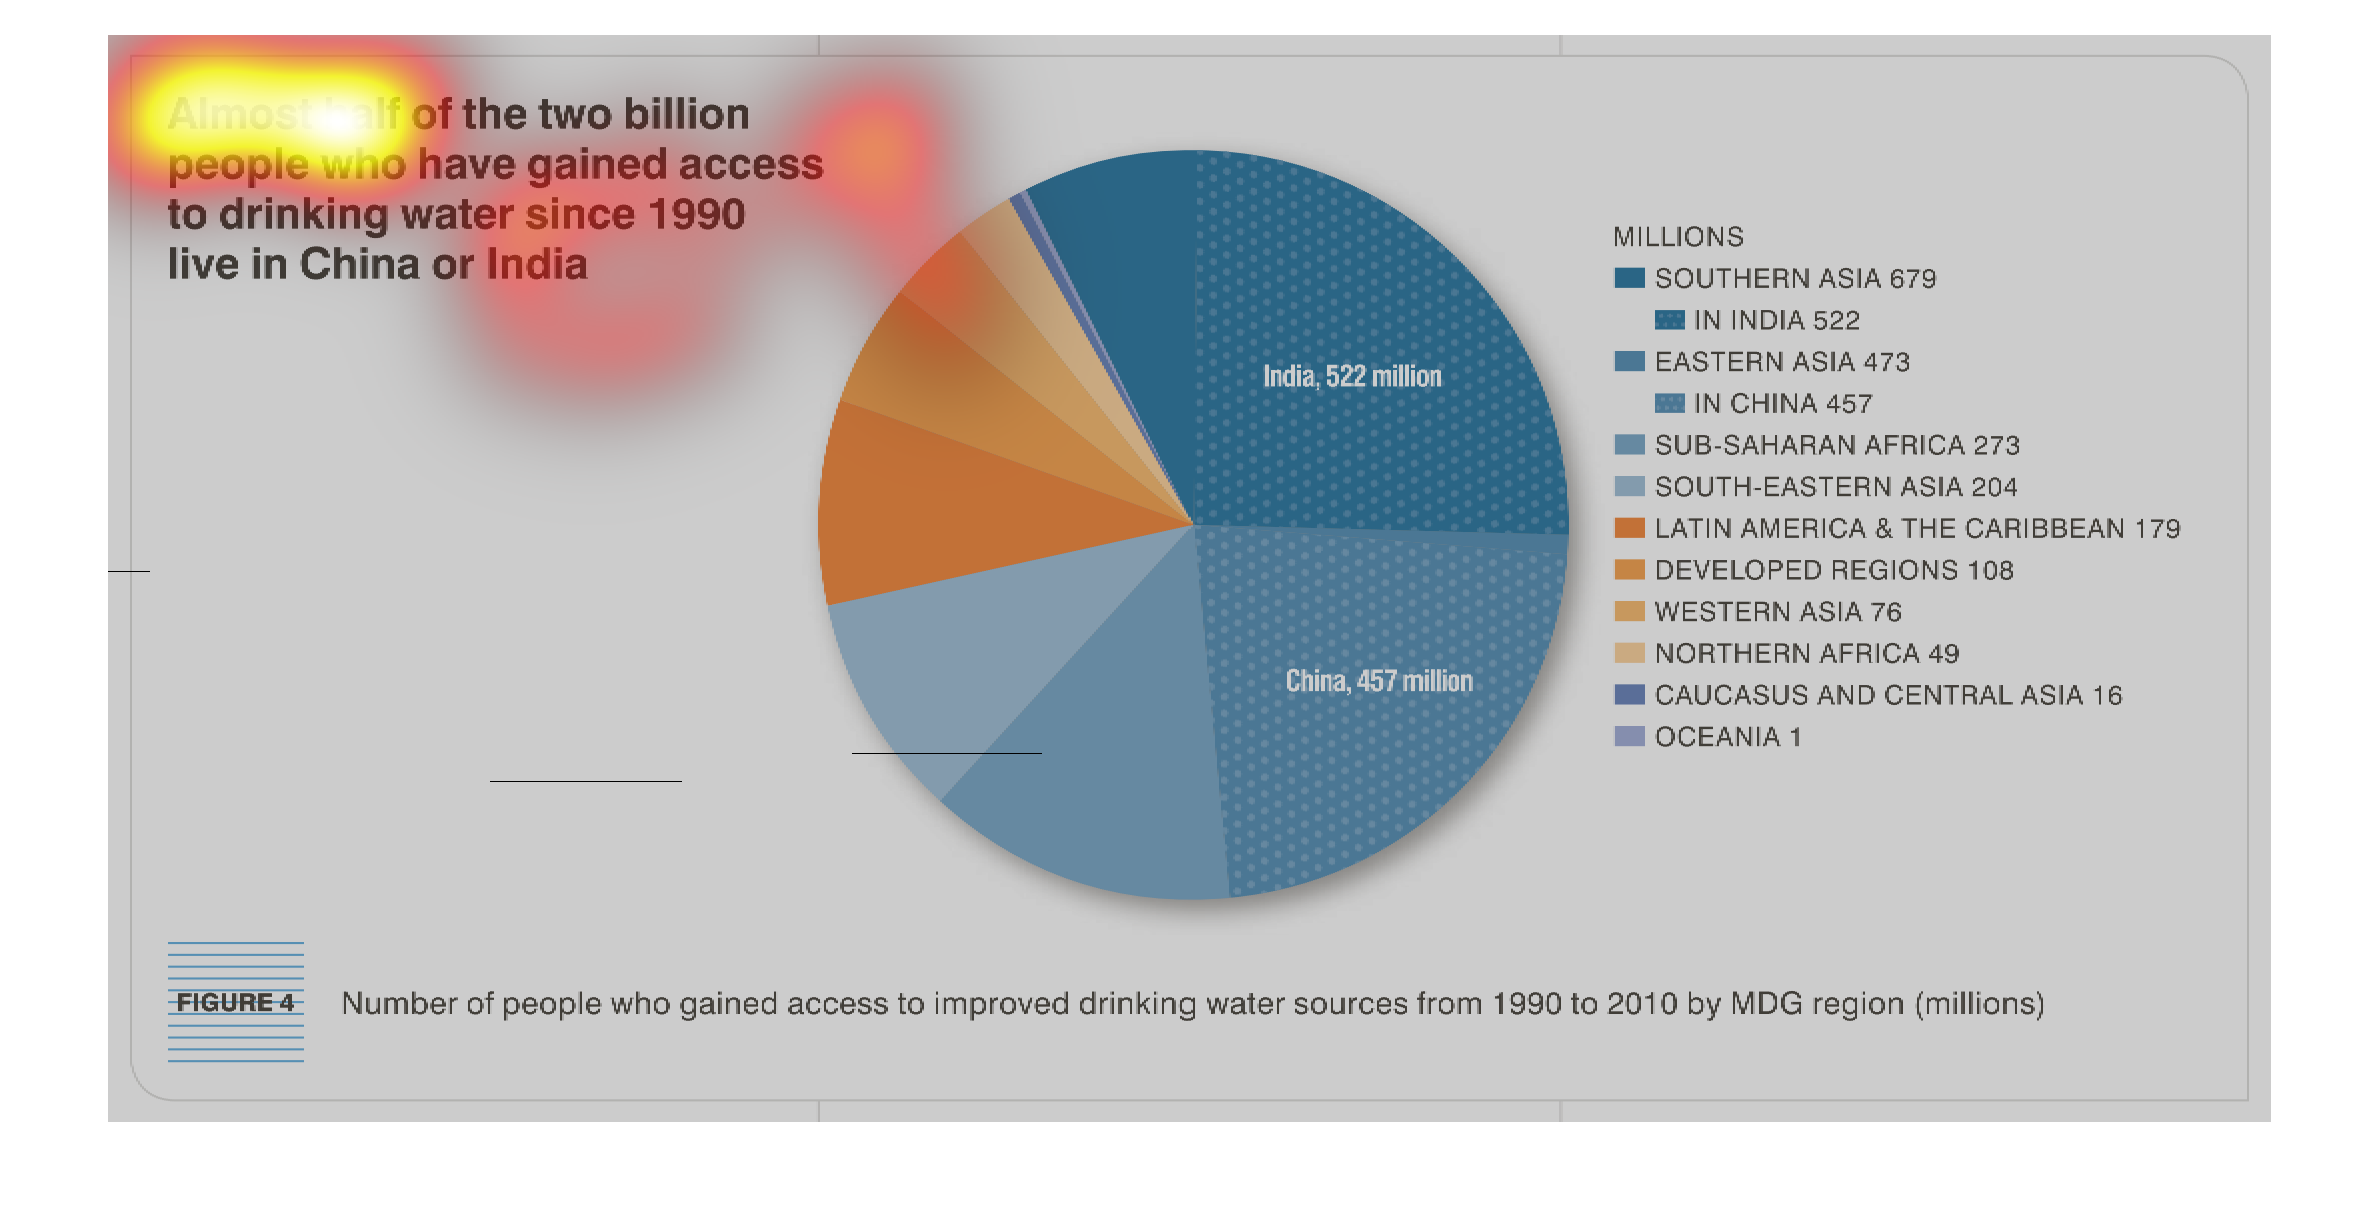
This chart describes that almost half of the two billion people who have gained access to
drinking water since 1990 live in China or India. Different categories are included.


This study conducted from 1990-2010, shows how the effects of the accessibility of drinkable
water in China has affected a wide variety of its demographic in this nation.
The graph depicts a chart of who has access to drinking water. The analysis of the chart shows
that over half the people in the world that have access to drinking water live in China or
India.


Pie graph displaying the volume of people that gained access to improved drinking sources.
 The percentages shown break down the region where the population is concentrated.
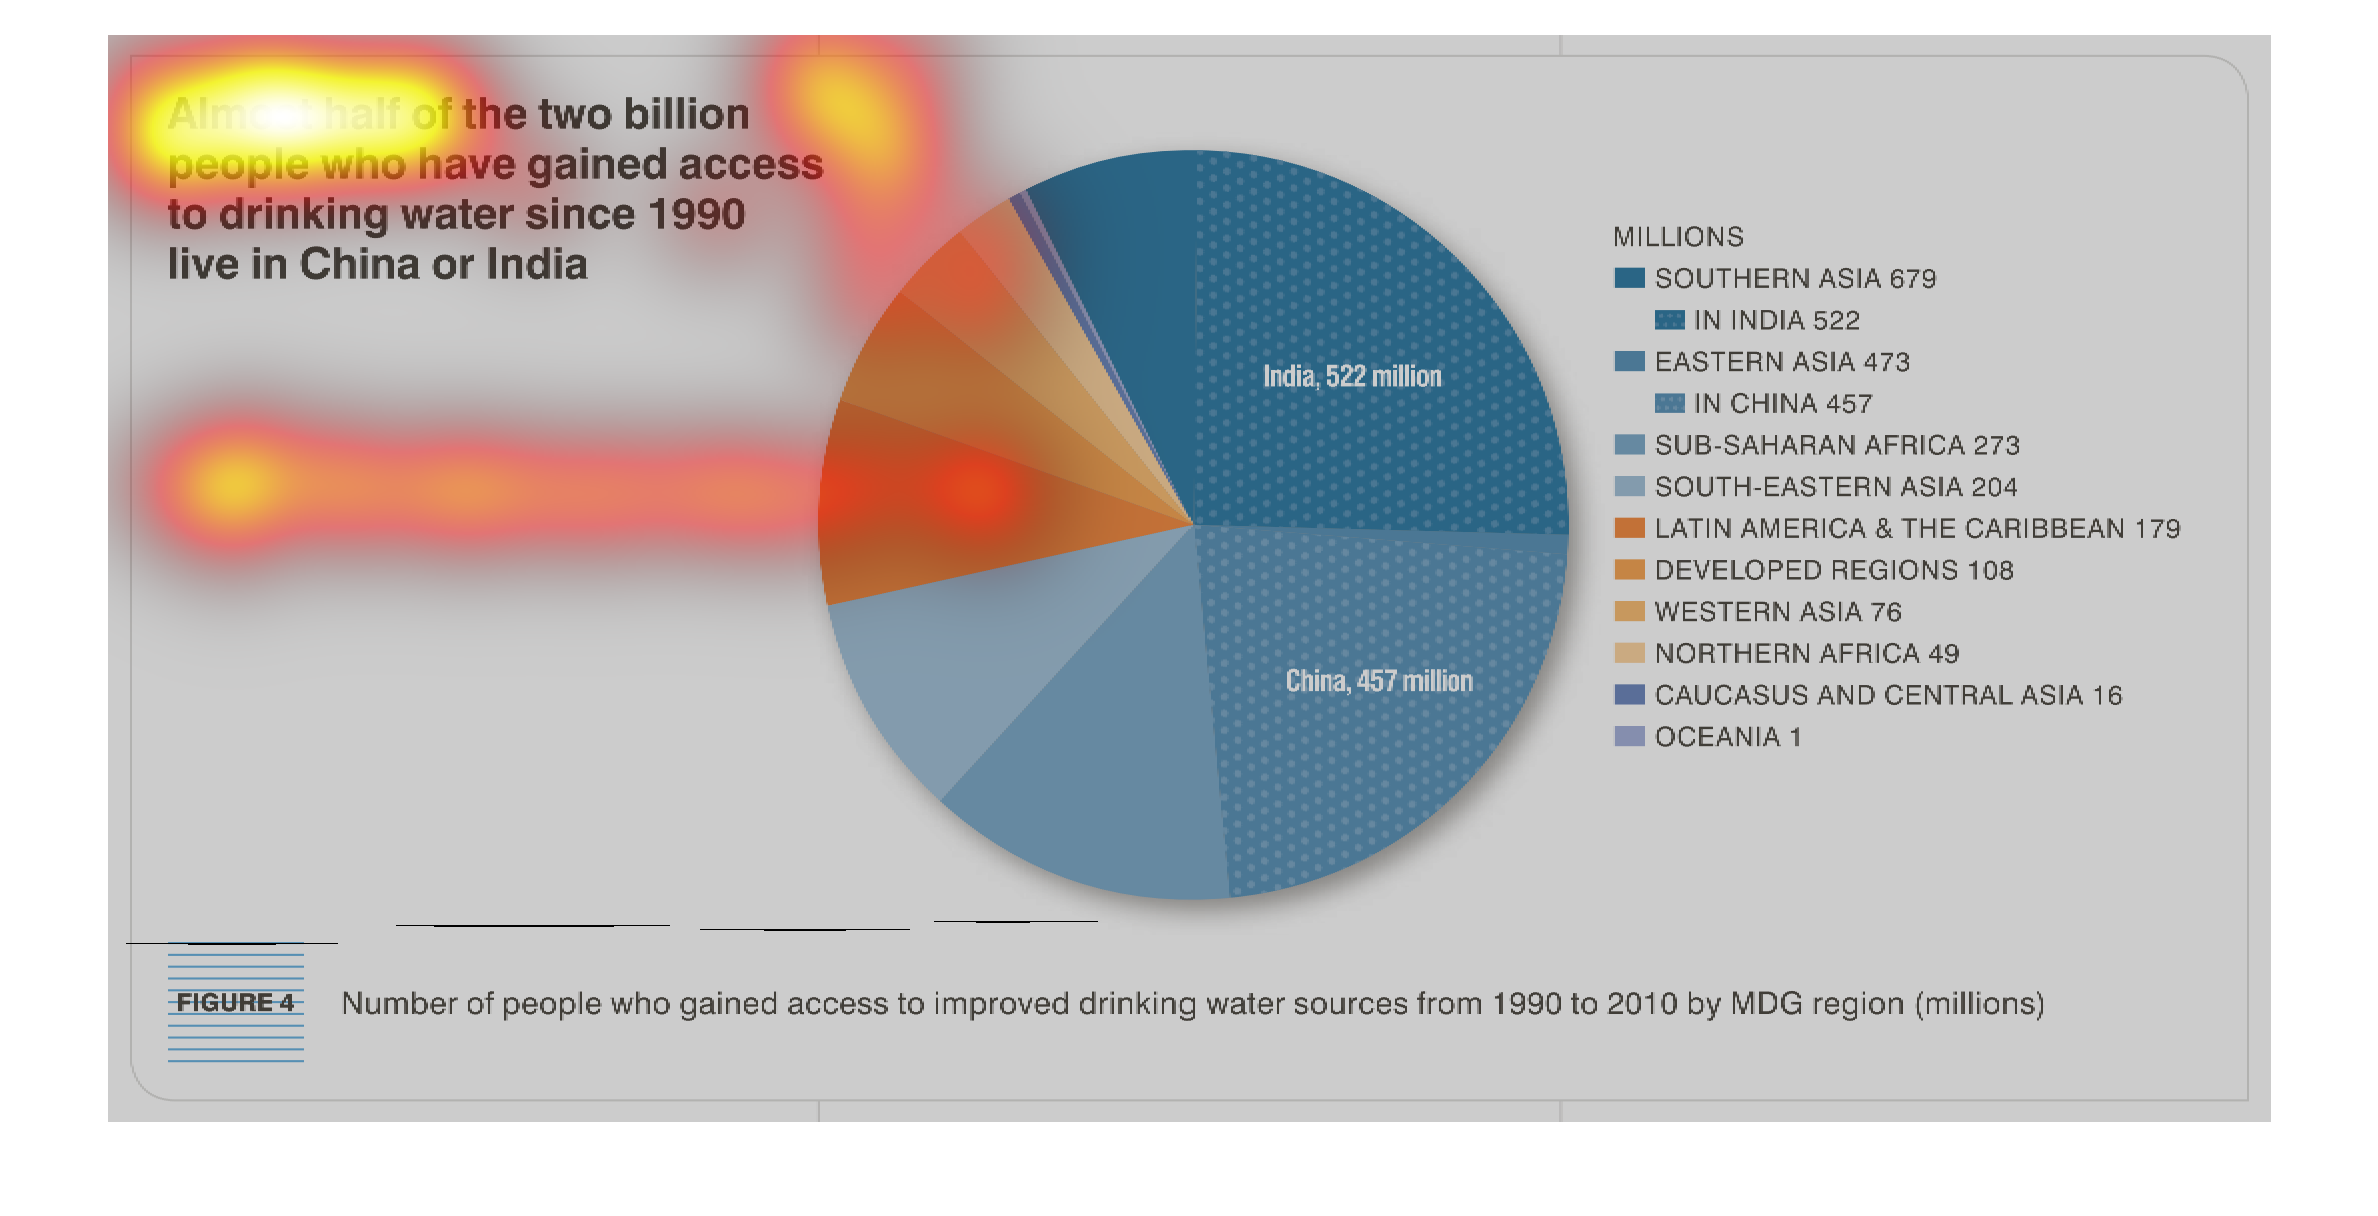
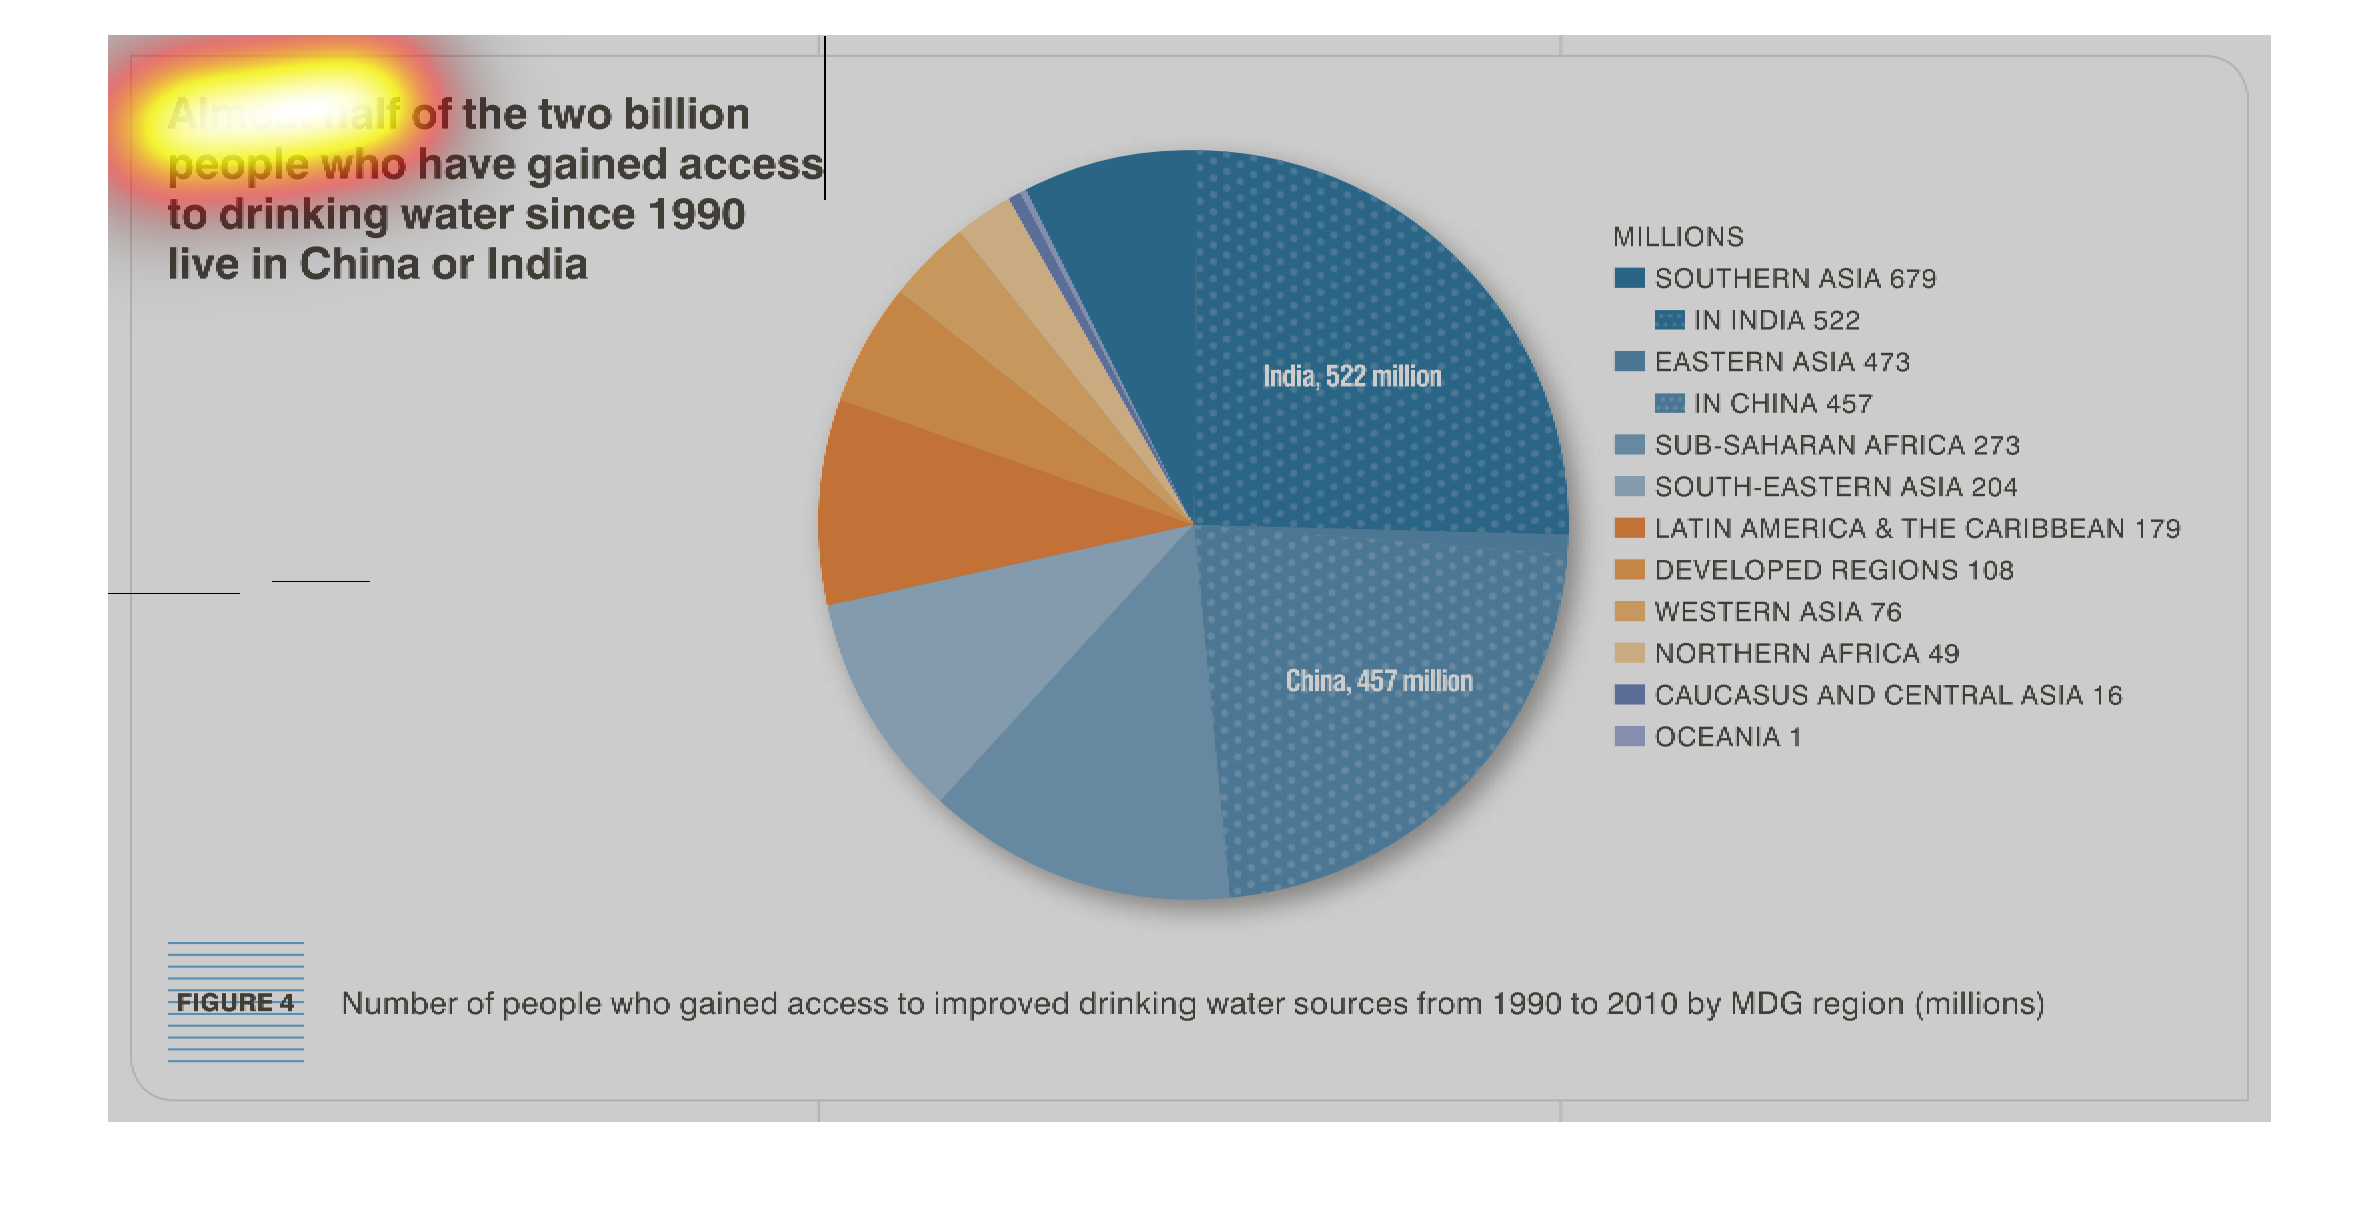
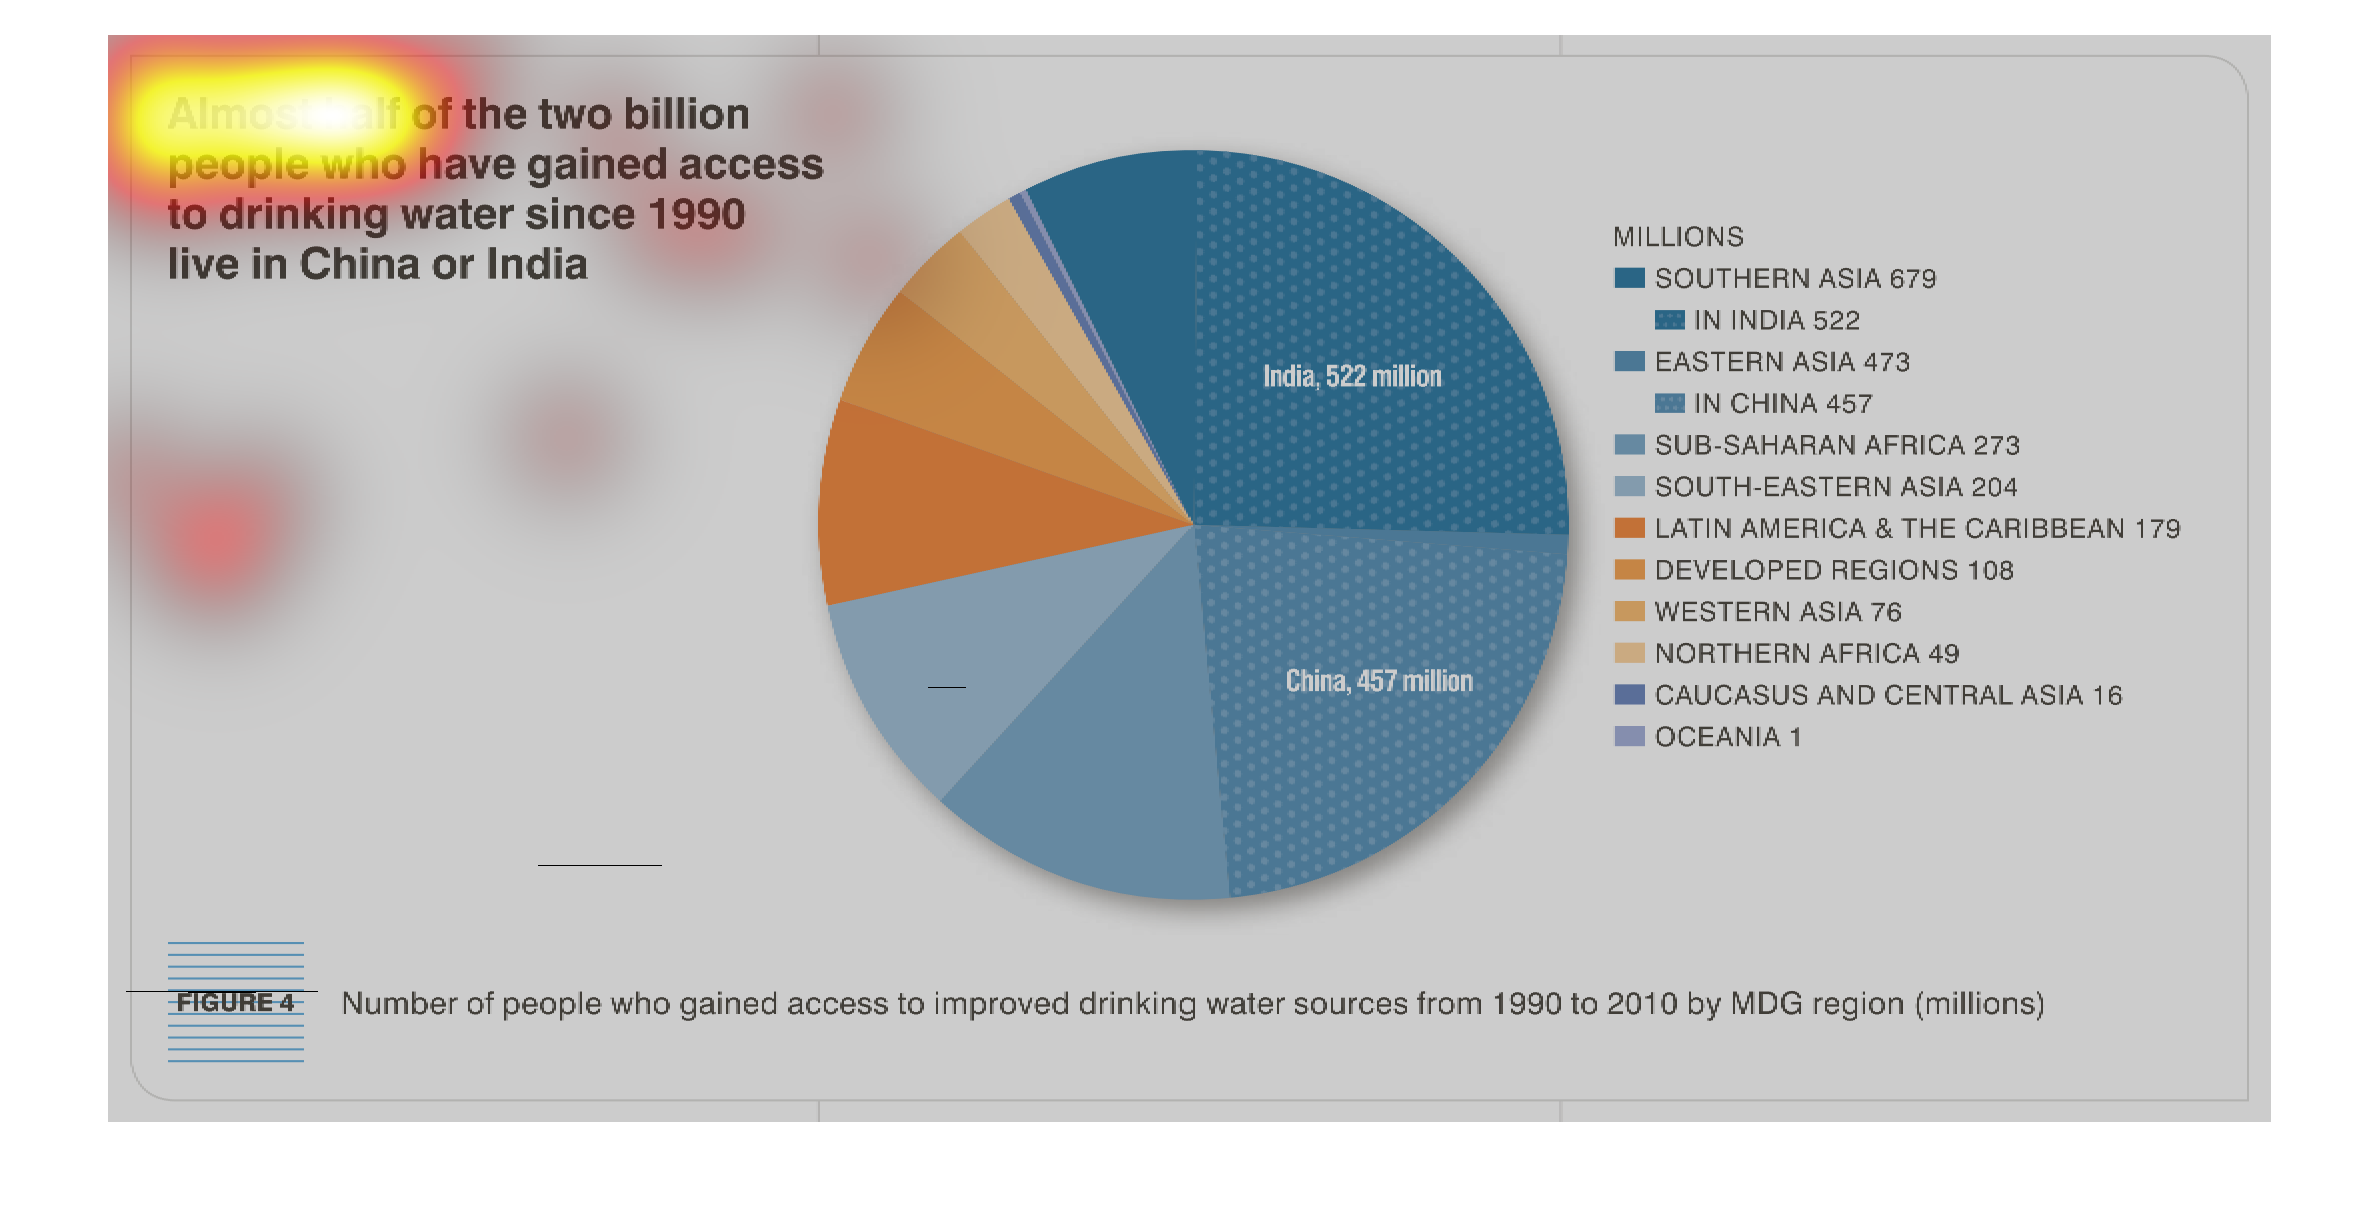
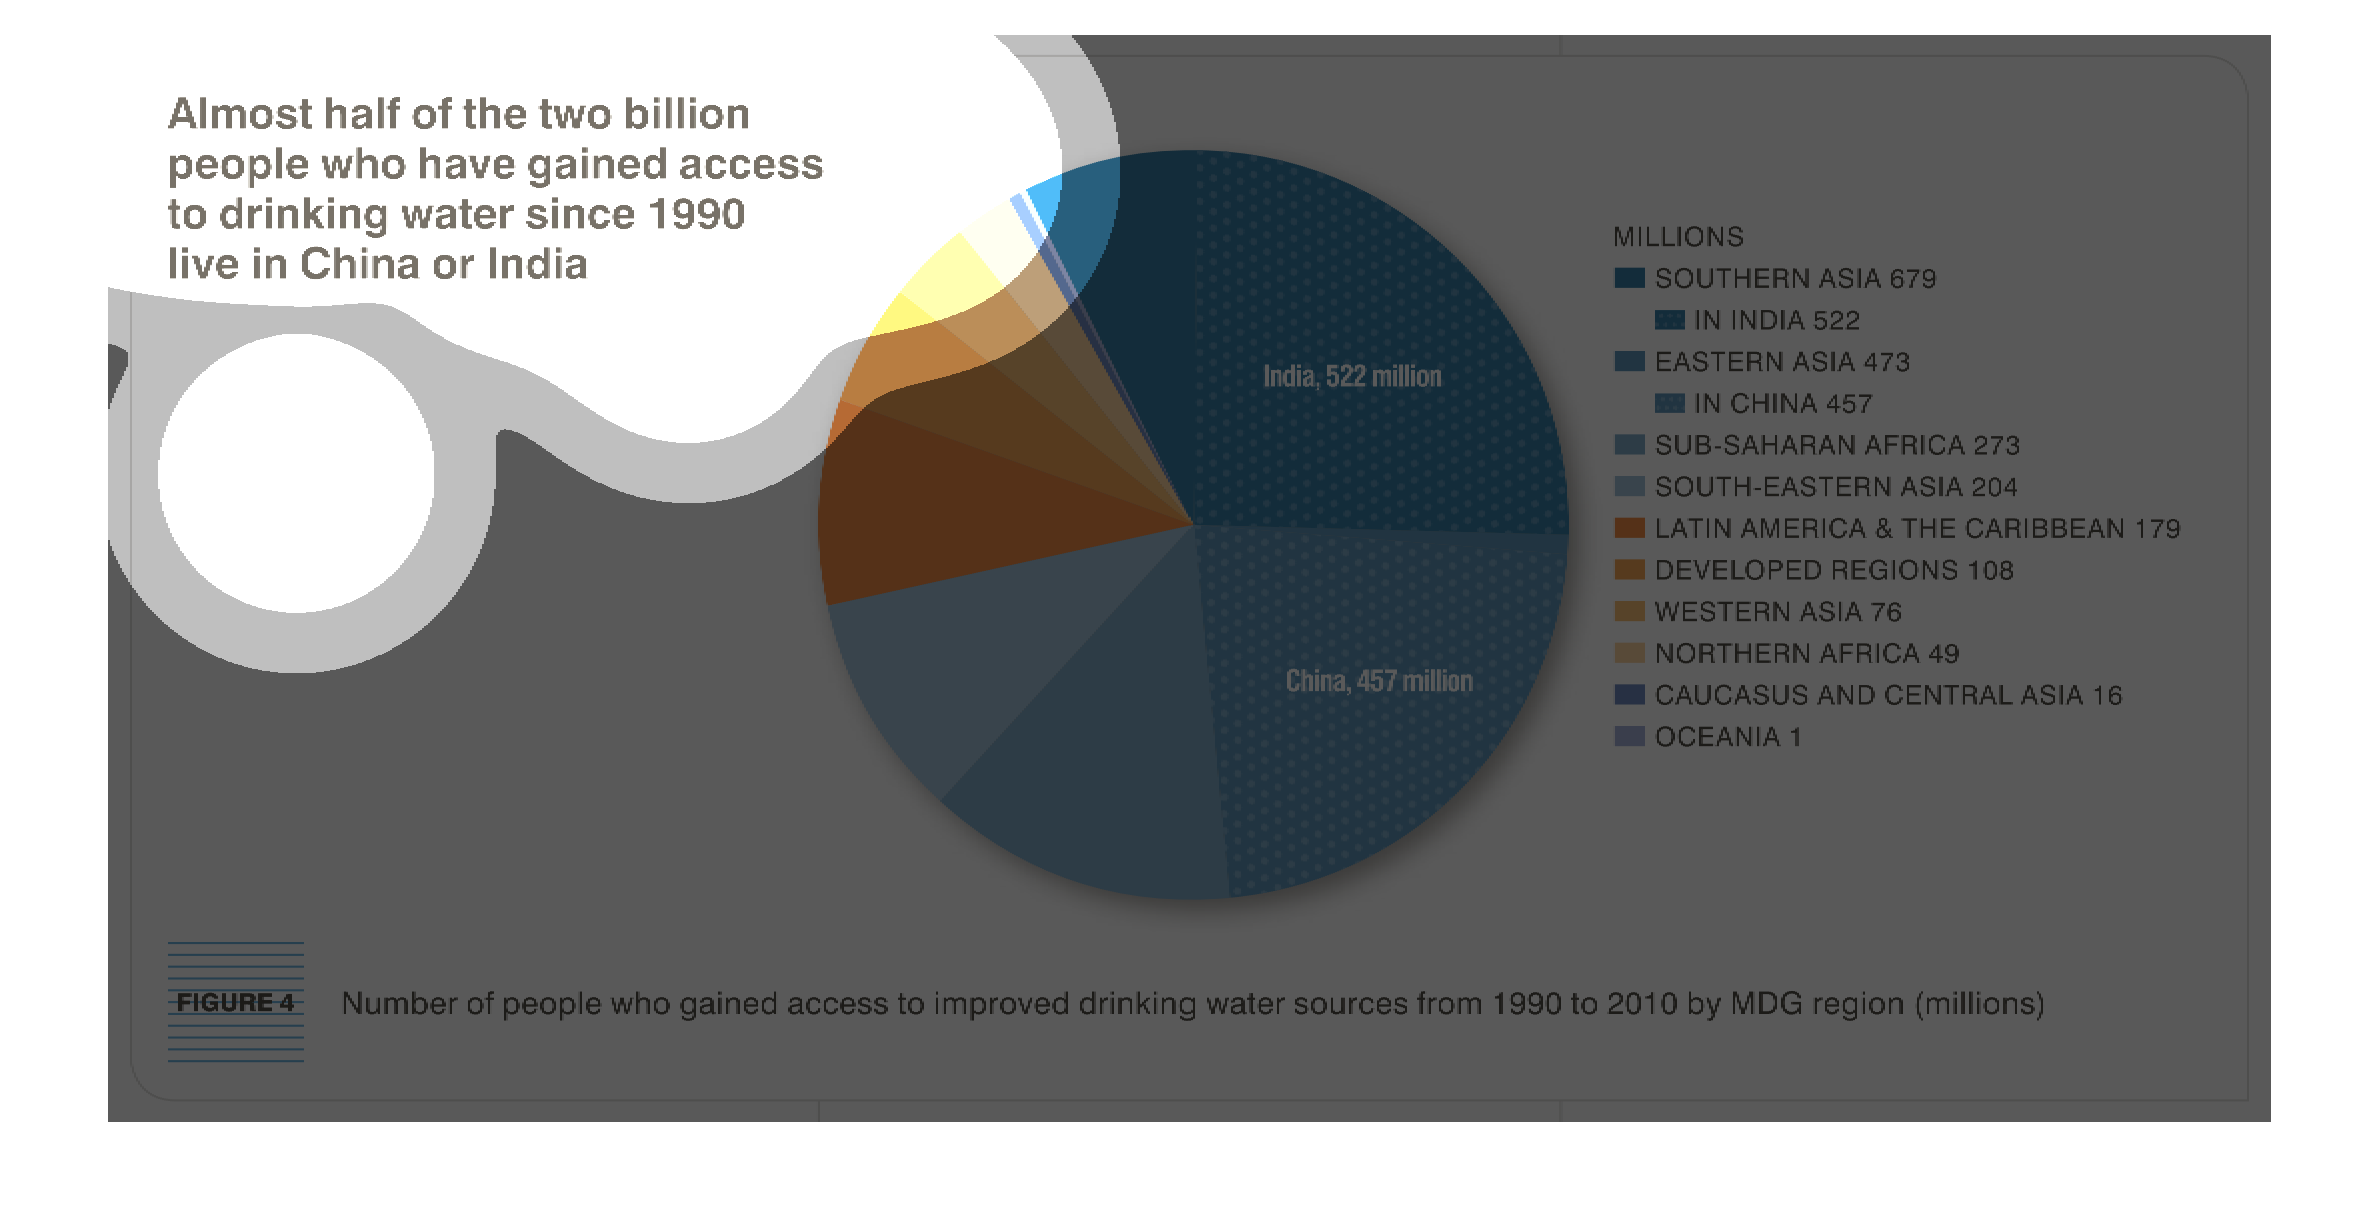
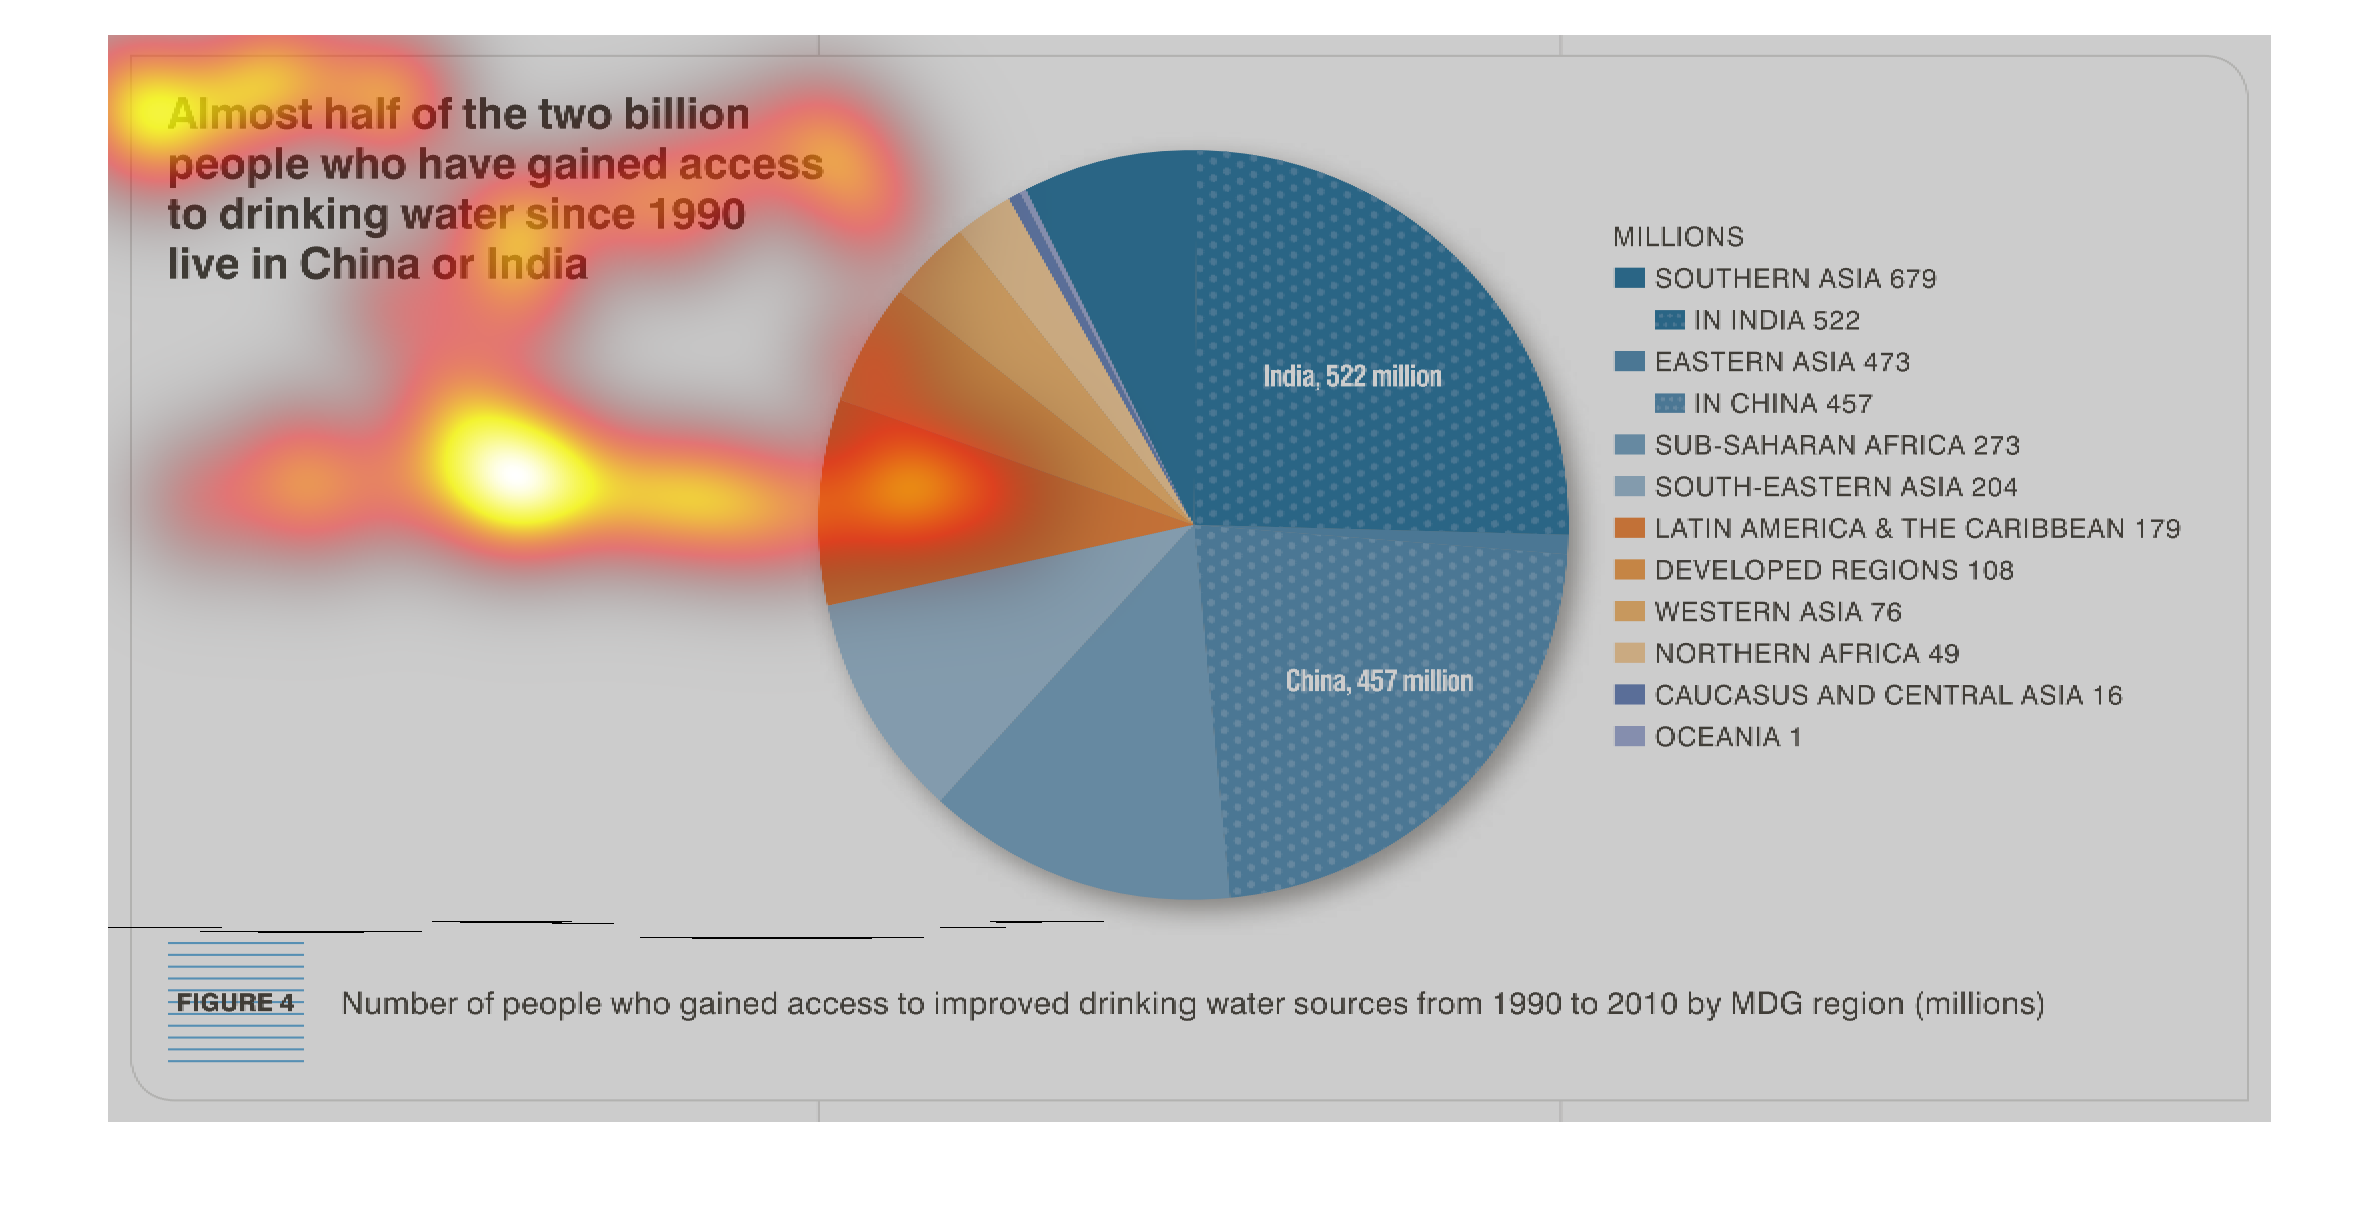
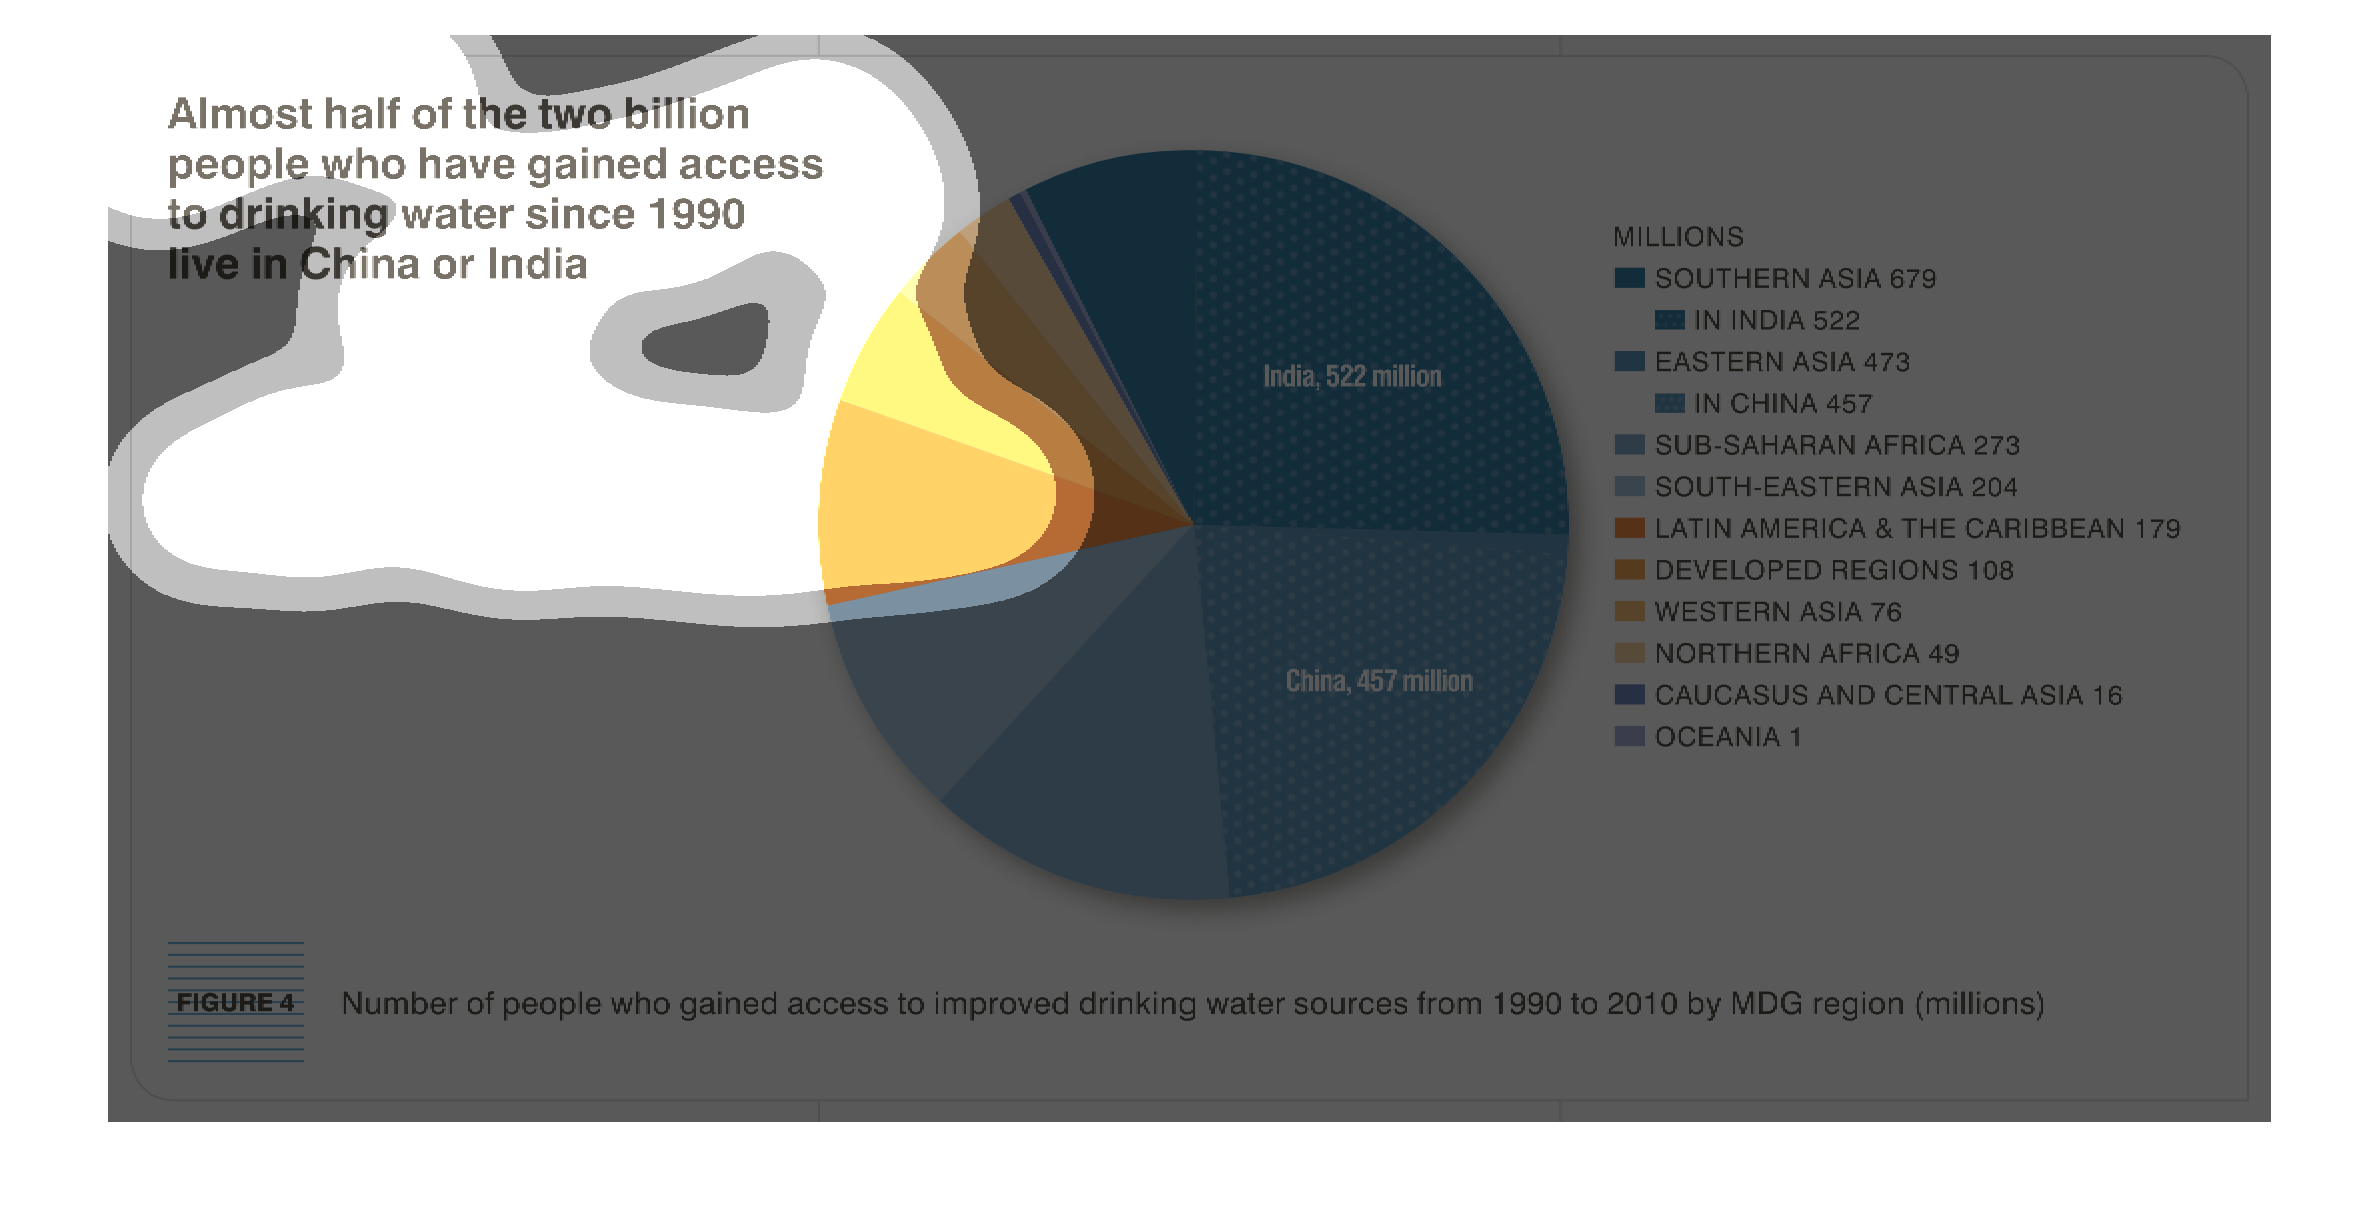
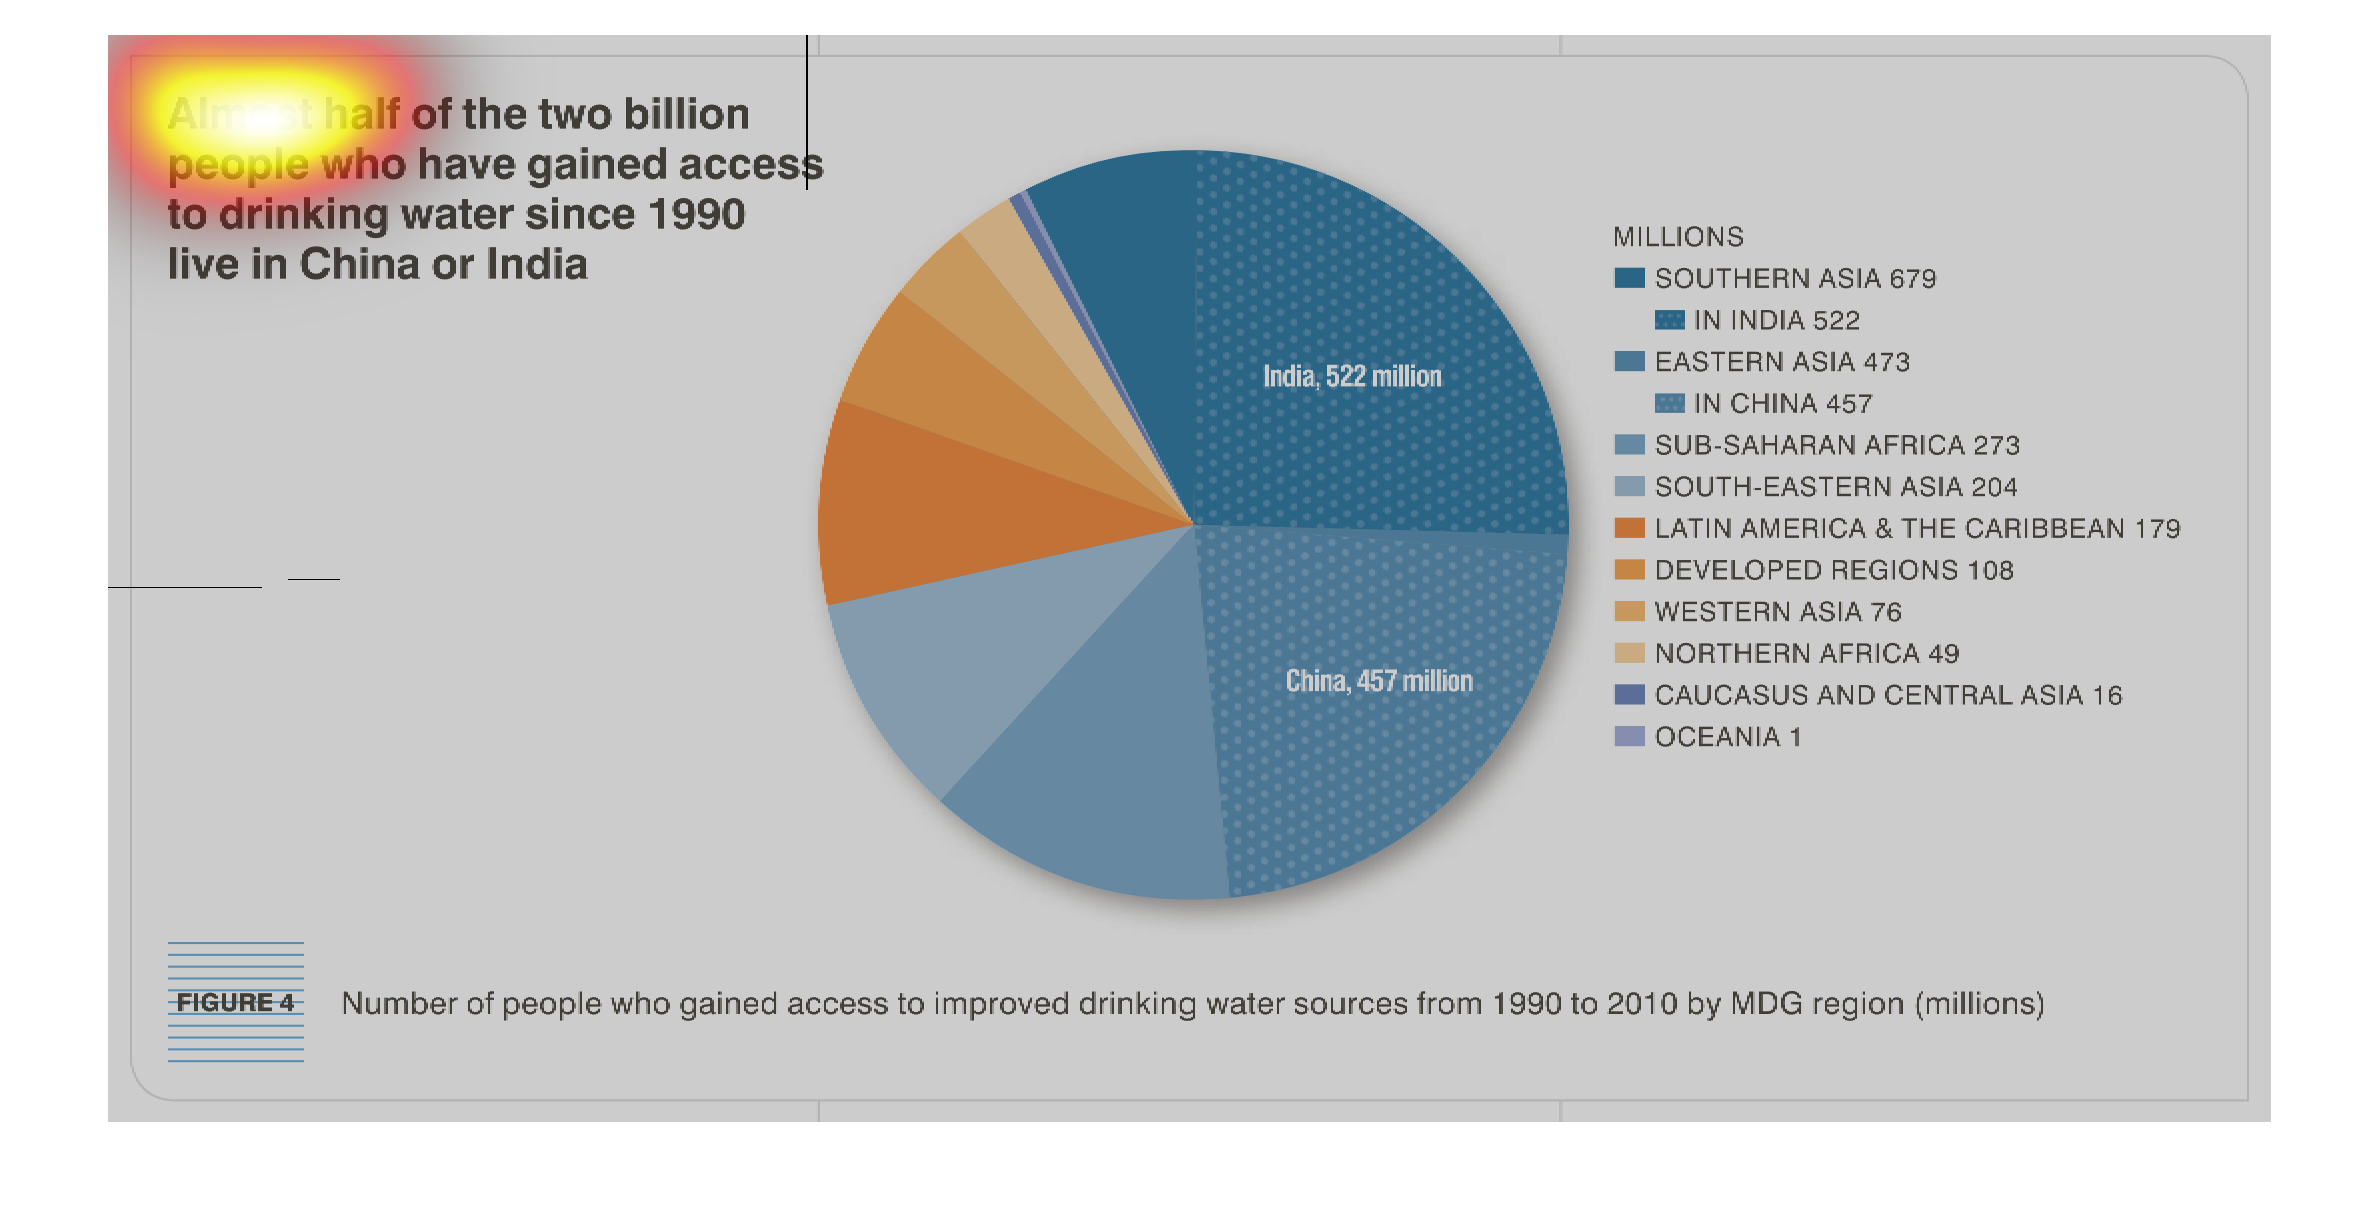
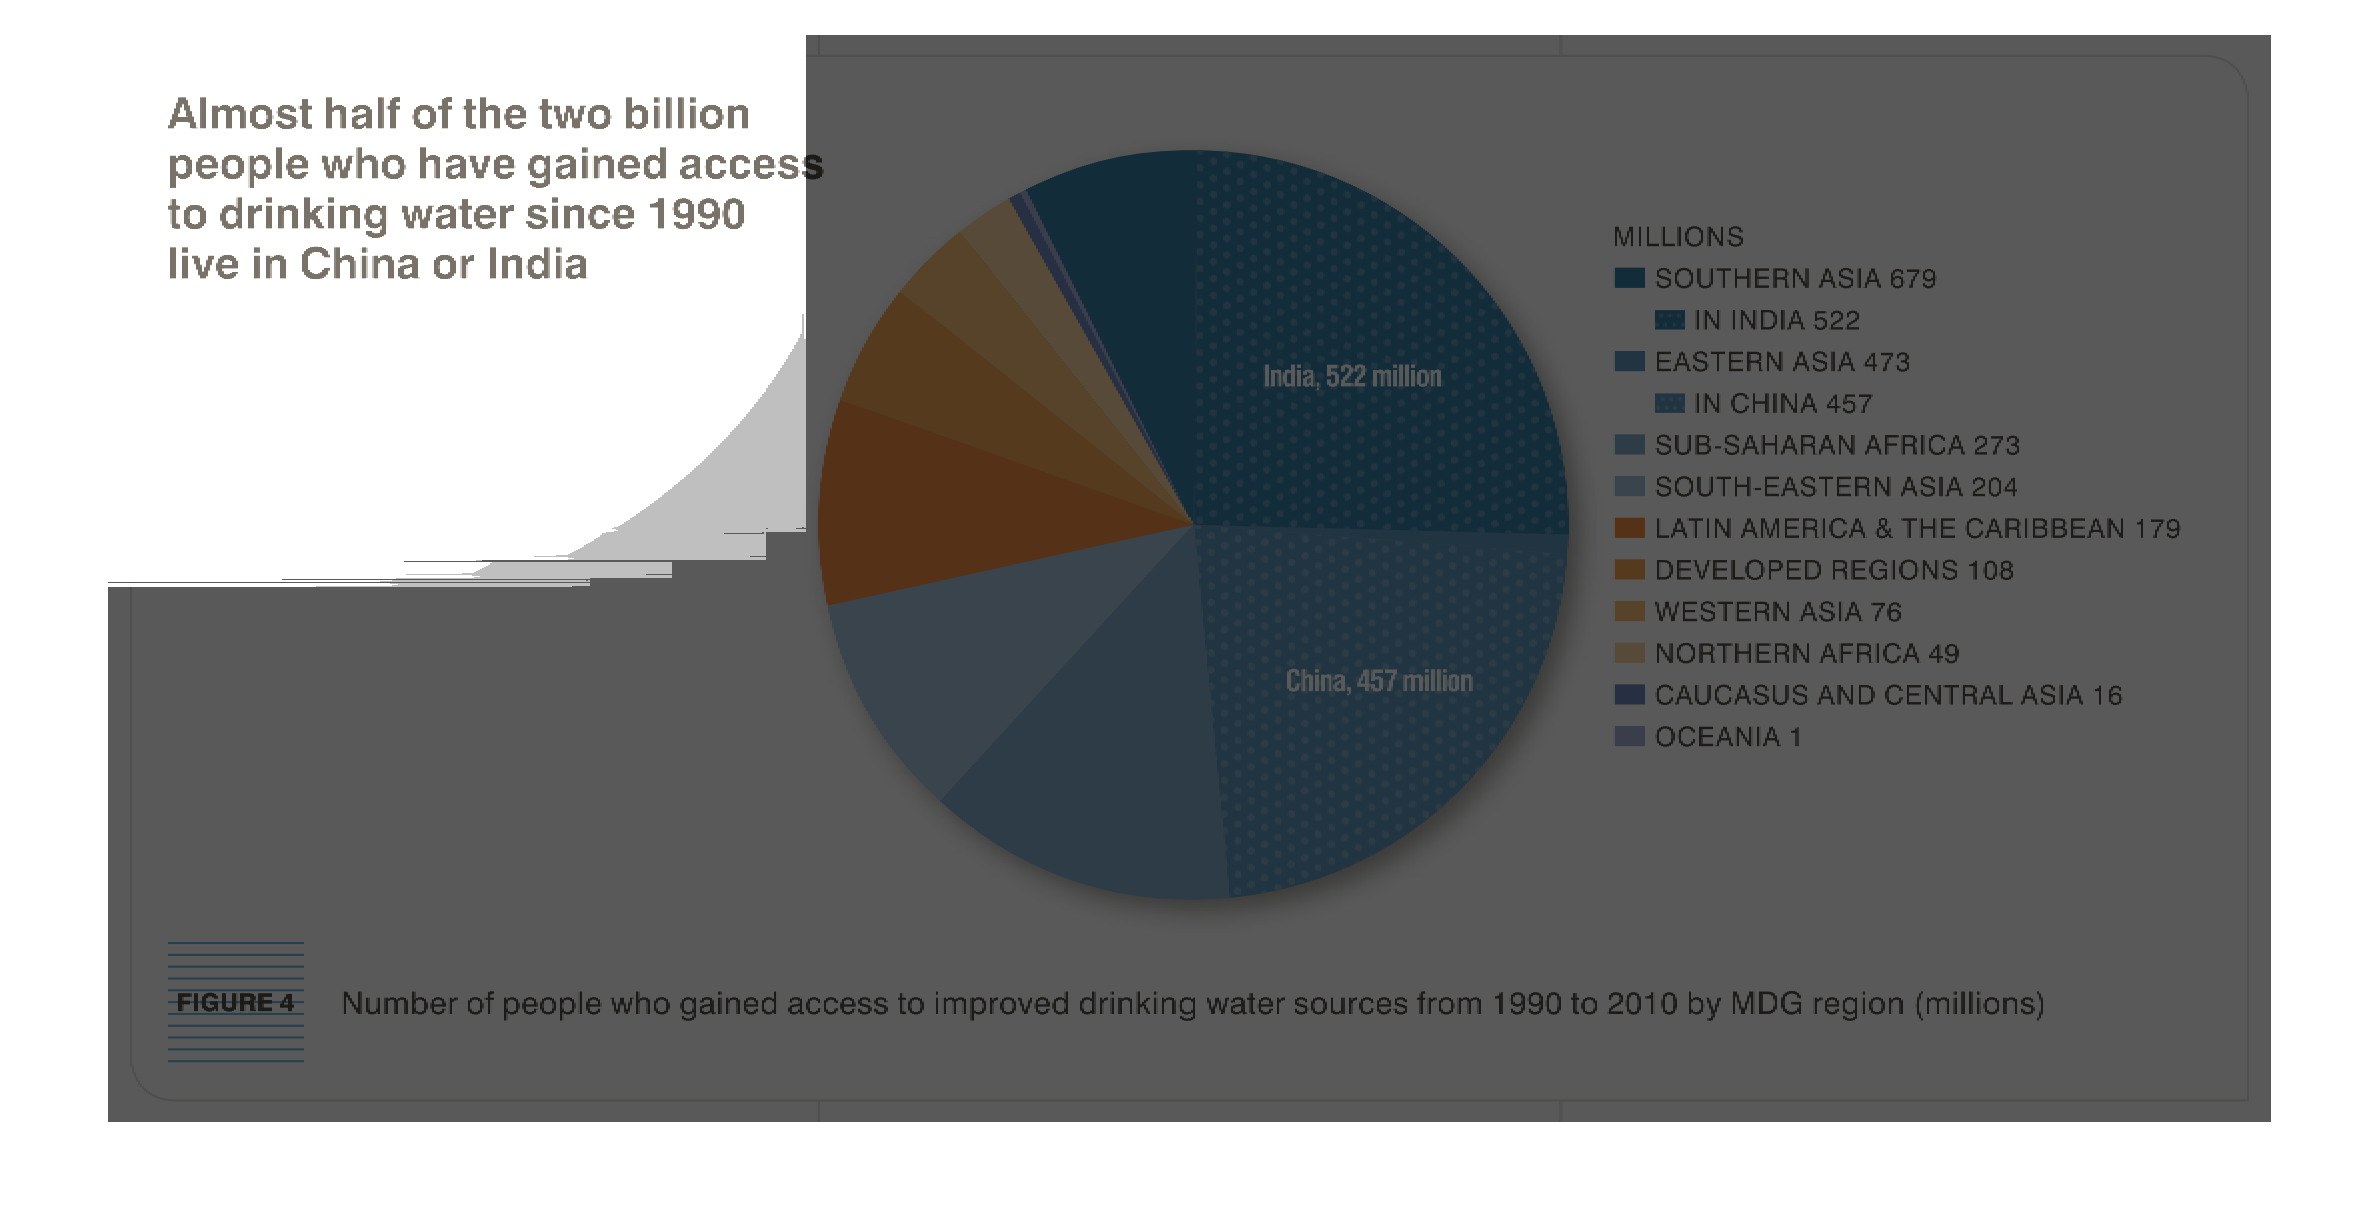
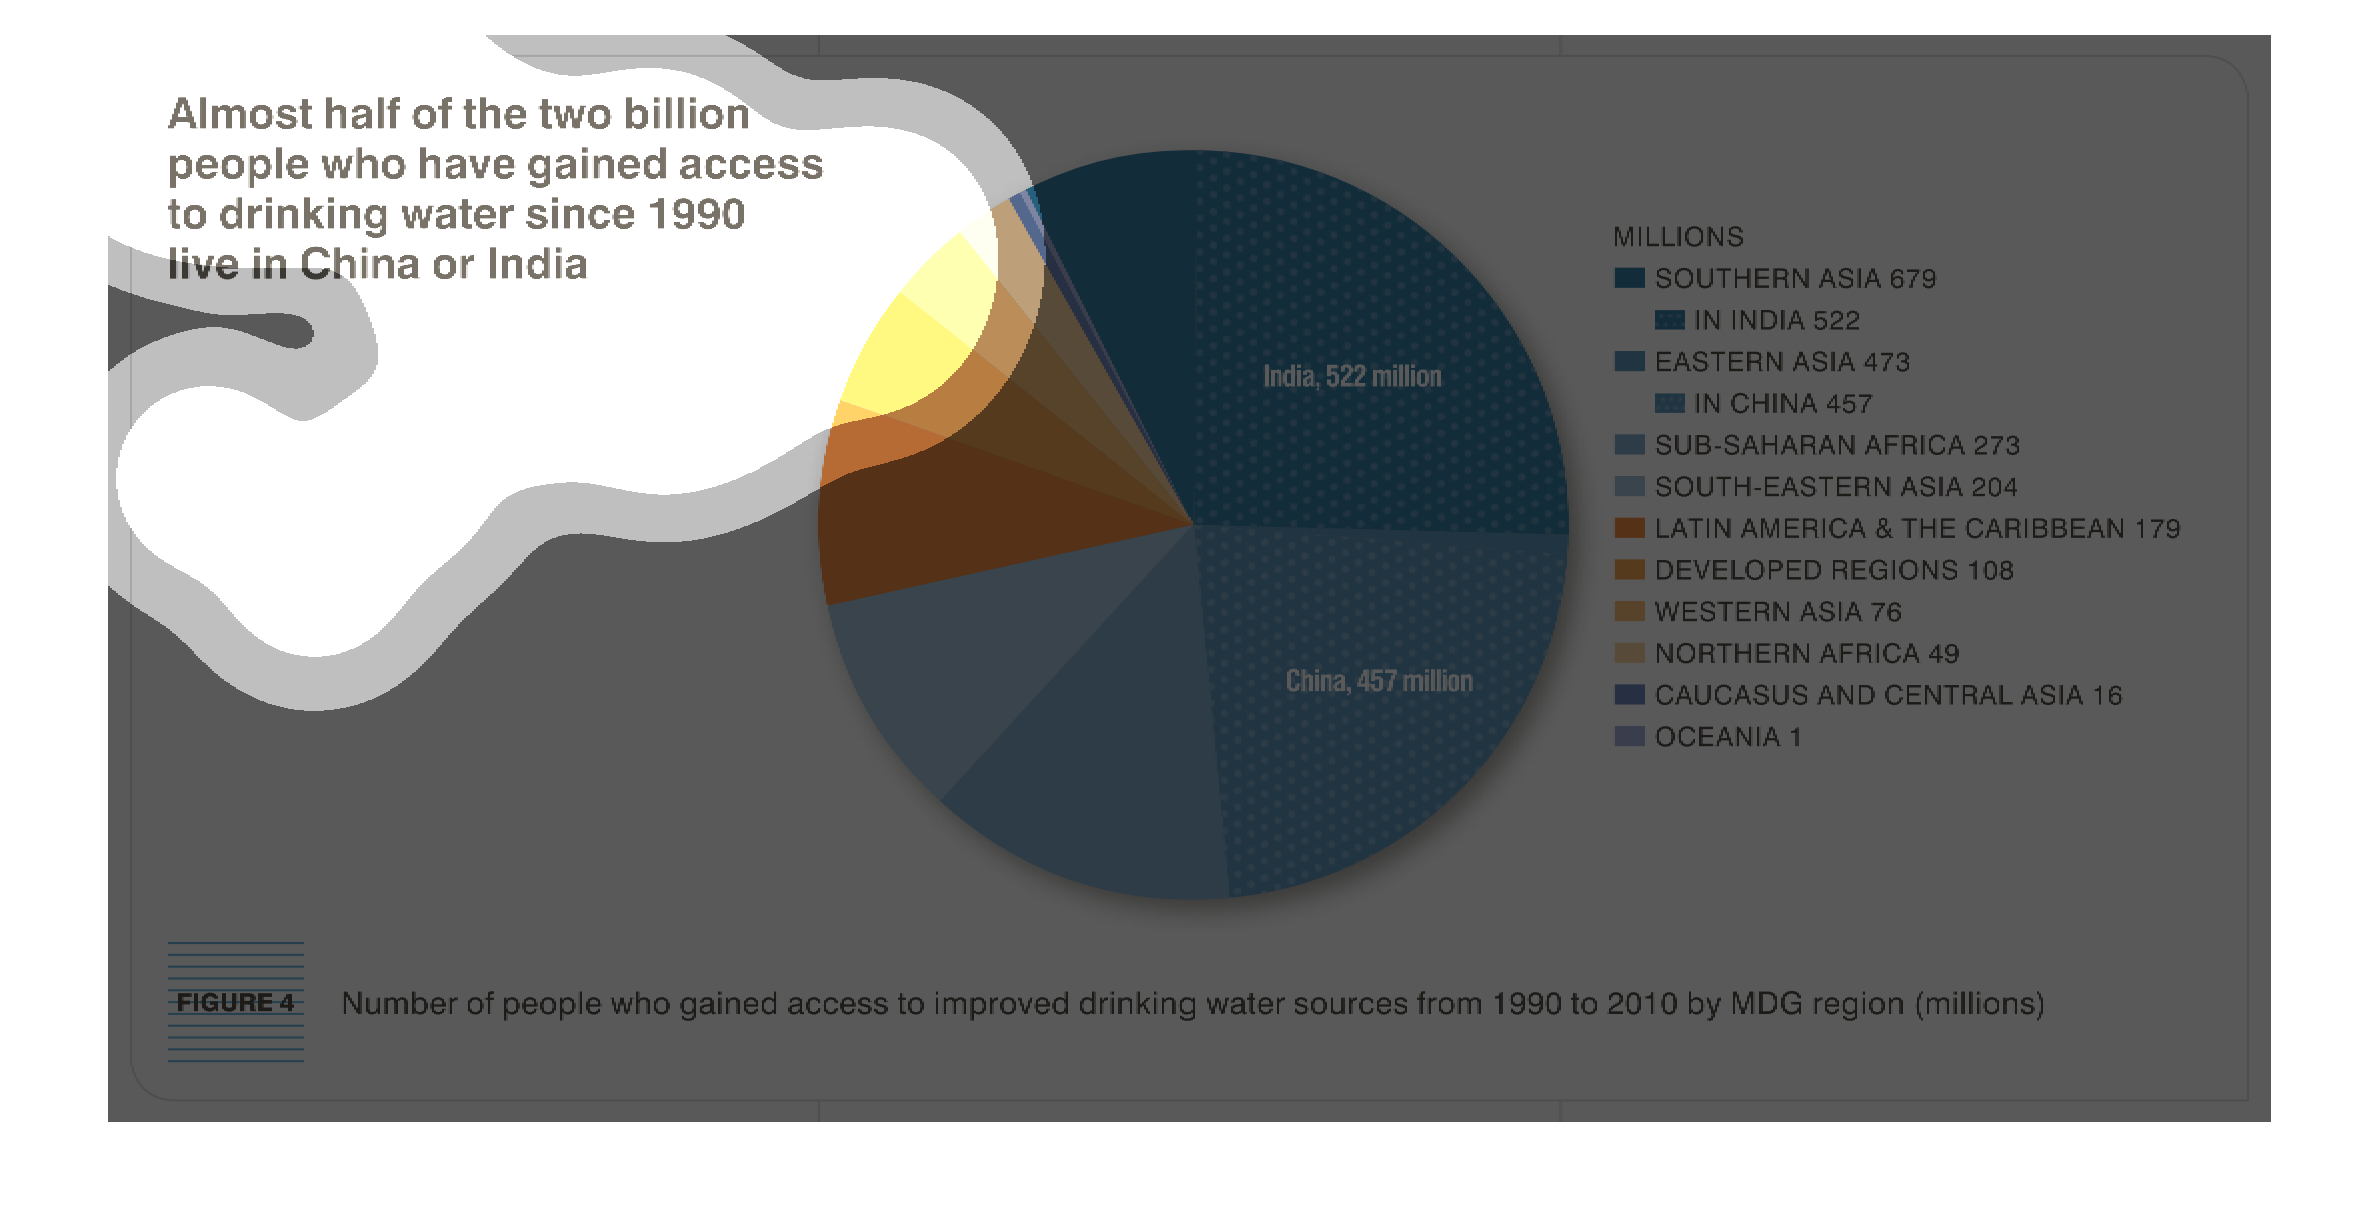
The figure presented is titled Almost half of the two billion people who have gained access
to drinking water since 1990 live in China or India.  The figure is a pie chart.

This pie chard shows the number of people in millions who have gained access to drinking water
since 1990.  According to the chart nearly half of the people who have received access to
water are in India and China which have 522 million and 457 million people respectively.
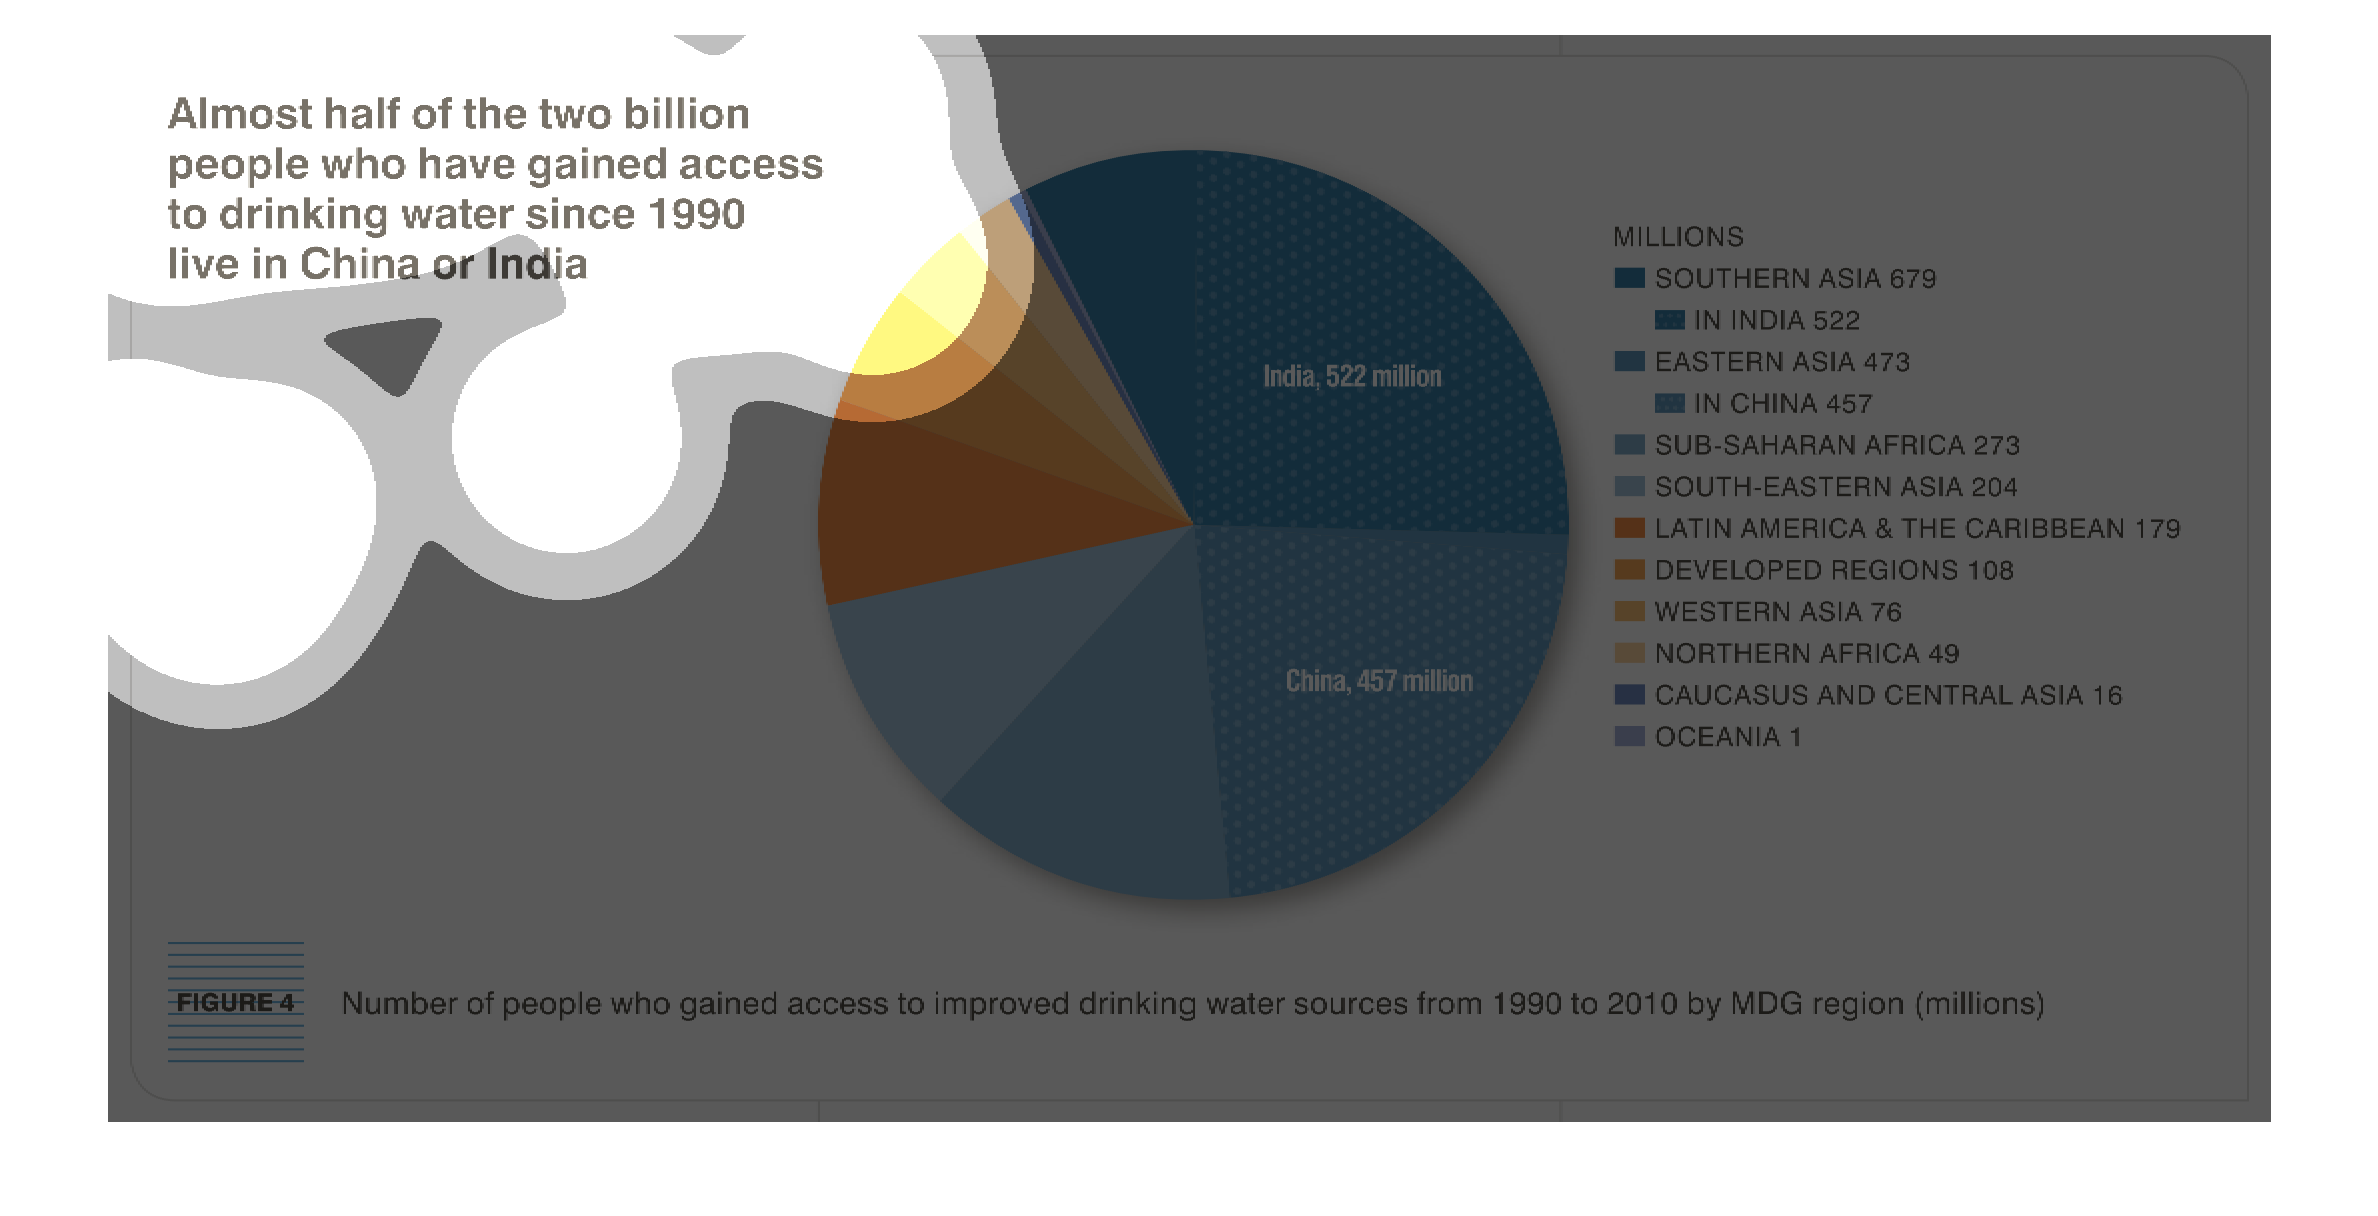
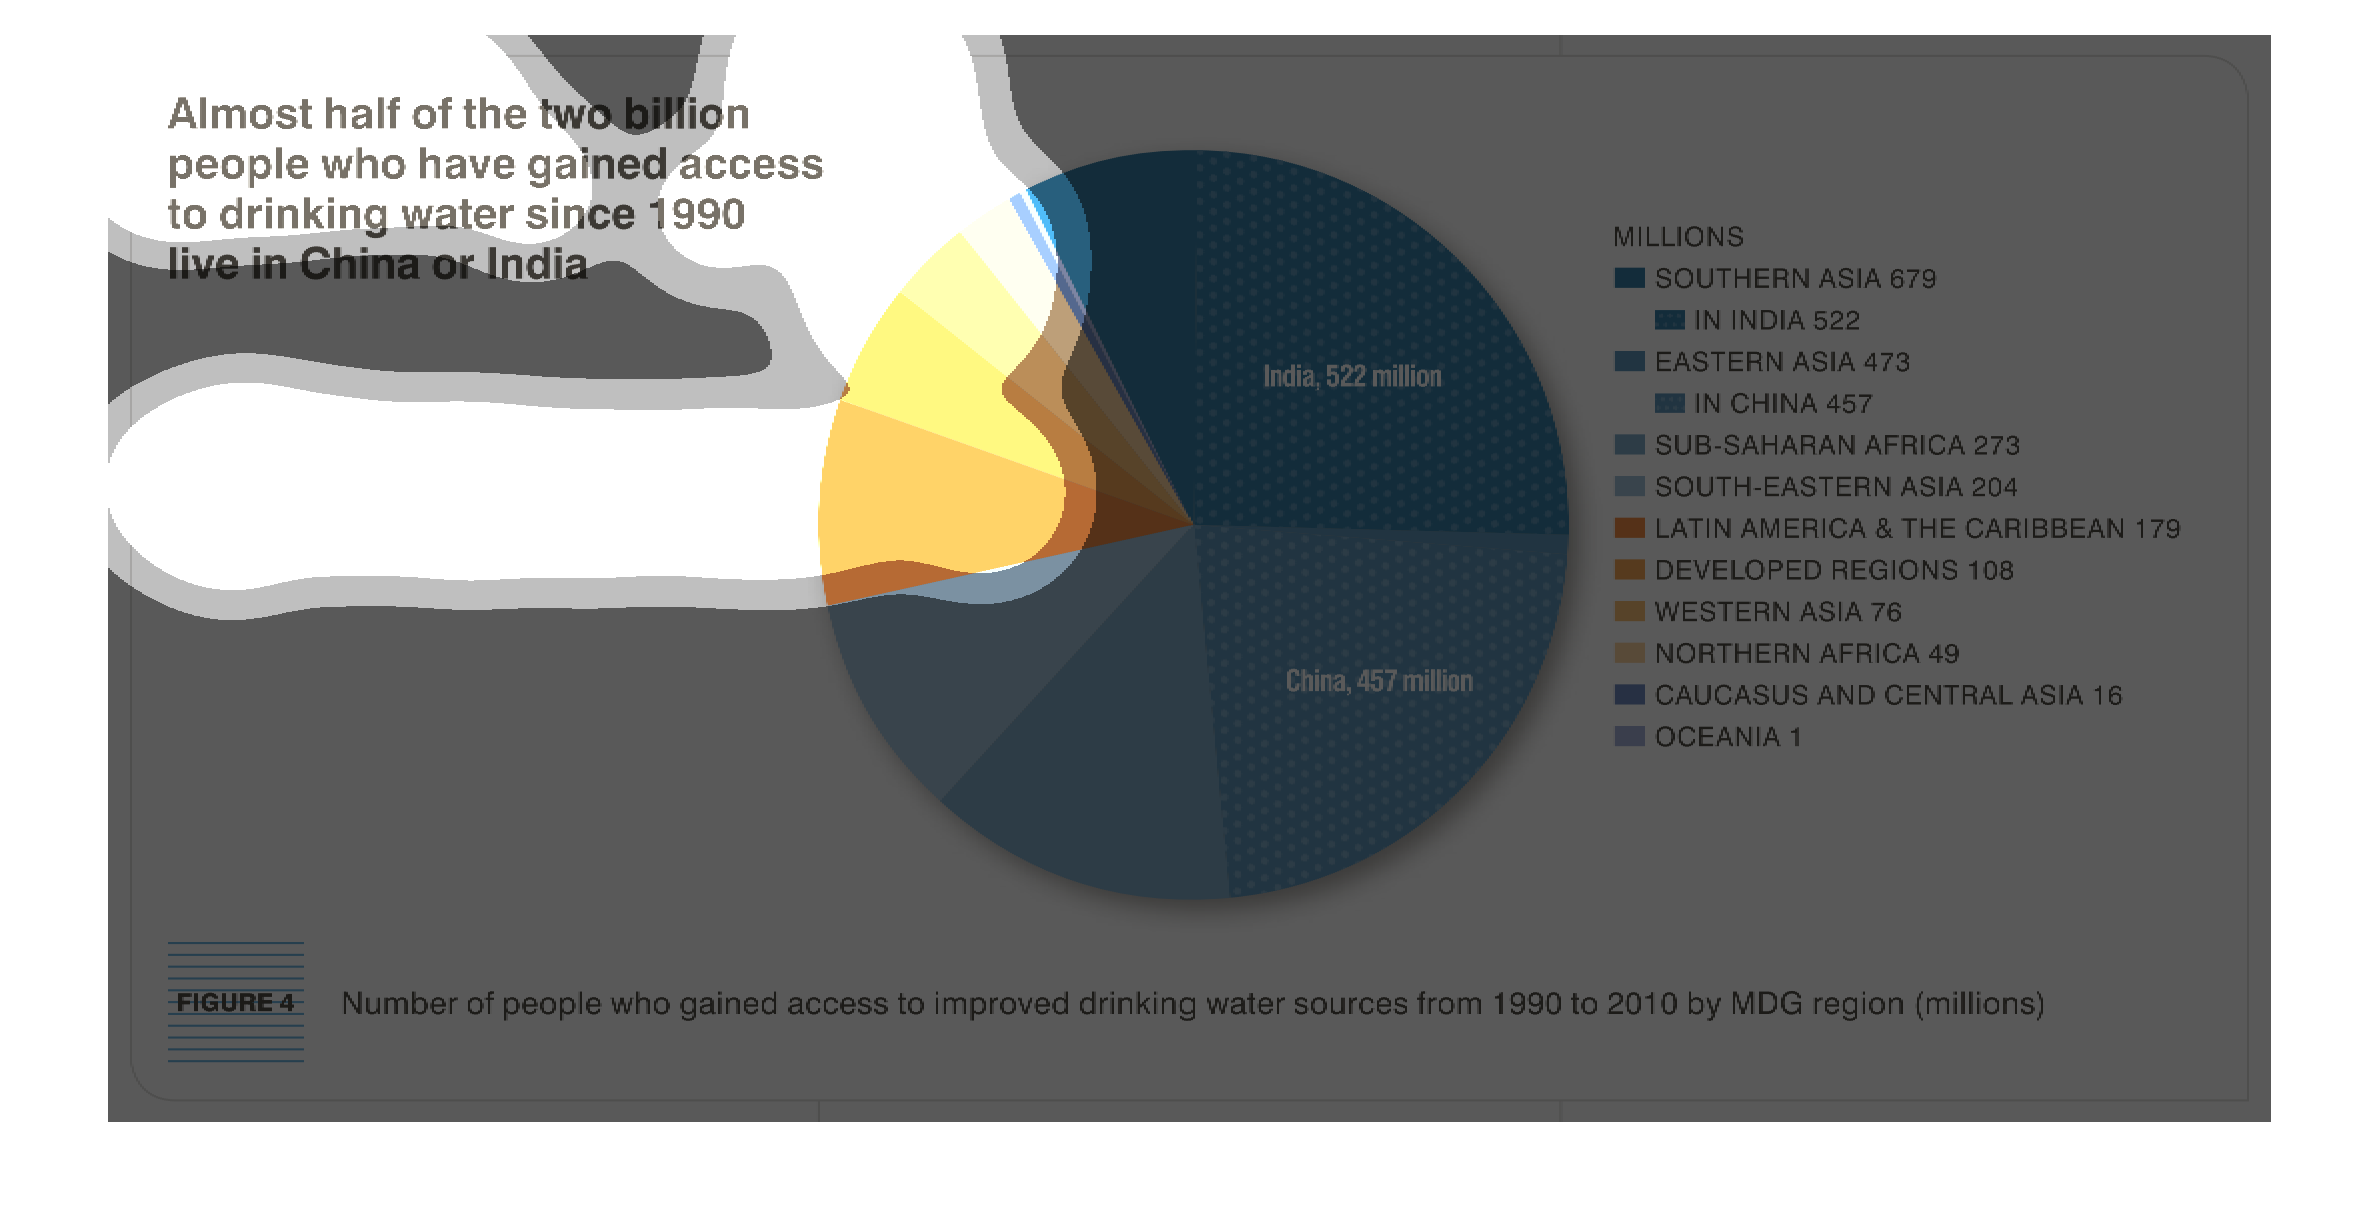
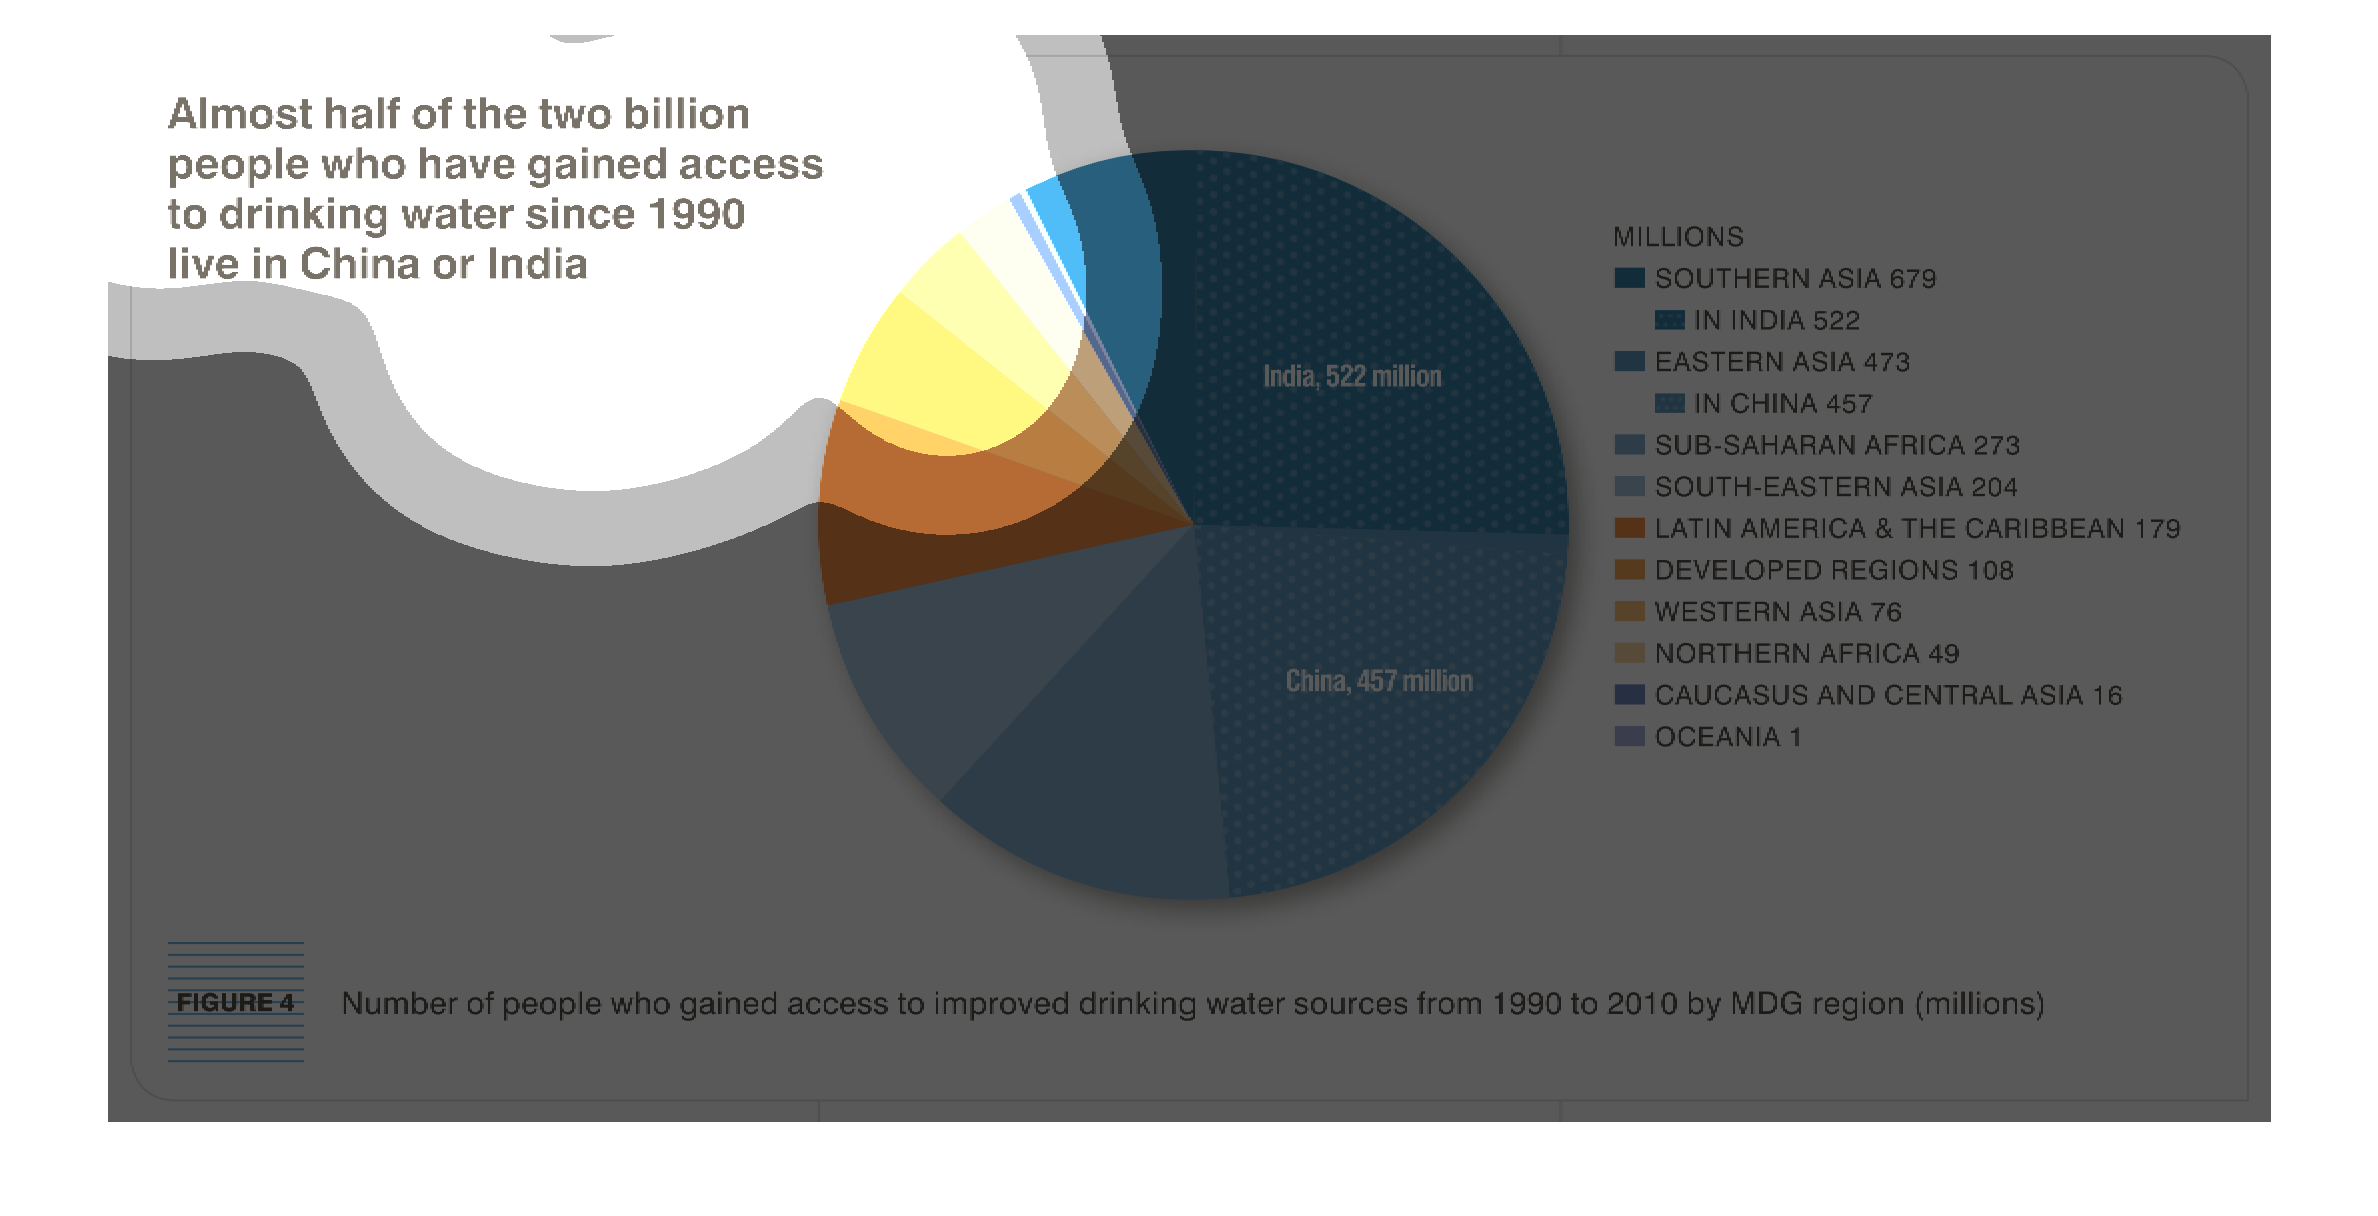
This is a pie chart of the number of people who gained access to safe drinking water from
the year 1990 to 2010. It is separated into regions and by millions of people.
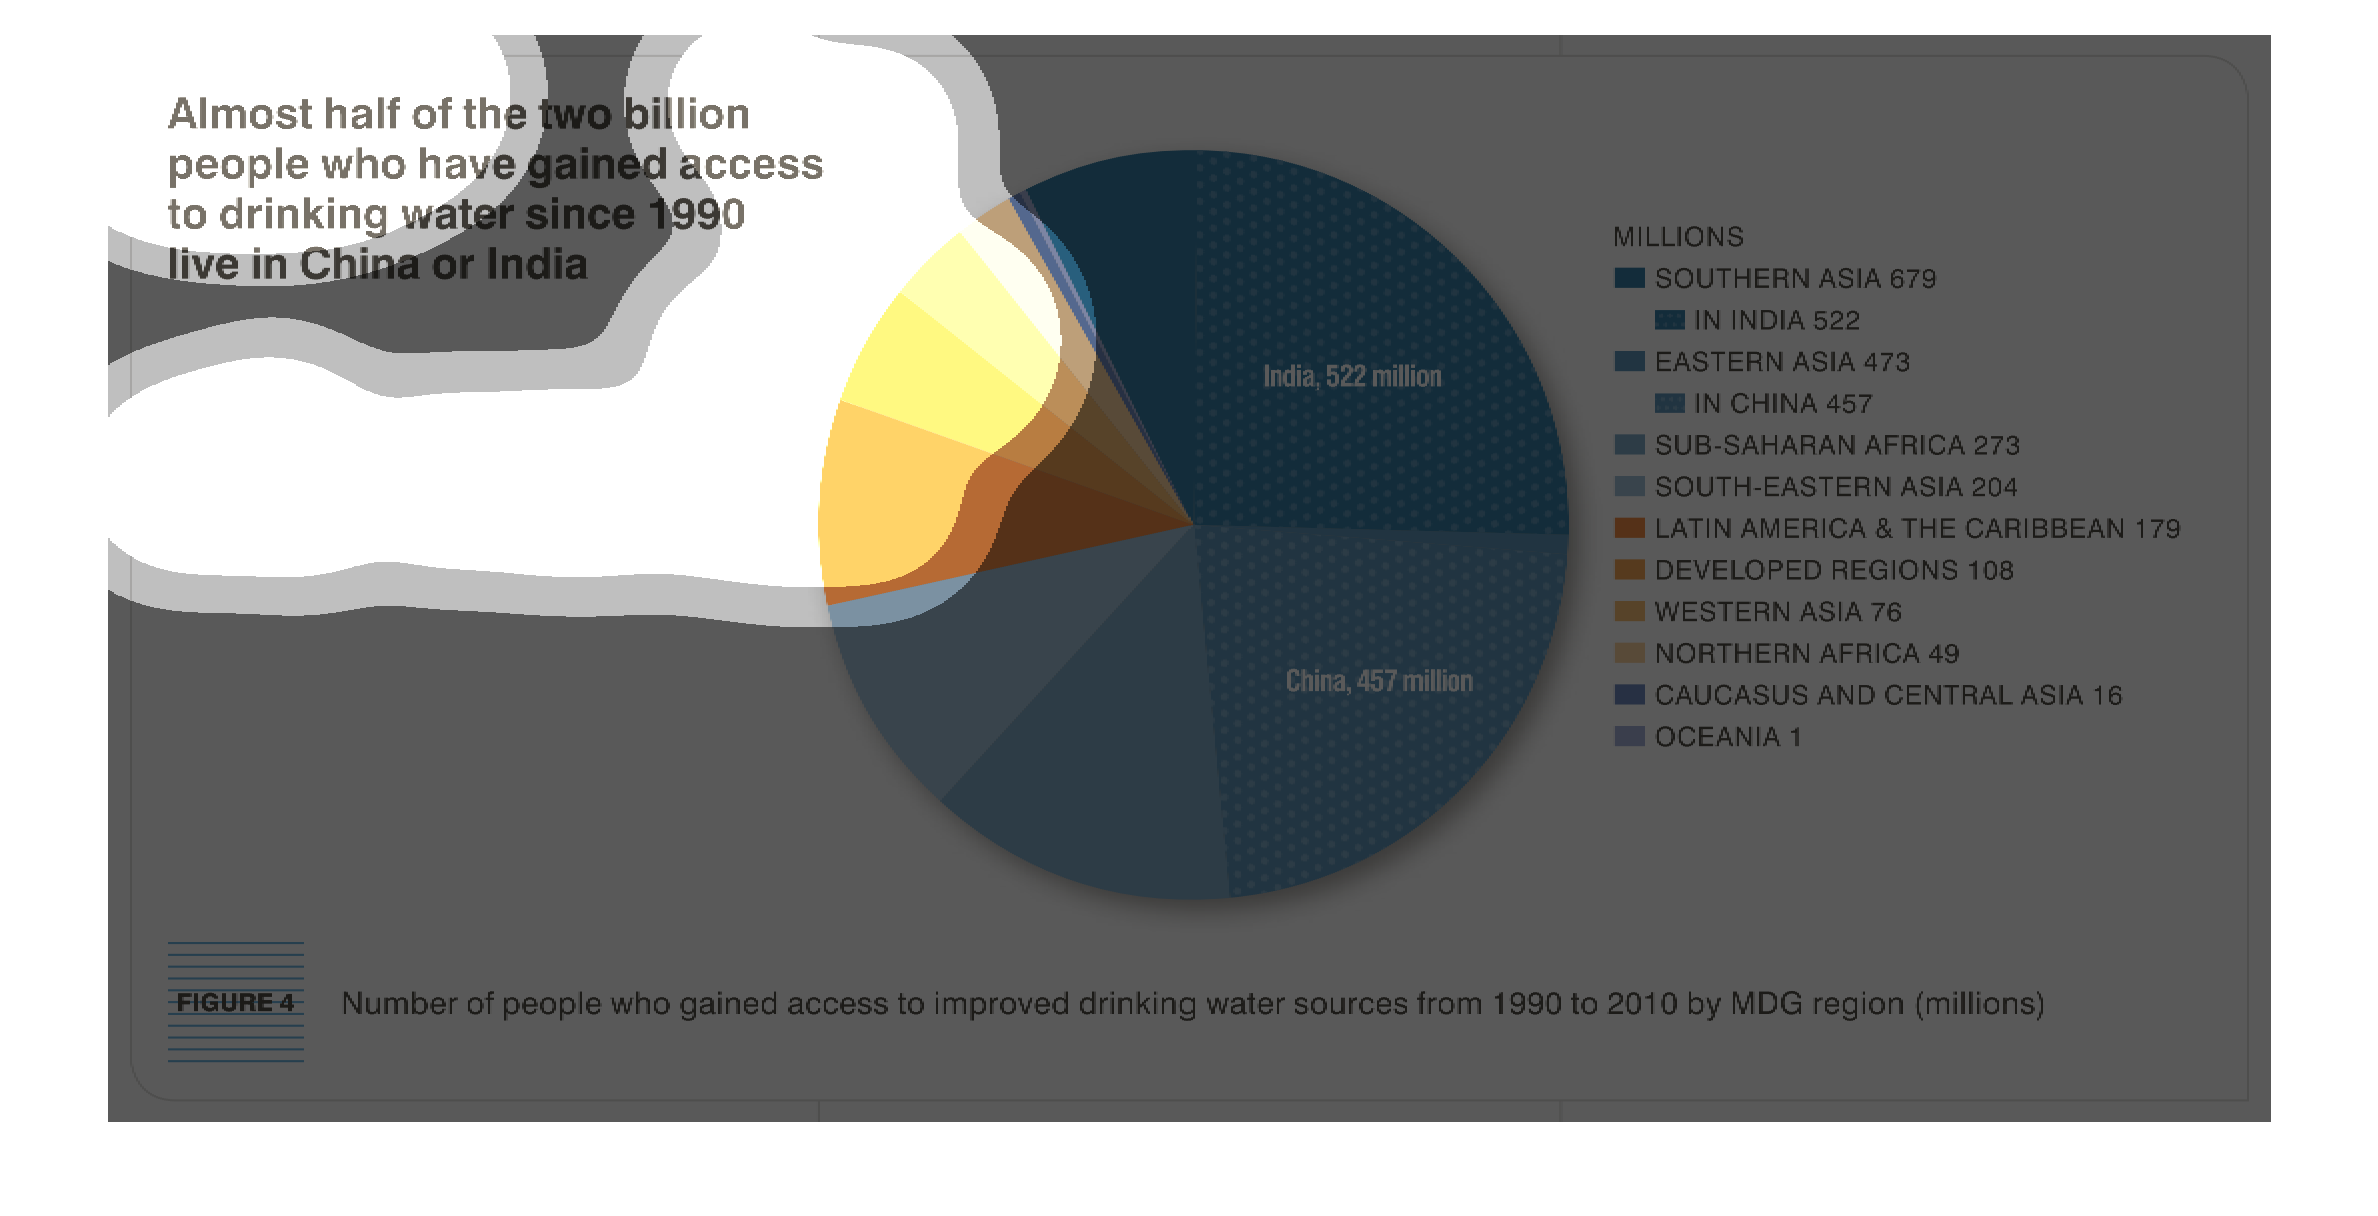
This chart describes that almost half of the two billion people who have gained access to
drinking water since the year 1990 live in either China or in India.
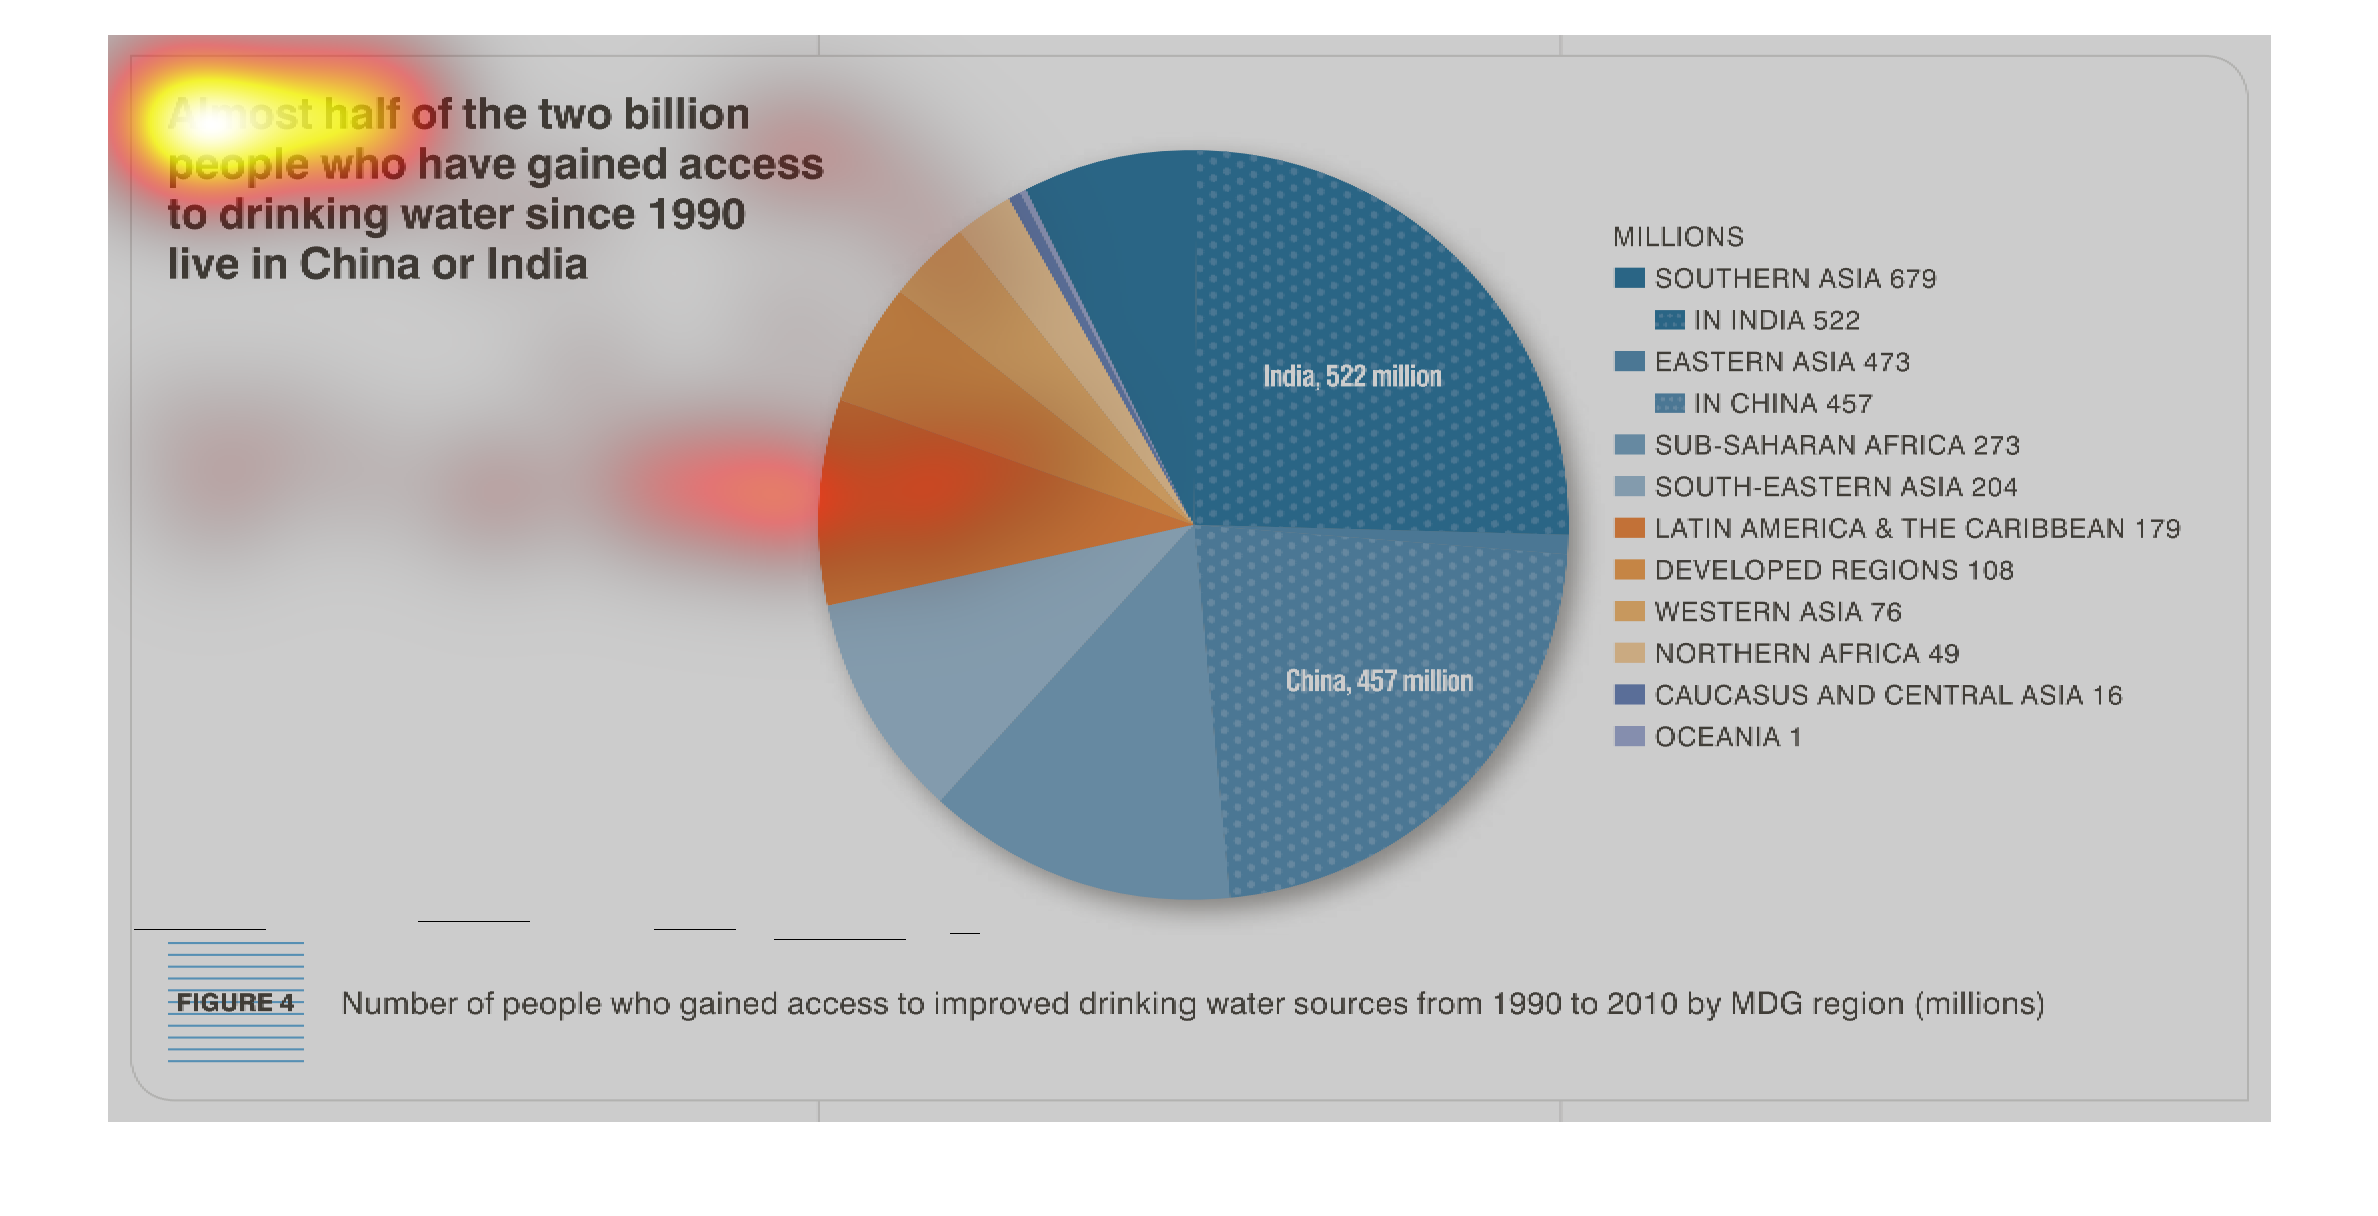
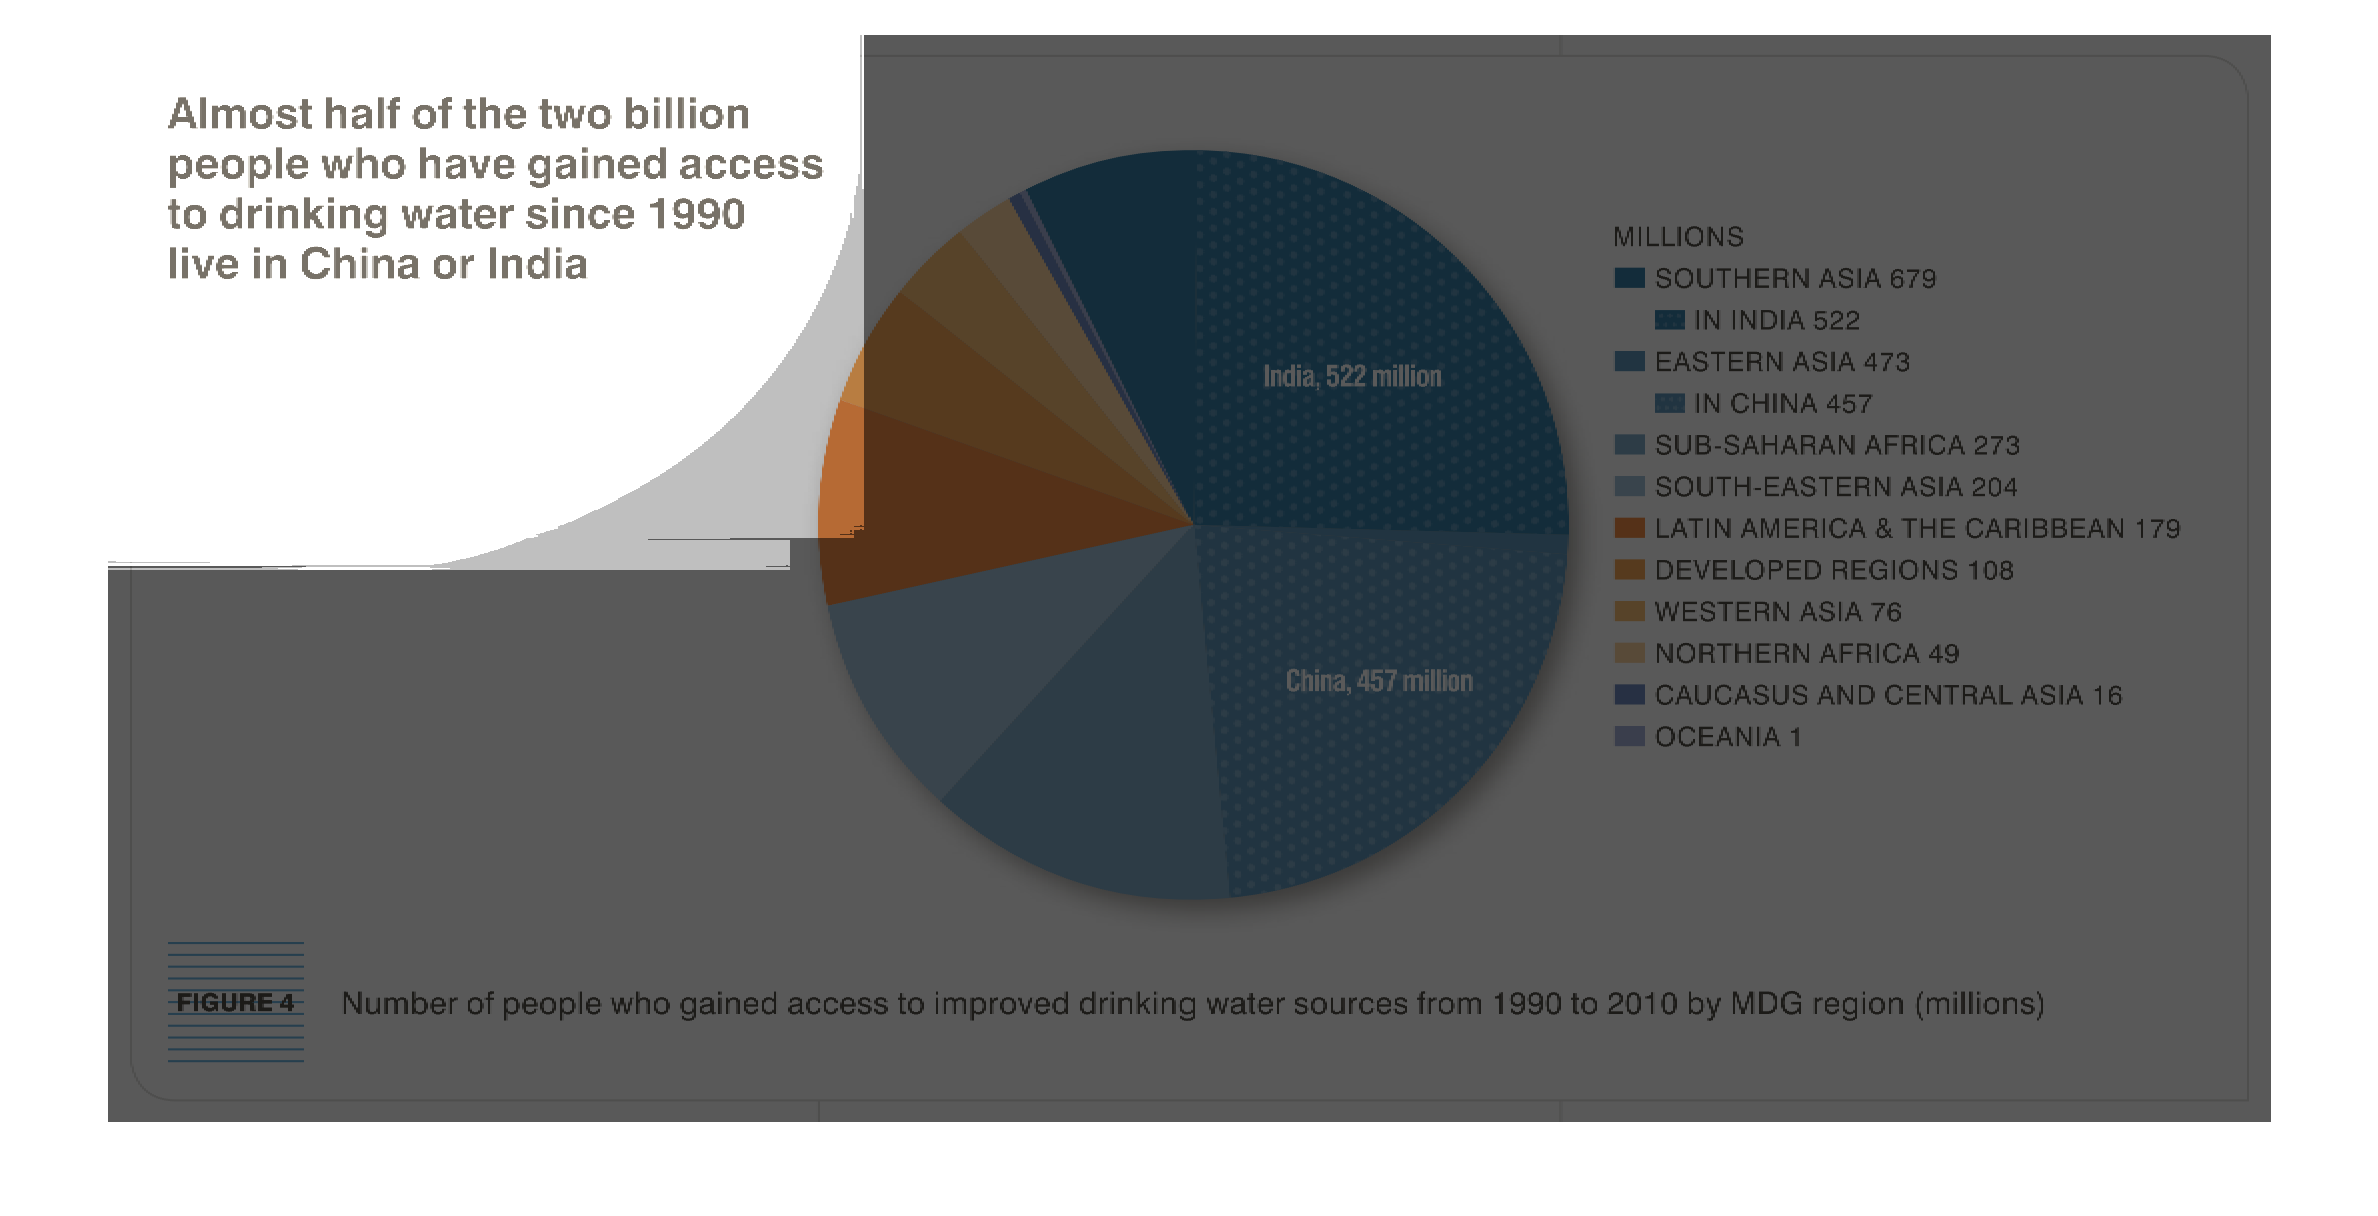
This is a pie chart of what seems to be the same information from the previous diagram.  Since
1990 nearly half of the world's water has gone to India and China.  They are obviously the
filthiest and most densely populated areas in the world.
almost half of the two billion people who have gained access to drinking water since 1990
live in china or india as seen by this pie chart. Other countries lie in southern asia and
south america
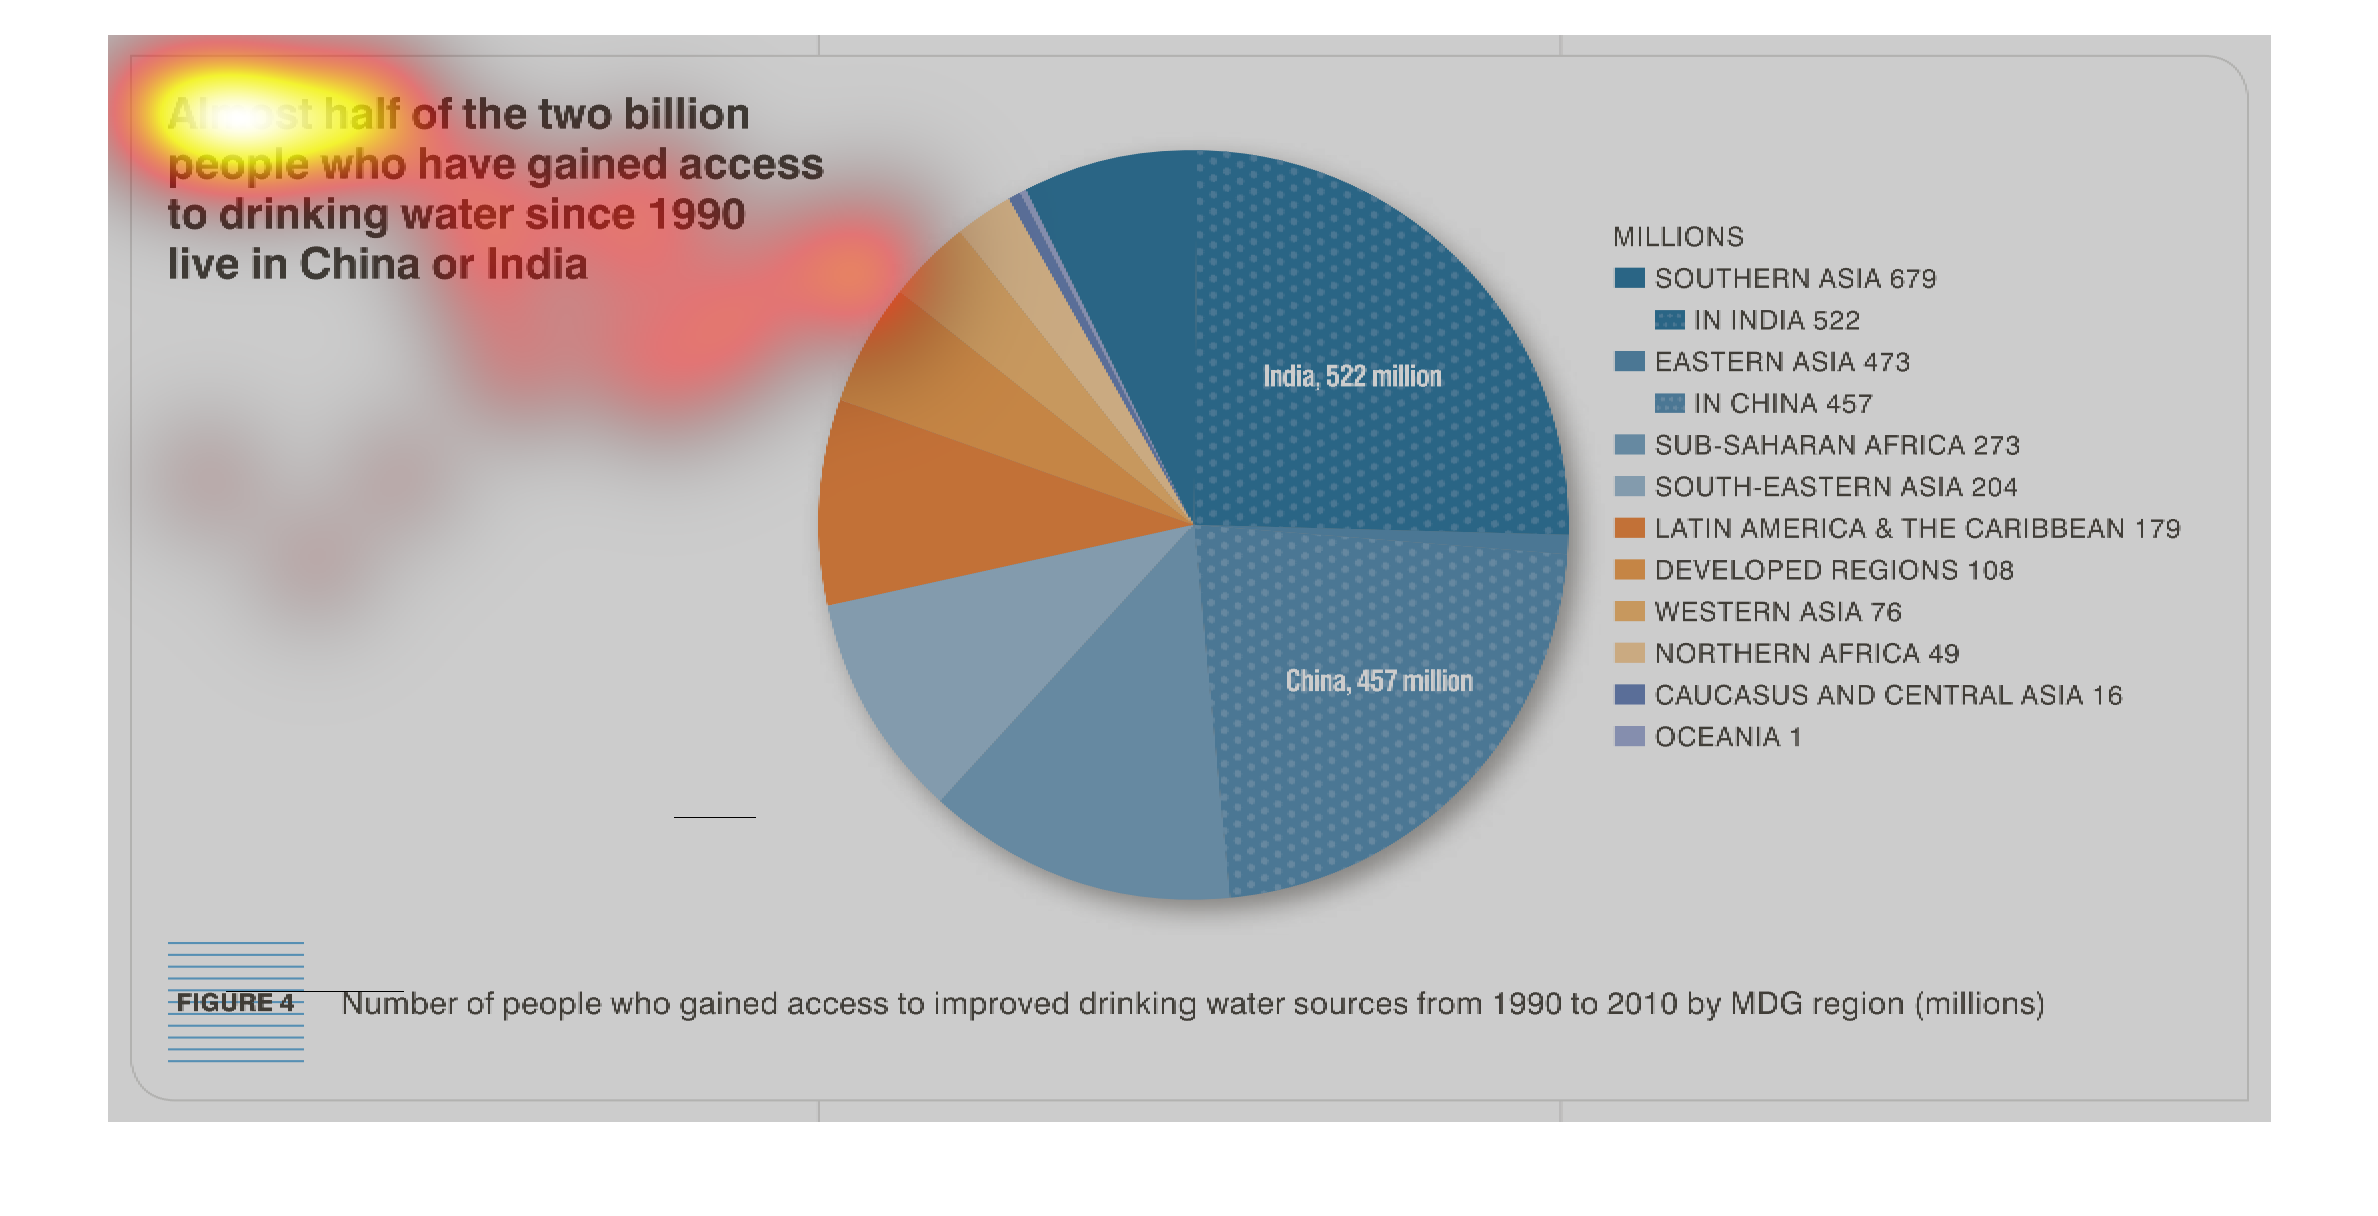
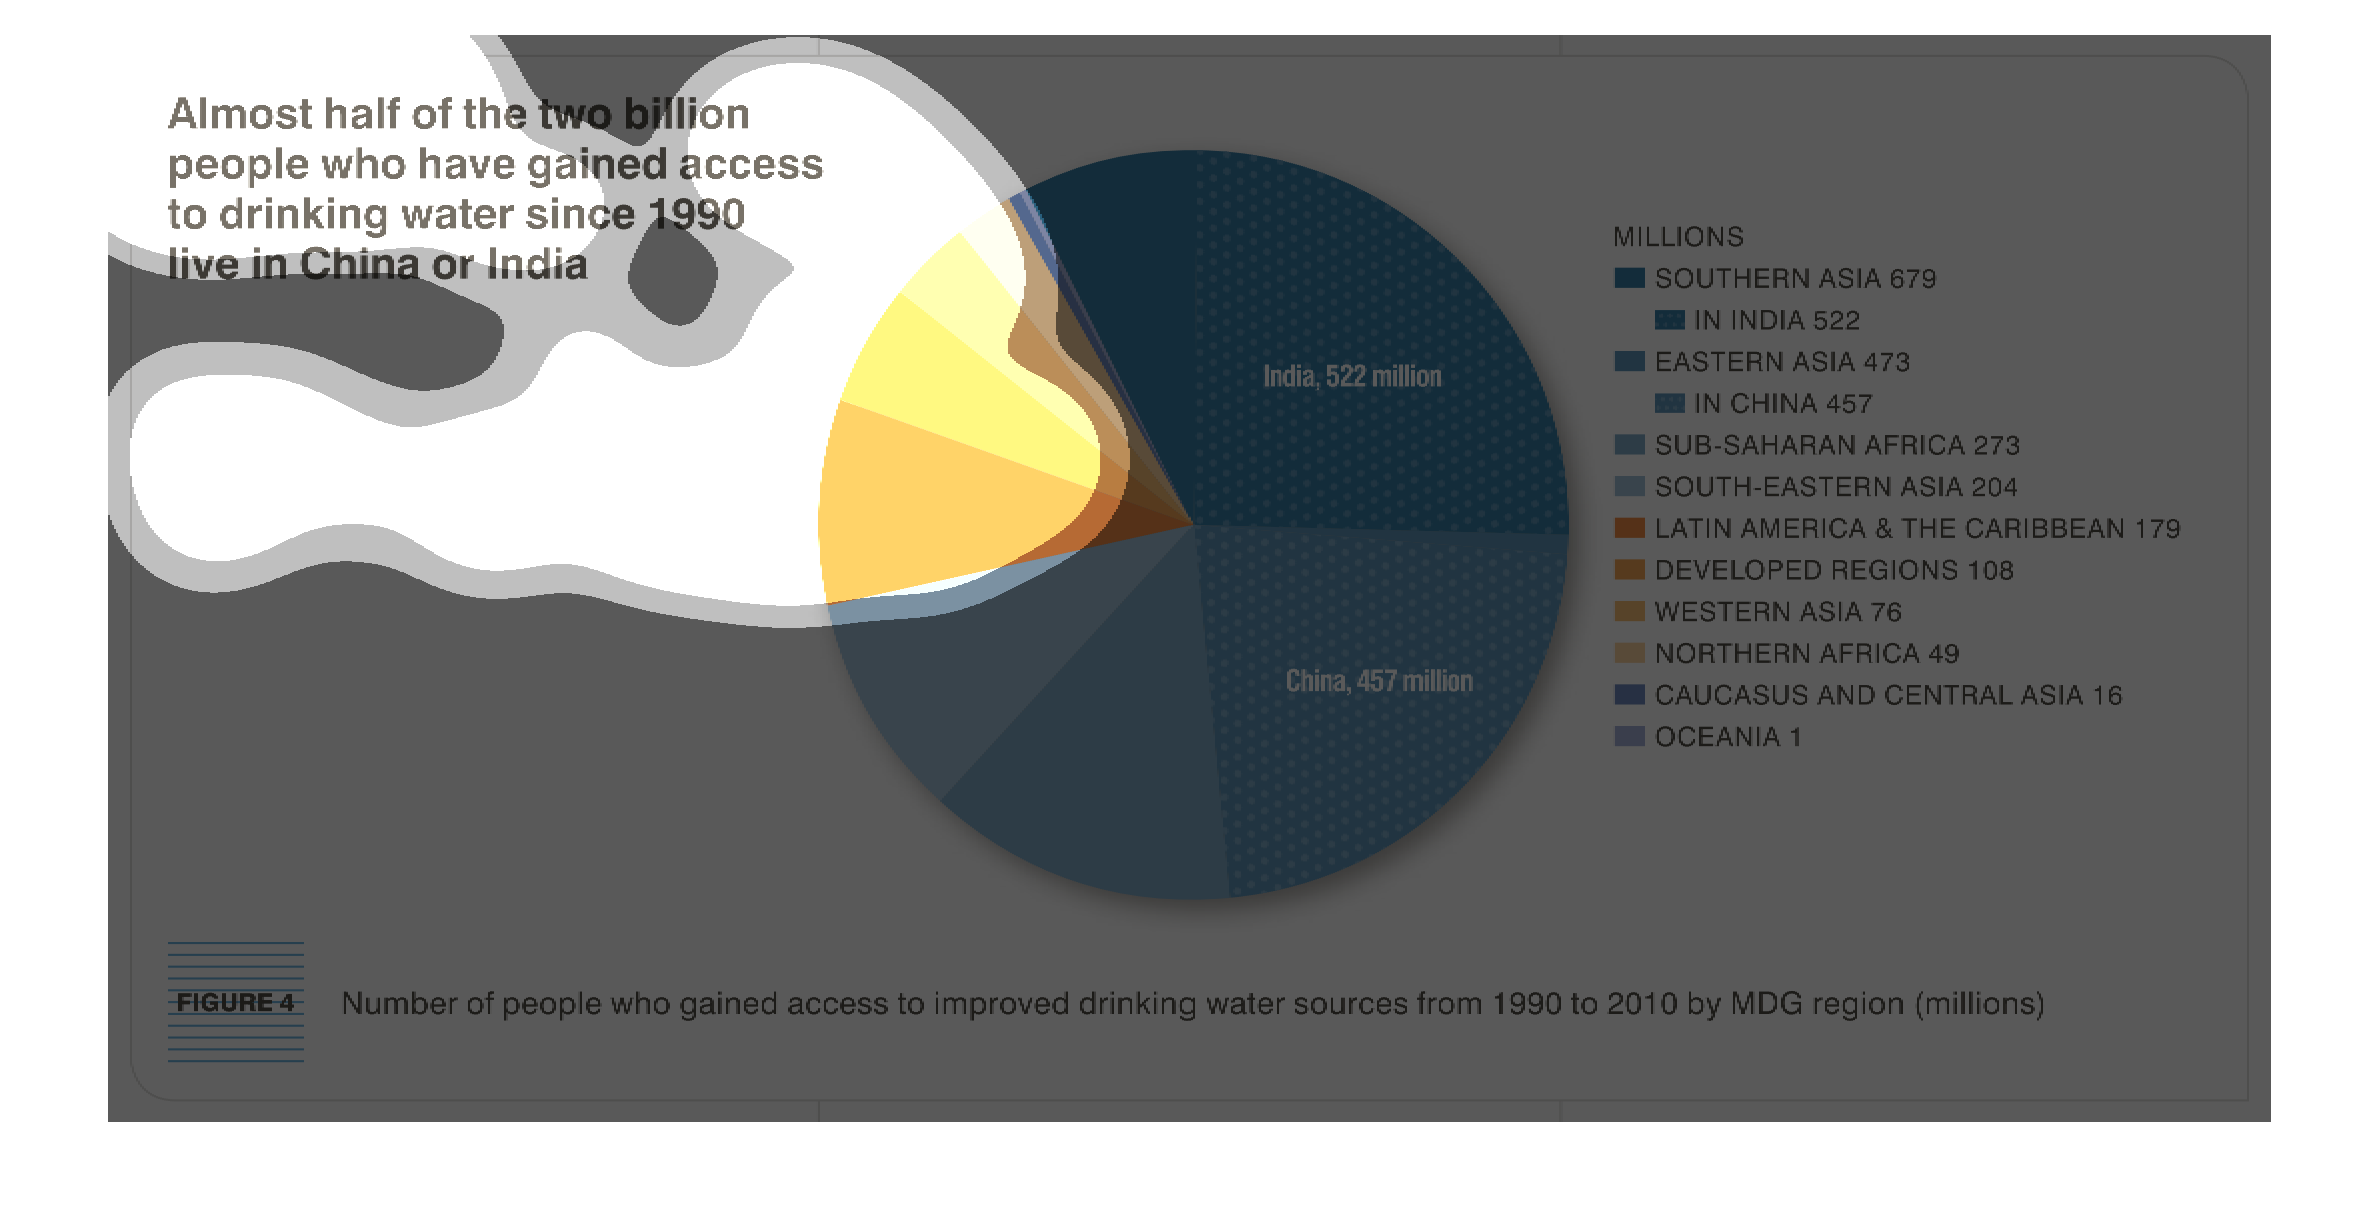
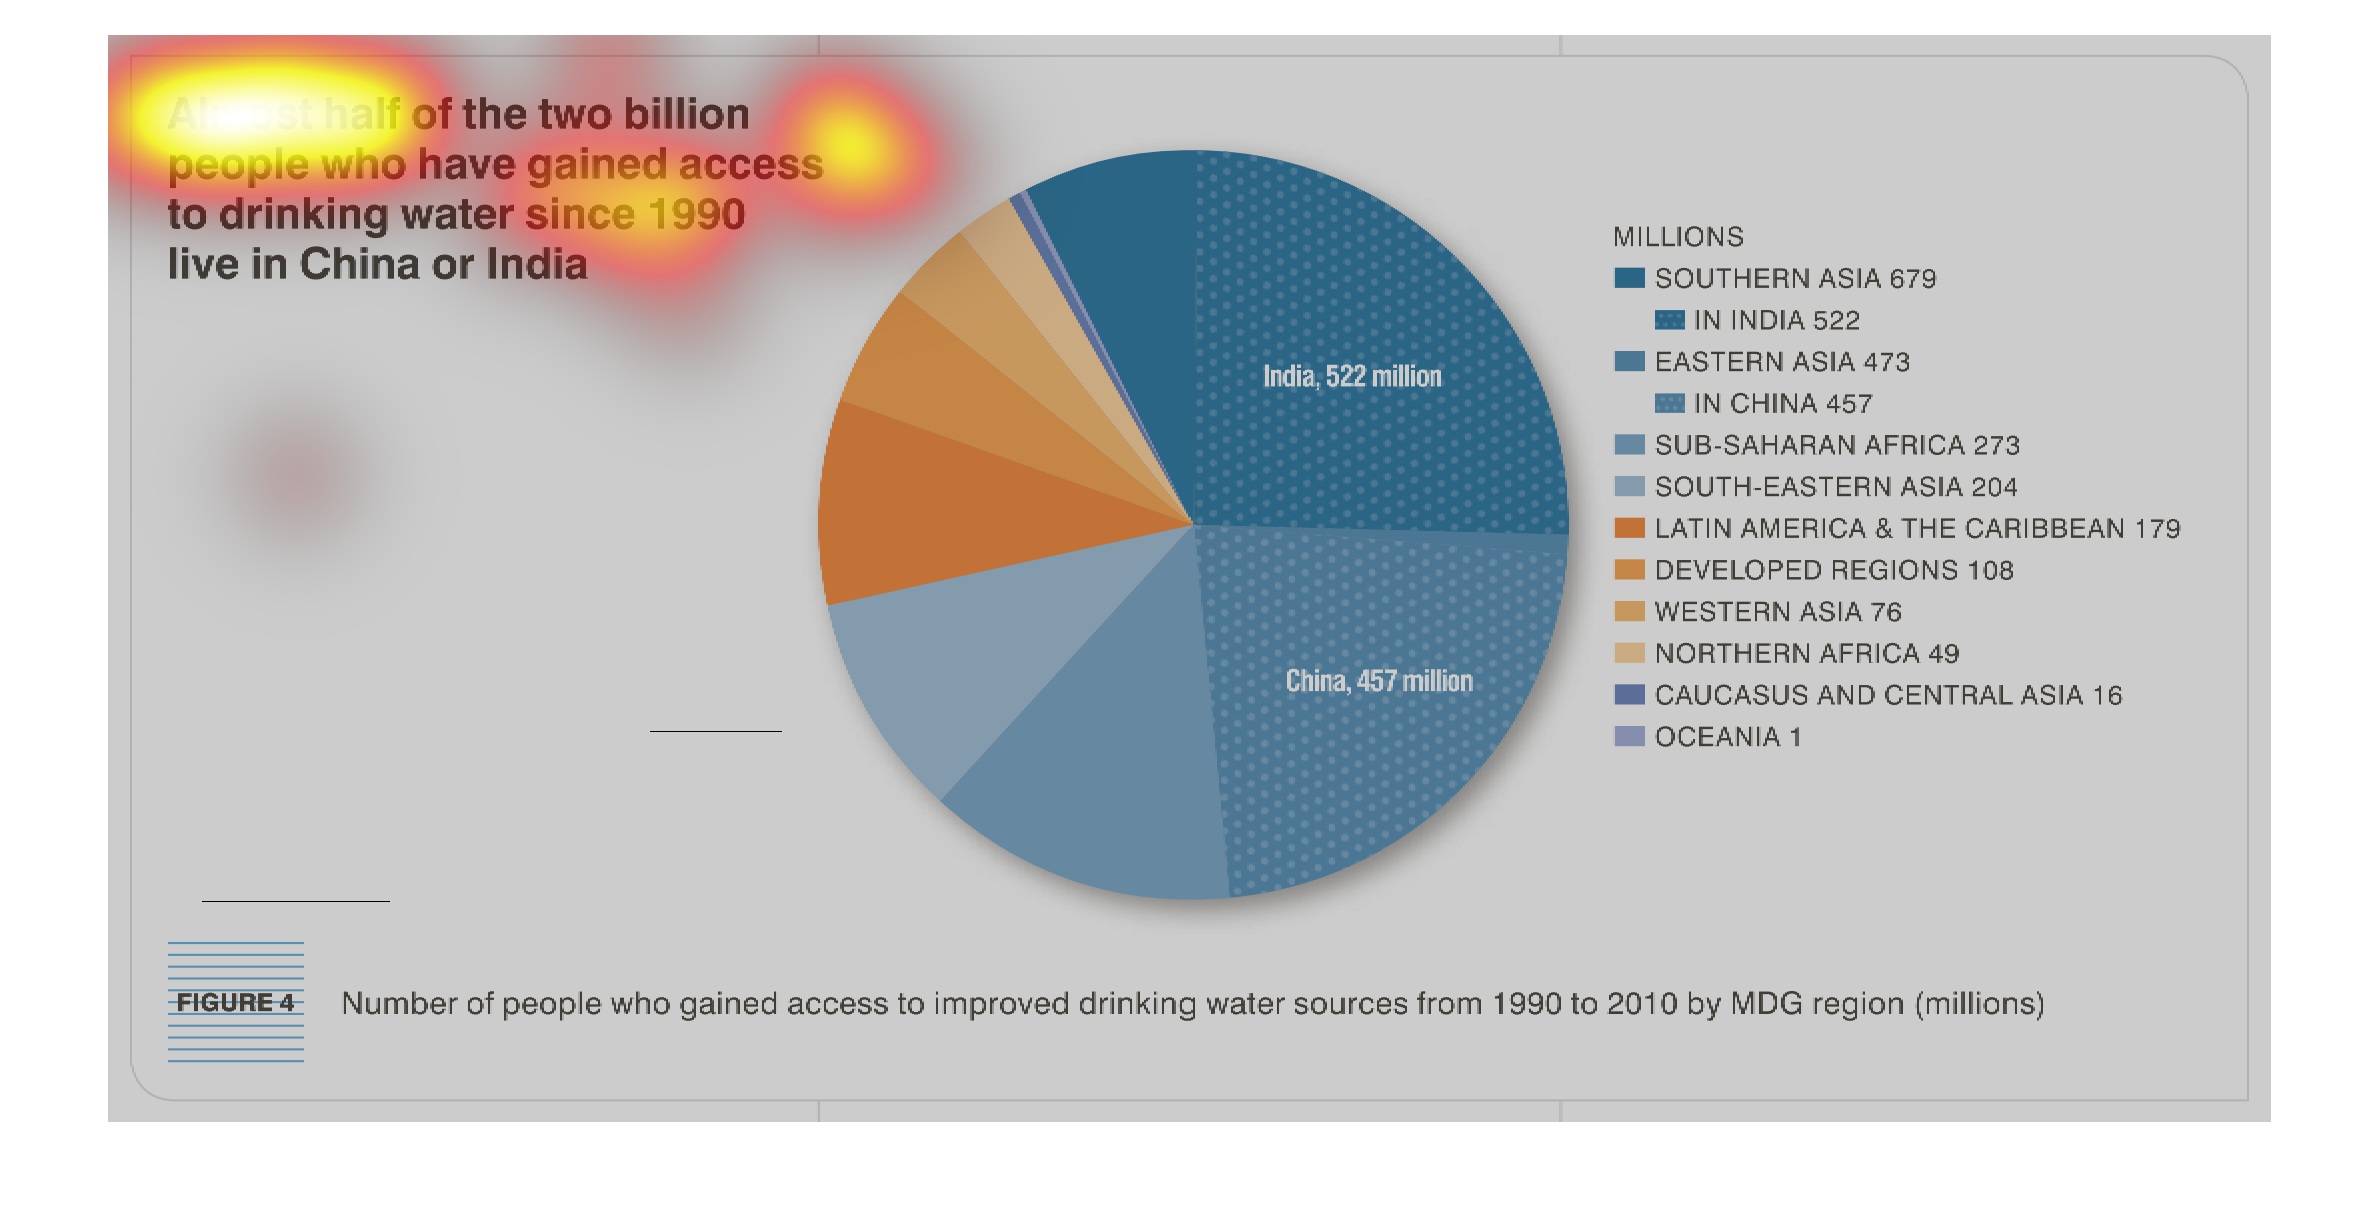
This is a color coded pie chart depicting that almost half of the two billion people who have
gained access to drinking water since 1990 line in China or India.