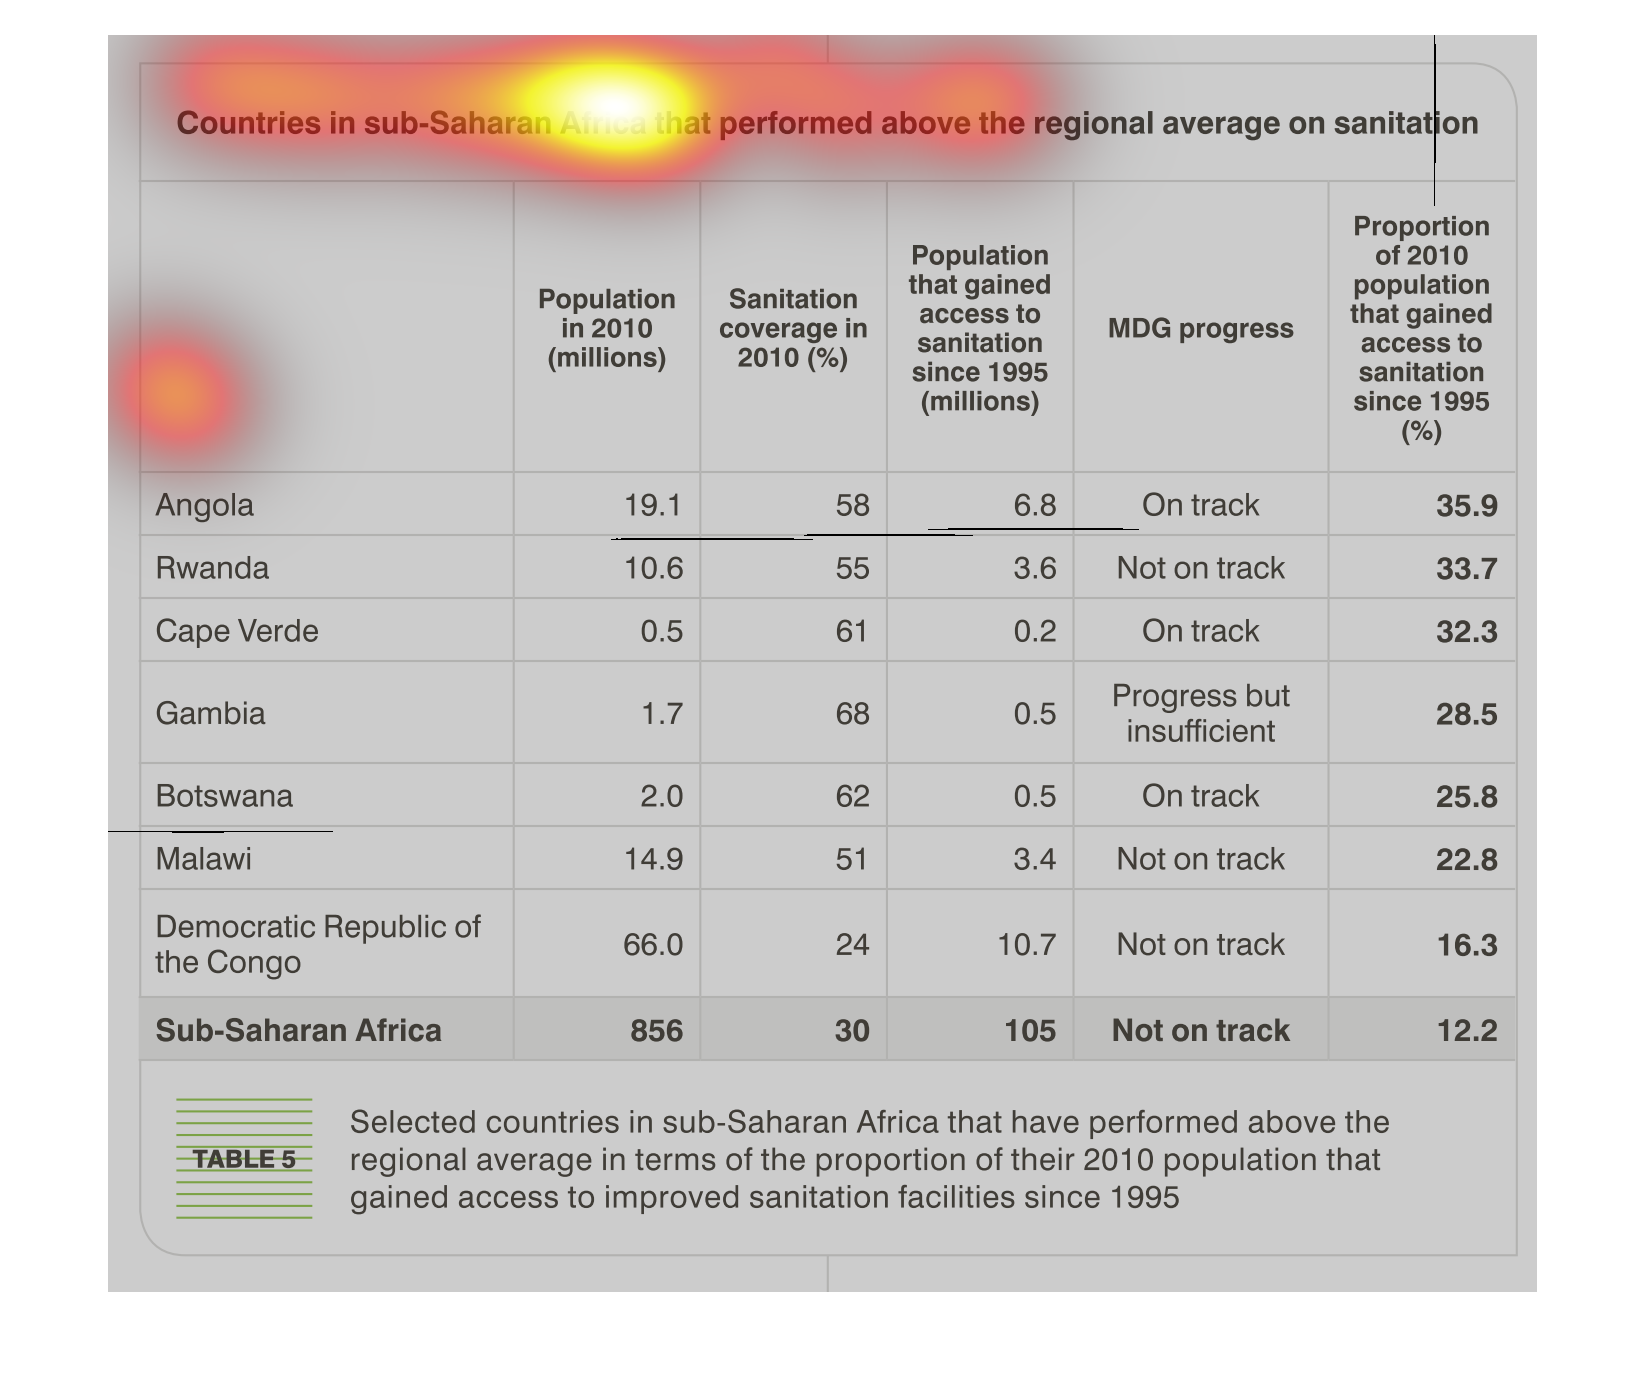
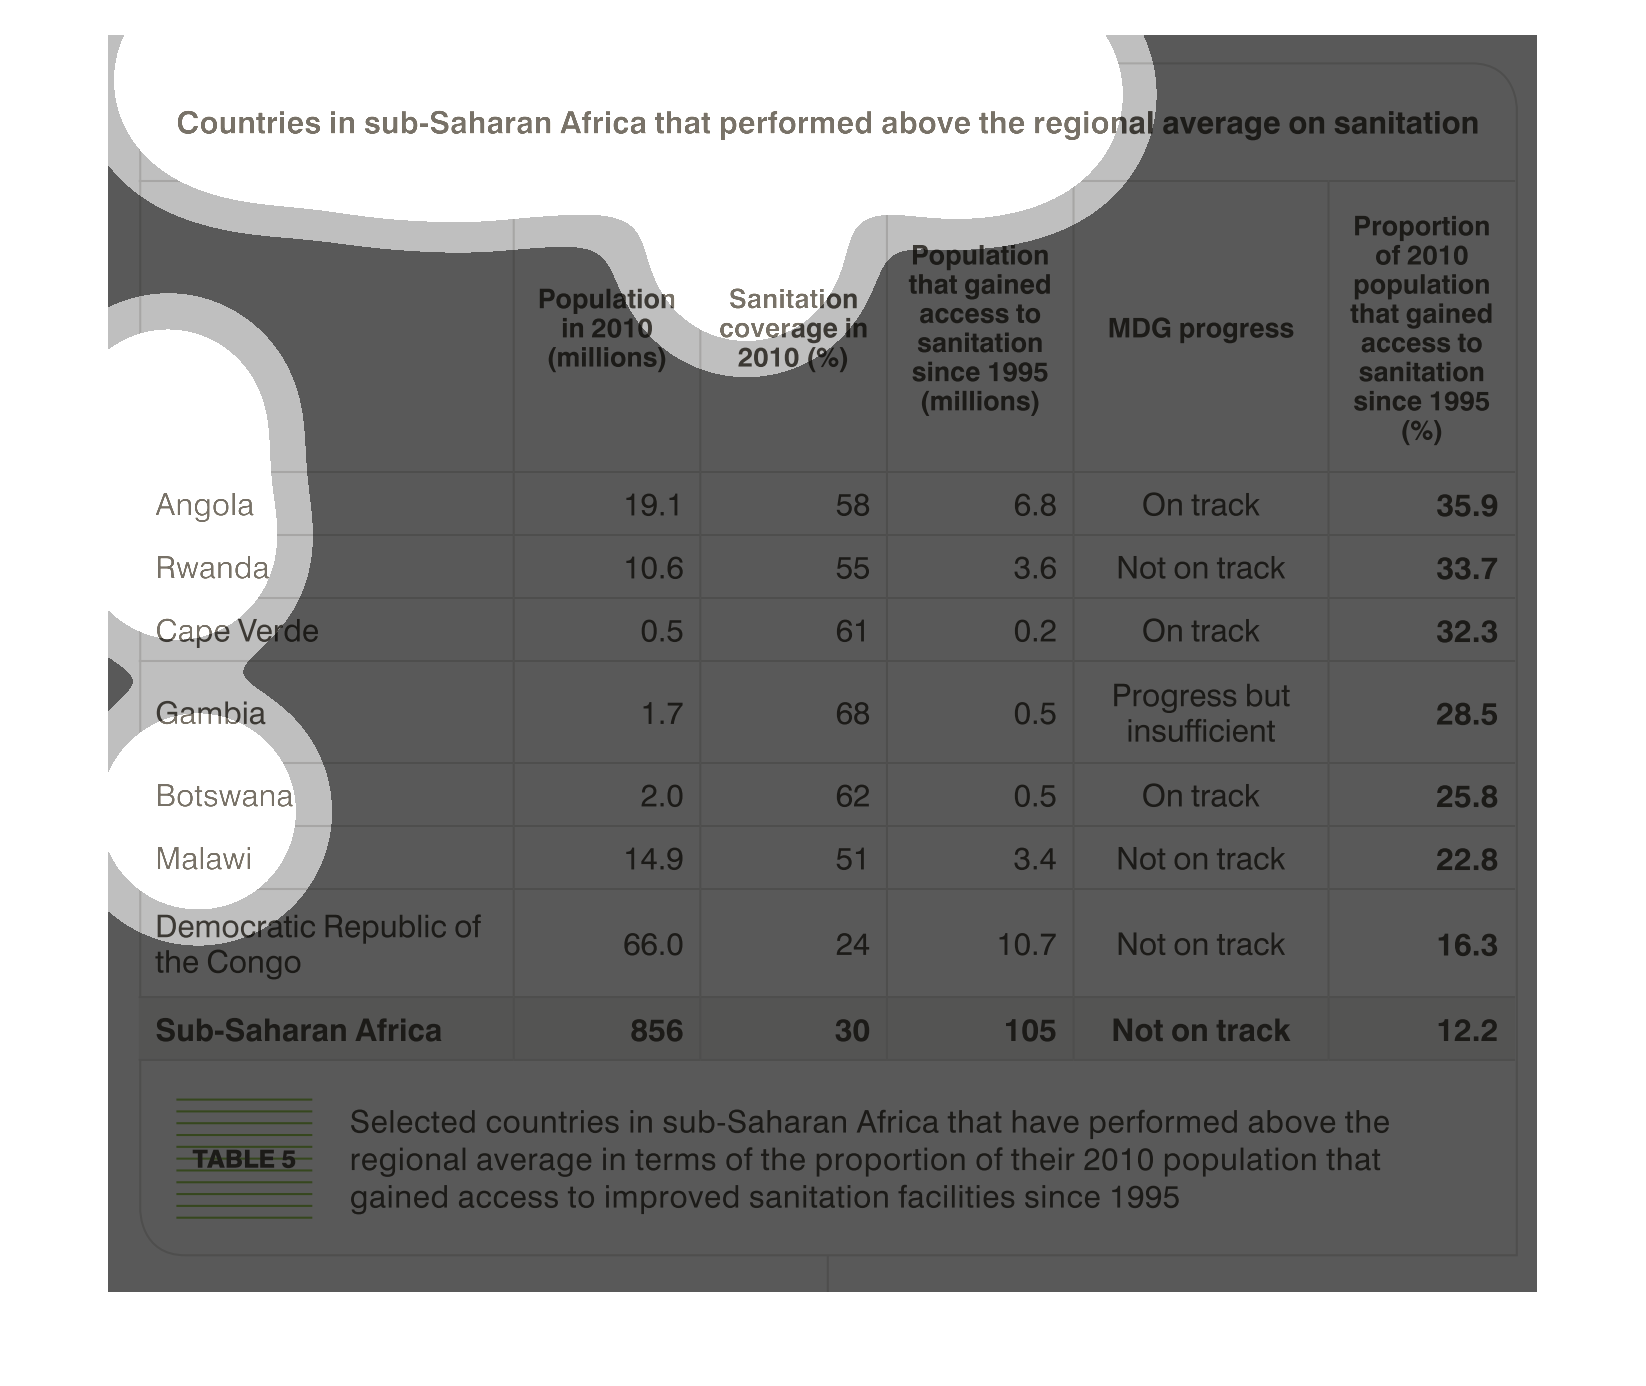
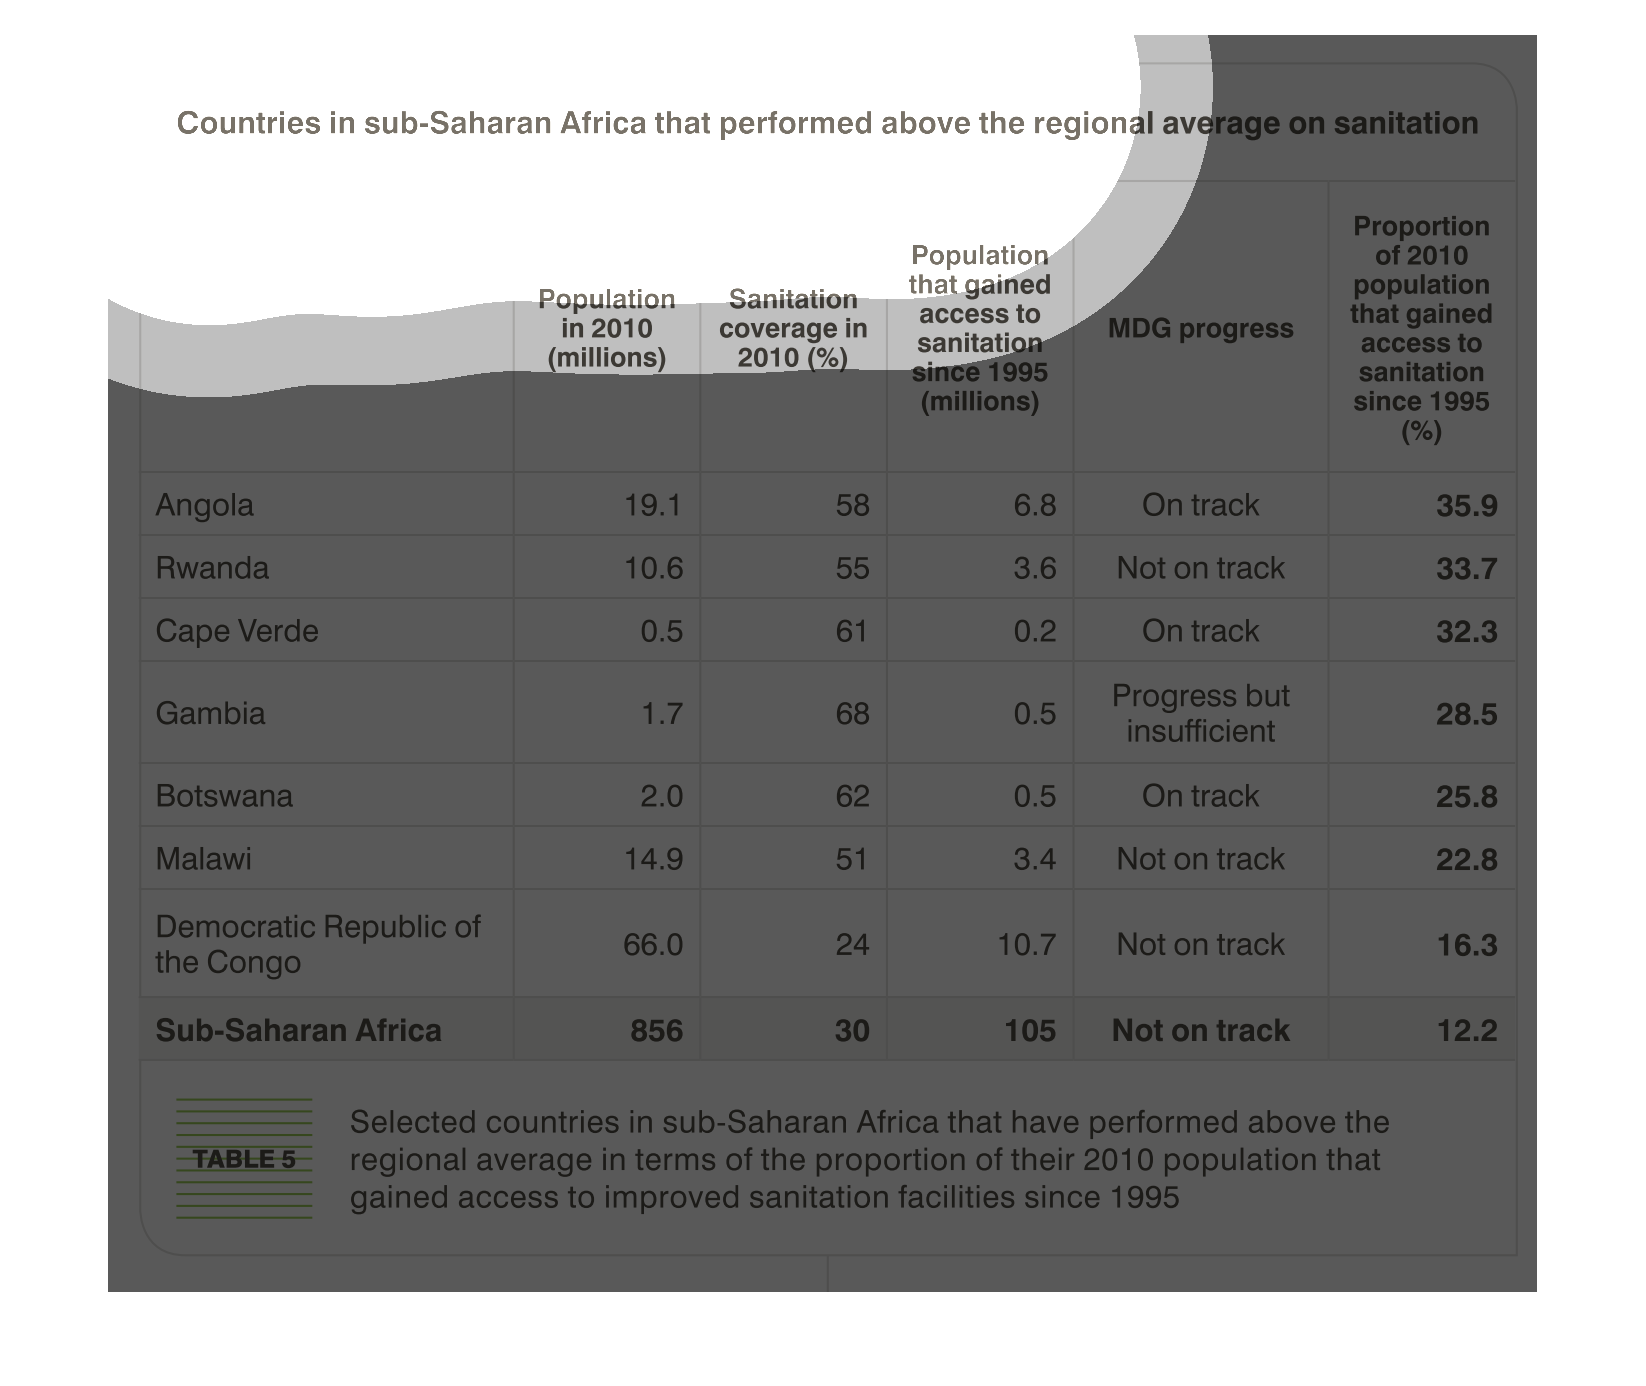
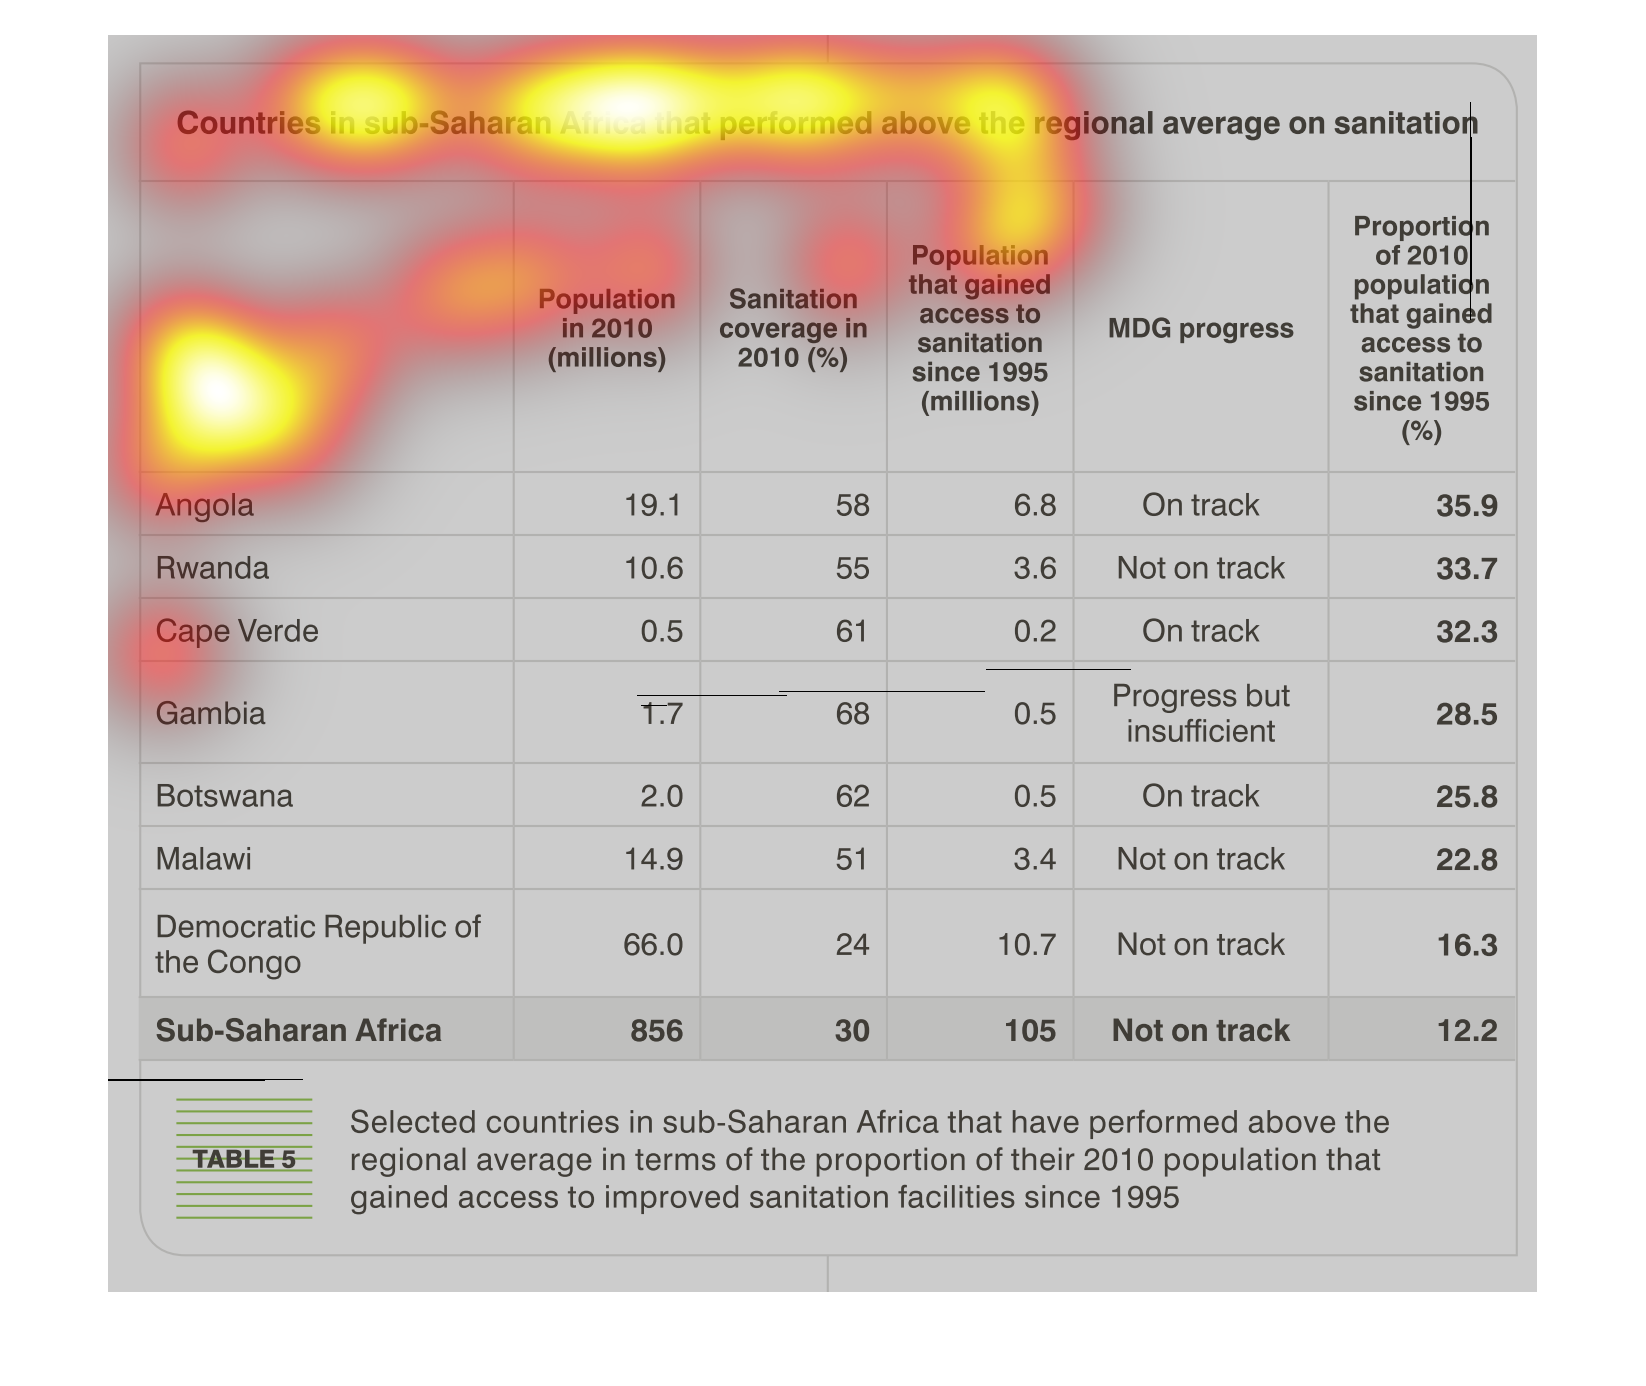
This chart describes countries in sub-Saharan Africa that performed above the regional average
on sanitation. Categories on the chart include Rwanda and Cape Verde.
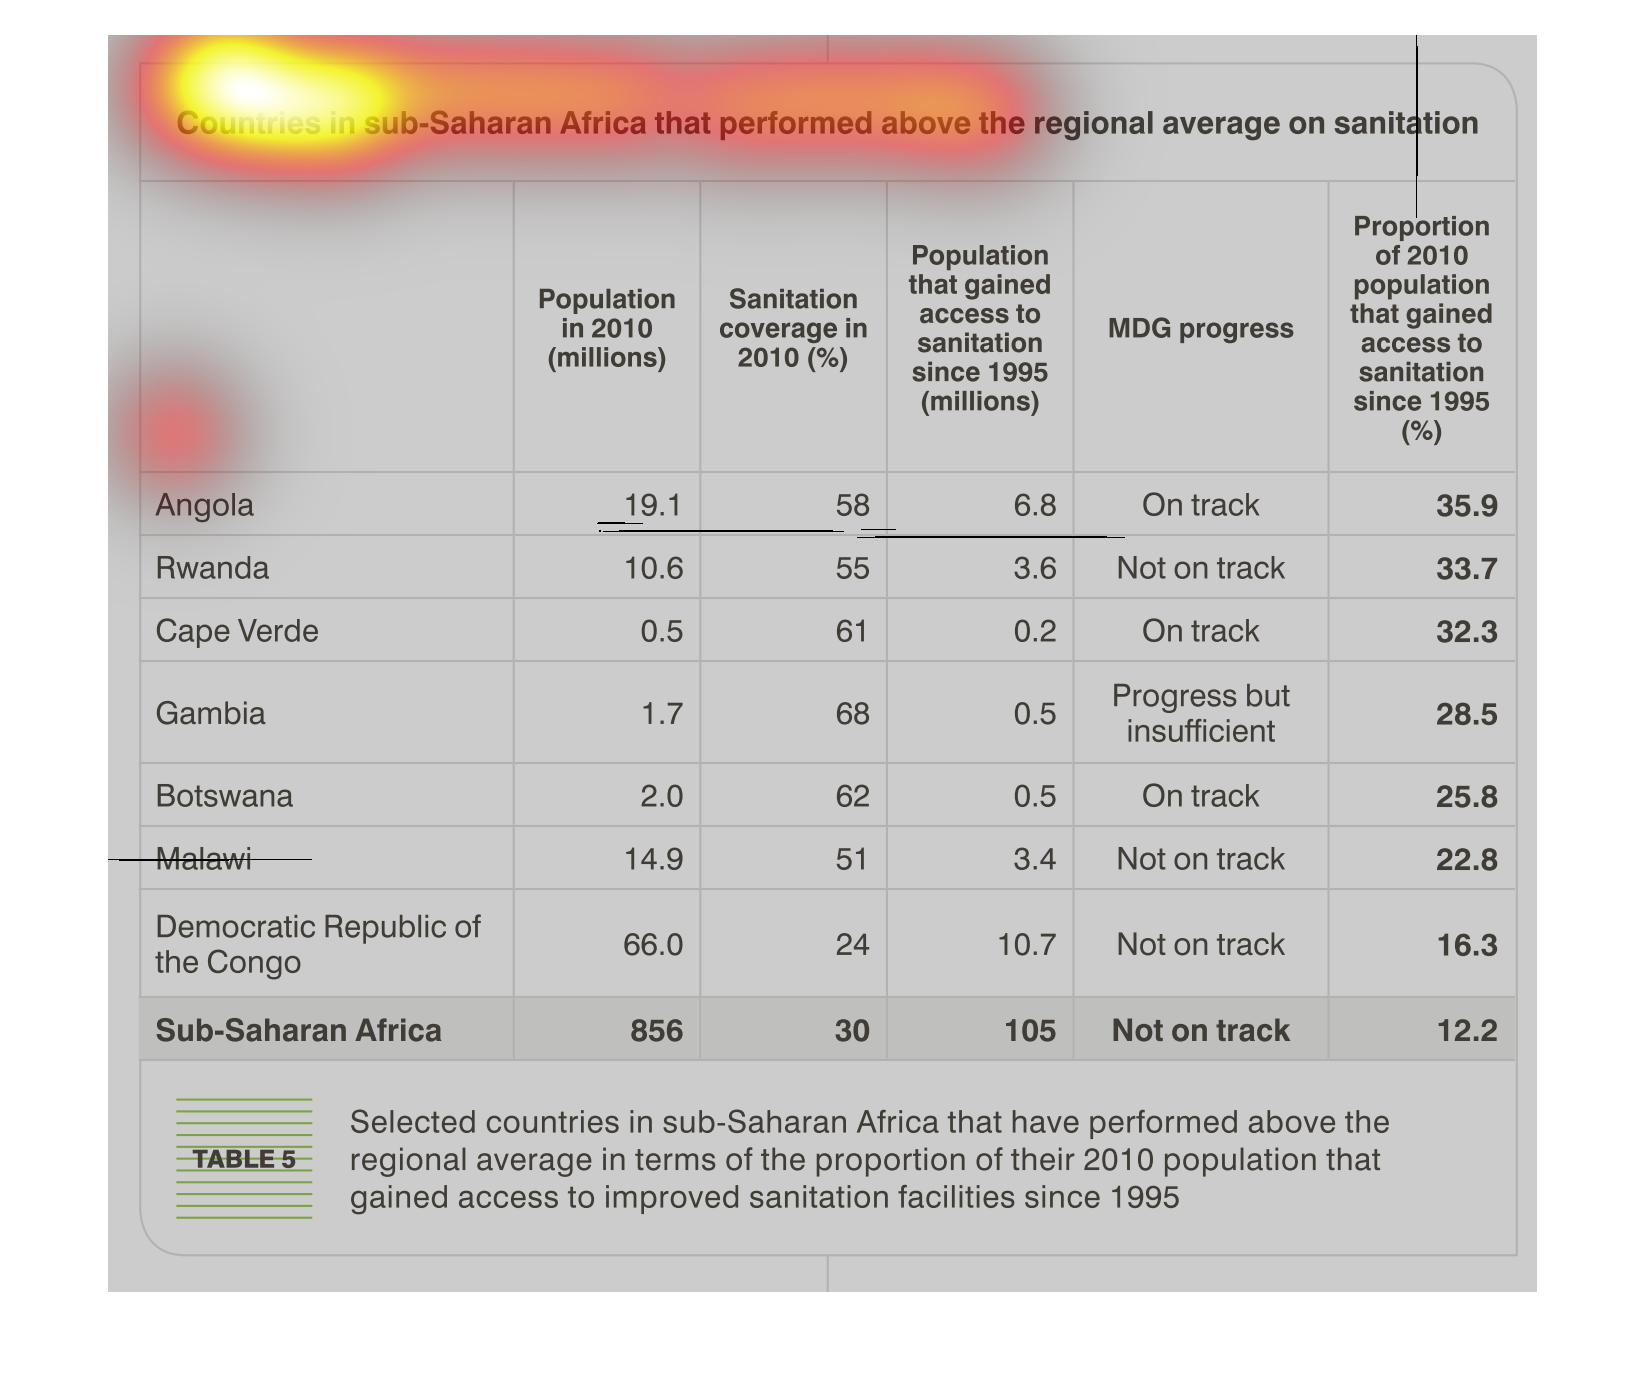
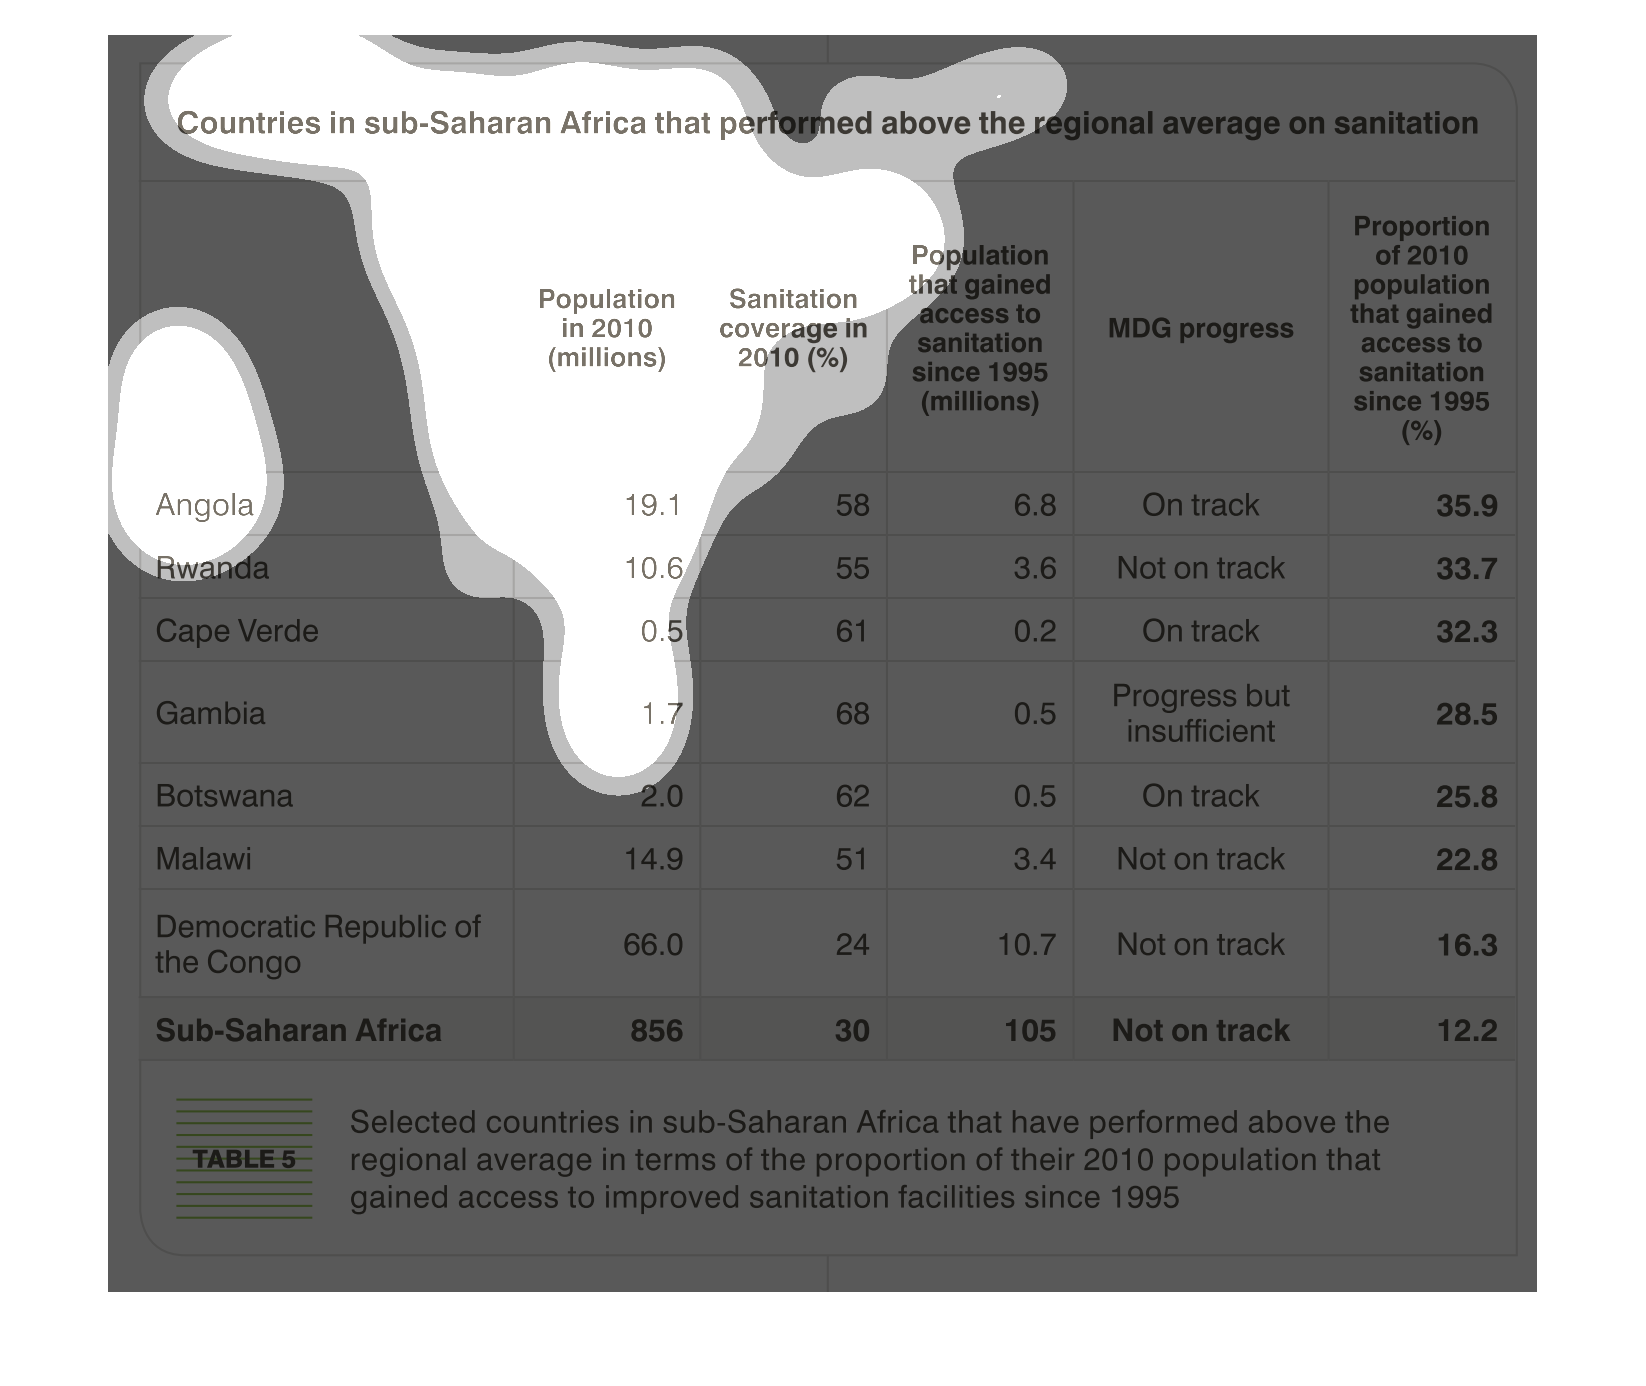
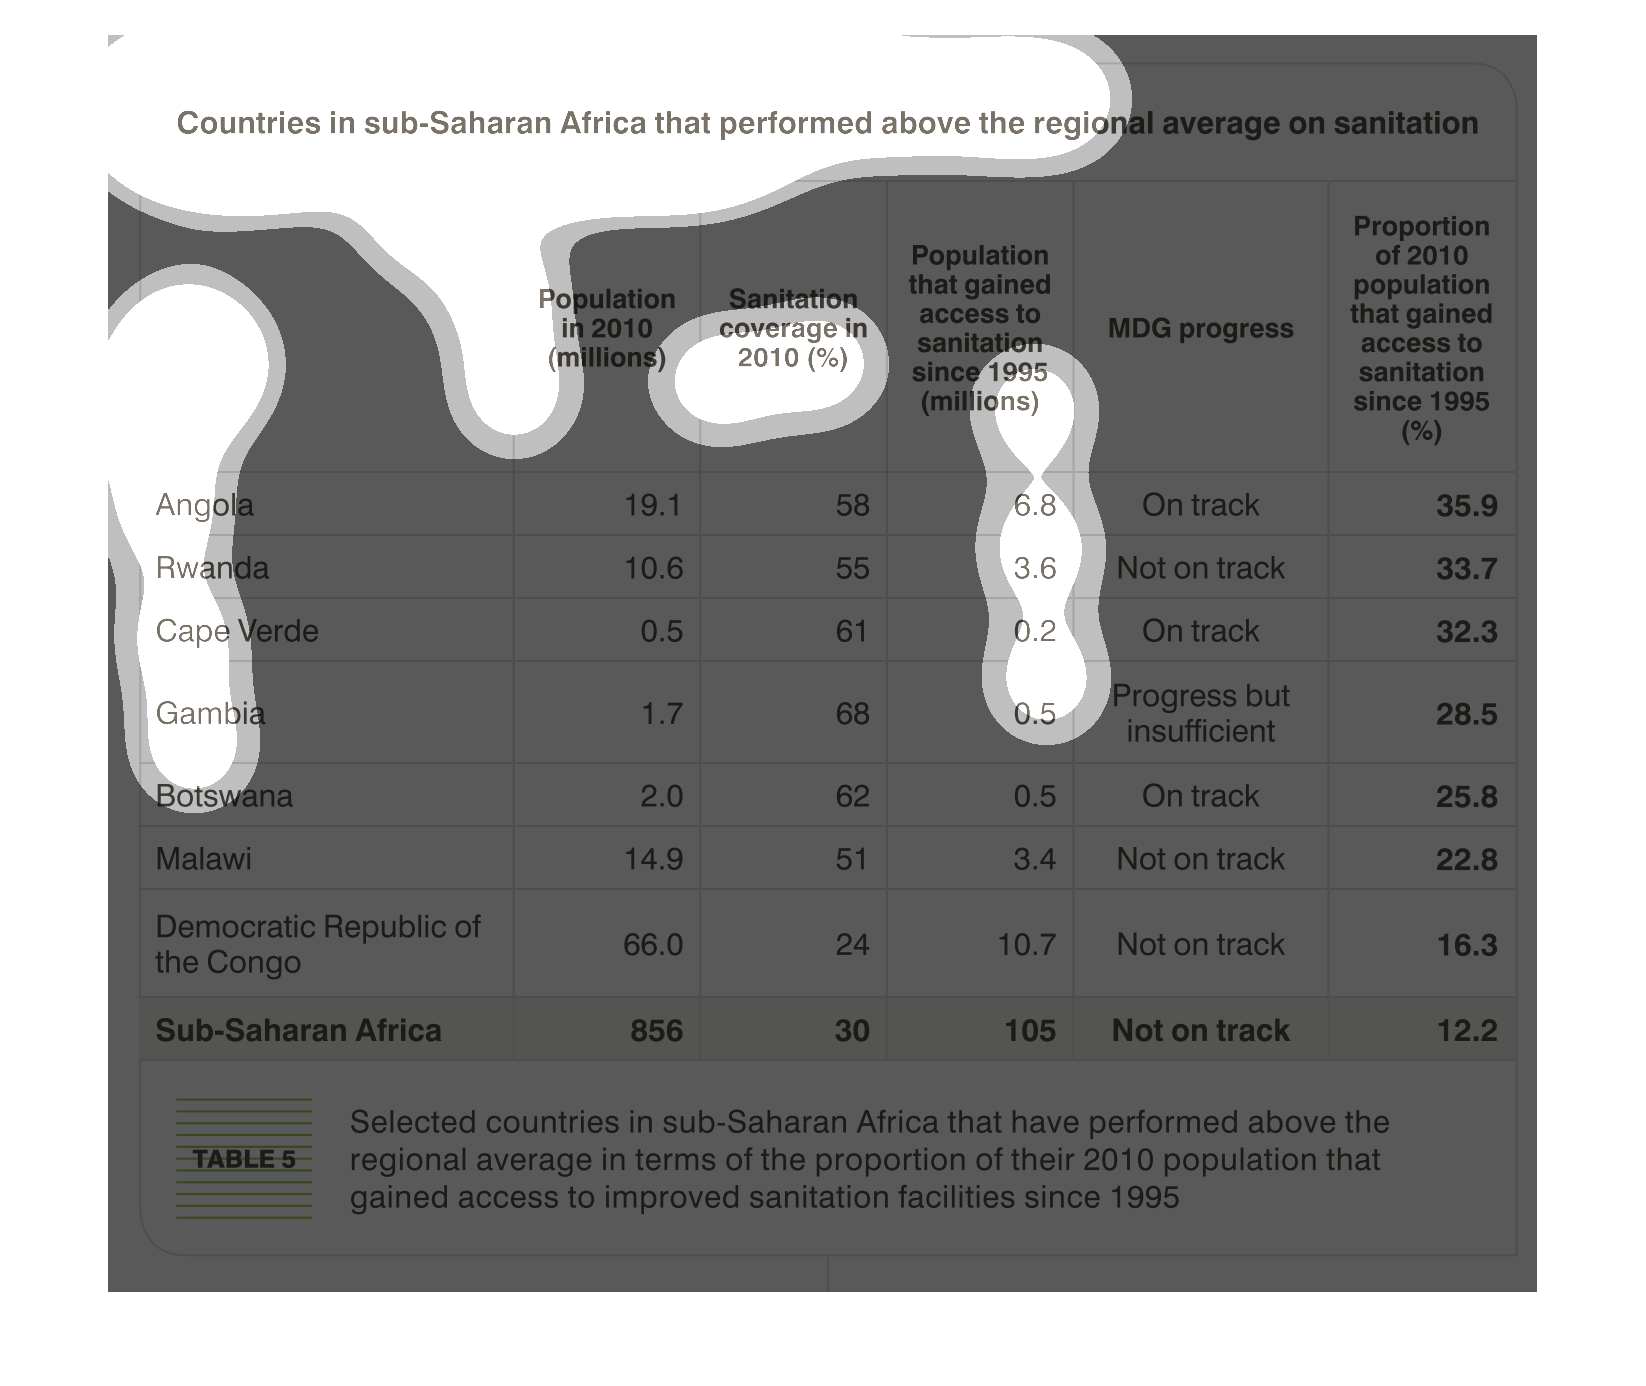
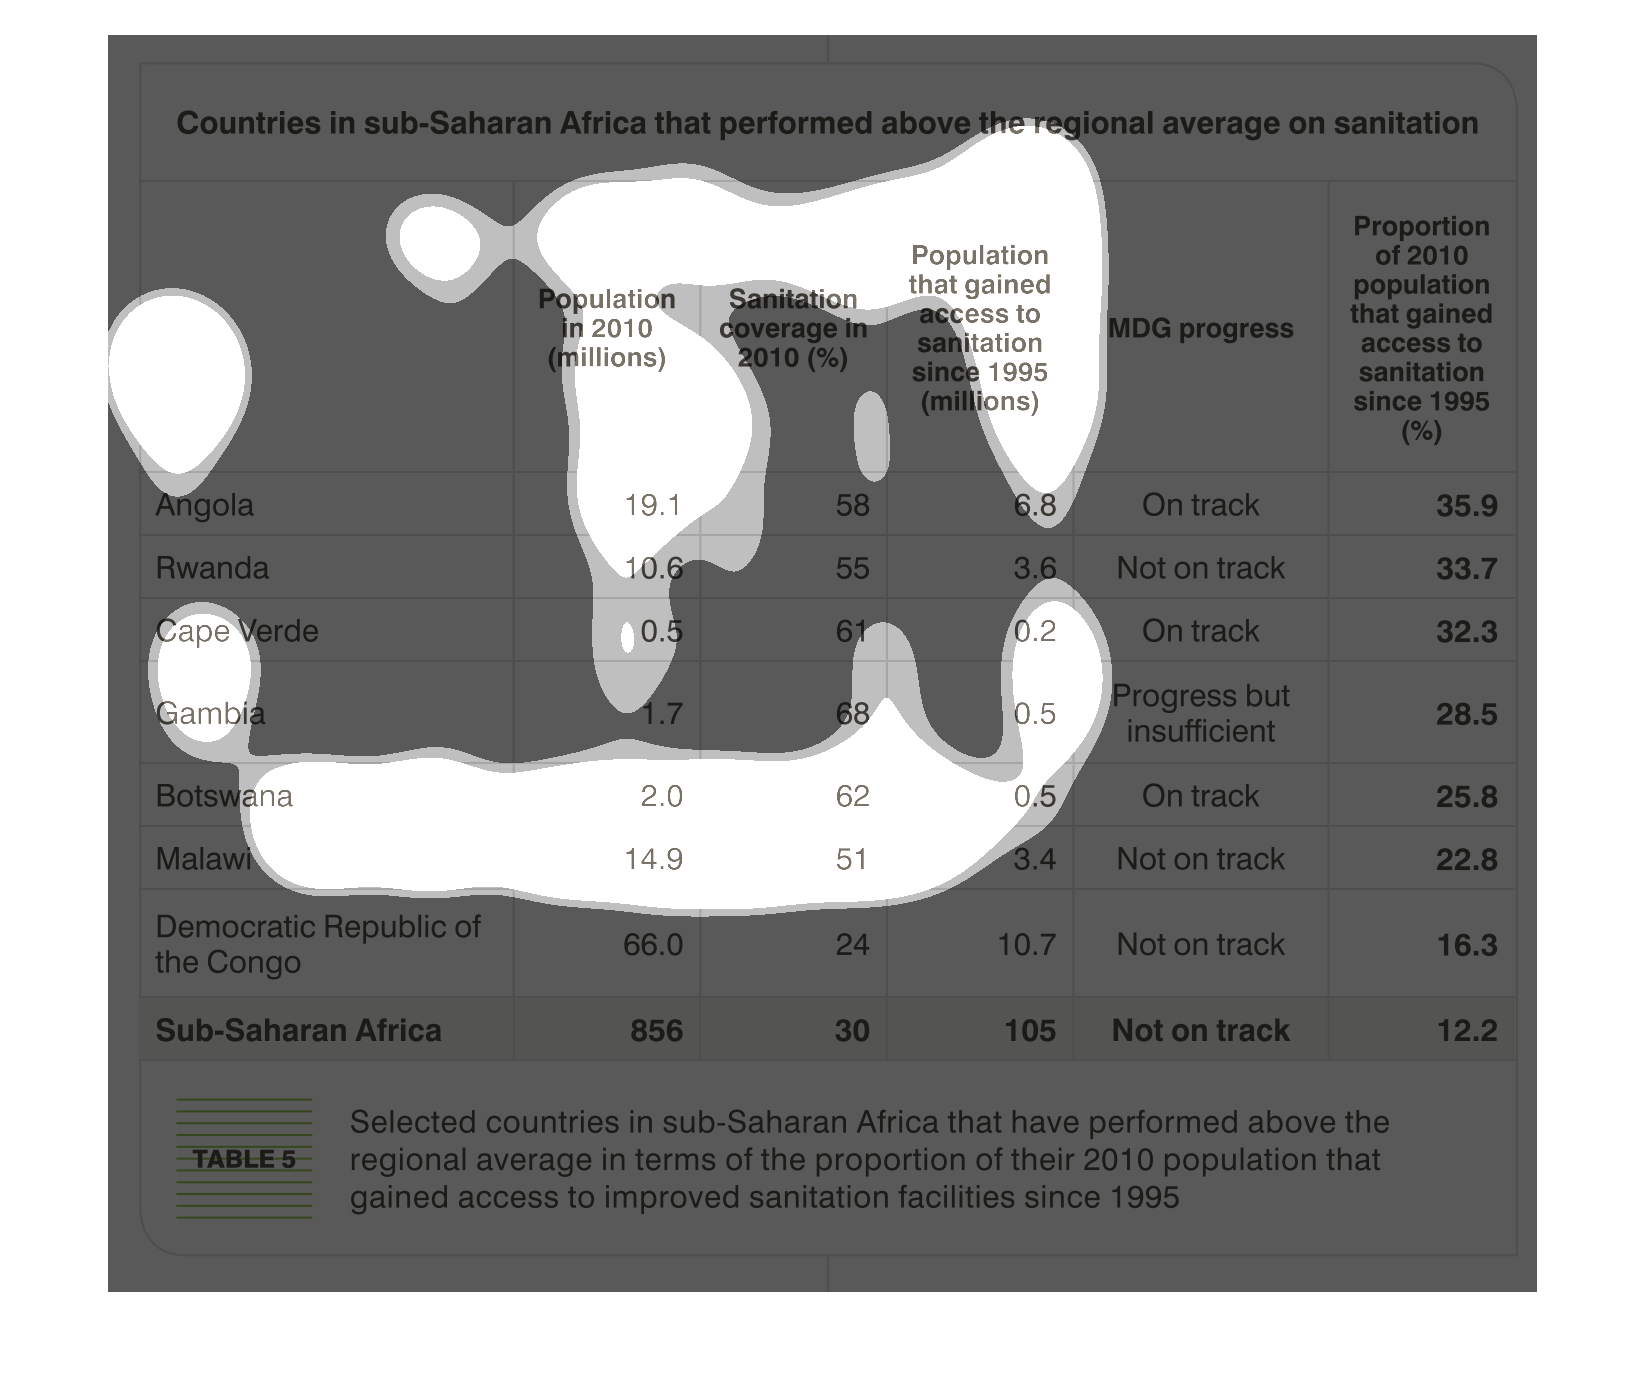
this is a chart showing the countries in sub-Saharan Africa that performed above the regional
average on sanitation. The country with the highest sanitation average in 2010 was Gambia.
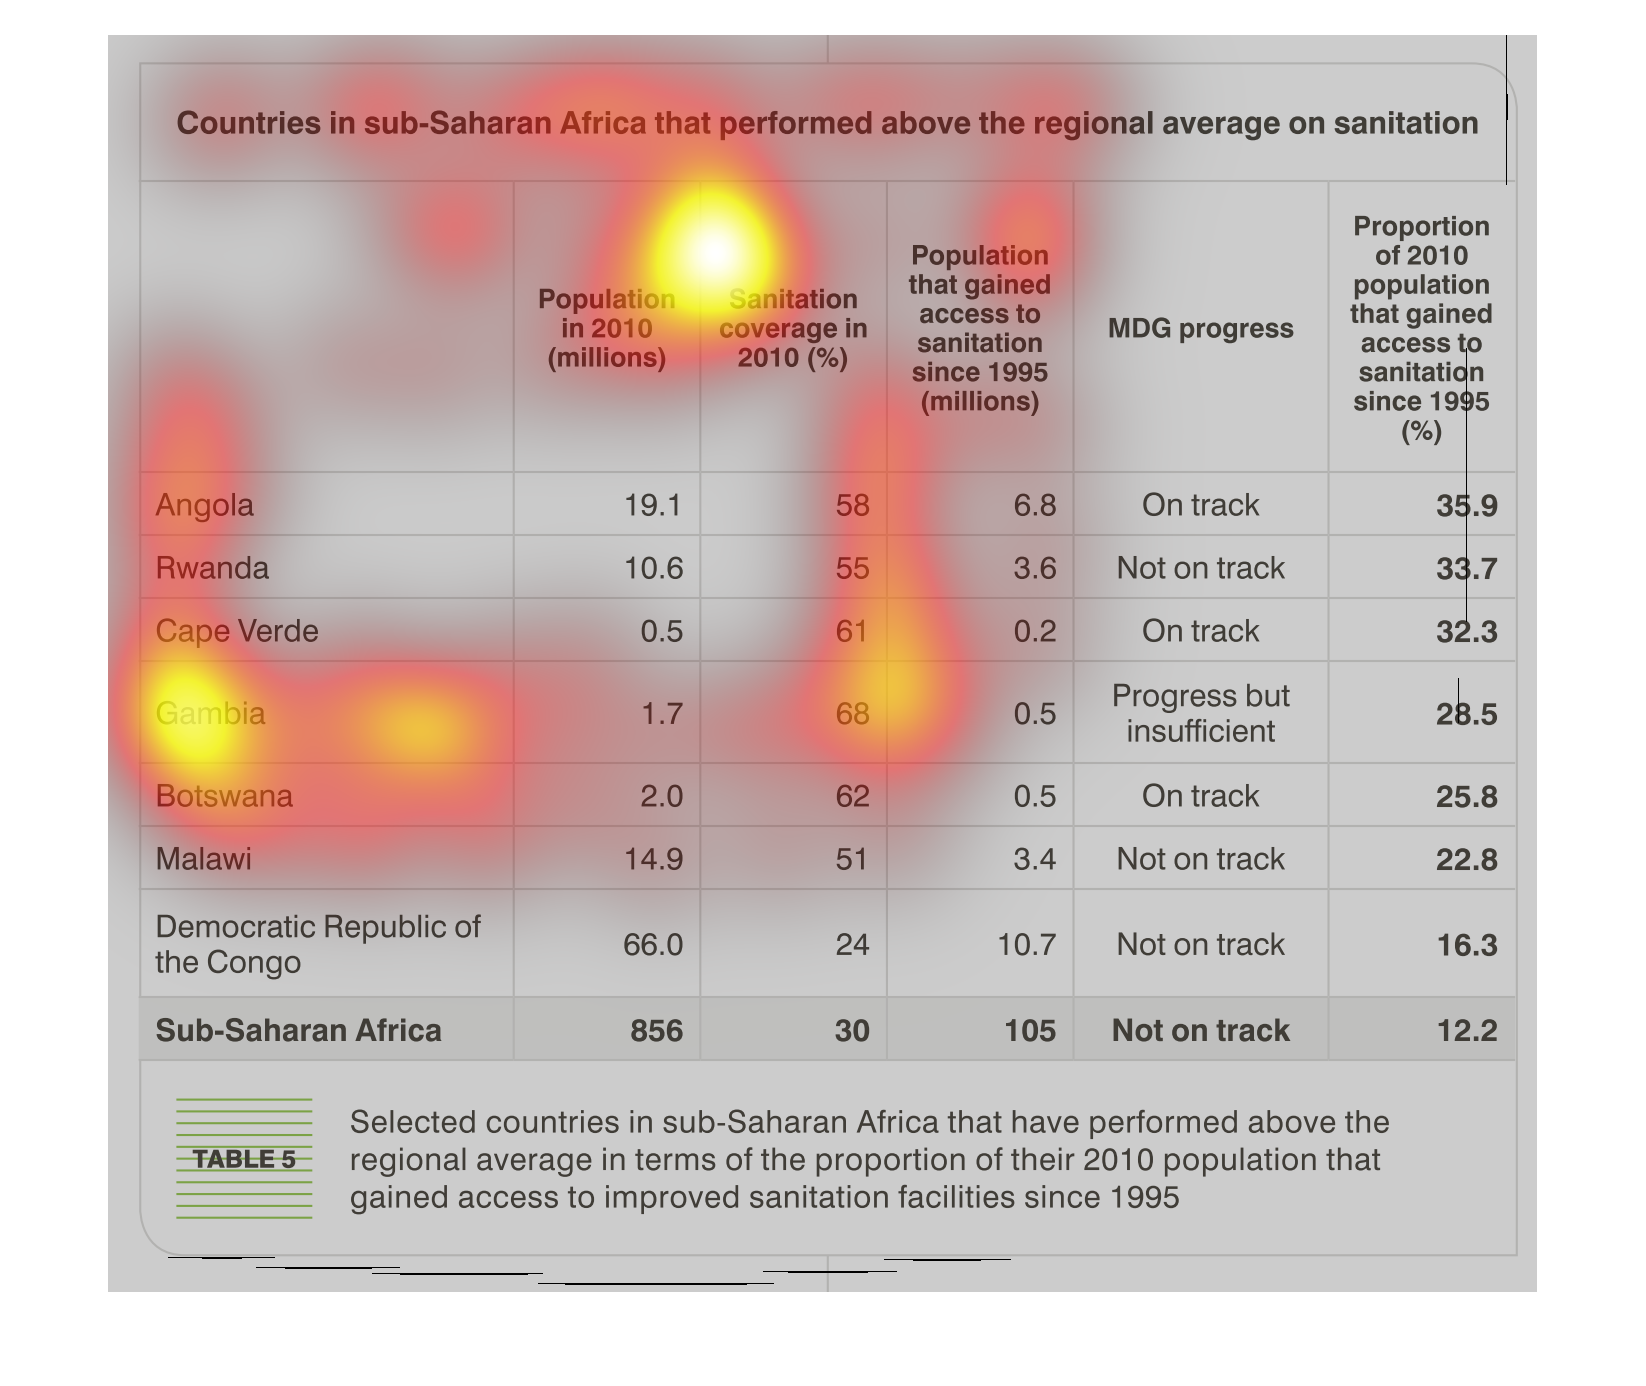
This chart describes countries in sub-Saharan Africa that performed above the regional average
on sanitation. Countries on the chart include Angola and Rwanda.
This chart shows the levels of sanitation go for the given countries in sub-Saharan Africa.
It also provides information about the population of the countries.
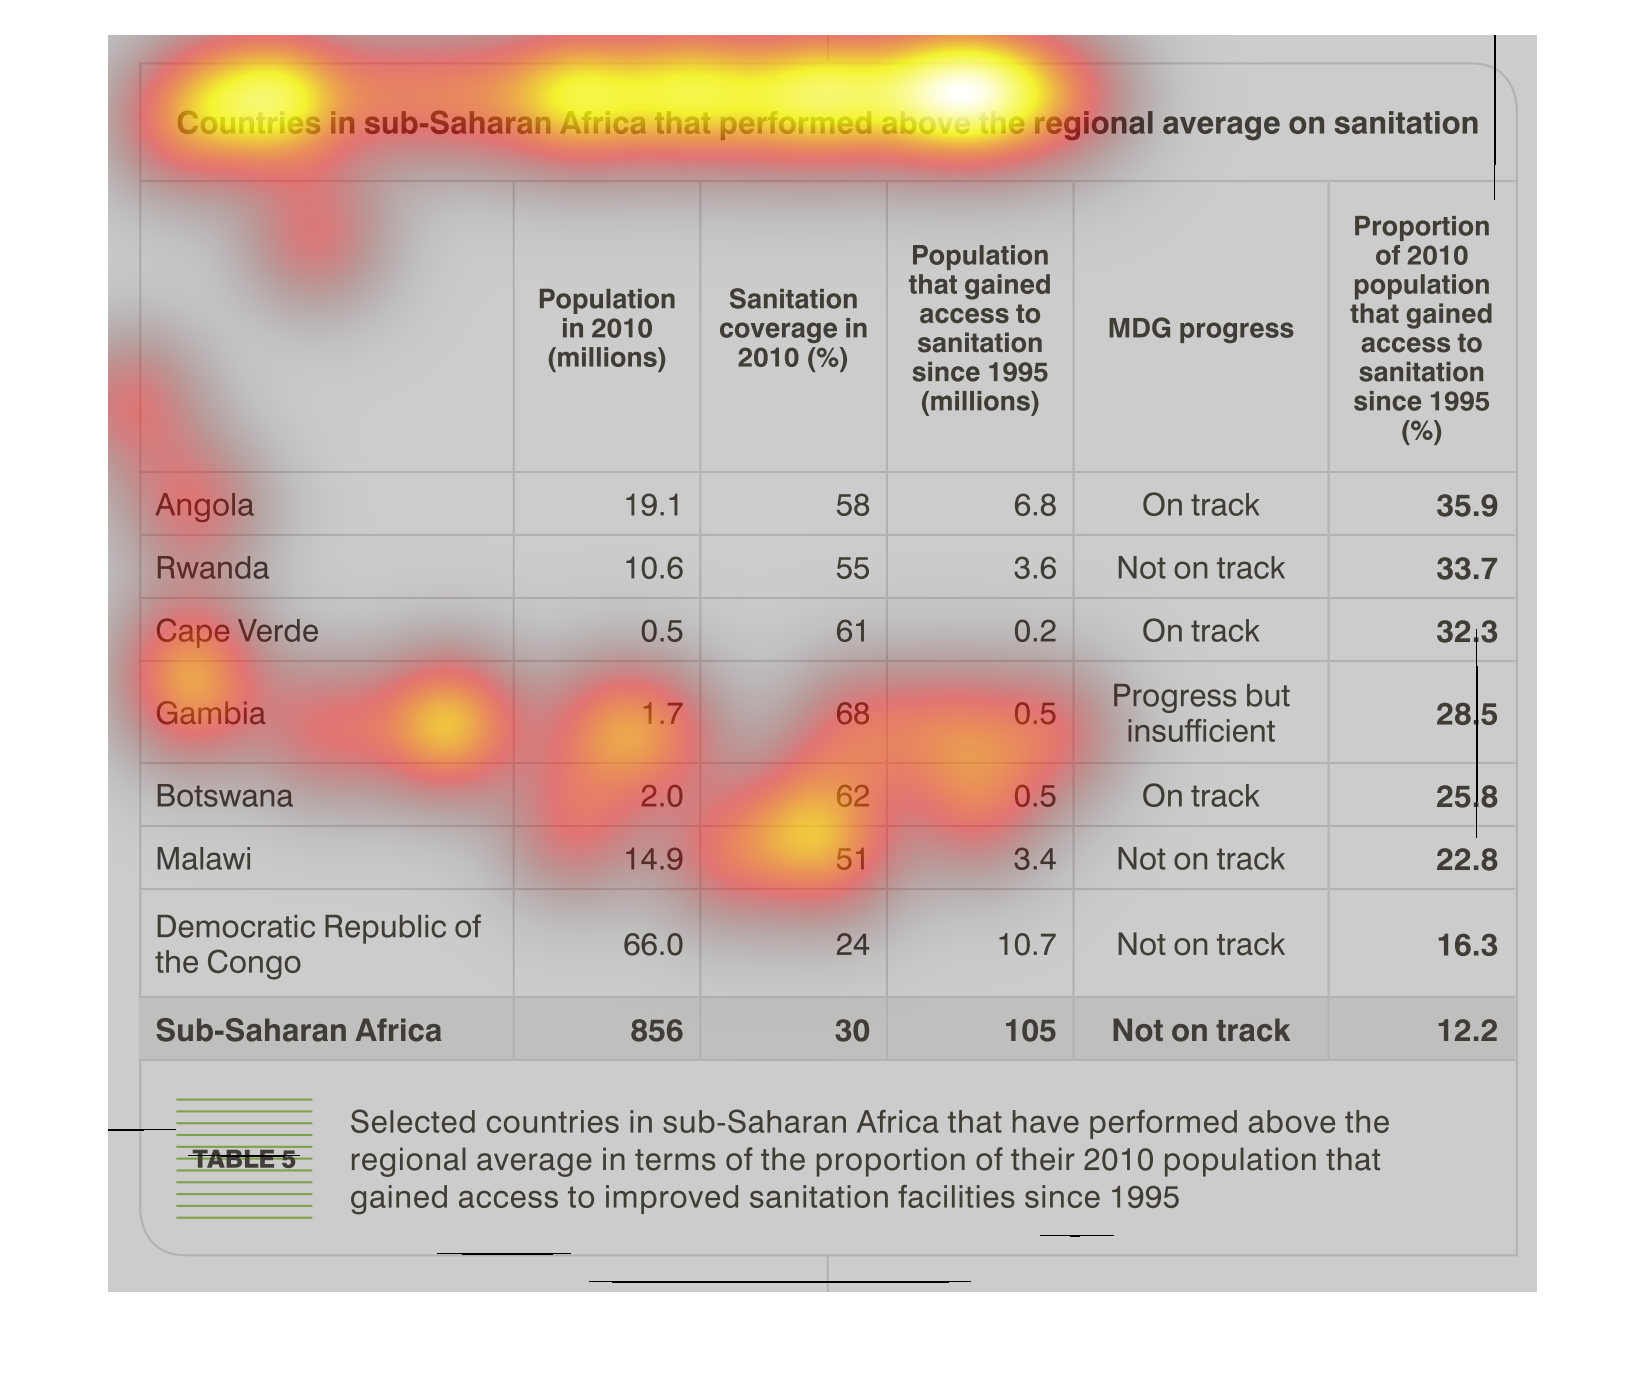
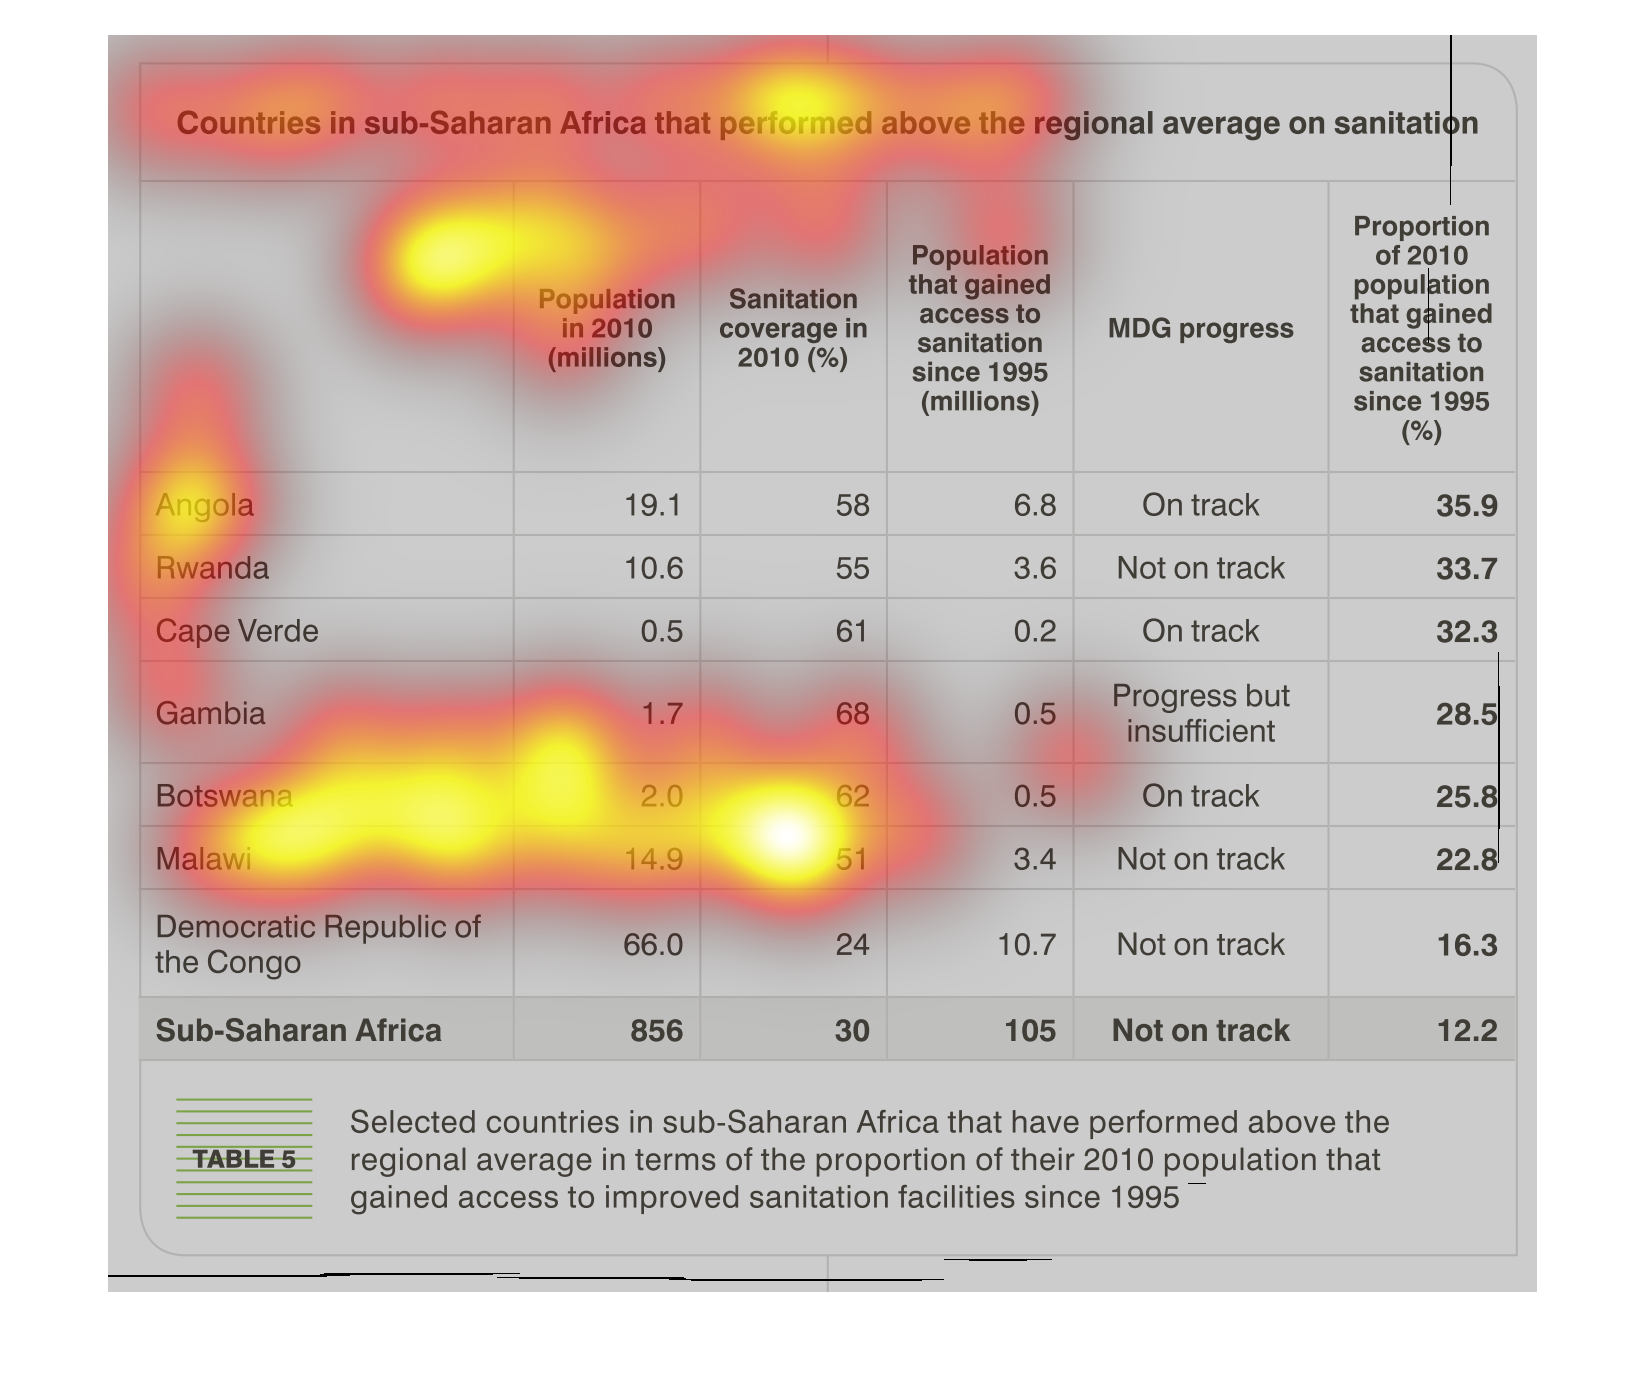
this chart shows the conditions in African countries and its progress. The number specifies
exact information that correlates to population, sanitation conditions and economy progress.
The graph contained within this images seems to detail the varying levels of of performance
in dealing with sanitation within the geographical location of sub-Saharan Africa
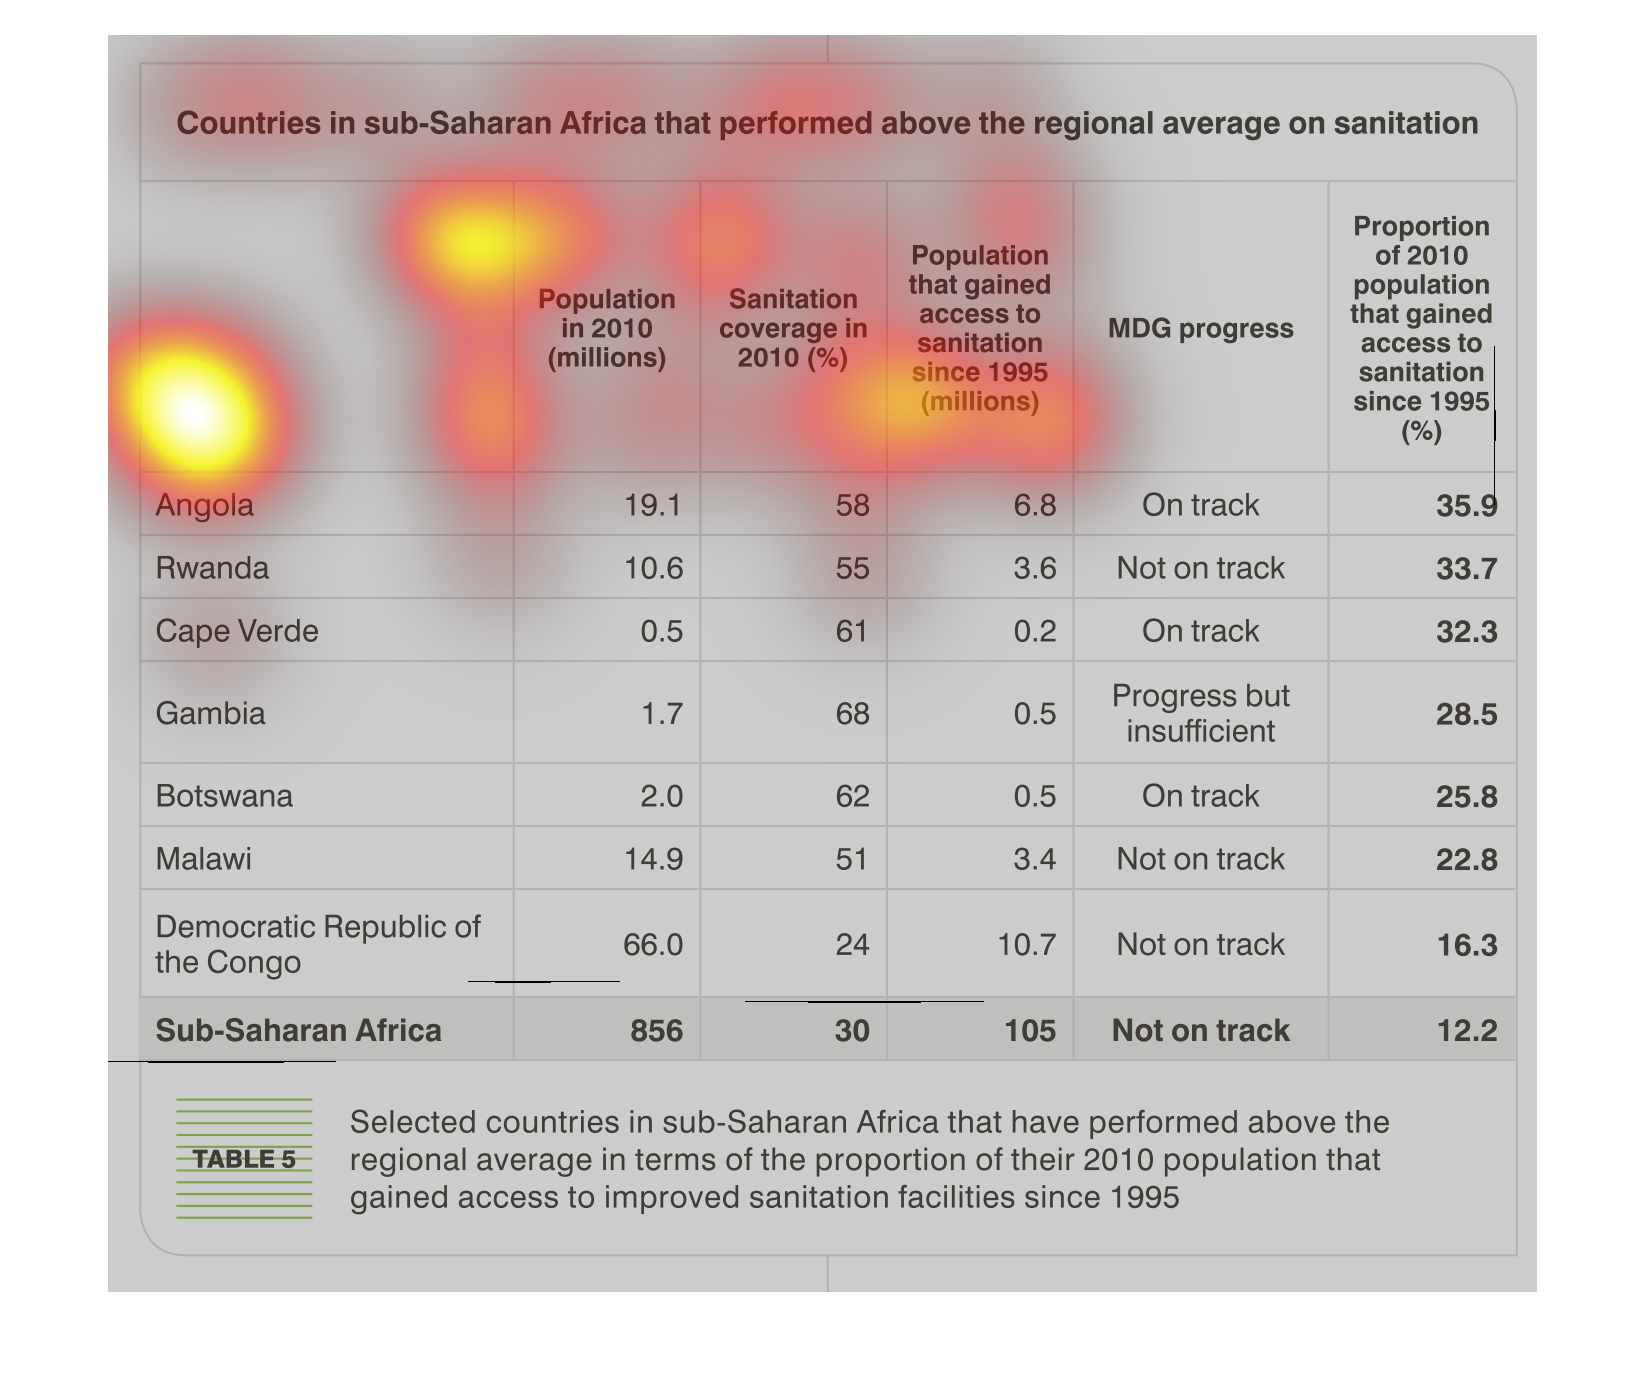
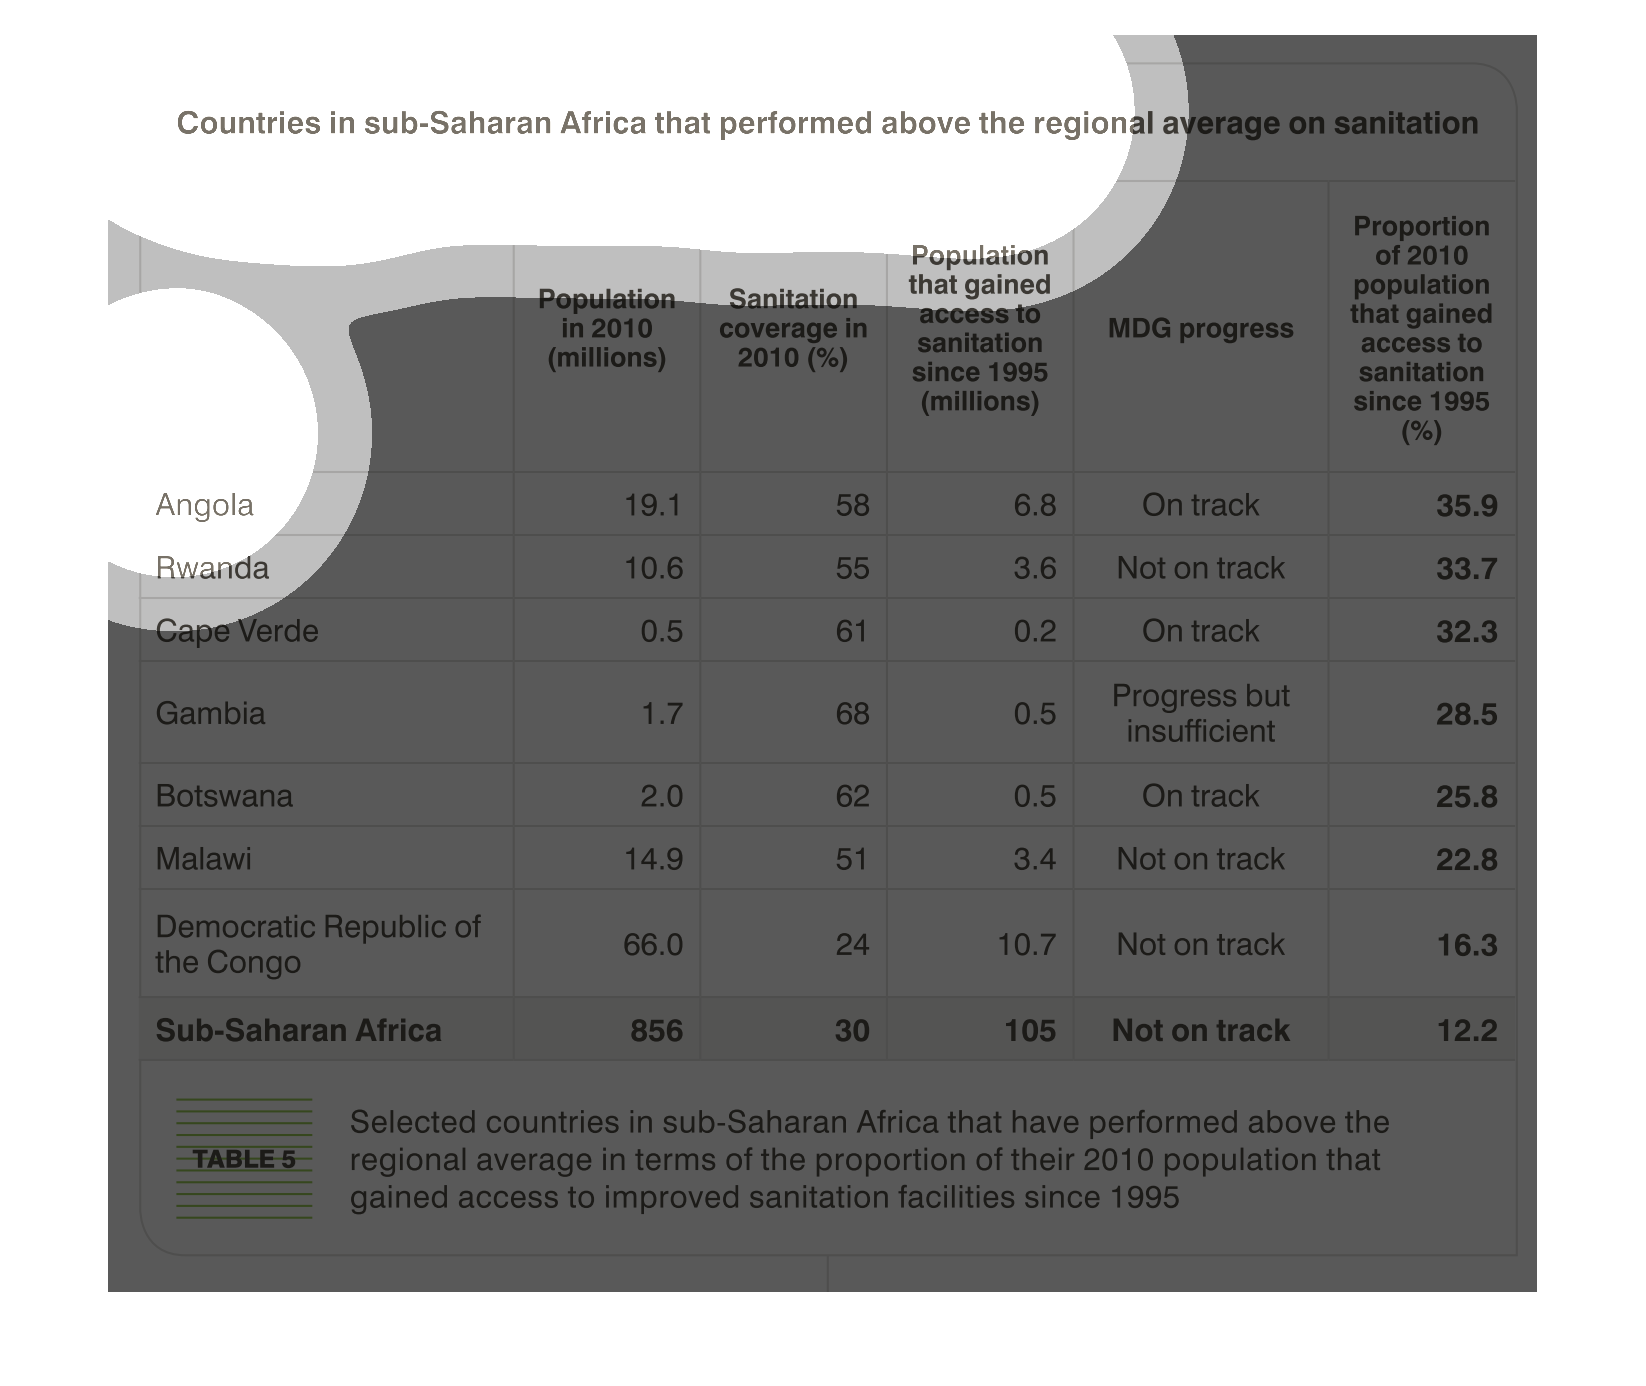
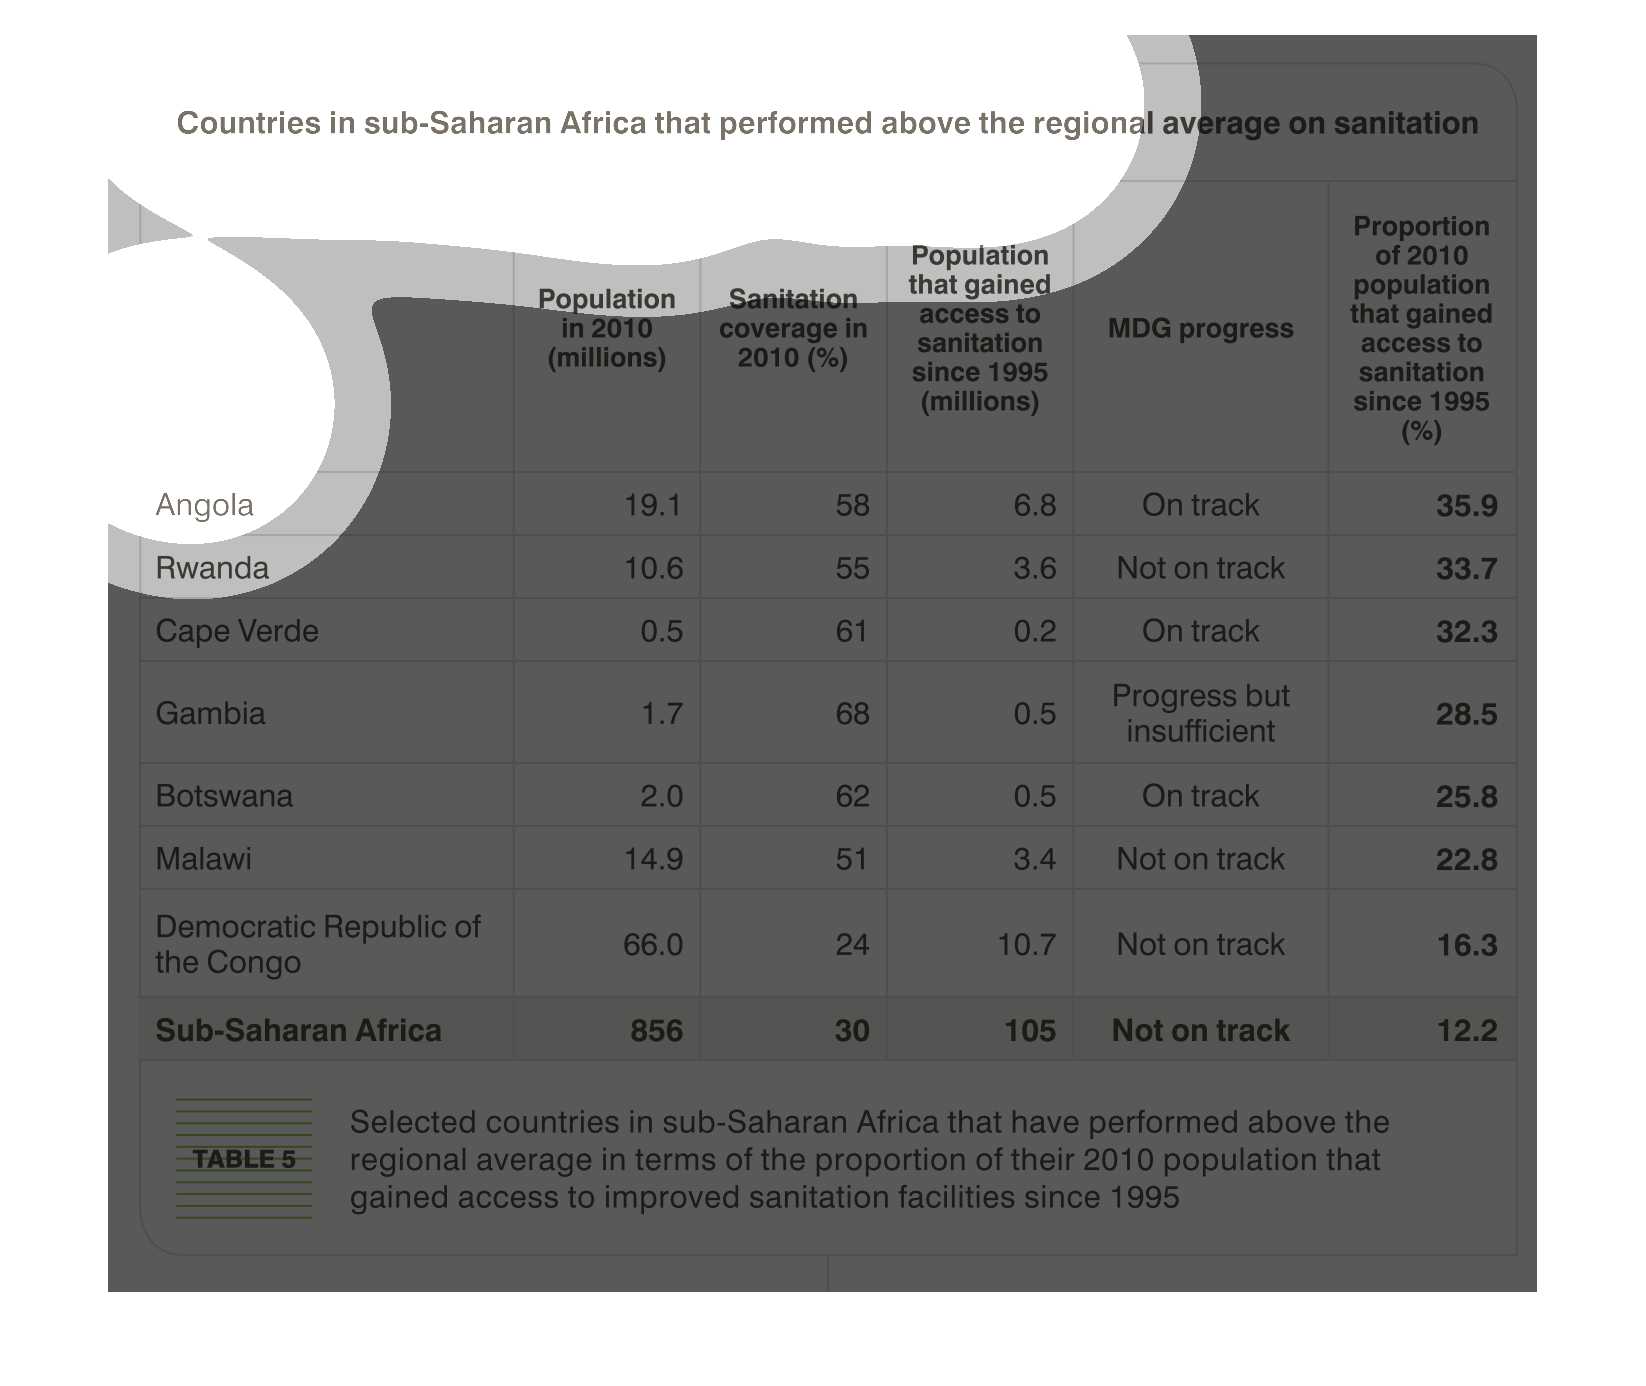
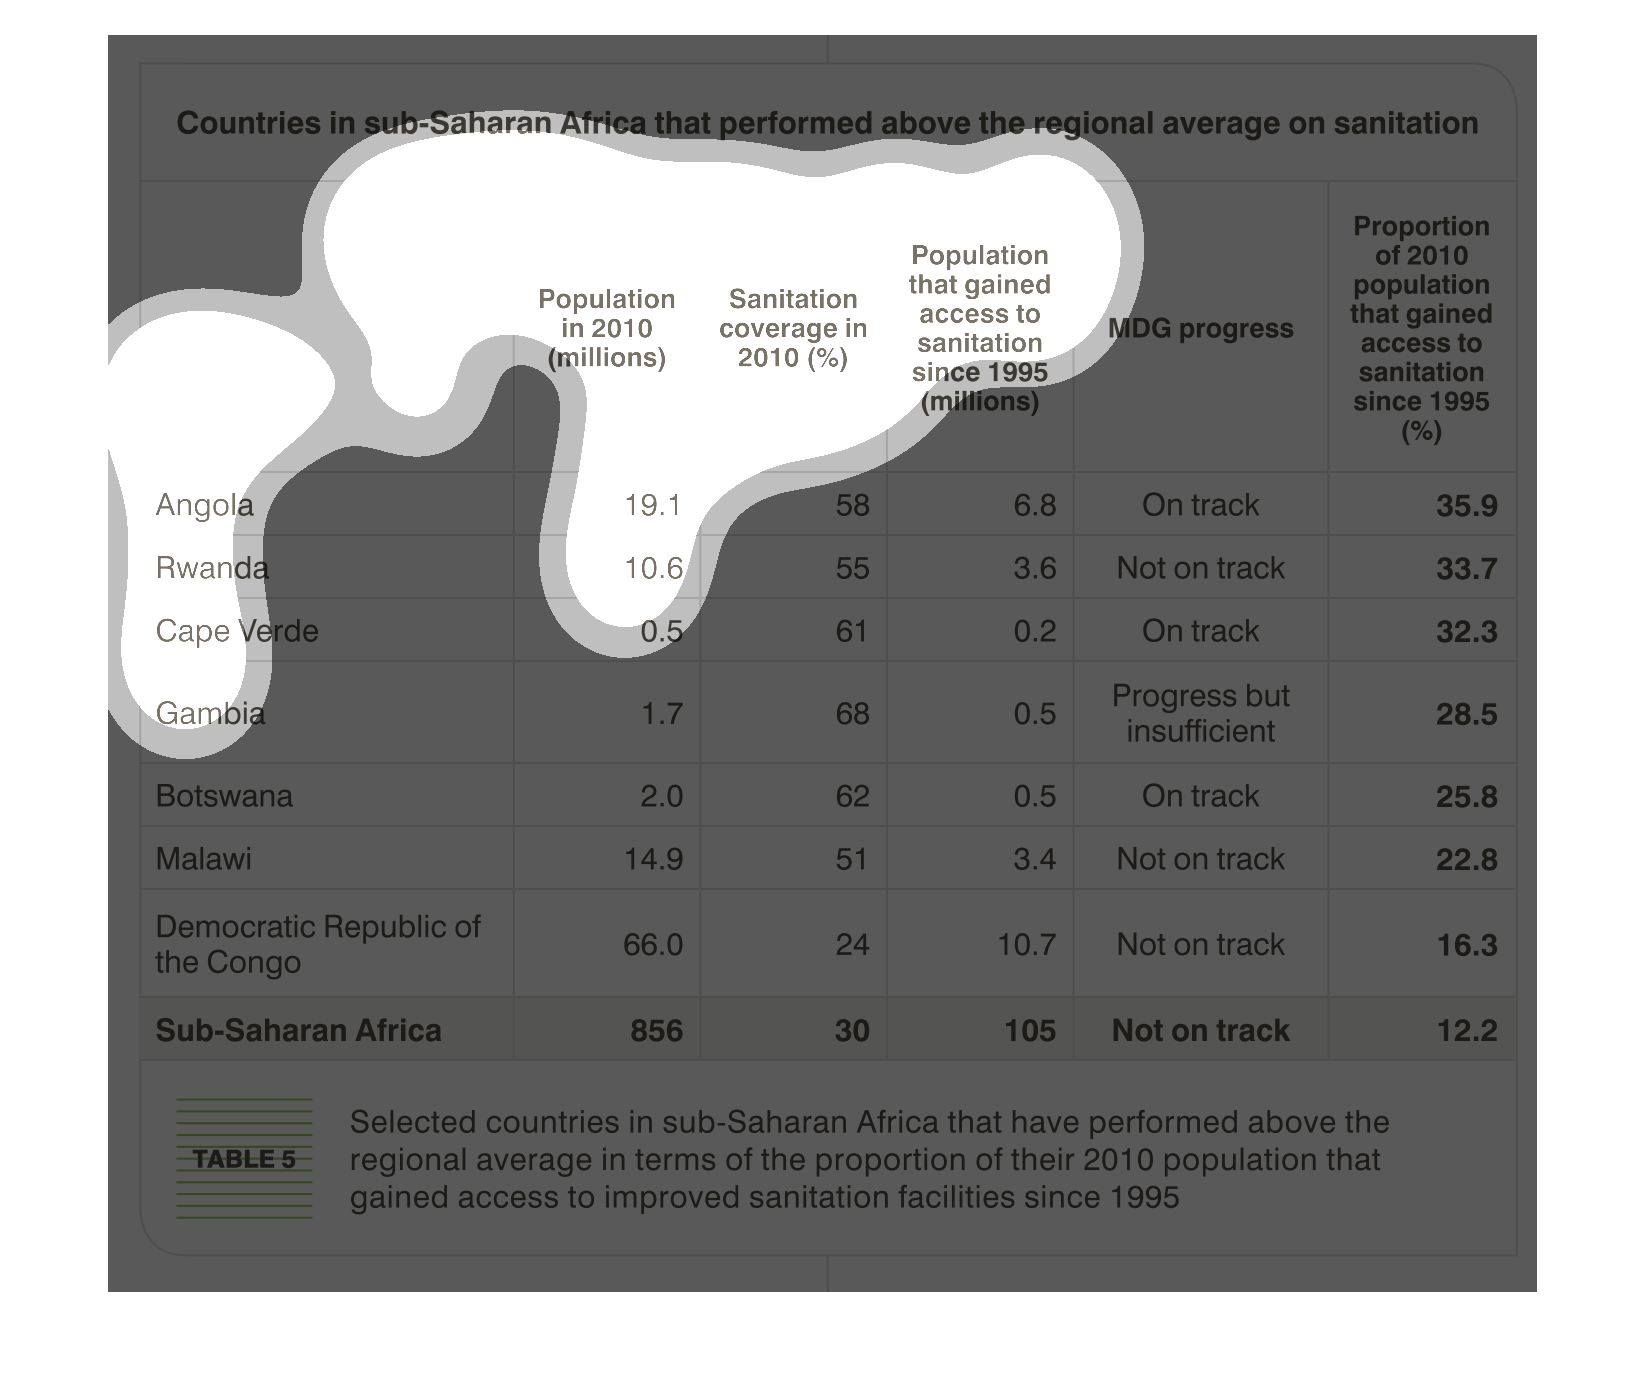
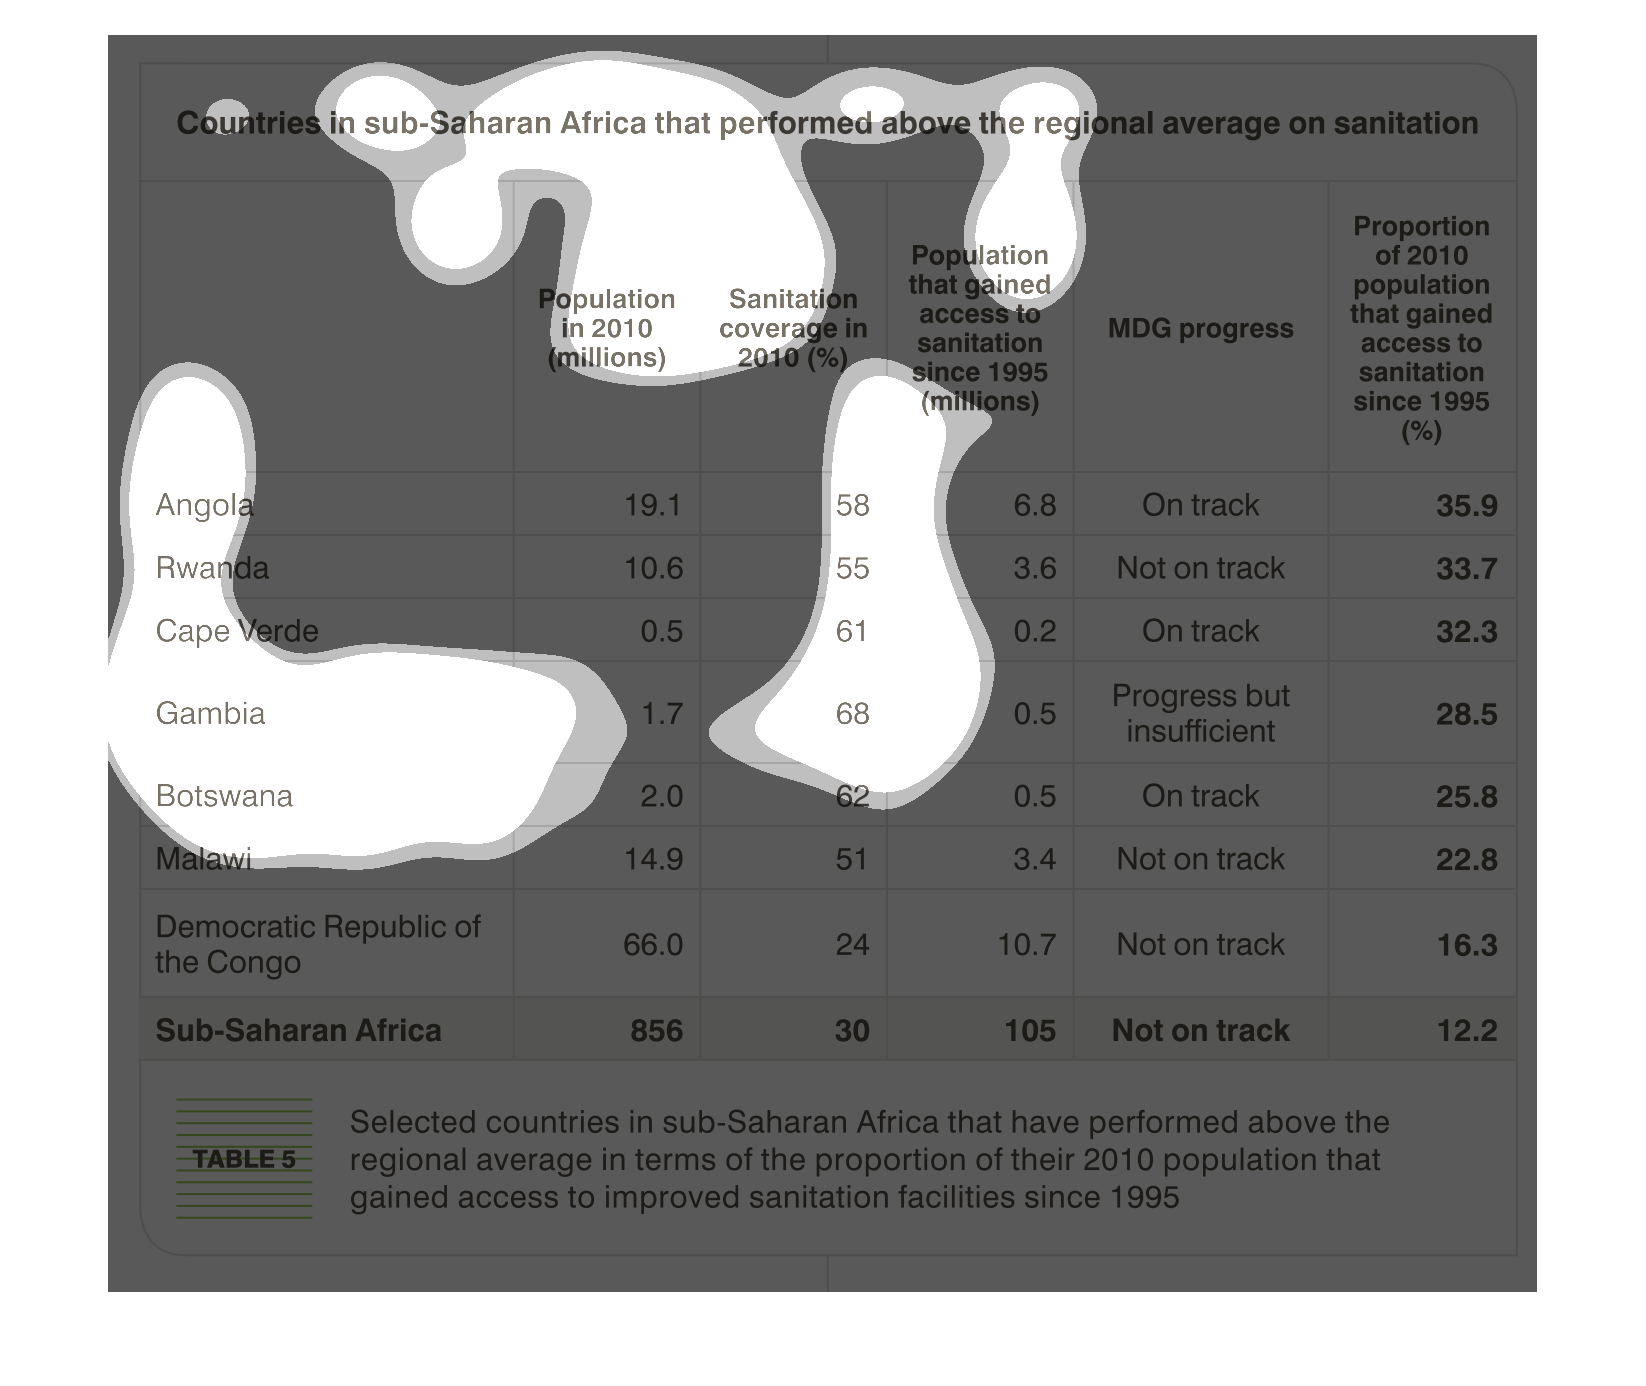
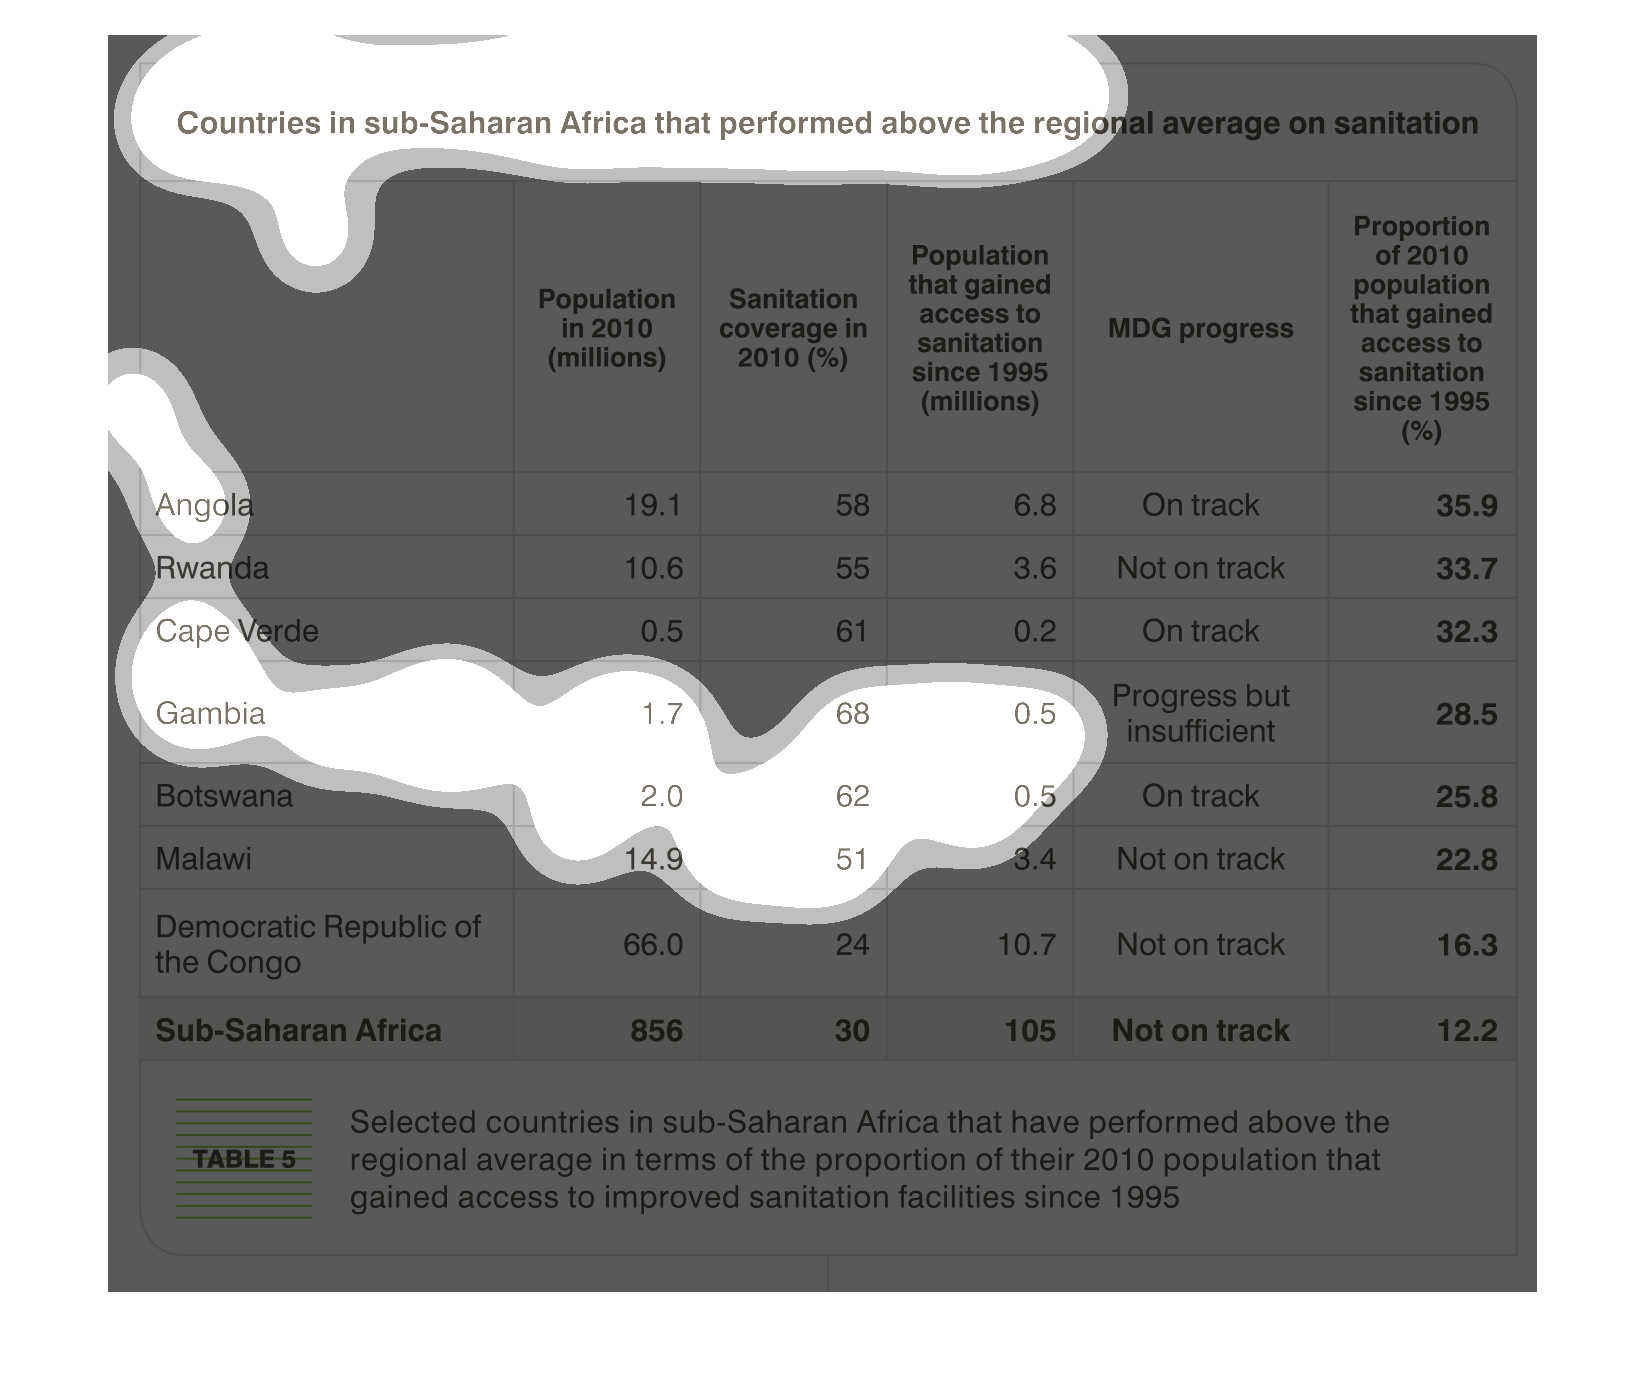
The image depicts countries in Sub-Saharan Africa that performed above the regional average
on sanitation. Sanitation data compares the changes from 1995 to 2010. The data indicates
that countries have expanded access in 2010 versus 1995.
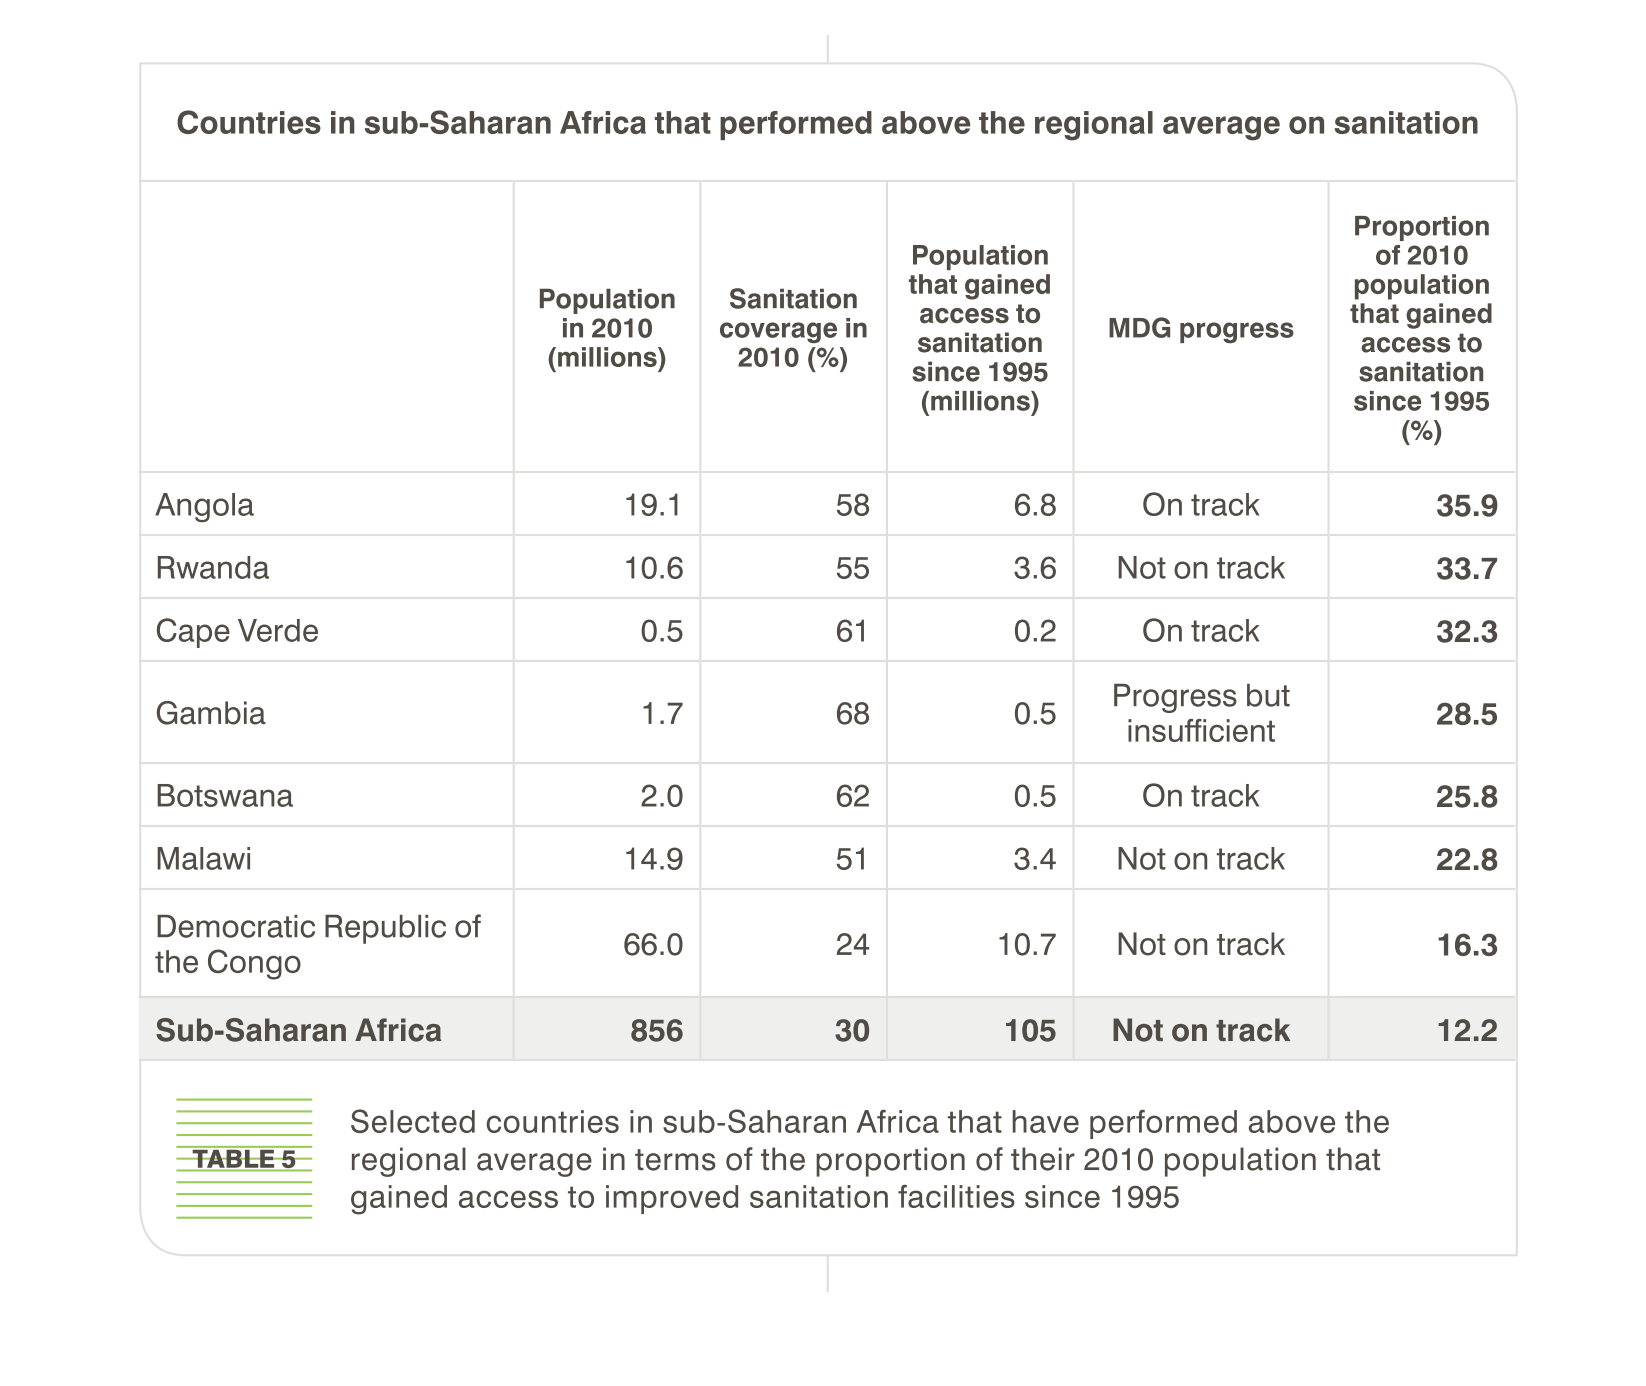
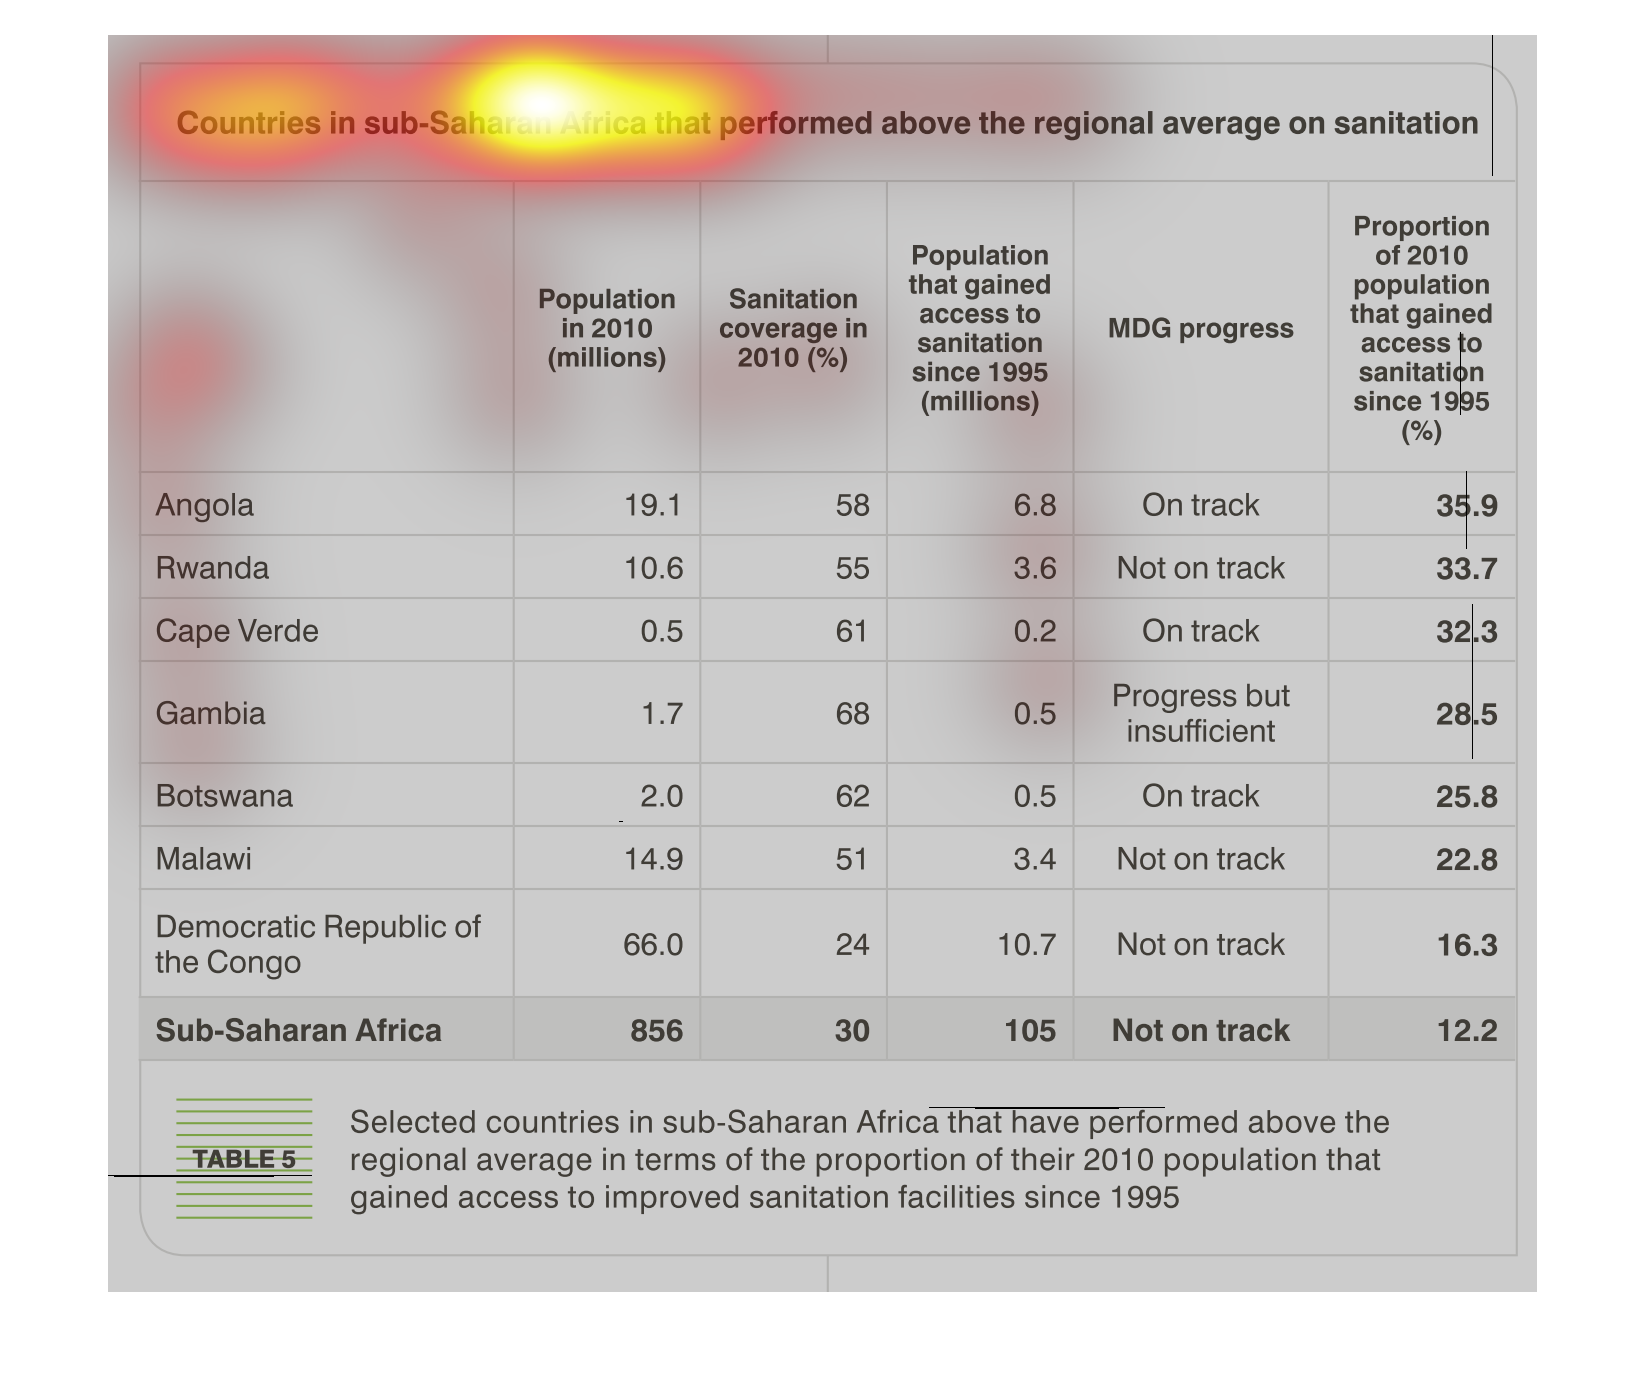
This is a chart of the sub Saharan countries in Africa that performed above the region average
on sanitation . There are only nine countries listed and they are judged on 5 metrics.
This is a chart that illustrates the countries in sub-Saharan Africa that performed beyond
the expected regional average on sanitation since the year 1995.
The figure presented is titled: Countries in sub-Saharan Africa that performed above regional
average on sanitation.  The figure is a representation of sanitation.
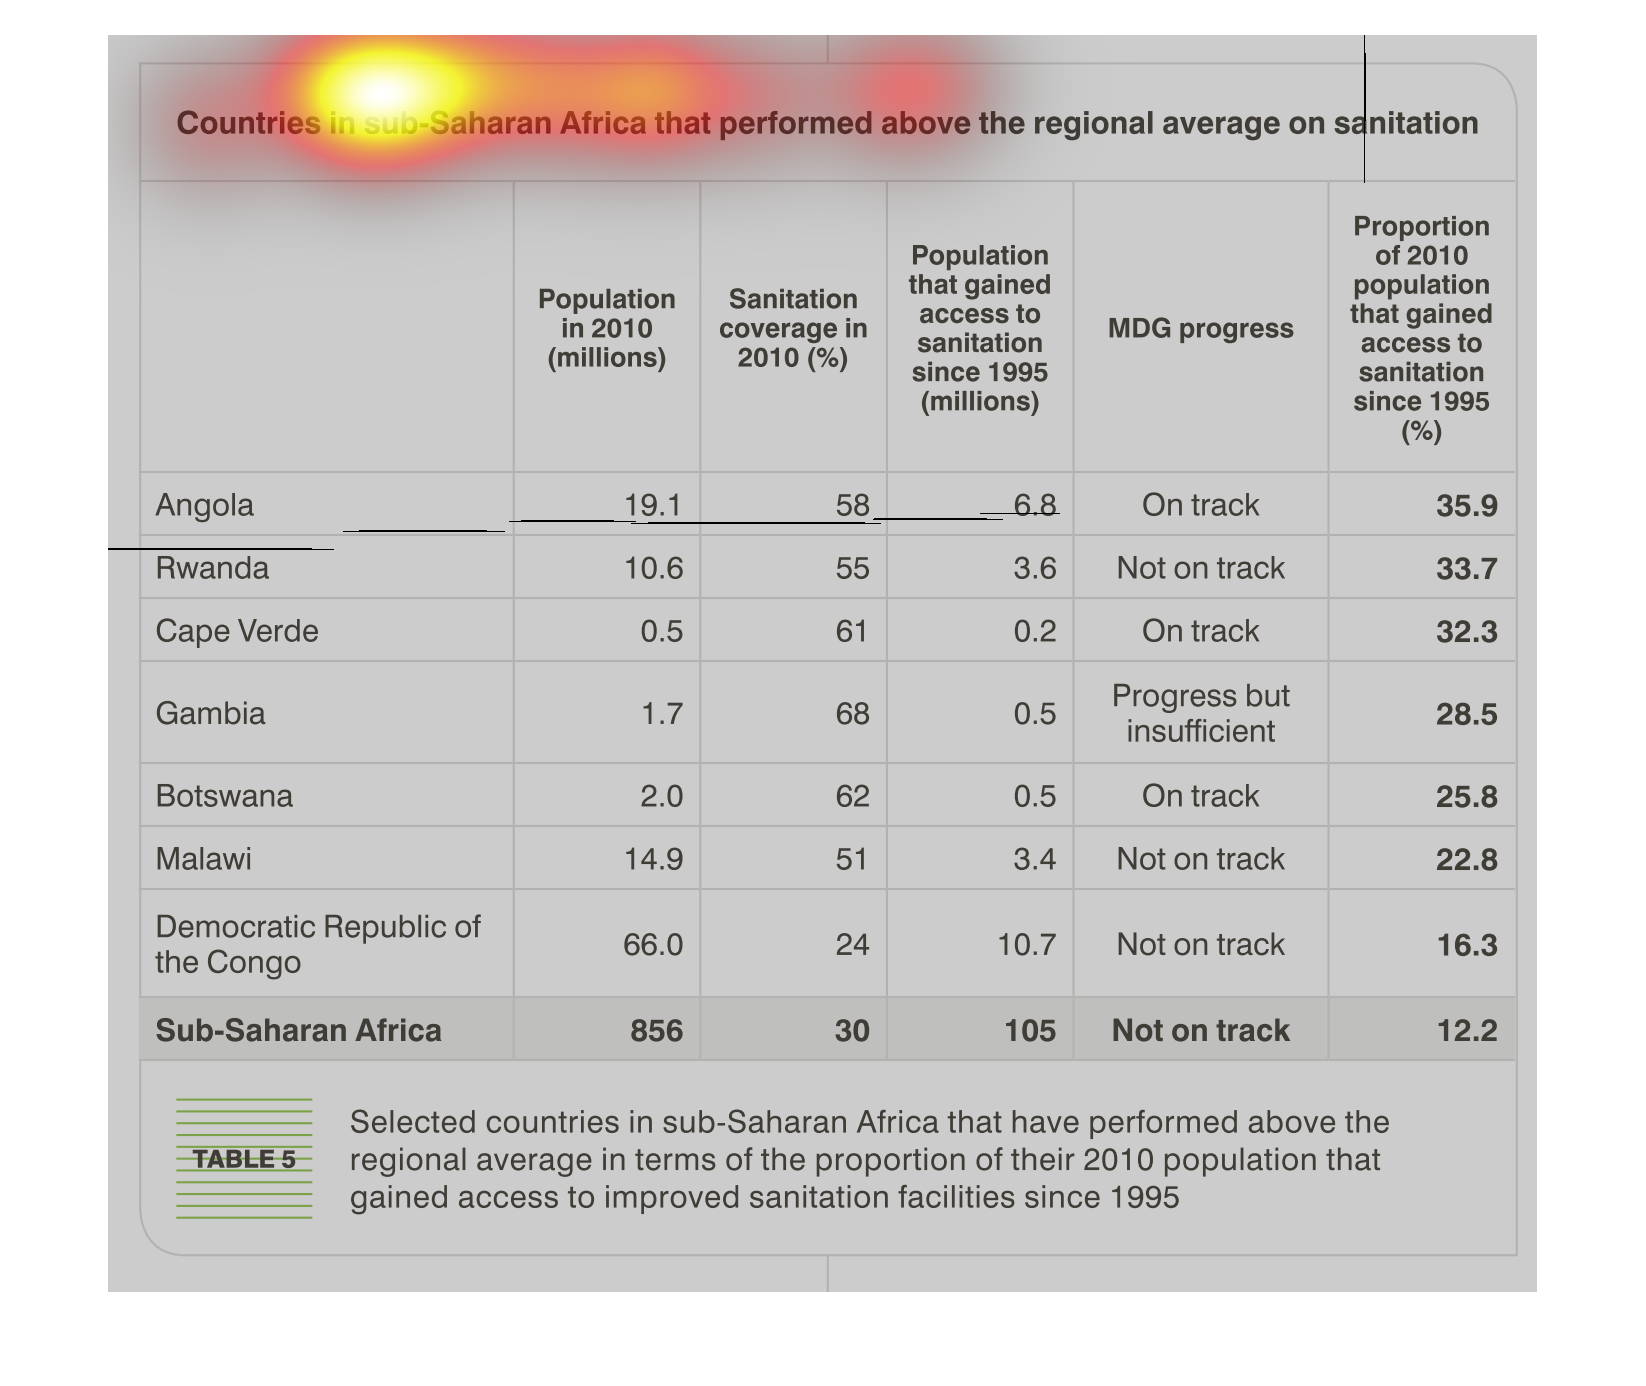
This is a chart of countries in sub-Saharan Africa that preformed above the regional average
for sanitation. The data is for 2010 and there are about 6 countries on the table.
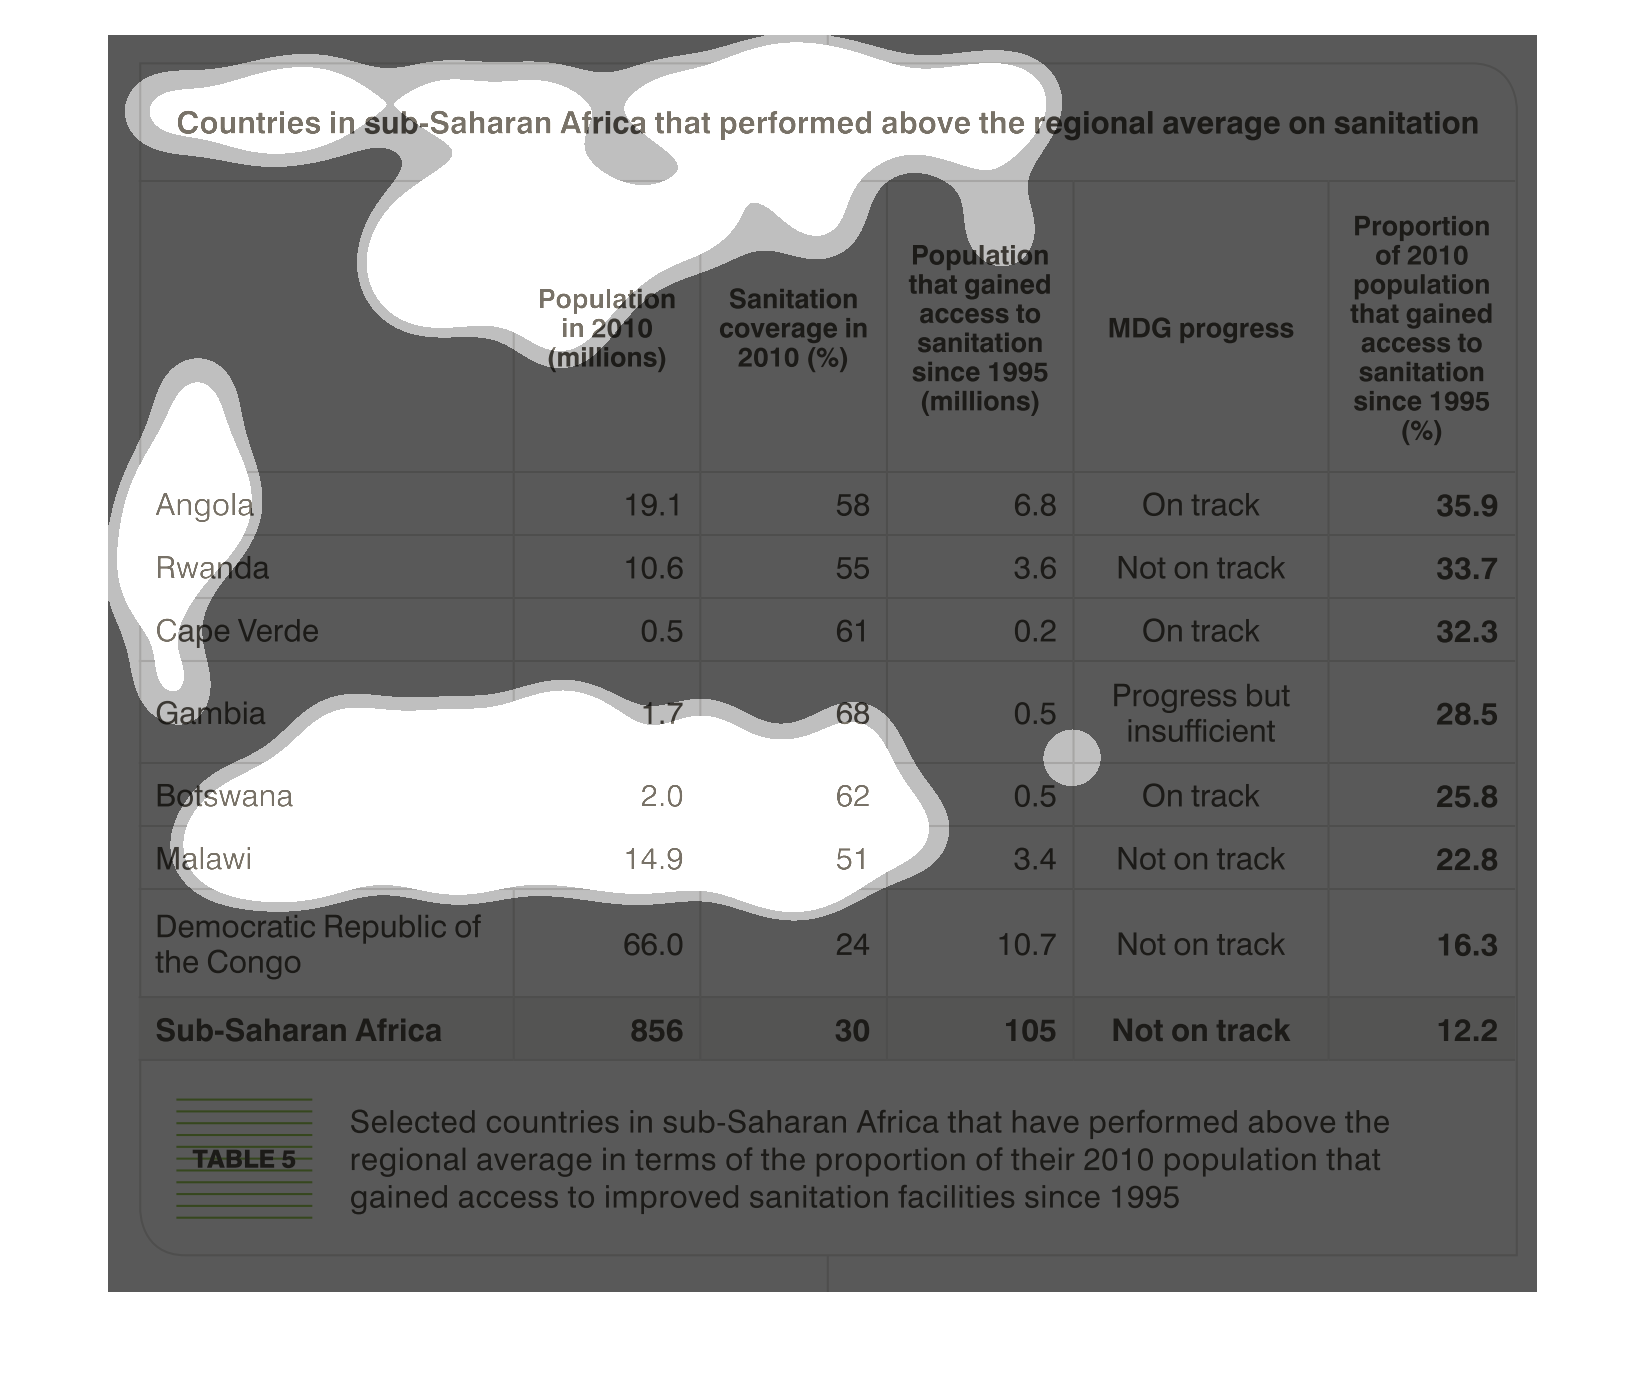
Select countries in sub-Saharan Africa, namely Angola and Rwanda, have a great proportion
of the 2010 population that gained access to improved sanitation facilities since 1995 compared
to the regional average. This increase seems to correlate with the country's MDG progress,
namely whether they are on track or not.
This handmade chart explains the countries in Africa that have access to clean water and other
forms of sanitation and their rankings relative to other countires
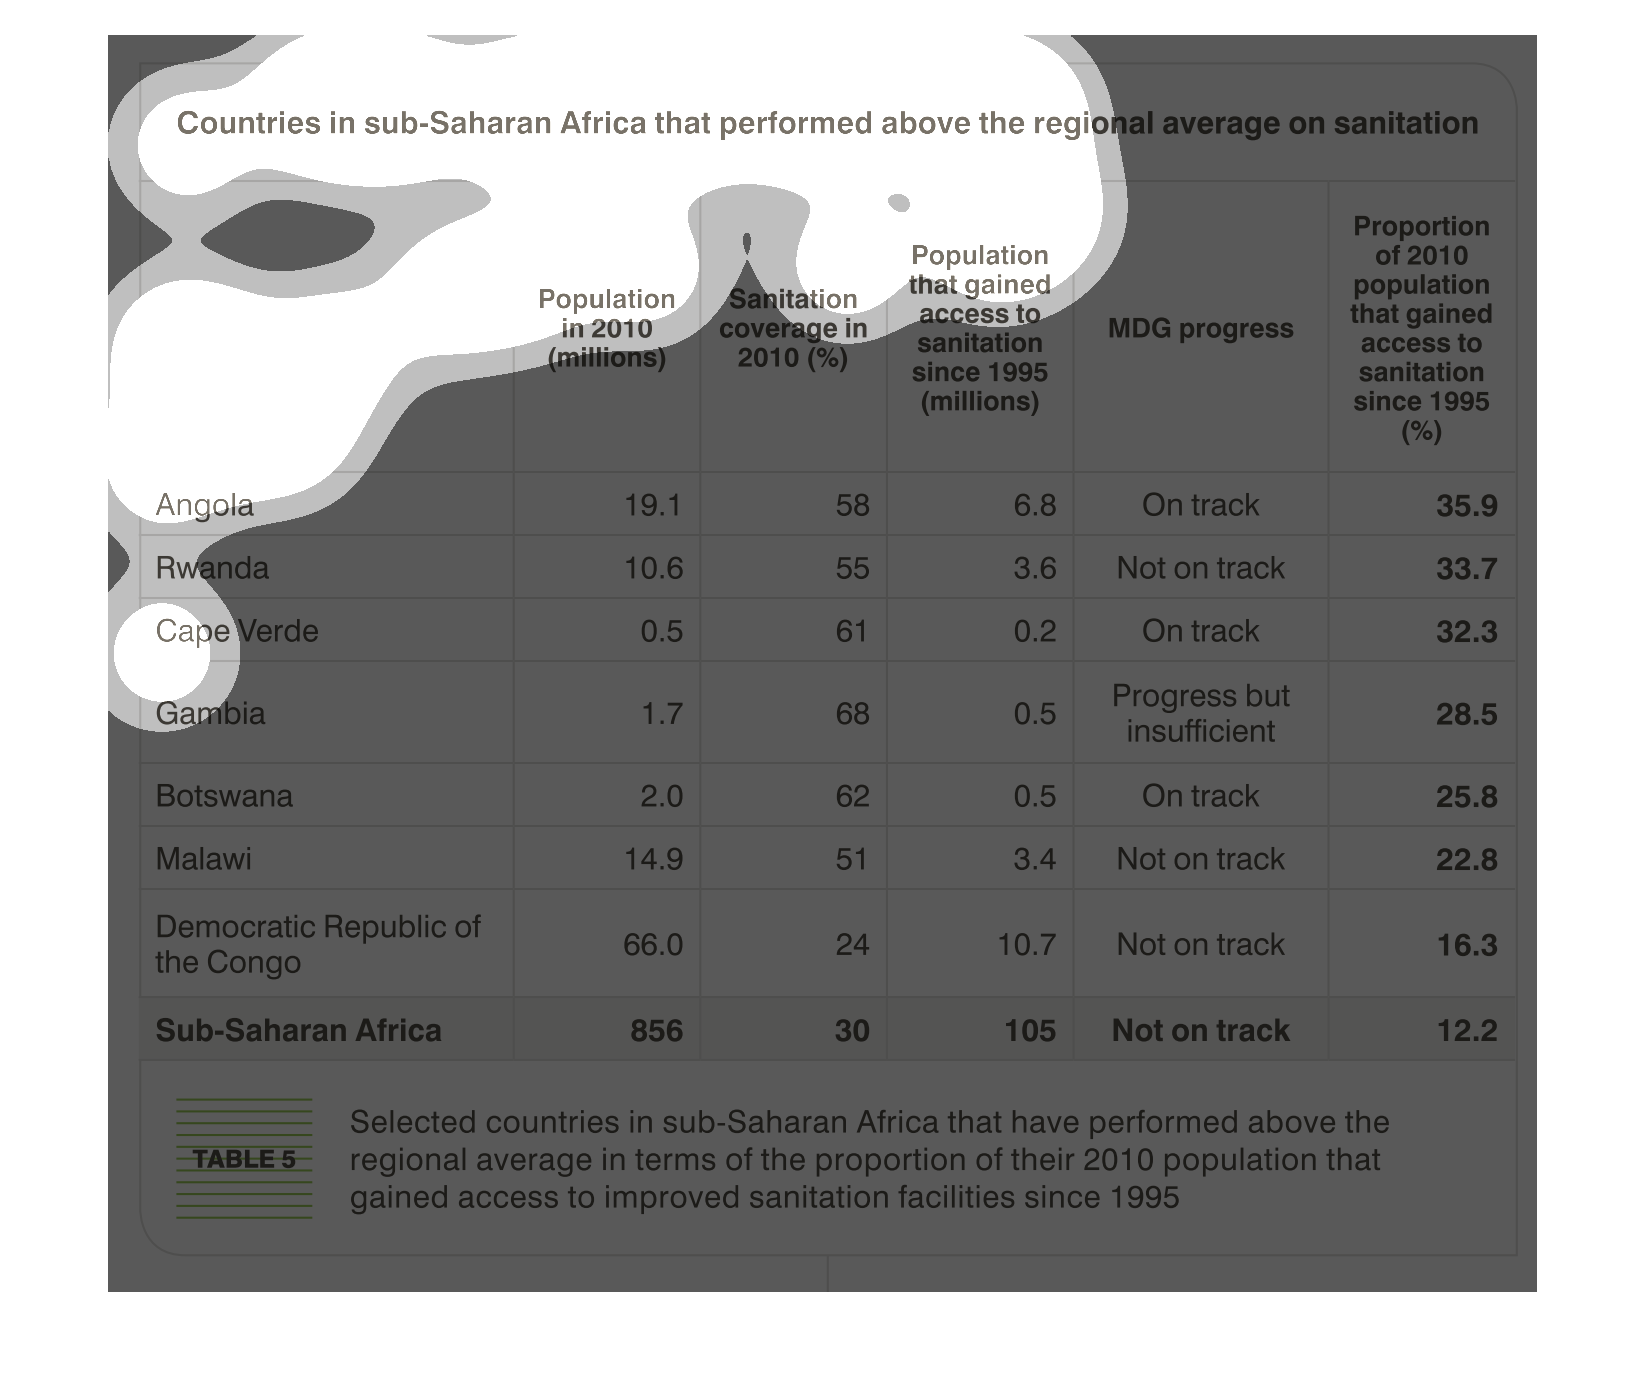
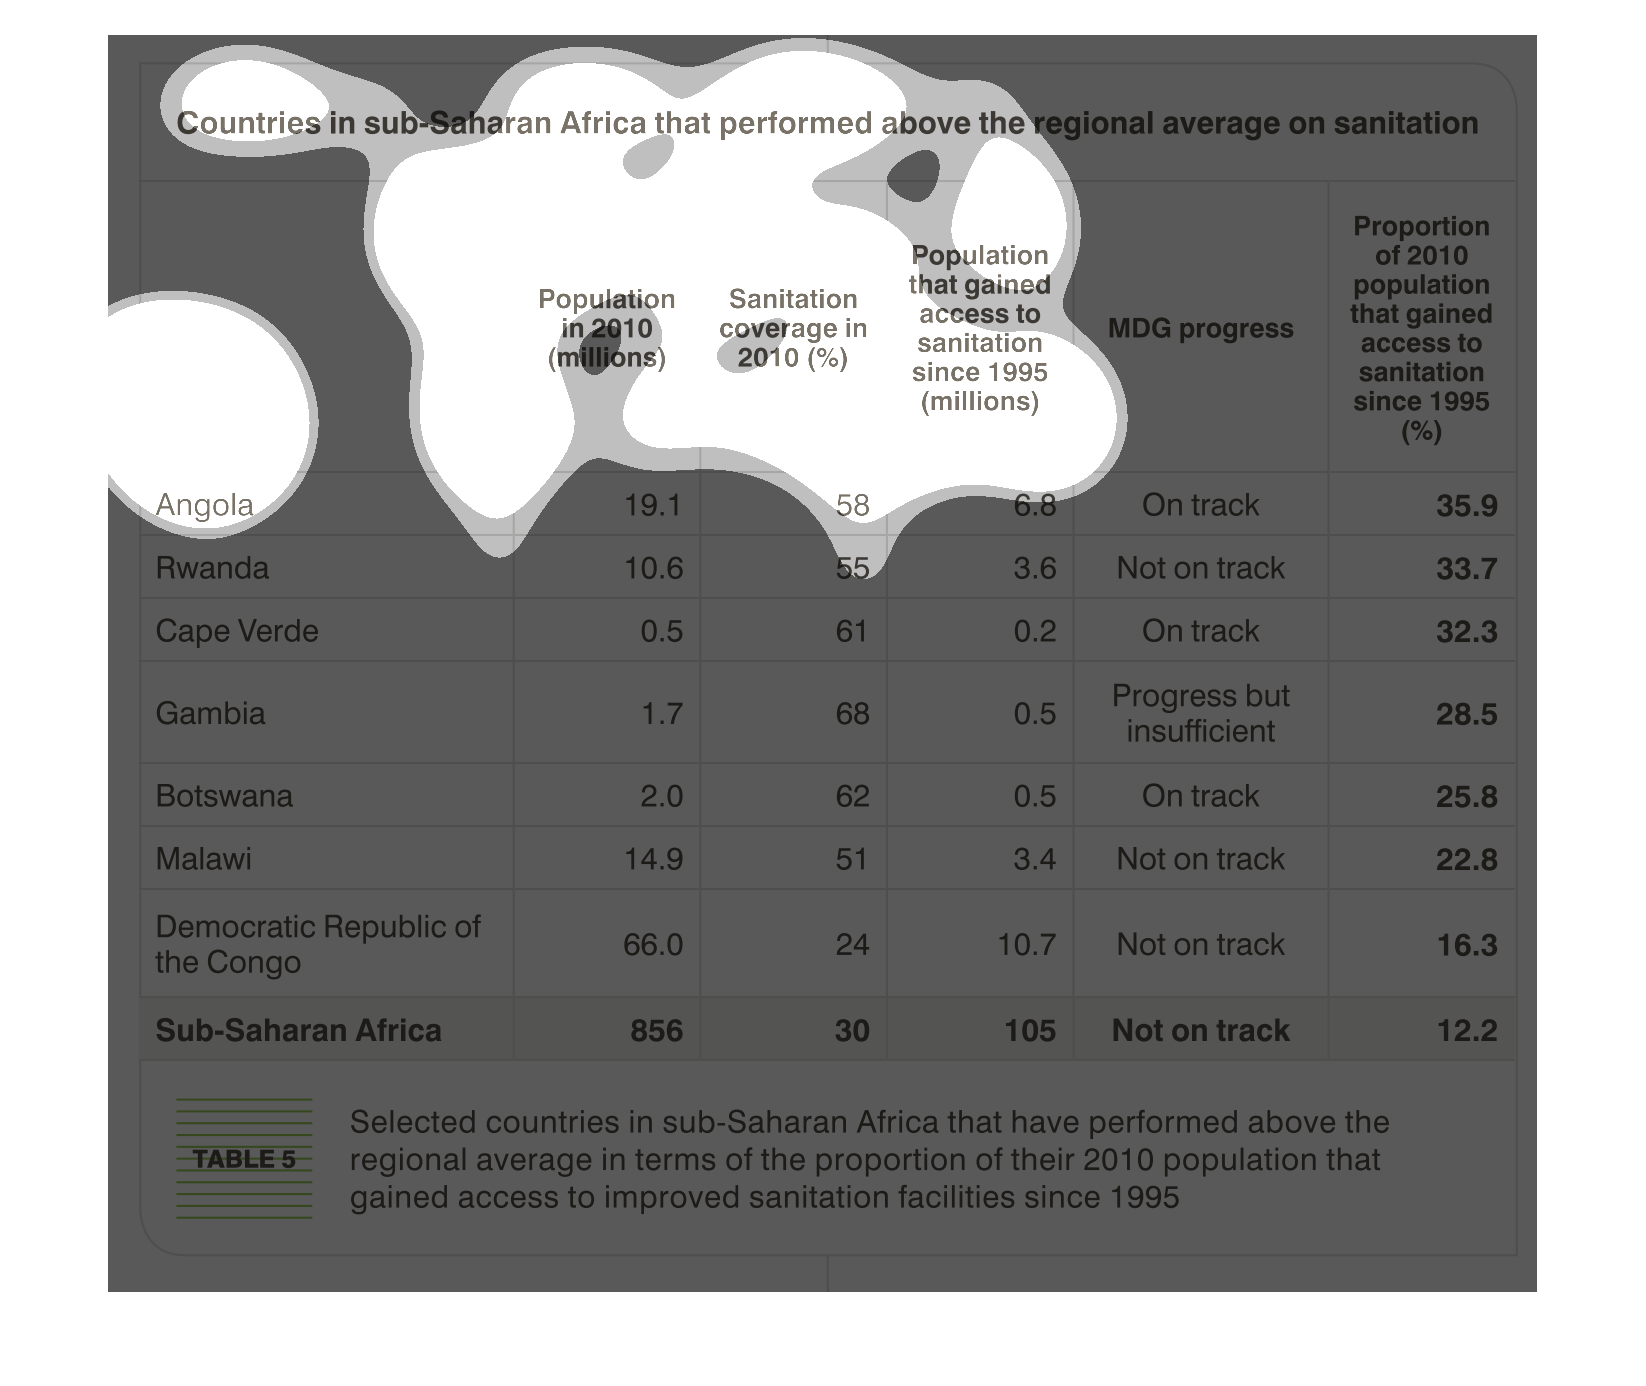
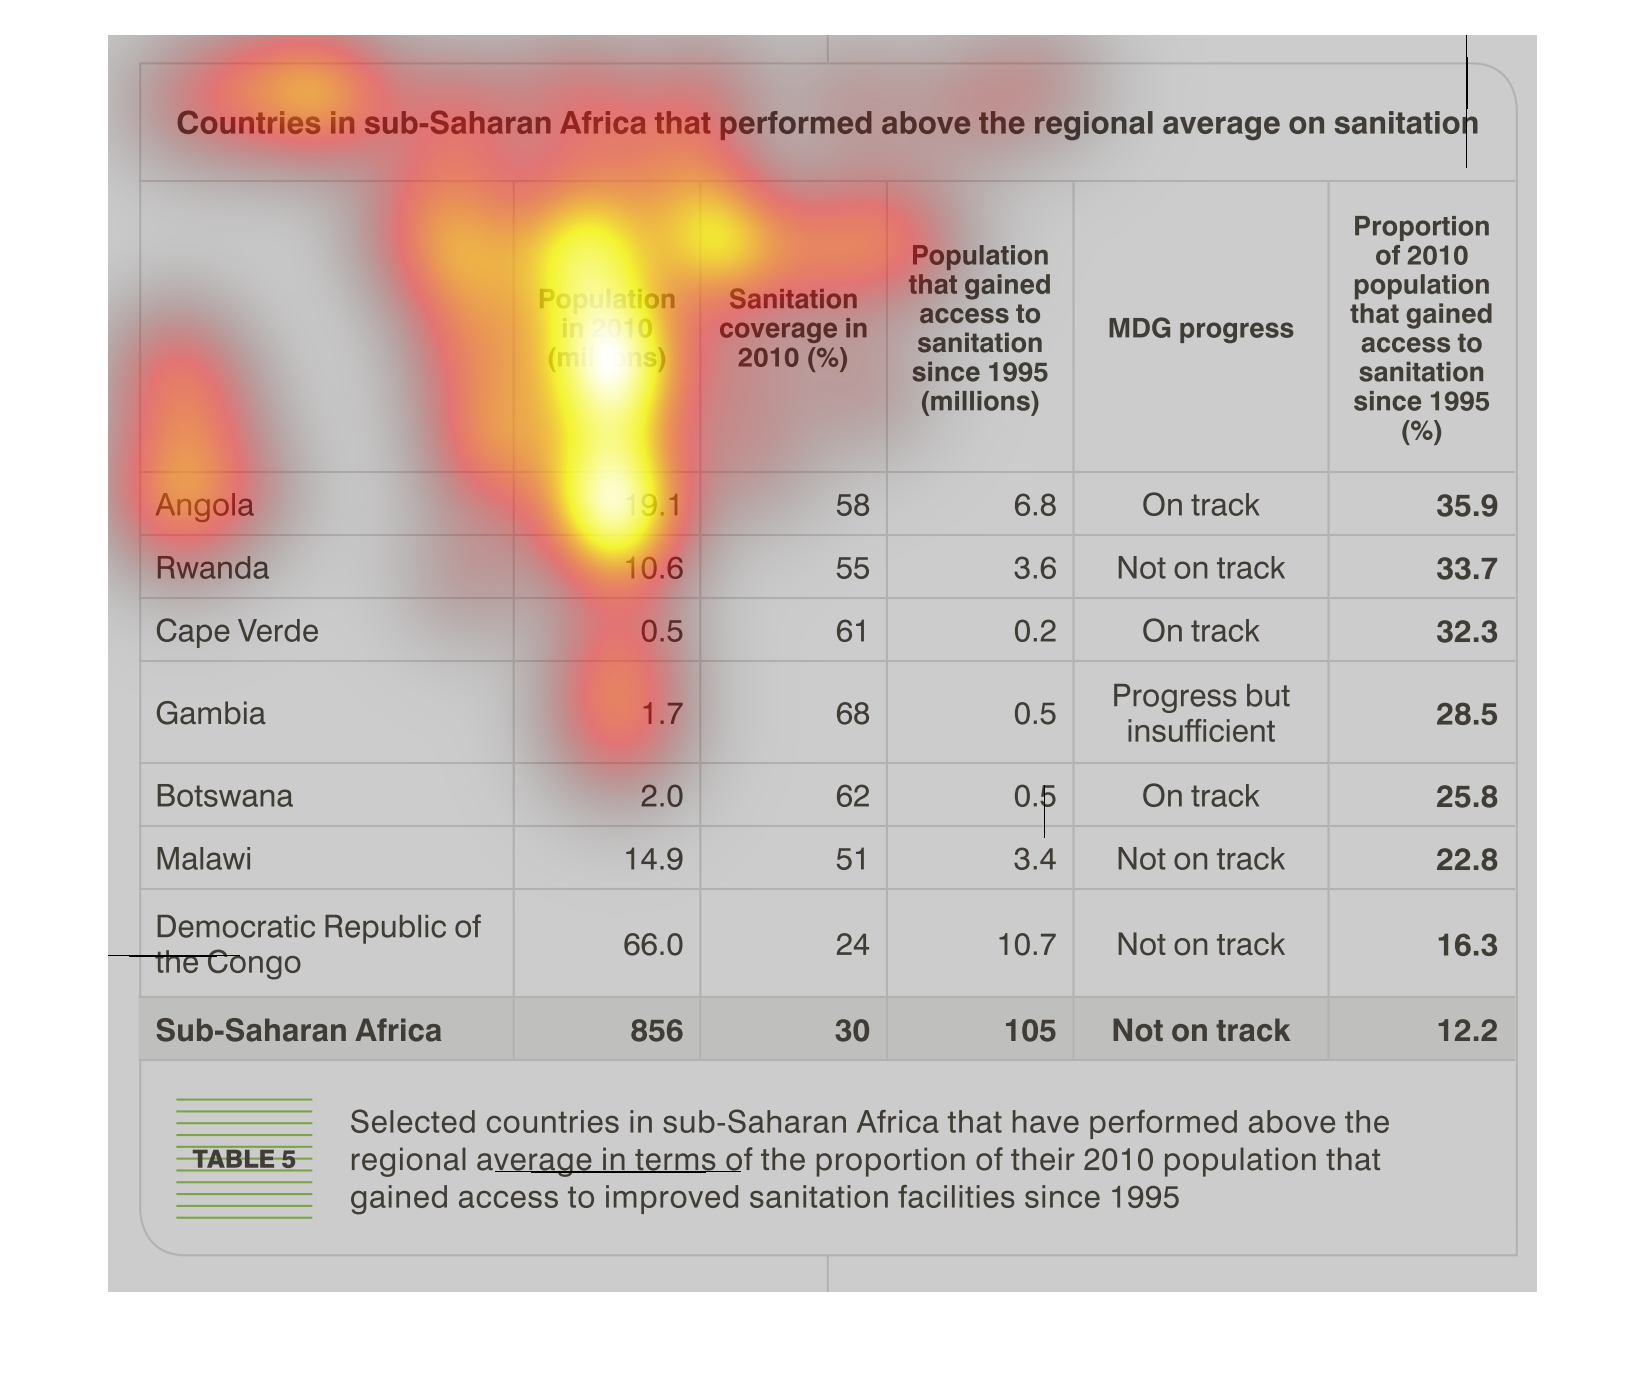
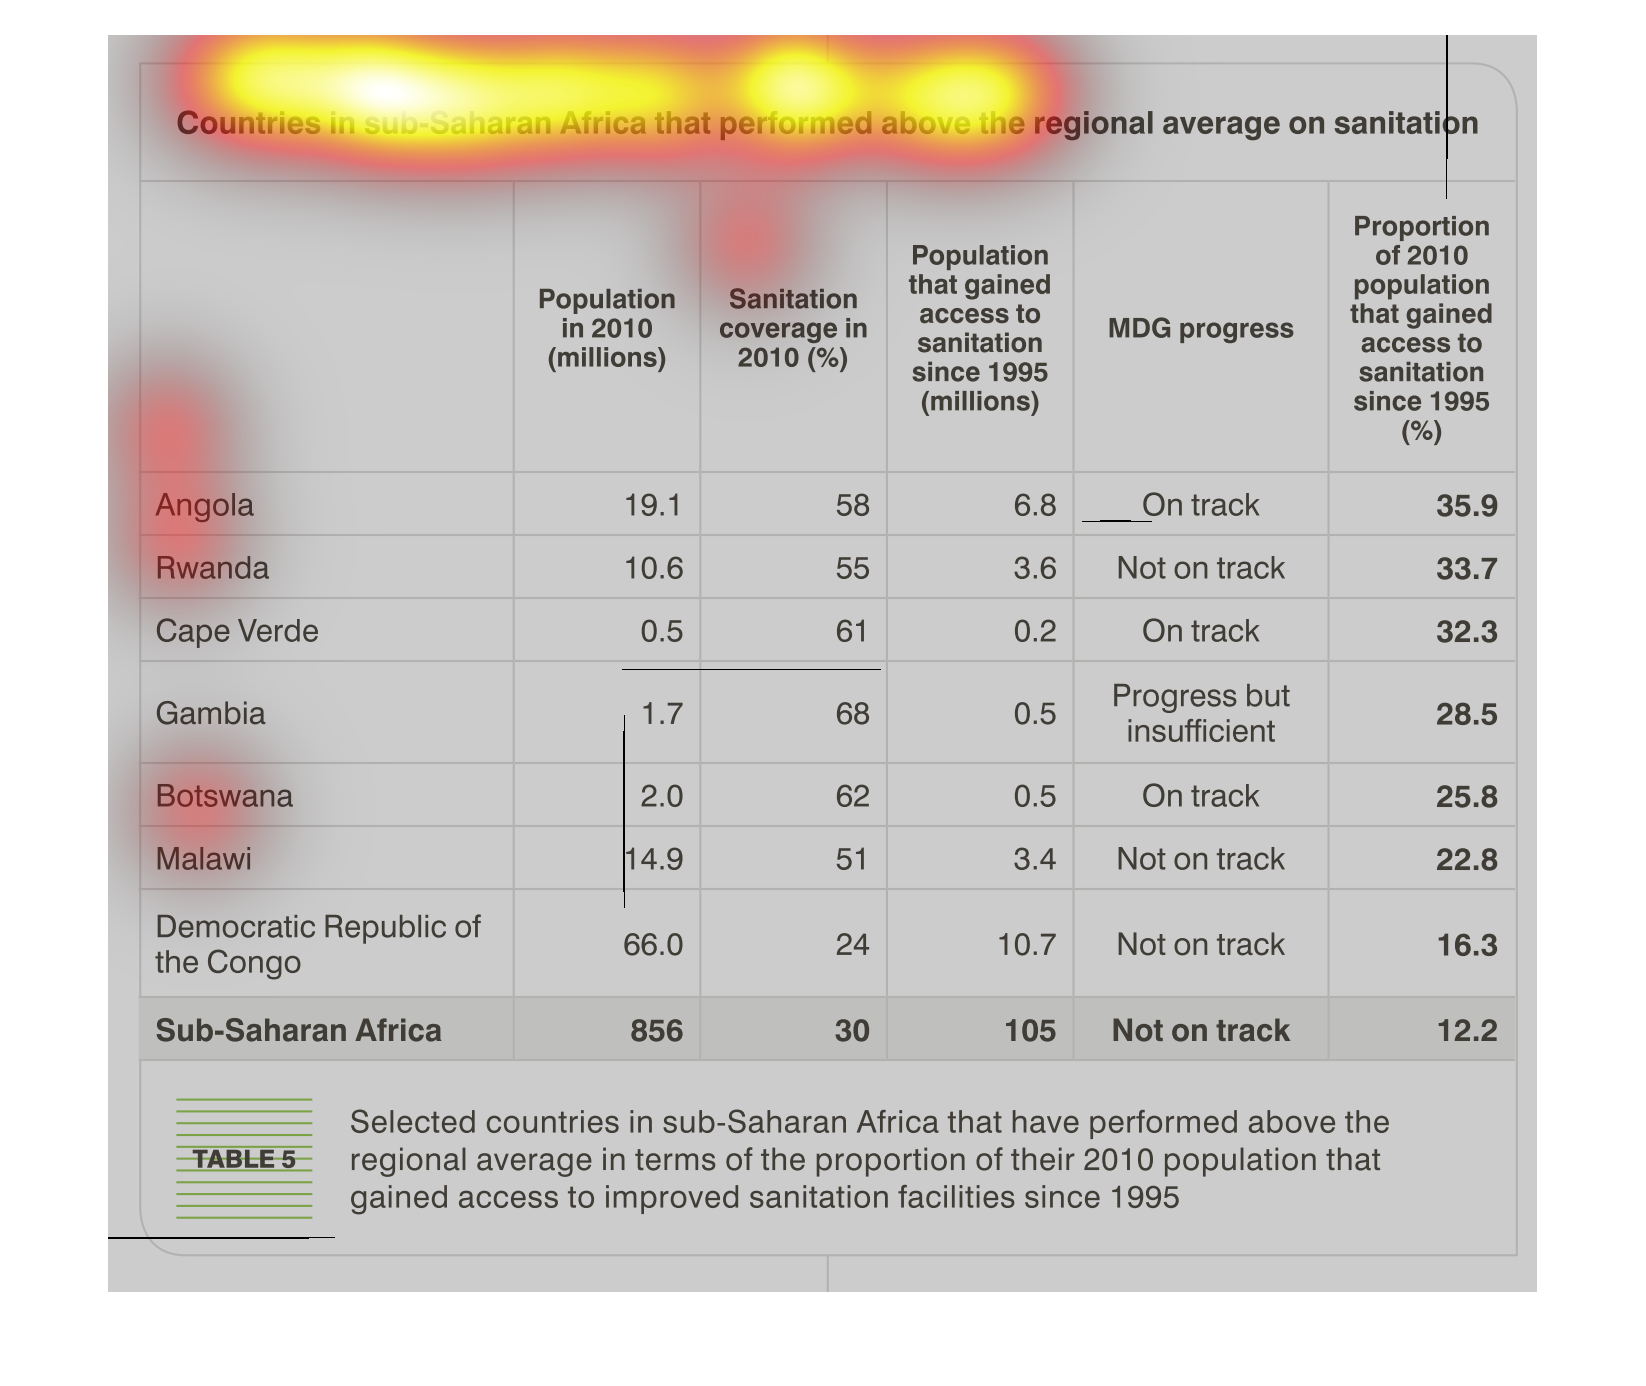
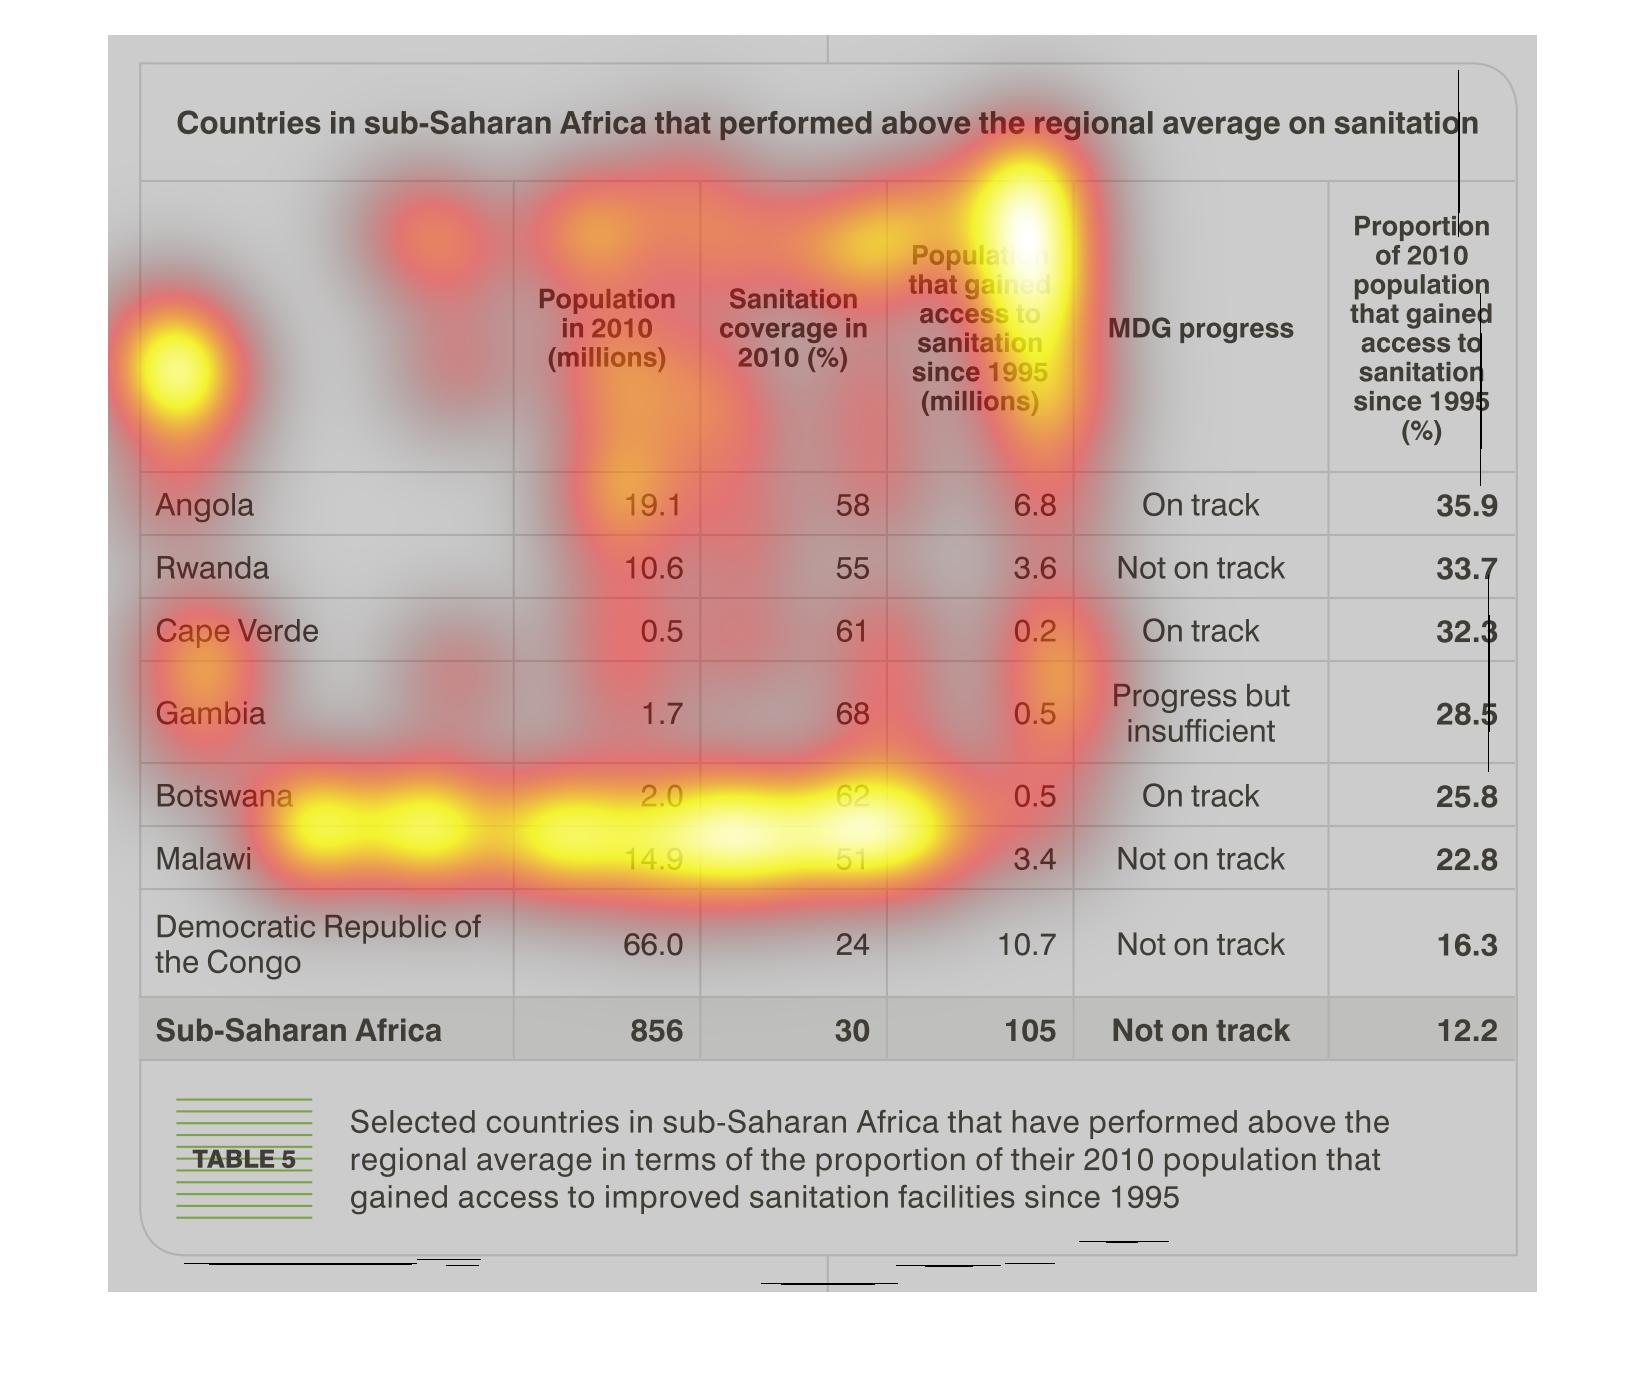
countries in sub saharan Africa that performed above the regional average on sanitation. Y
axis shows select african countries, X axis shows columns; population in 2010 by millions,
sanitation coverage 2010%, population that gained water access since 1995, MDG progress, population
that gained sanitation access since 1995 in percentage. Angola, followed by Rwanda are doing
the best according to the chart