This is a chart that shows the key determinants of health well being for all people in the
world. It shows the various important components of the overall global ecosystem.
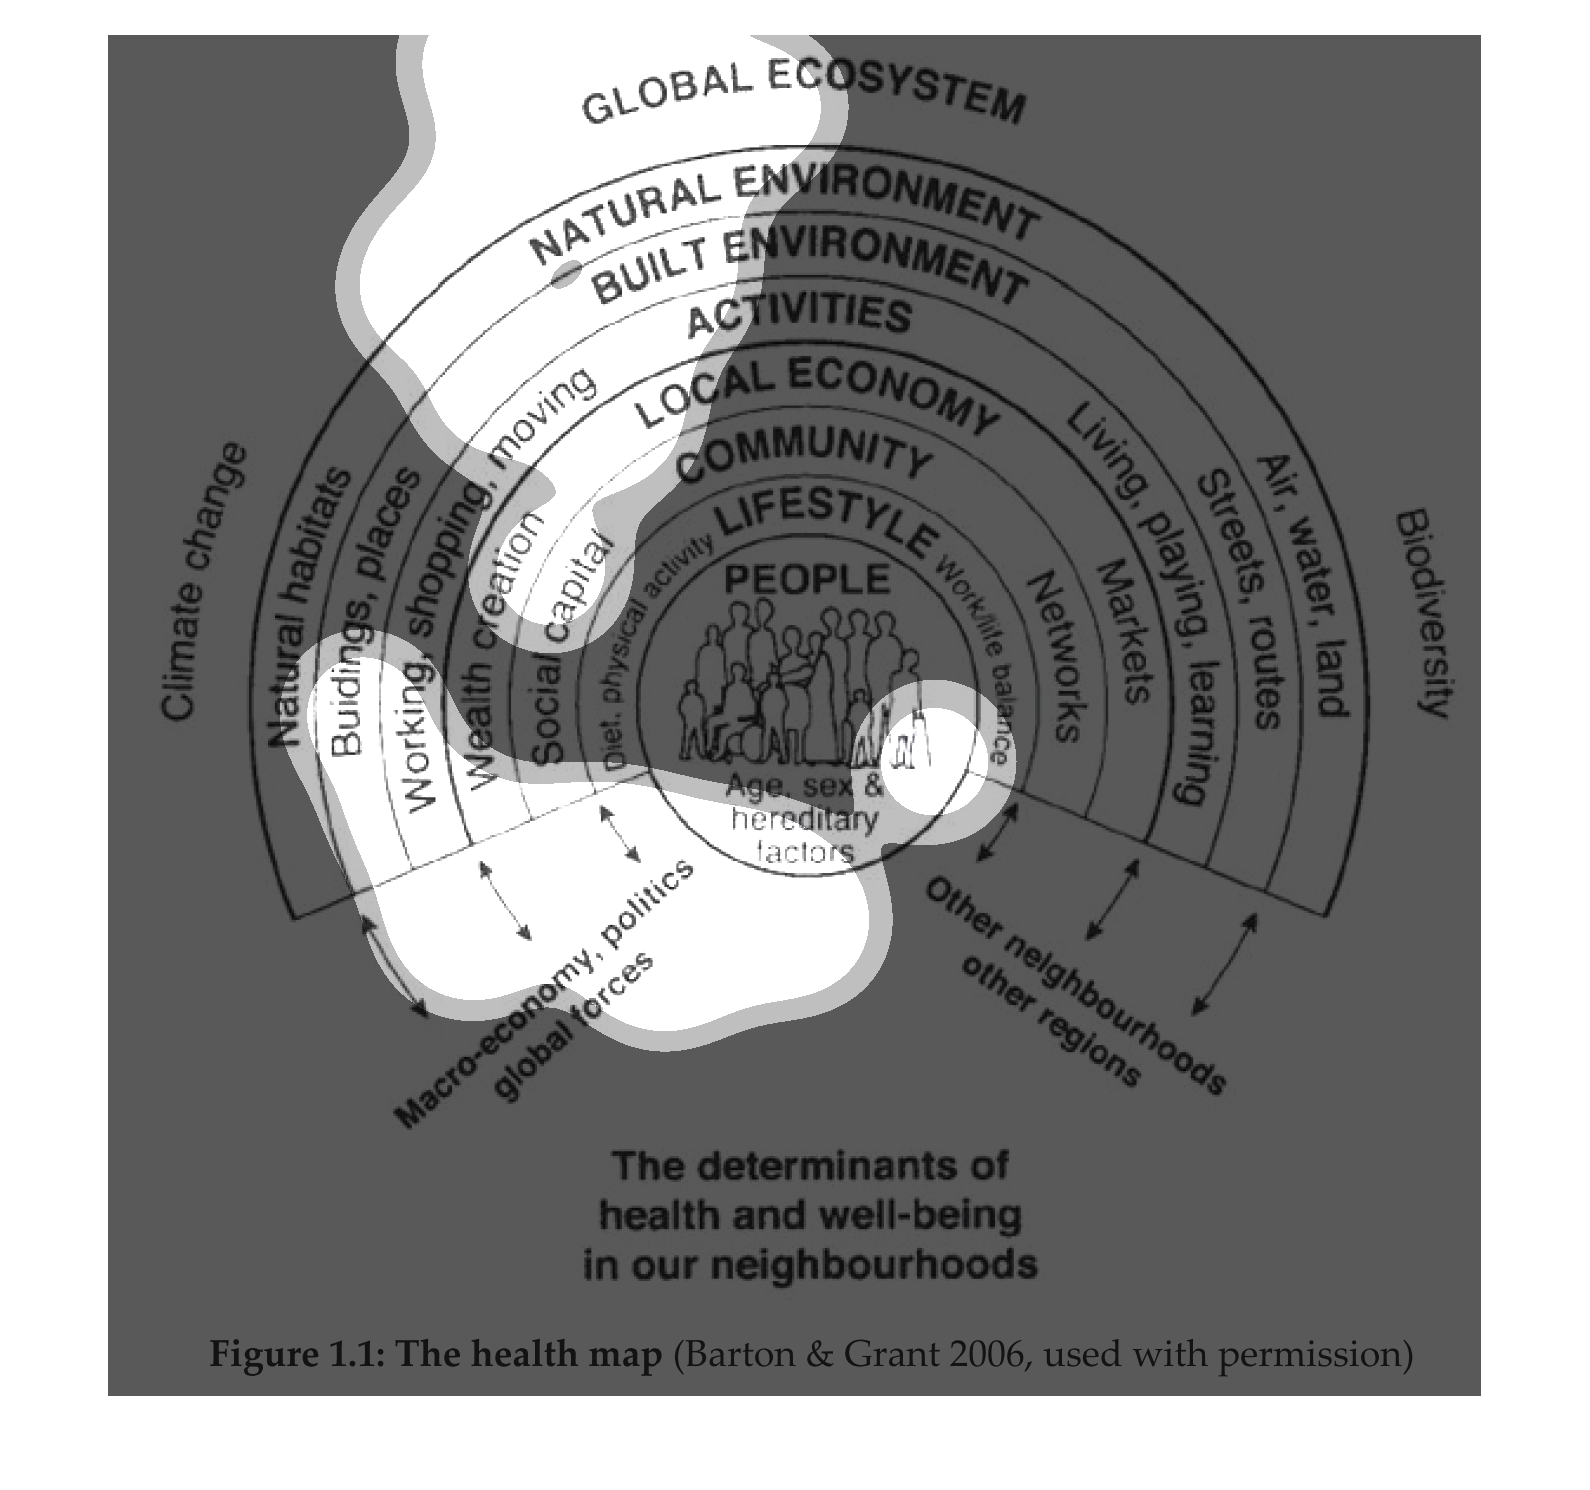
This is a depiction of  various aspects of health and well -being  in neighborhoods. It describes
factors affecting people from a Global Ecosystem standpoint.
This chart describes the determinants of health  and well-being in our neighborhoods. Categories
on the chart include global ecosystem and natural environment.
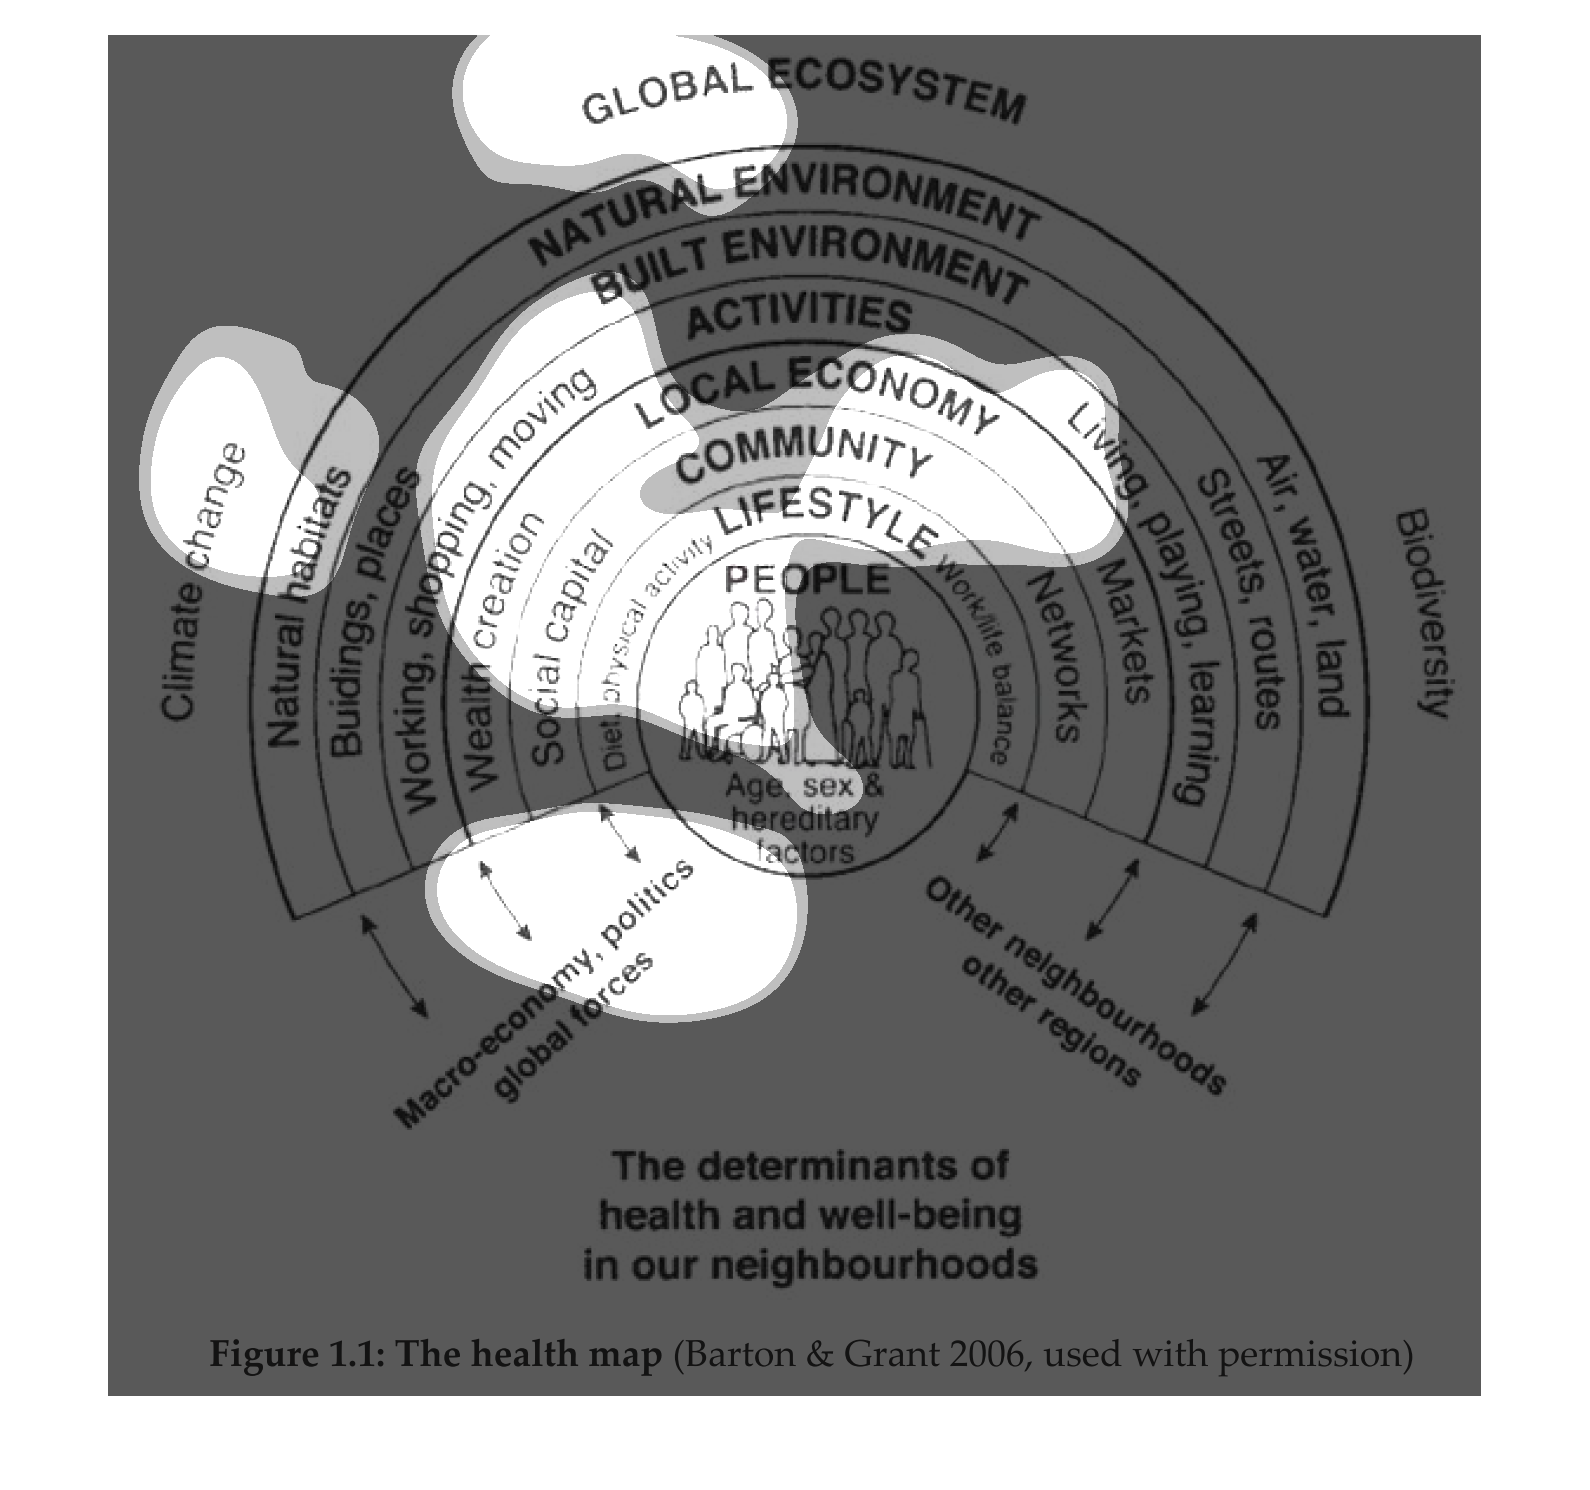
This chart describes the determinants of health and well-being in our neighborhoods, for the
year 2006. Different categories on the chart include global ecosystem.
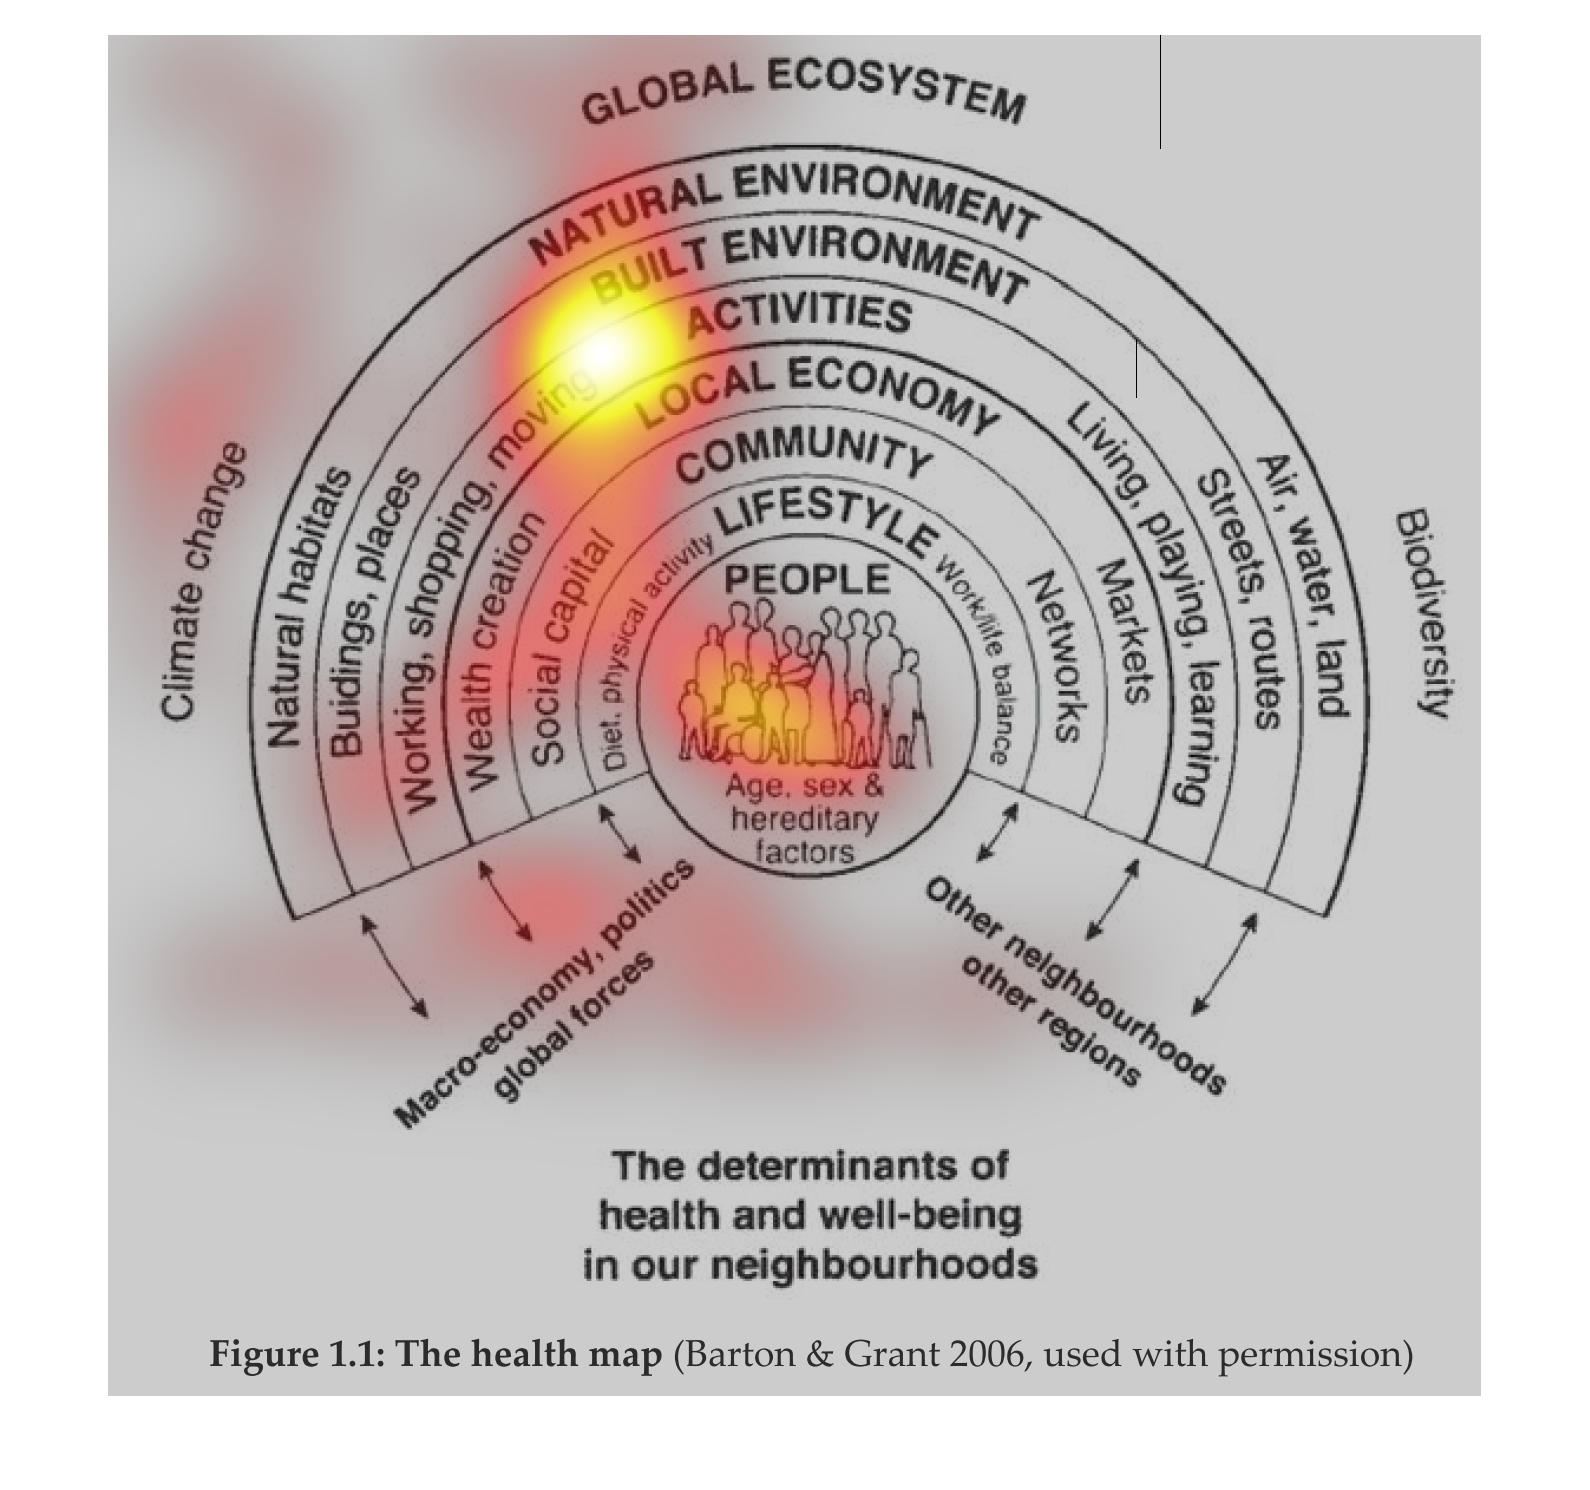
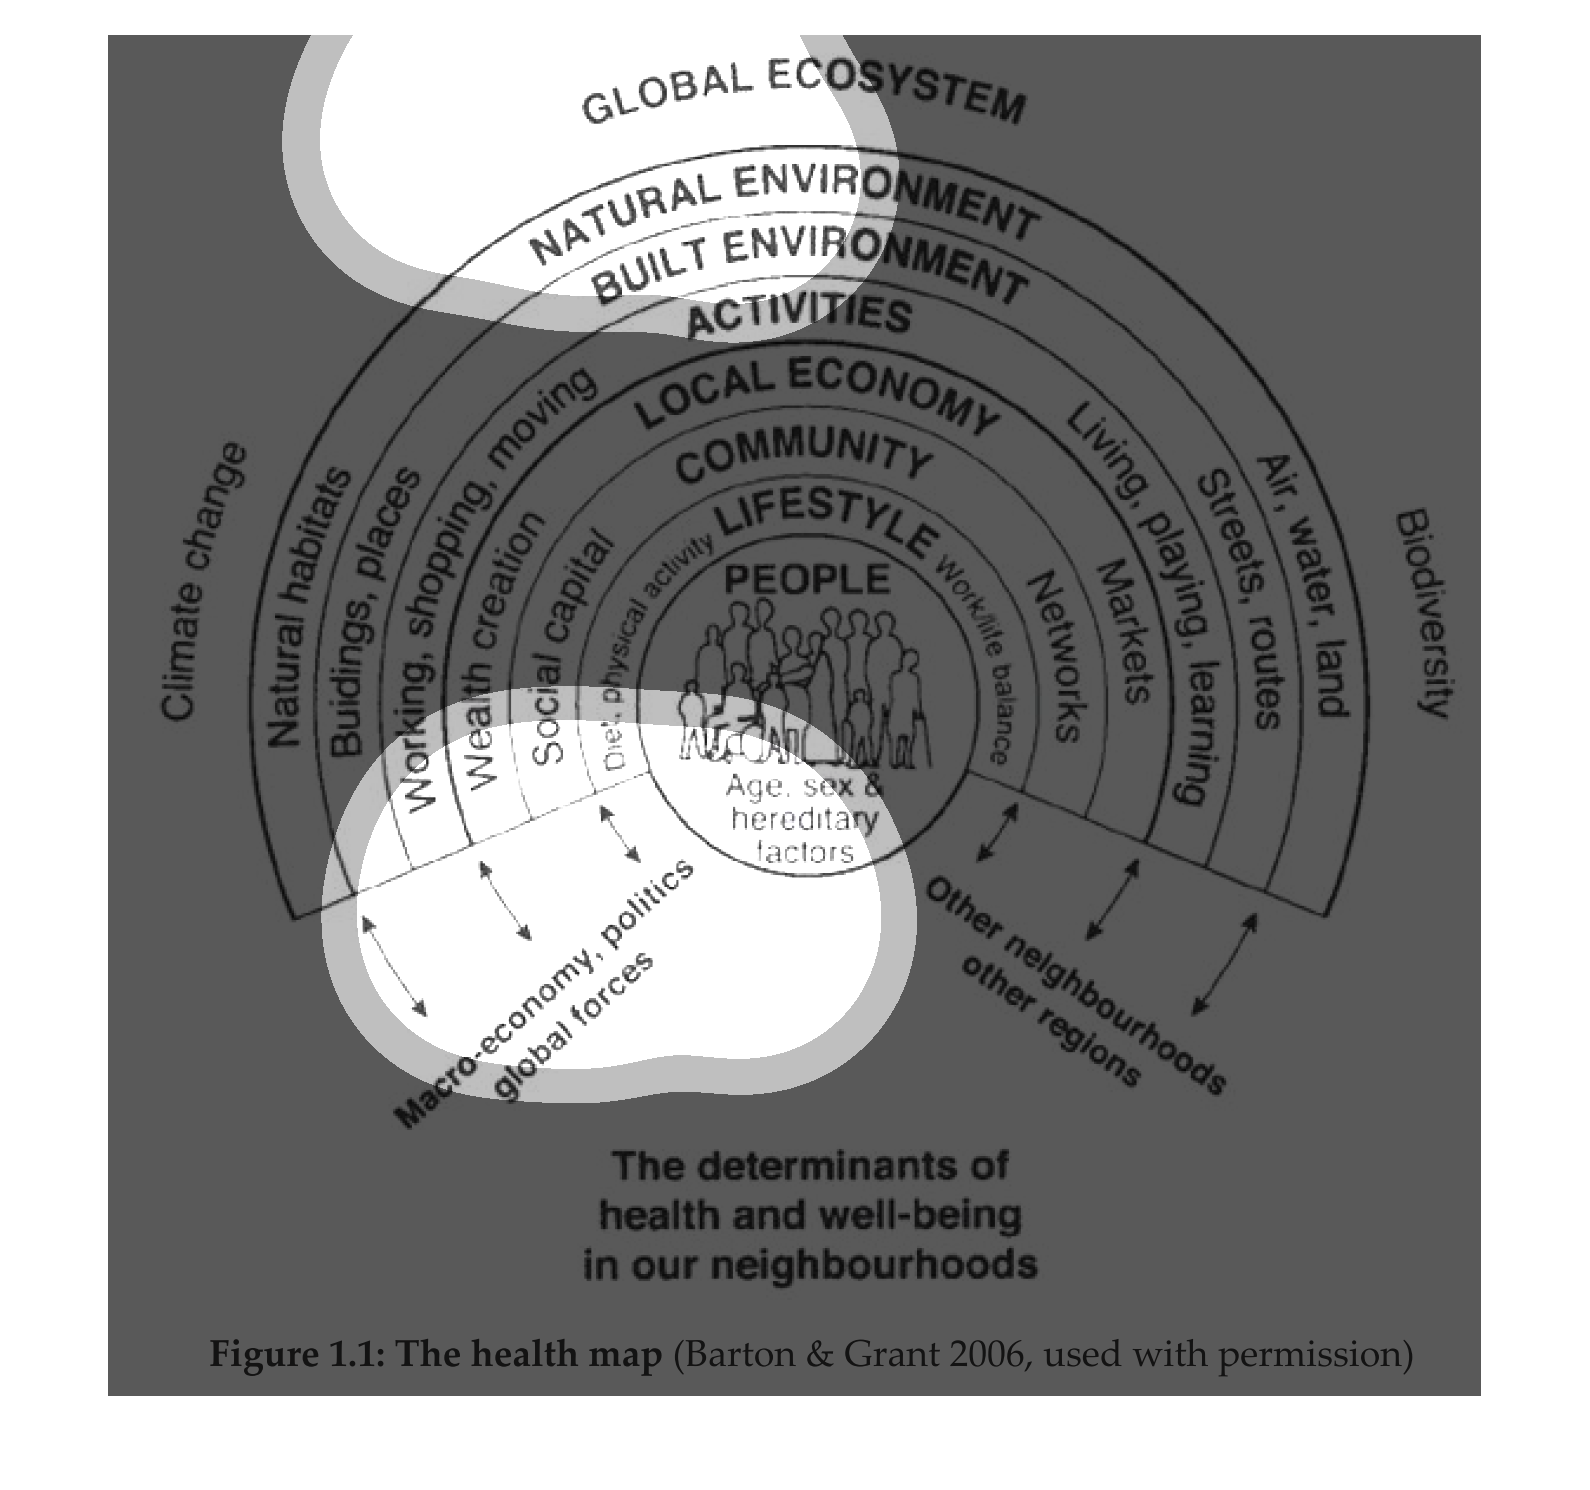
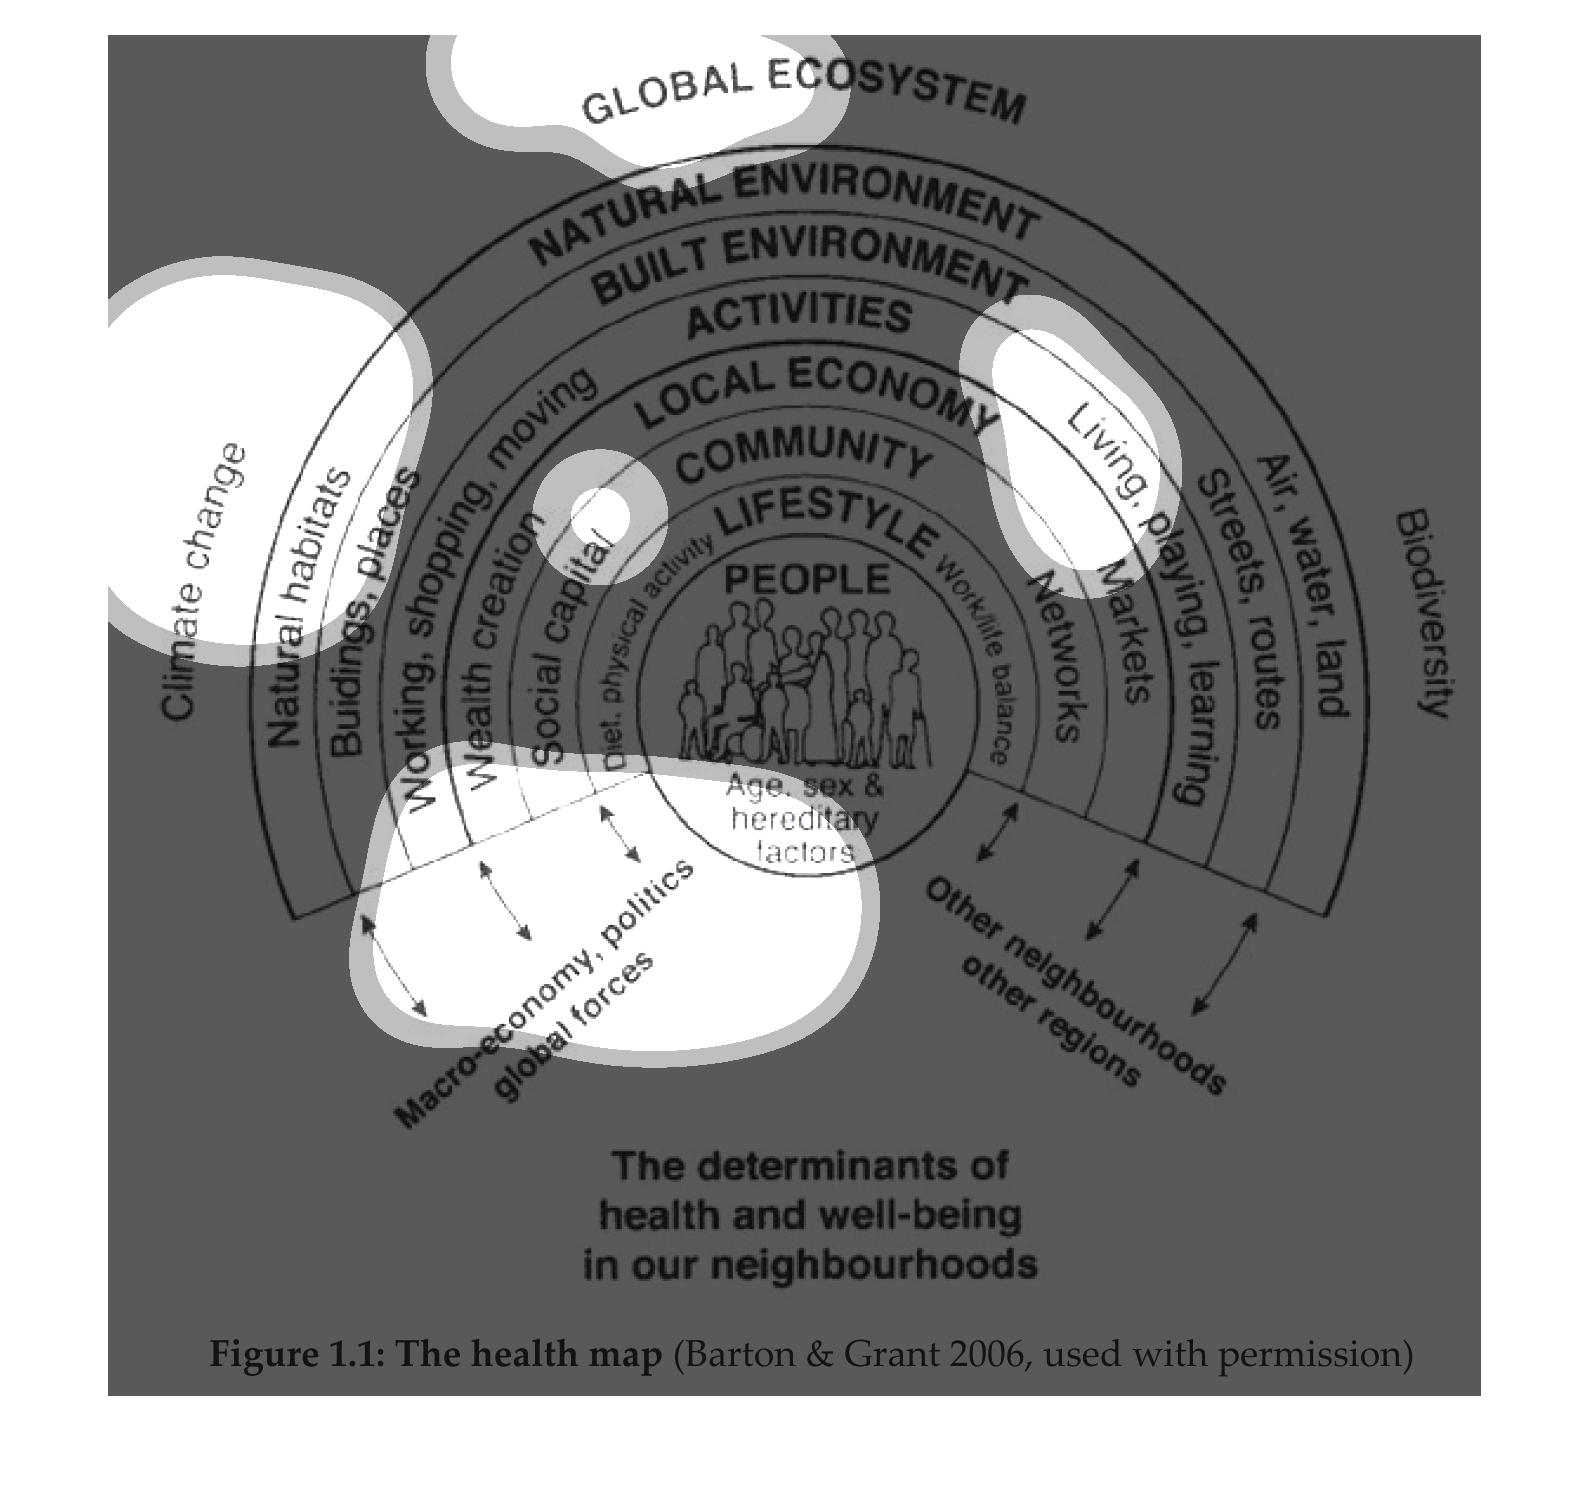
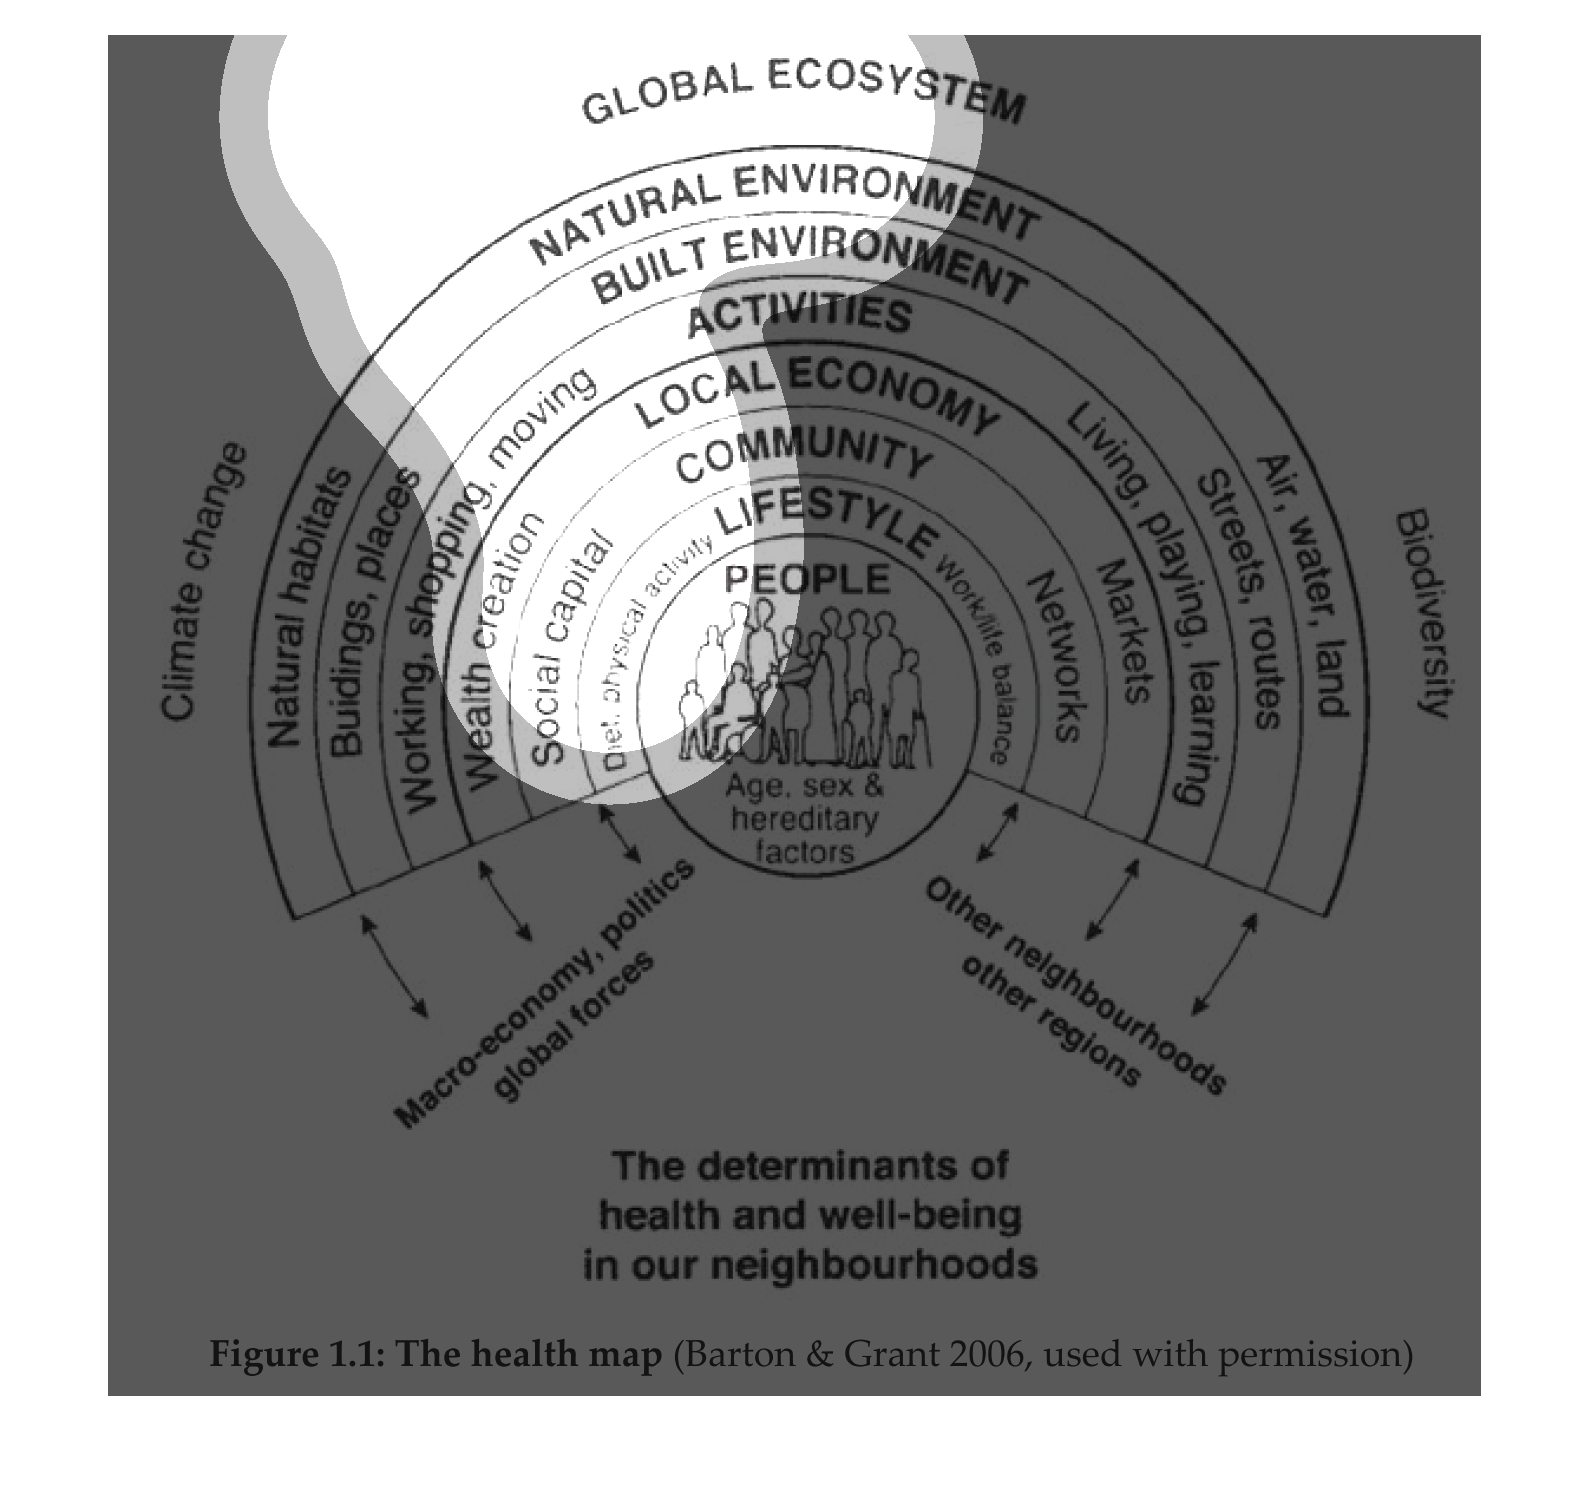
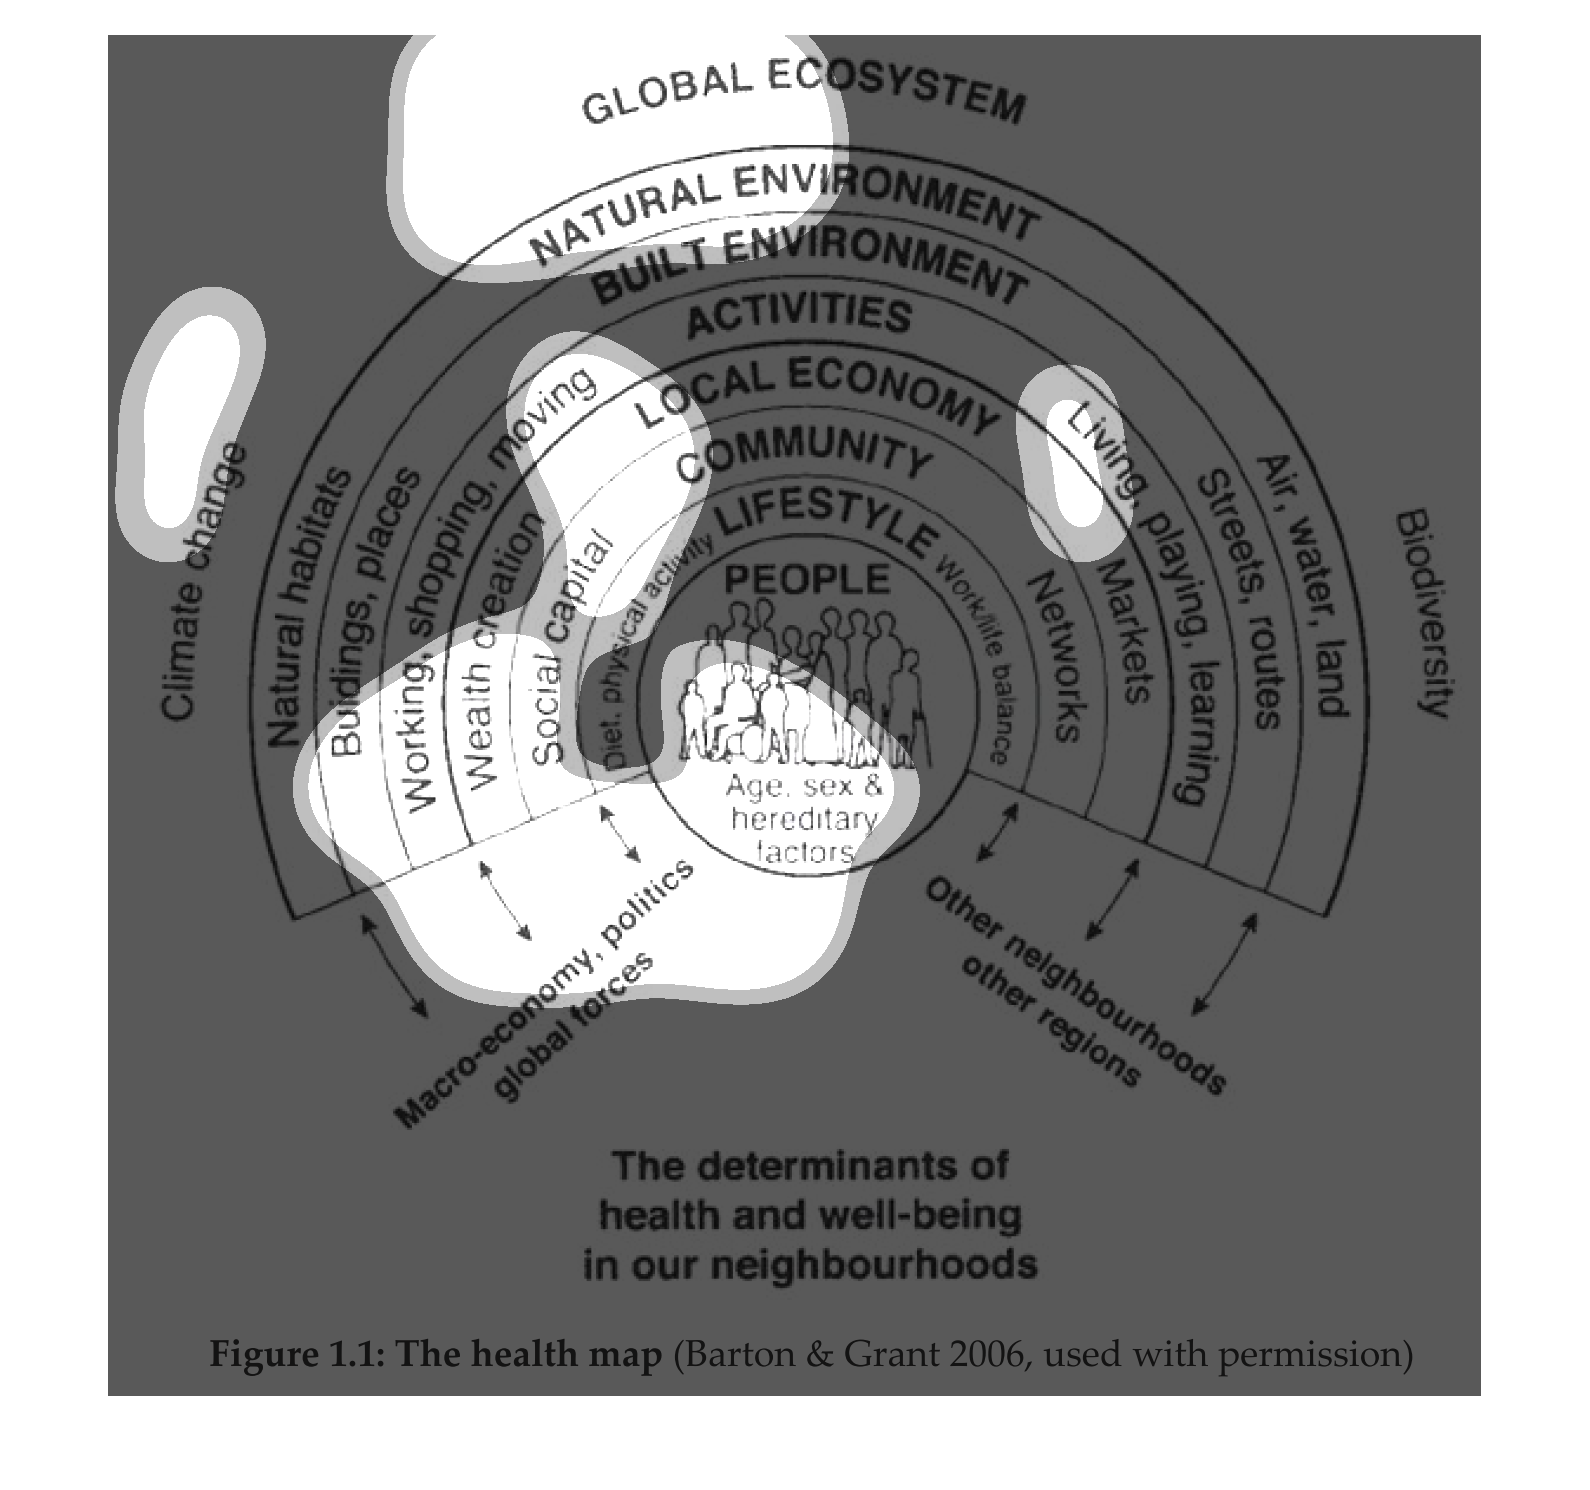
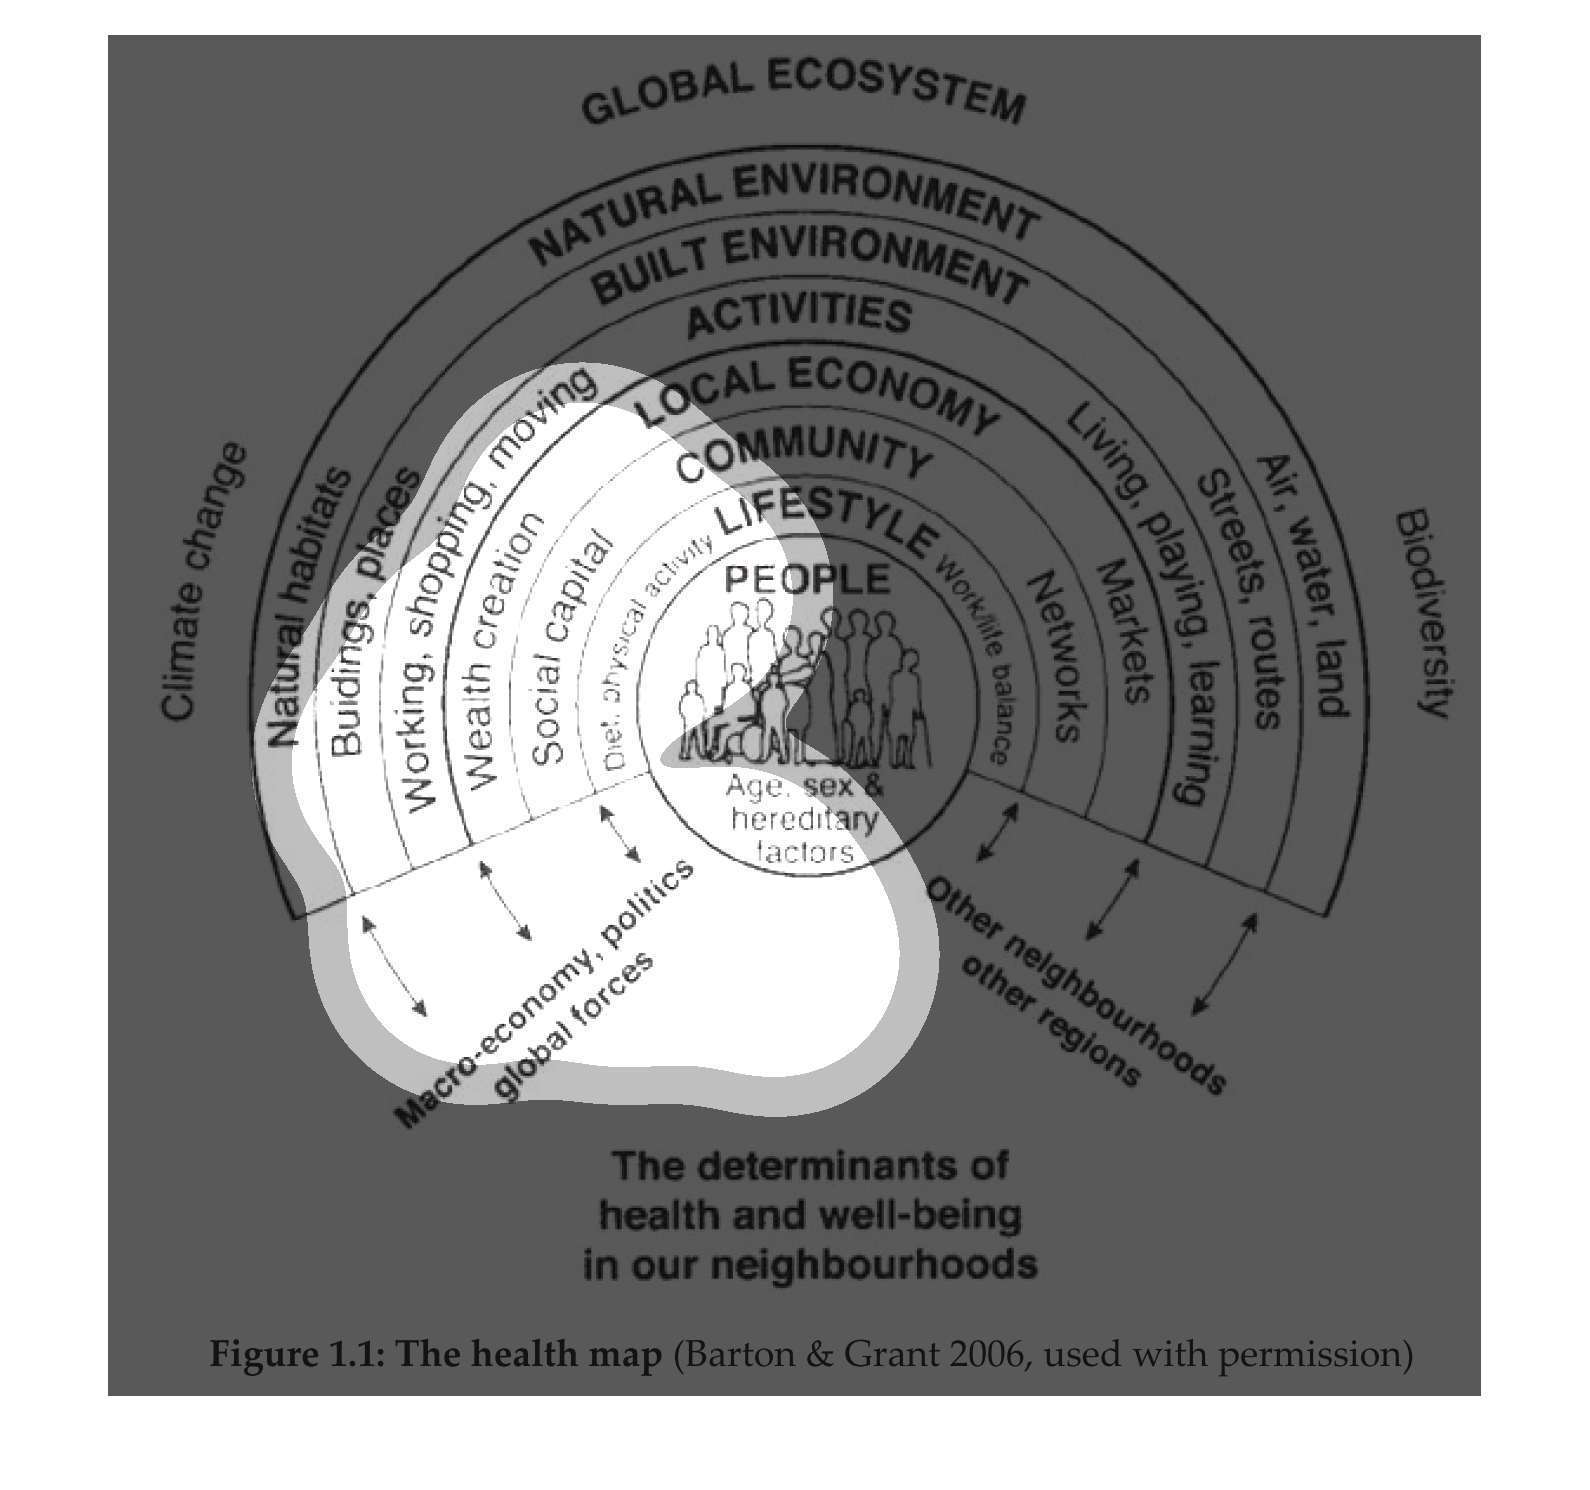
This image shows the relationship between self and the environment we live in. These relationships
determine our health and well-being. The inner circle is the people in one's personal life,
then comes the lifestyle, community, local economy, activities, build environment, natural
environment and extends all the way to global ecosystem.
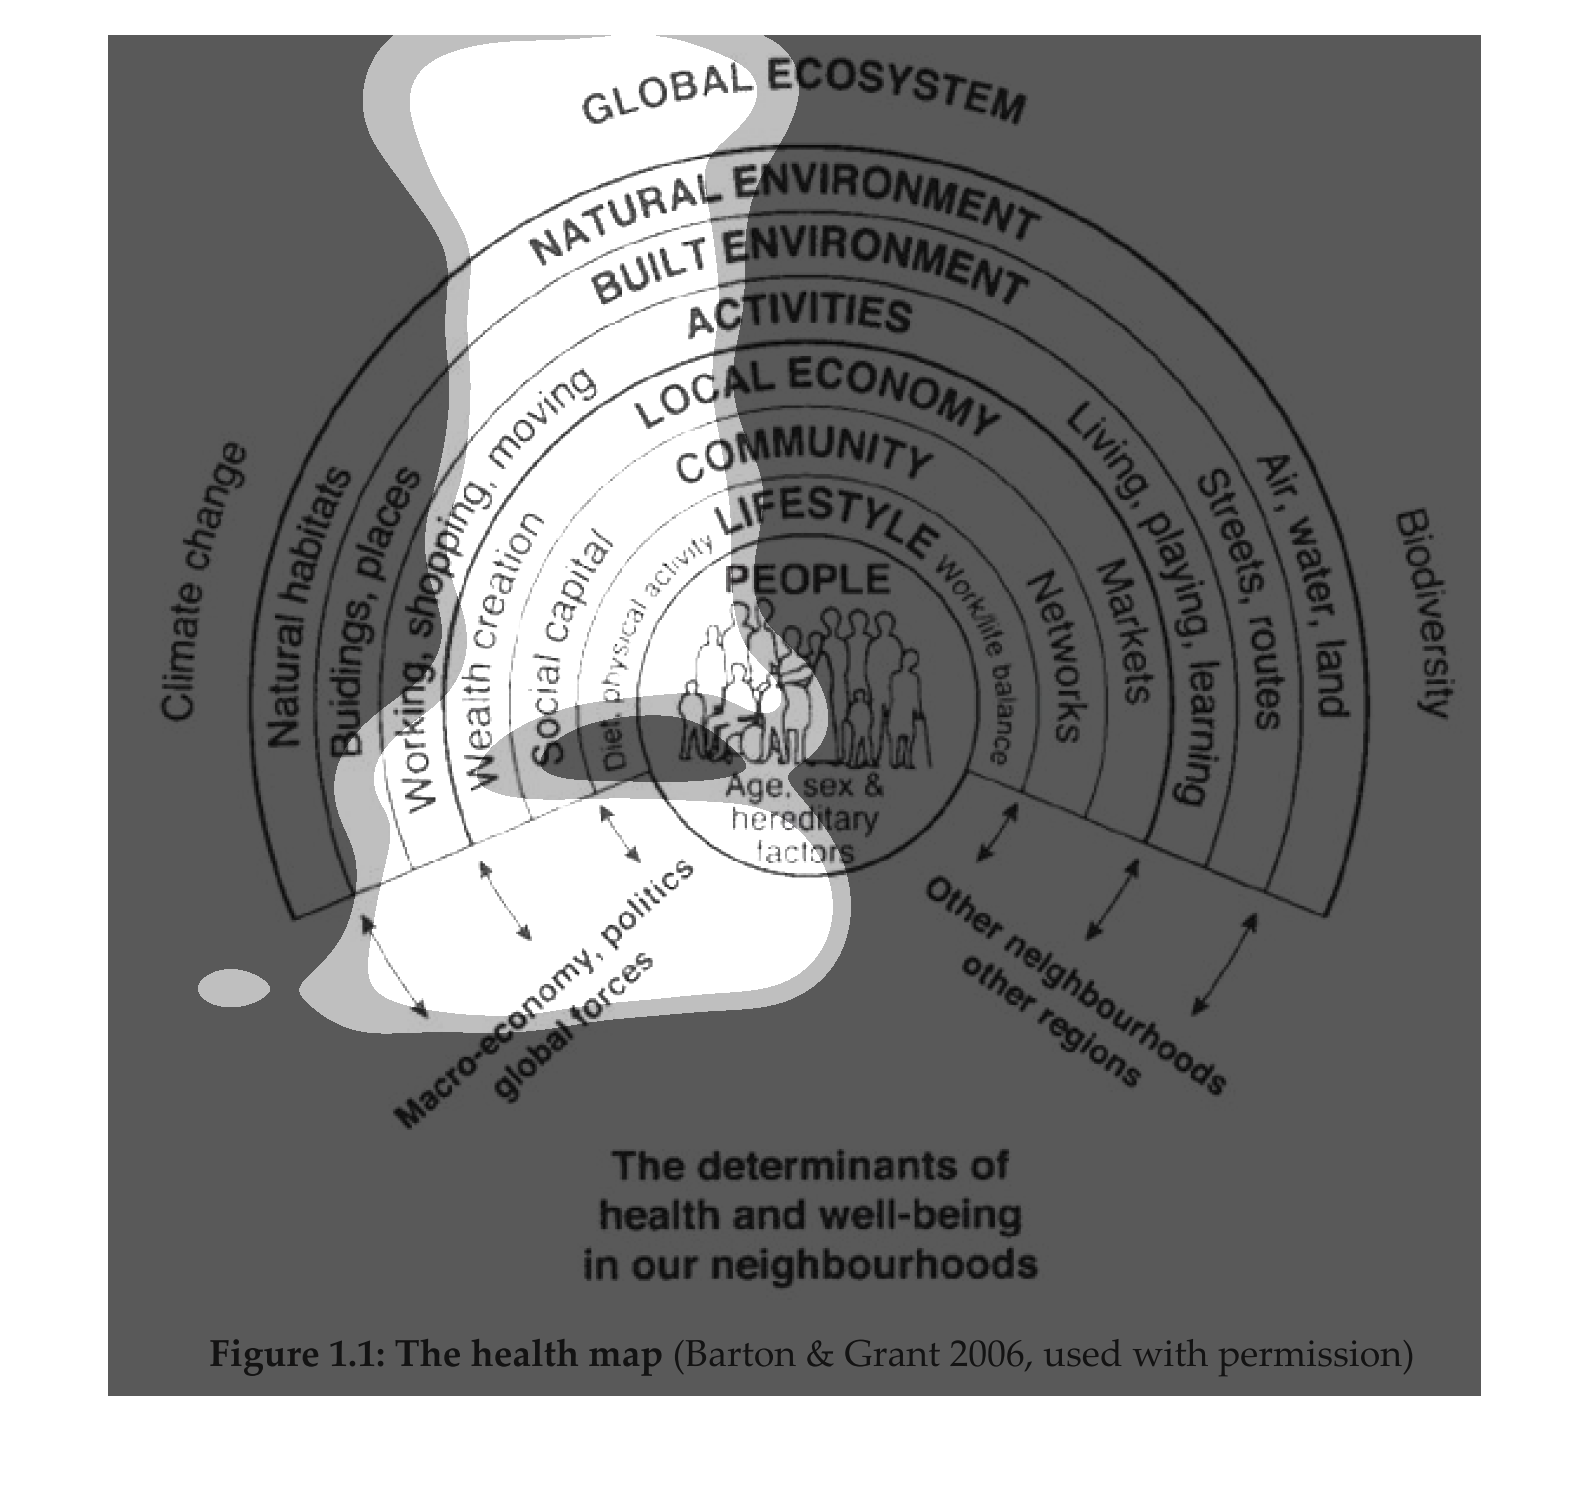
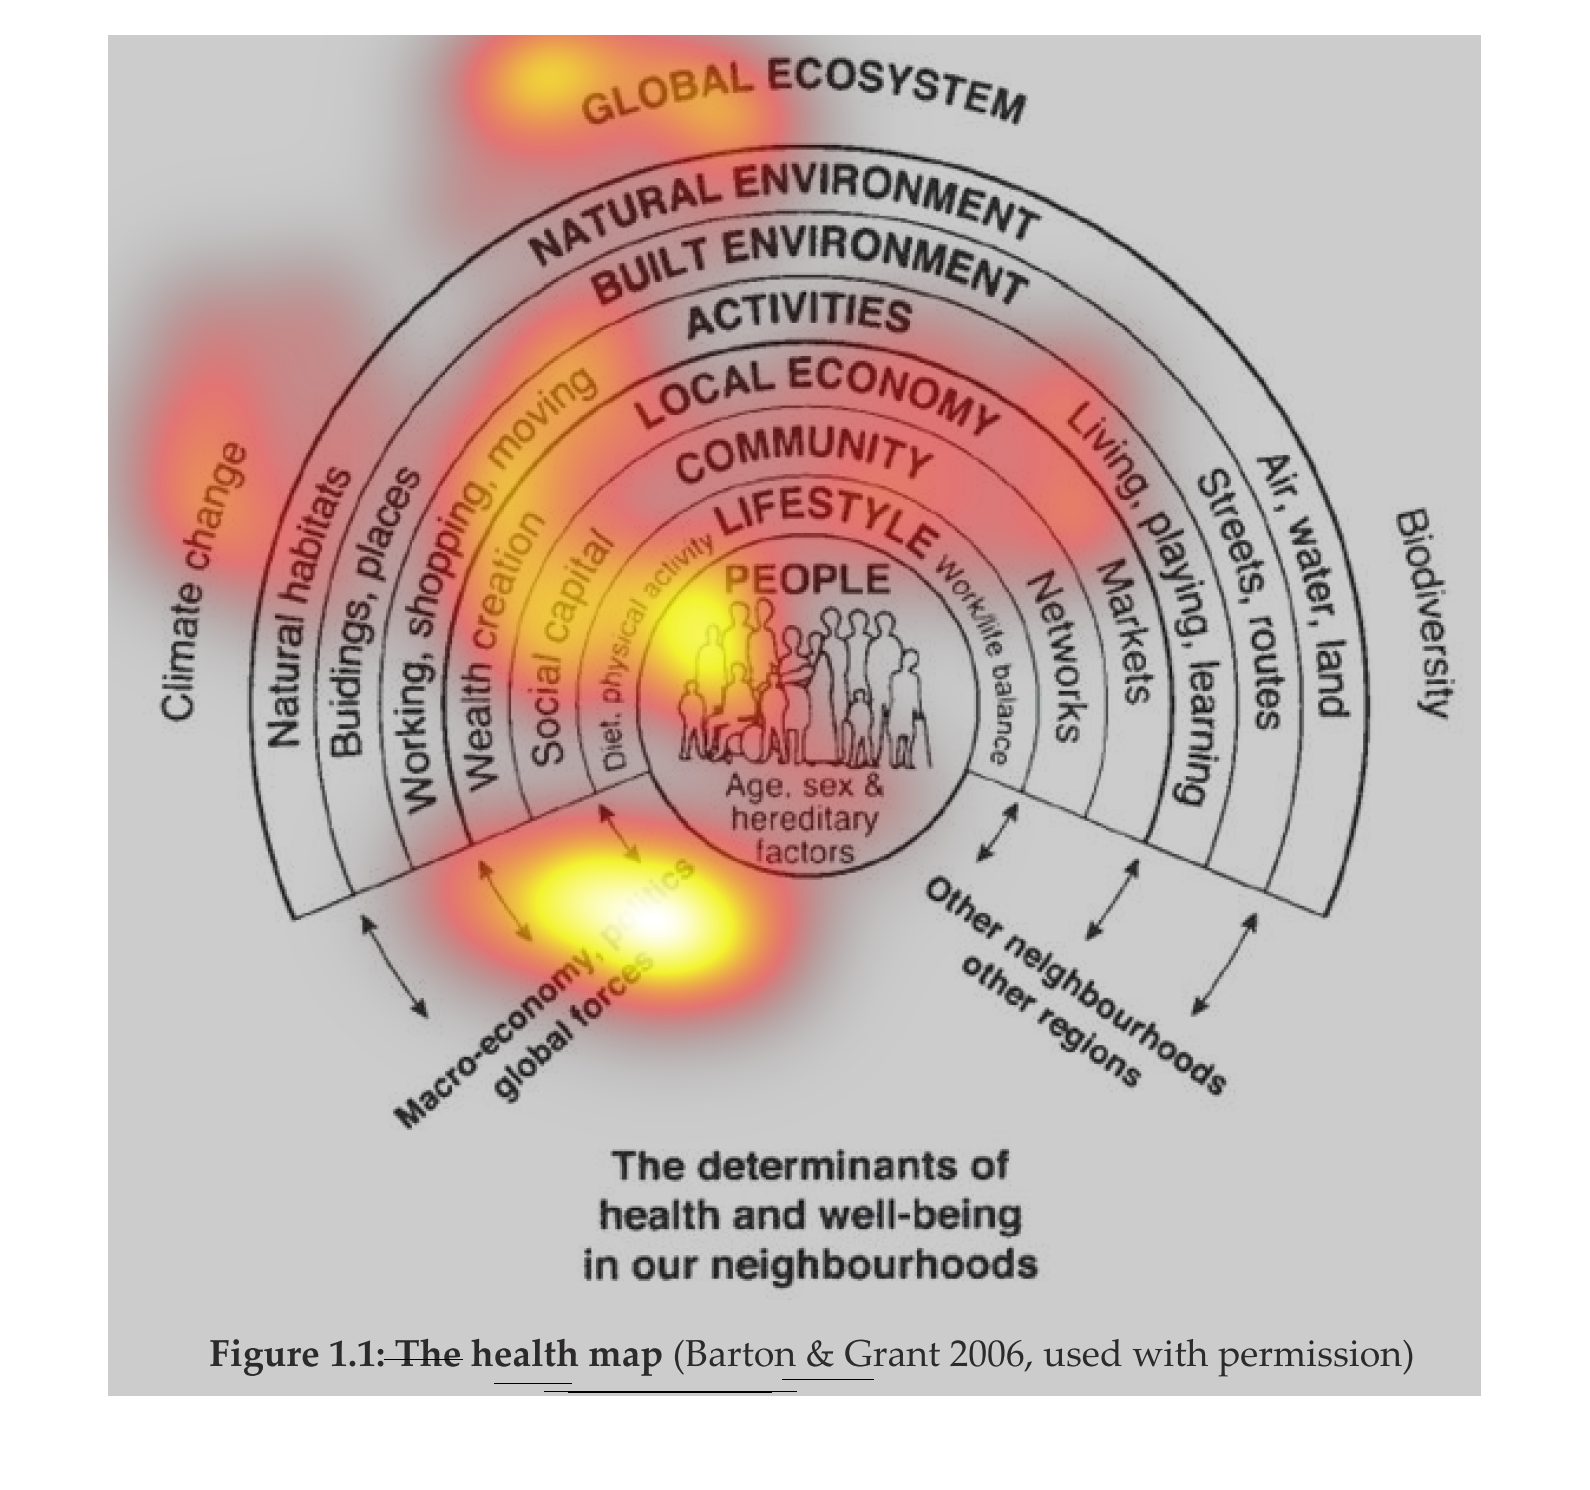
Global ecosystem. A rather bizarre round chart with concentric circles, starting from the
outside we see; natural environment, built environment, activities, local economy, community,
lifestyle, and people at the center. the circles include smaller text pertaining to it's main
label
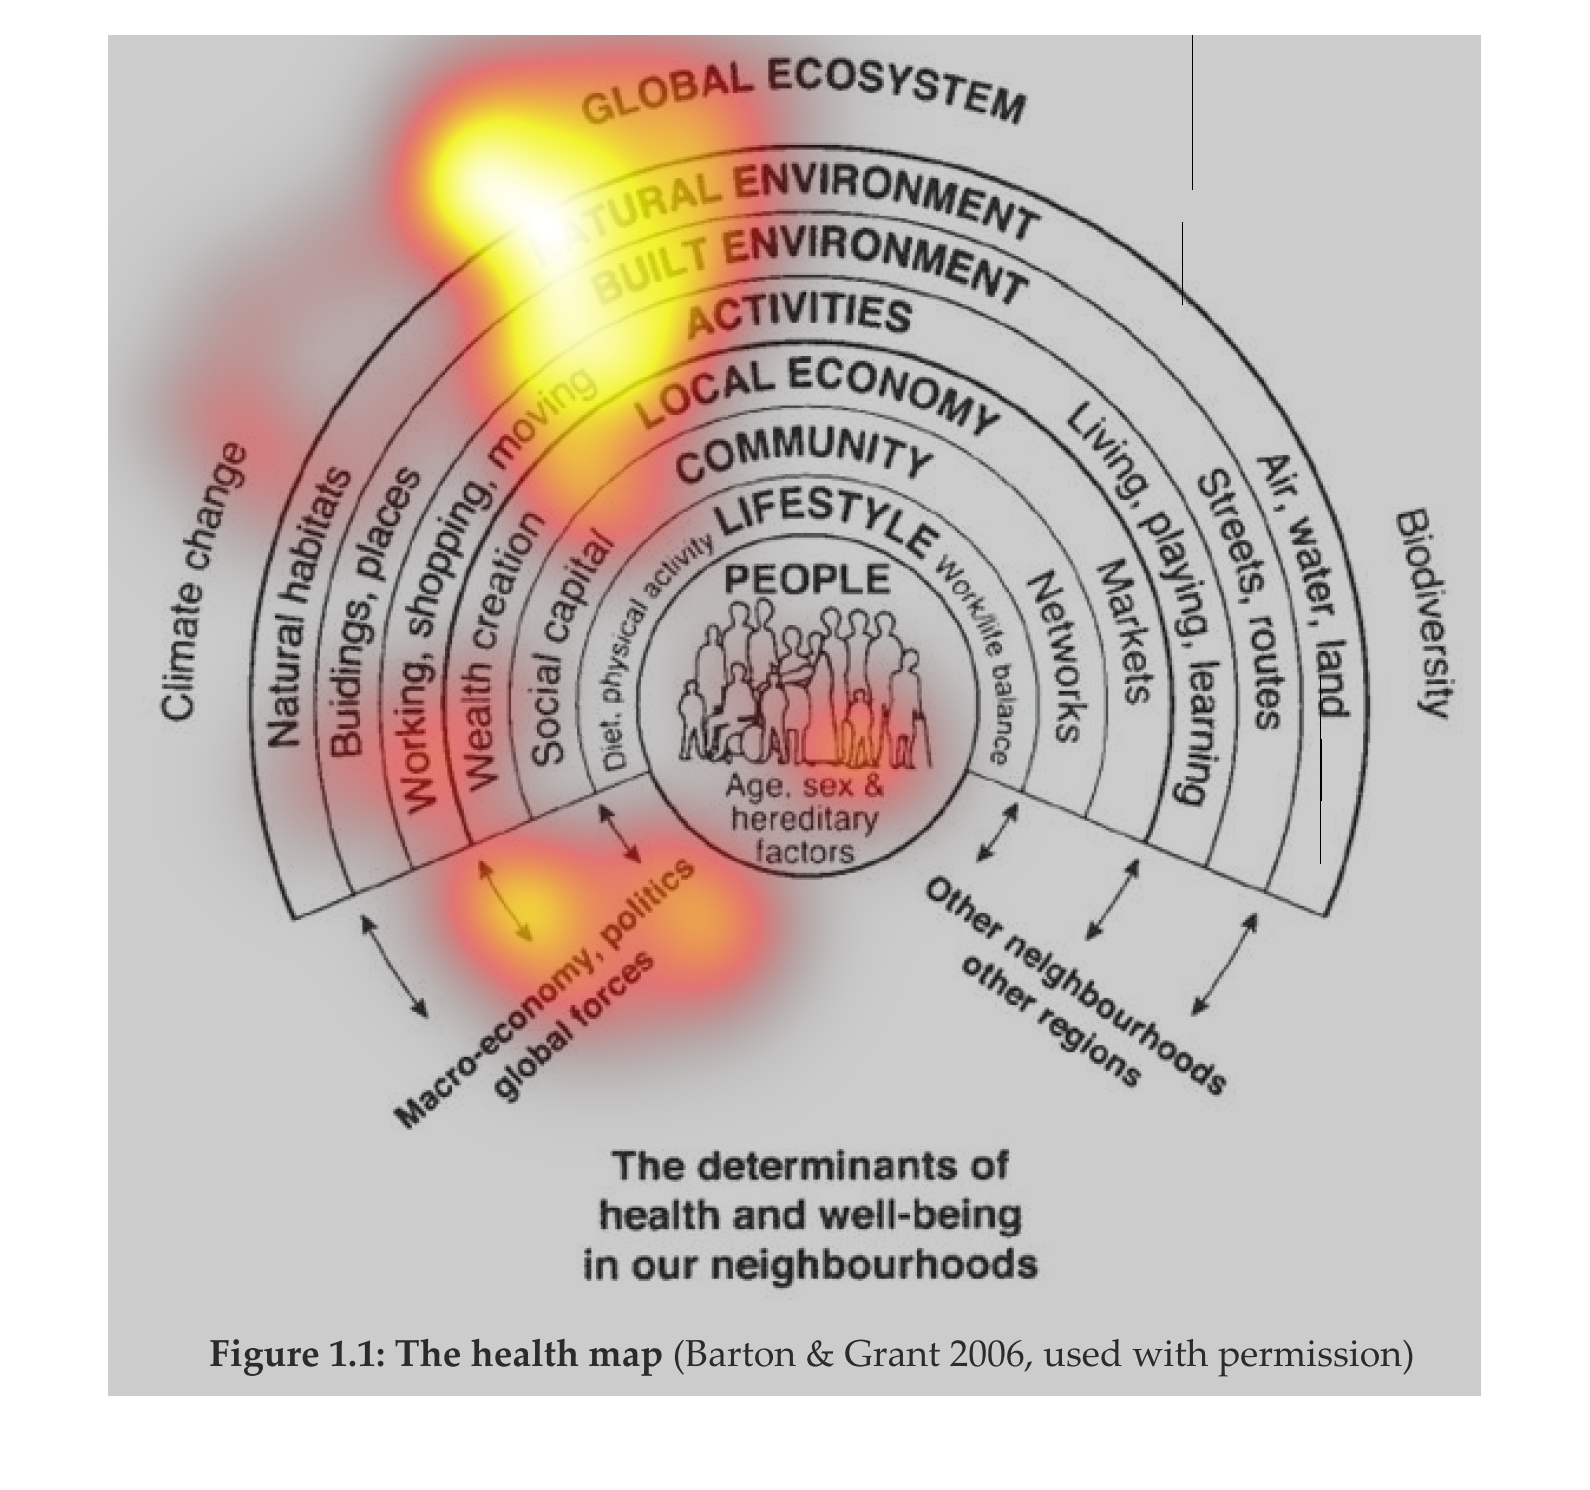
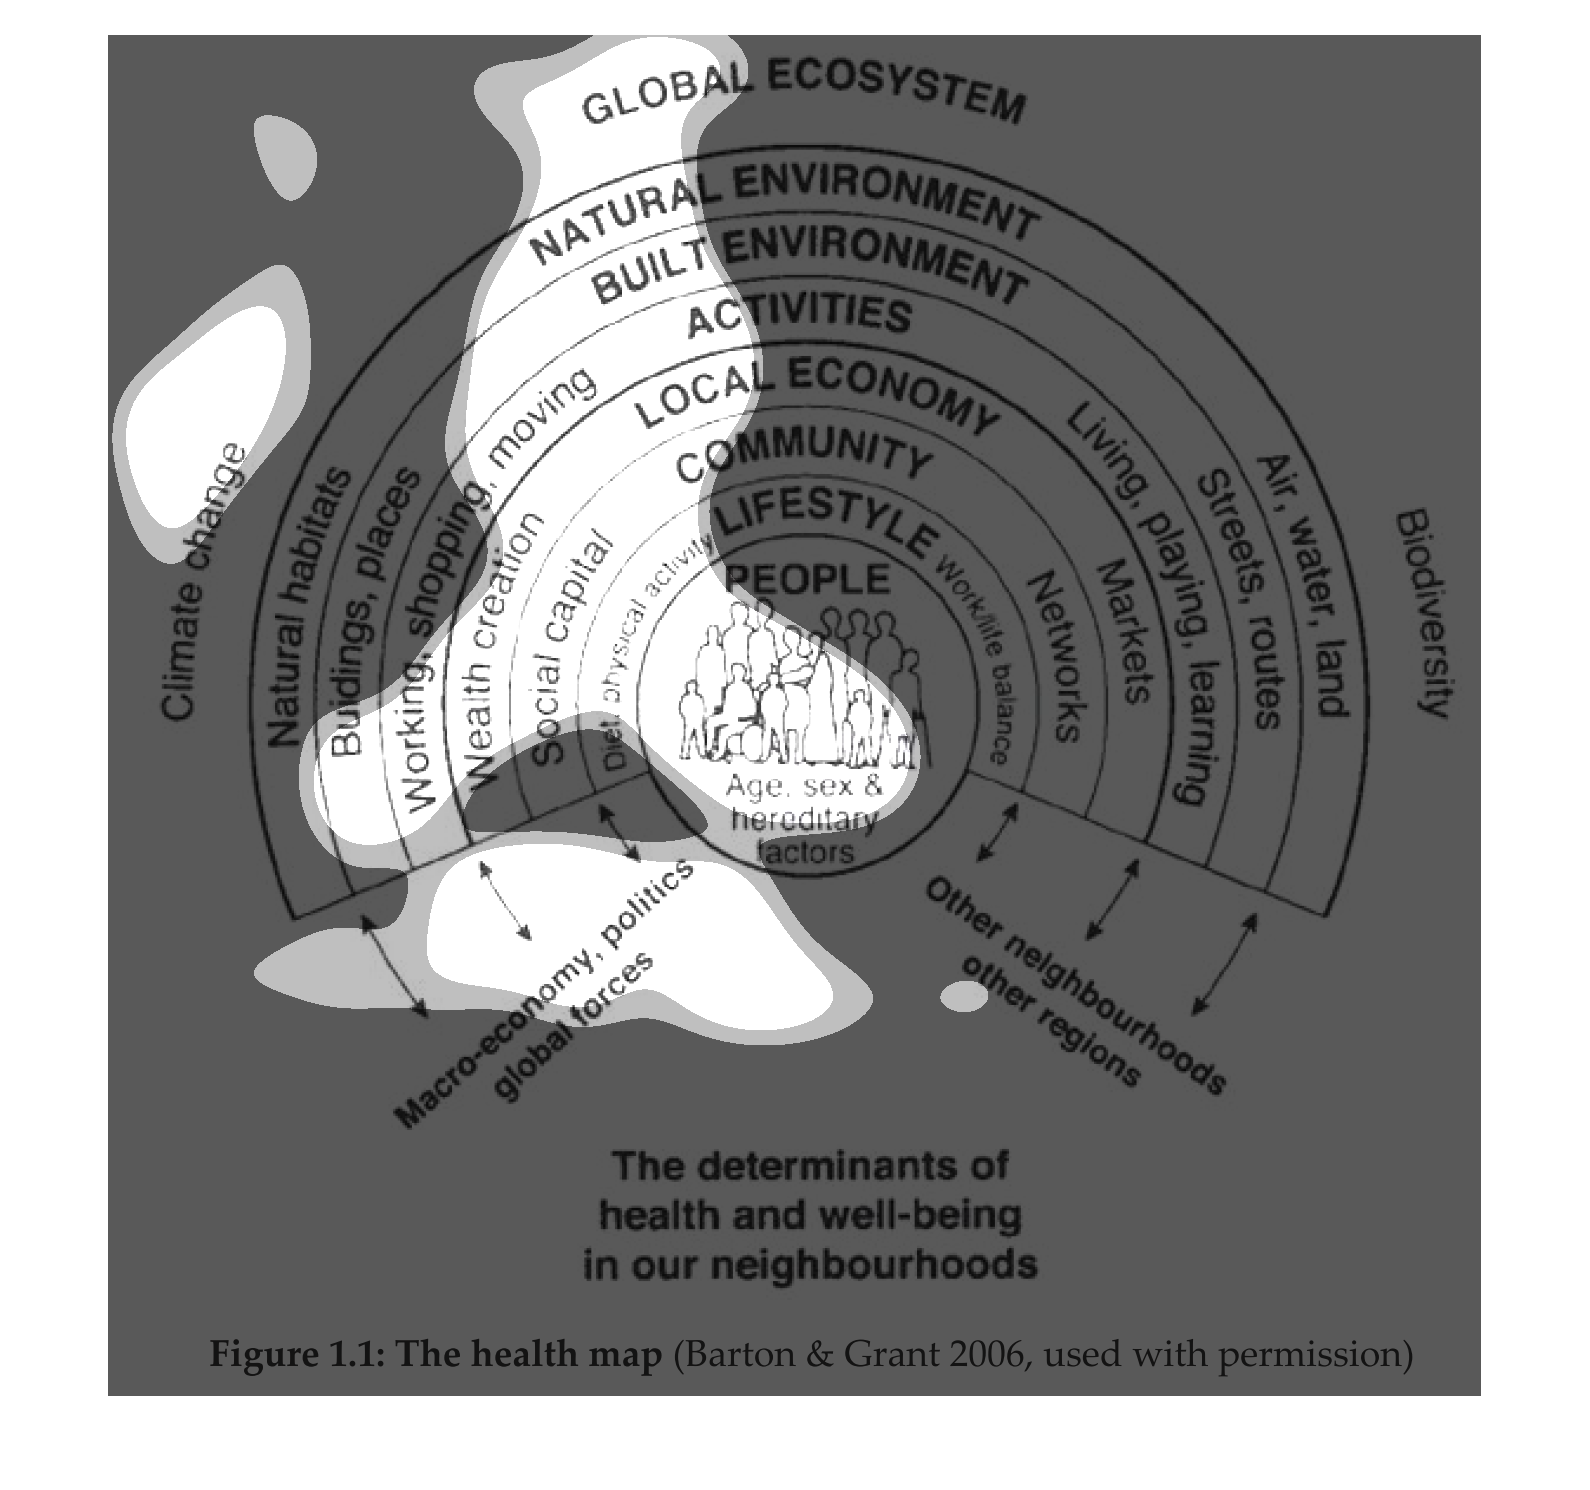
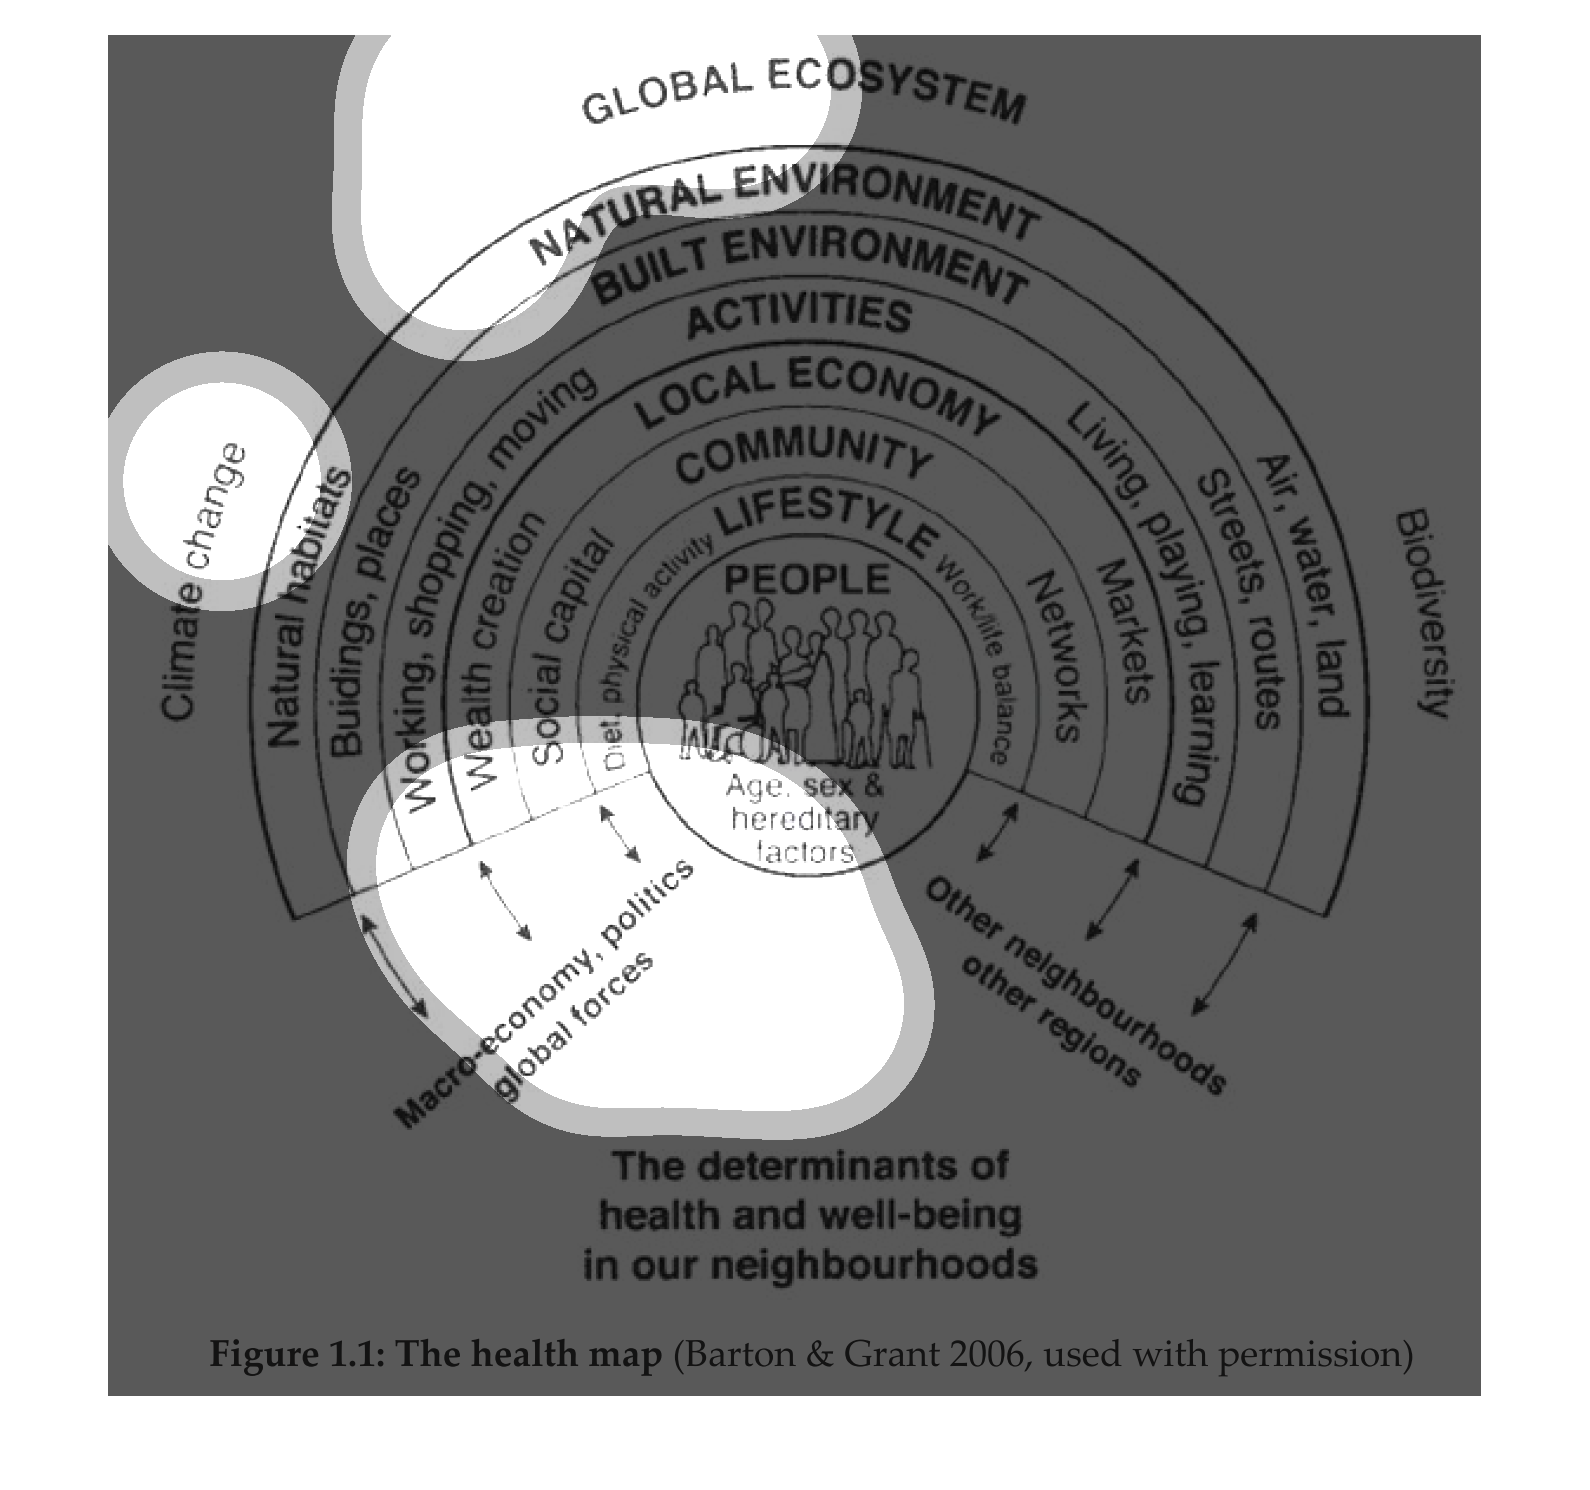
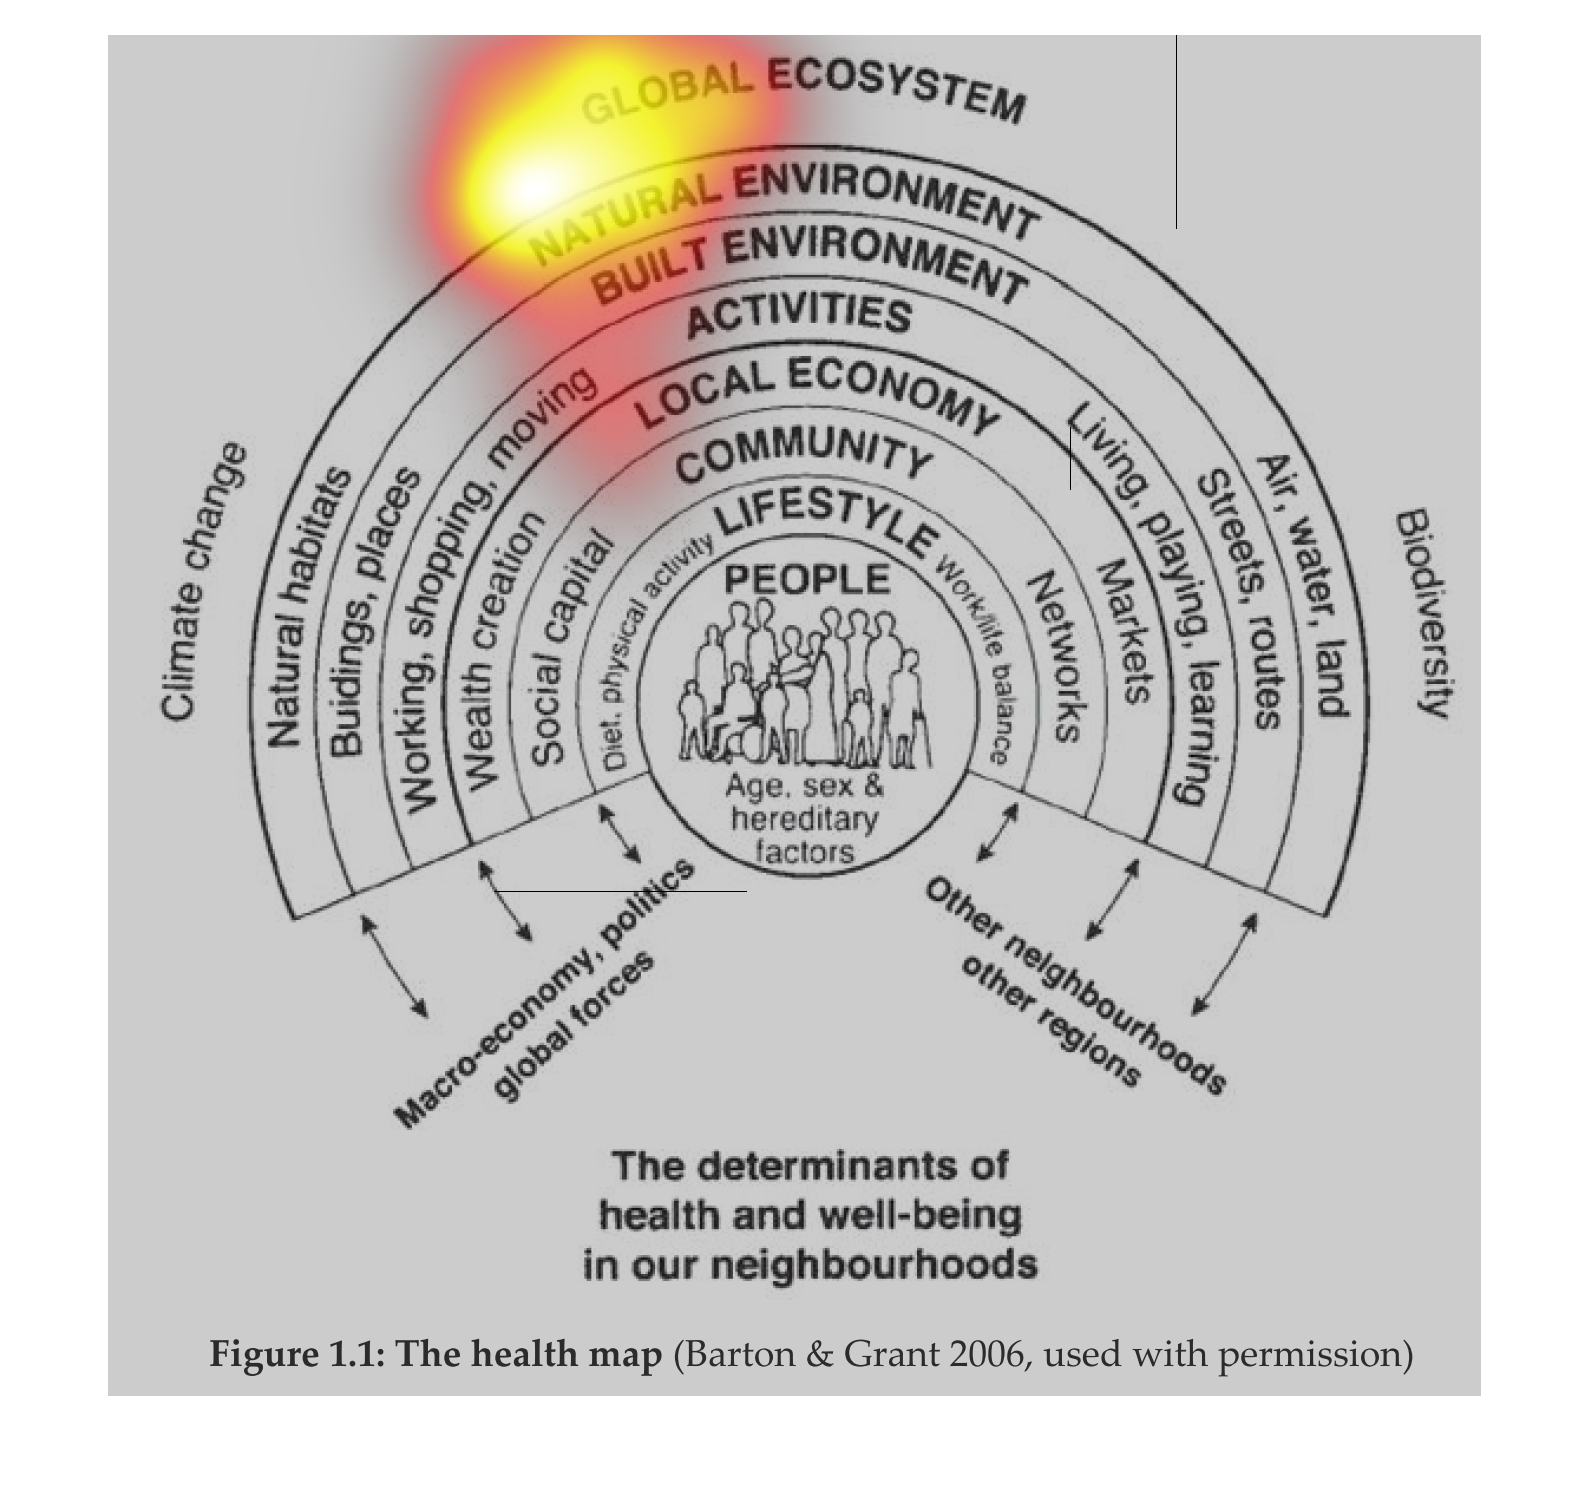
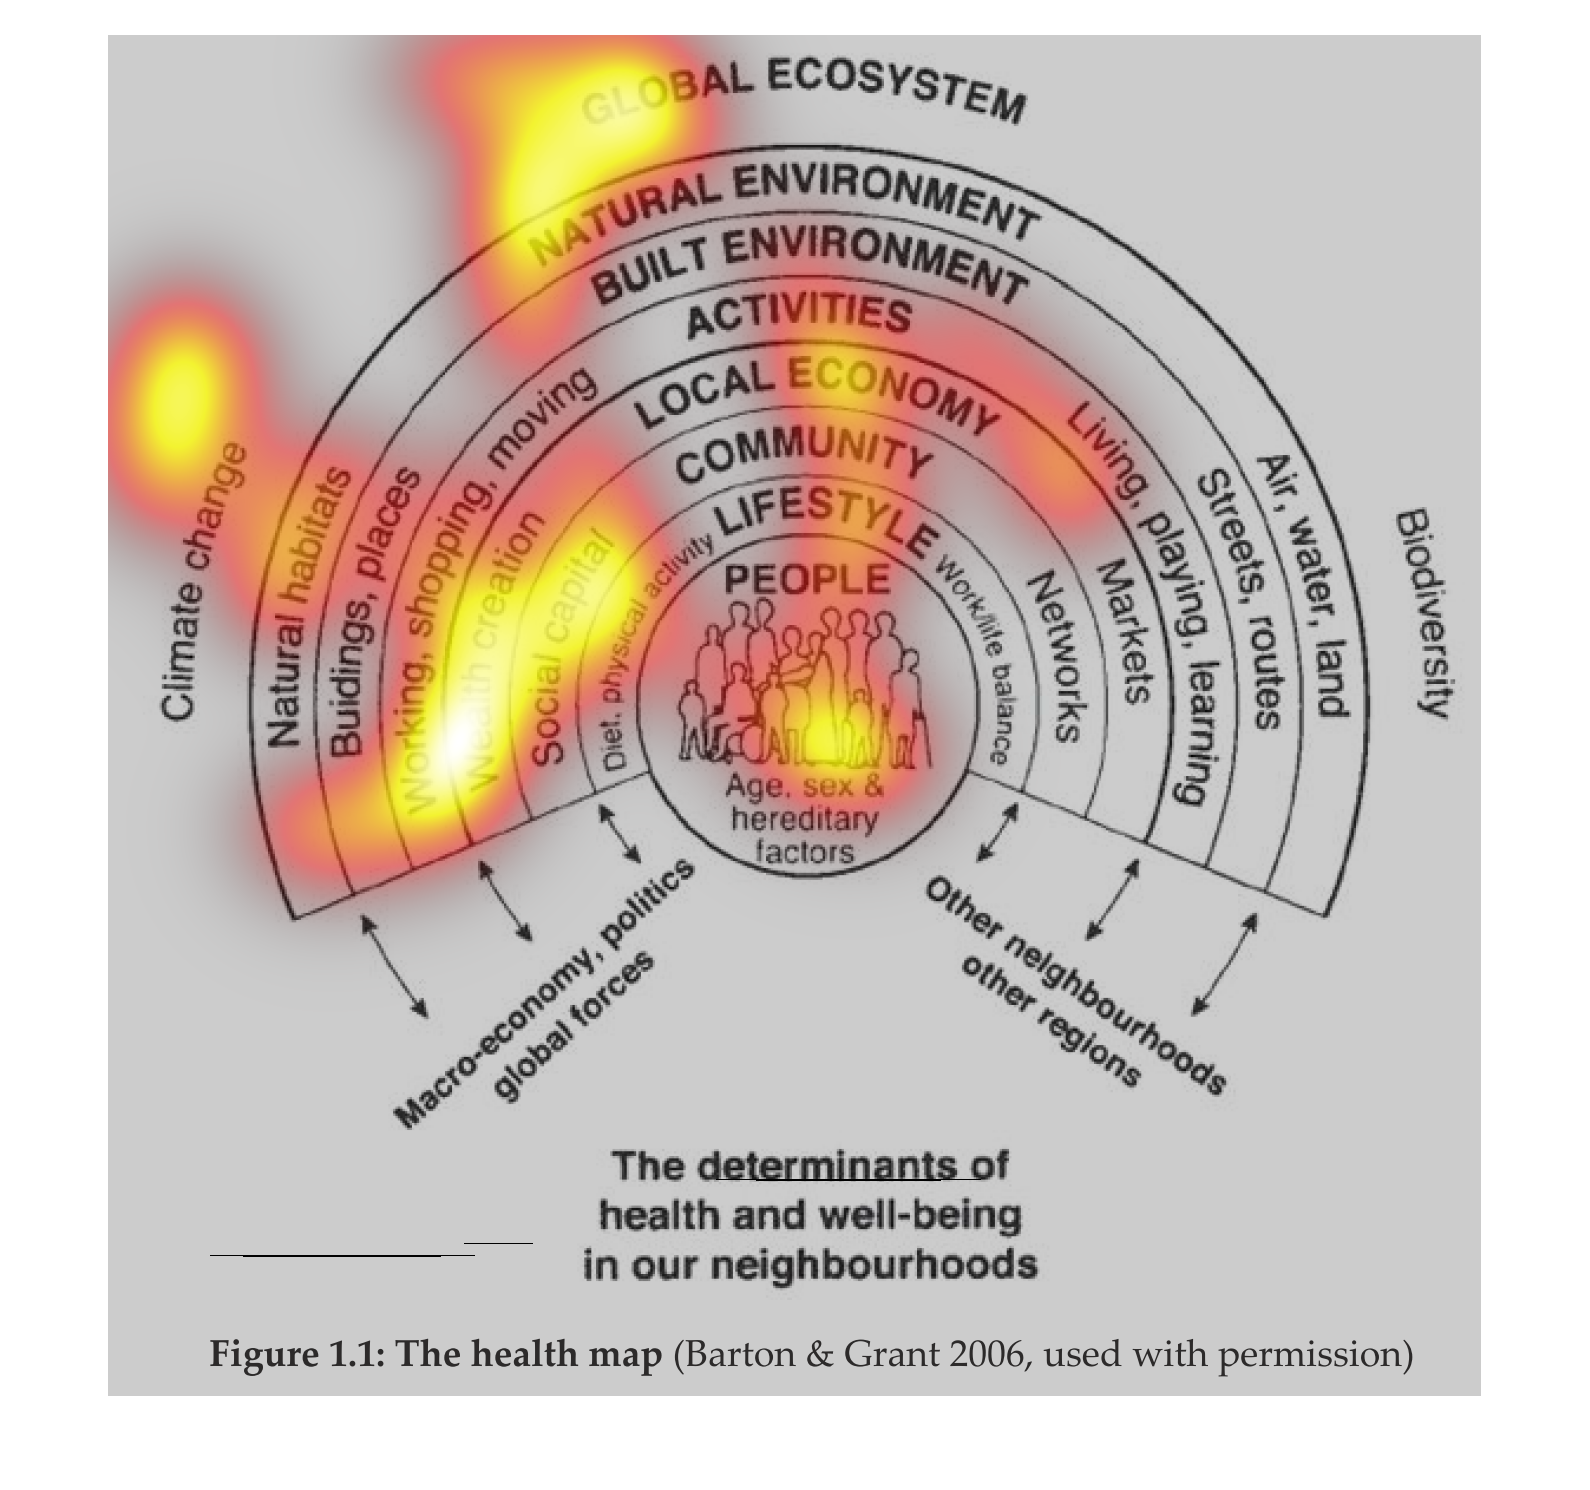
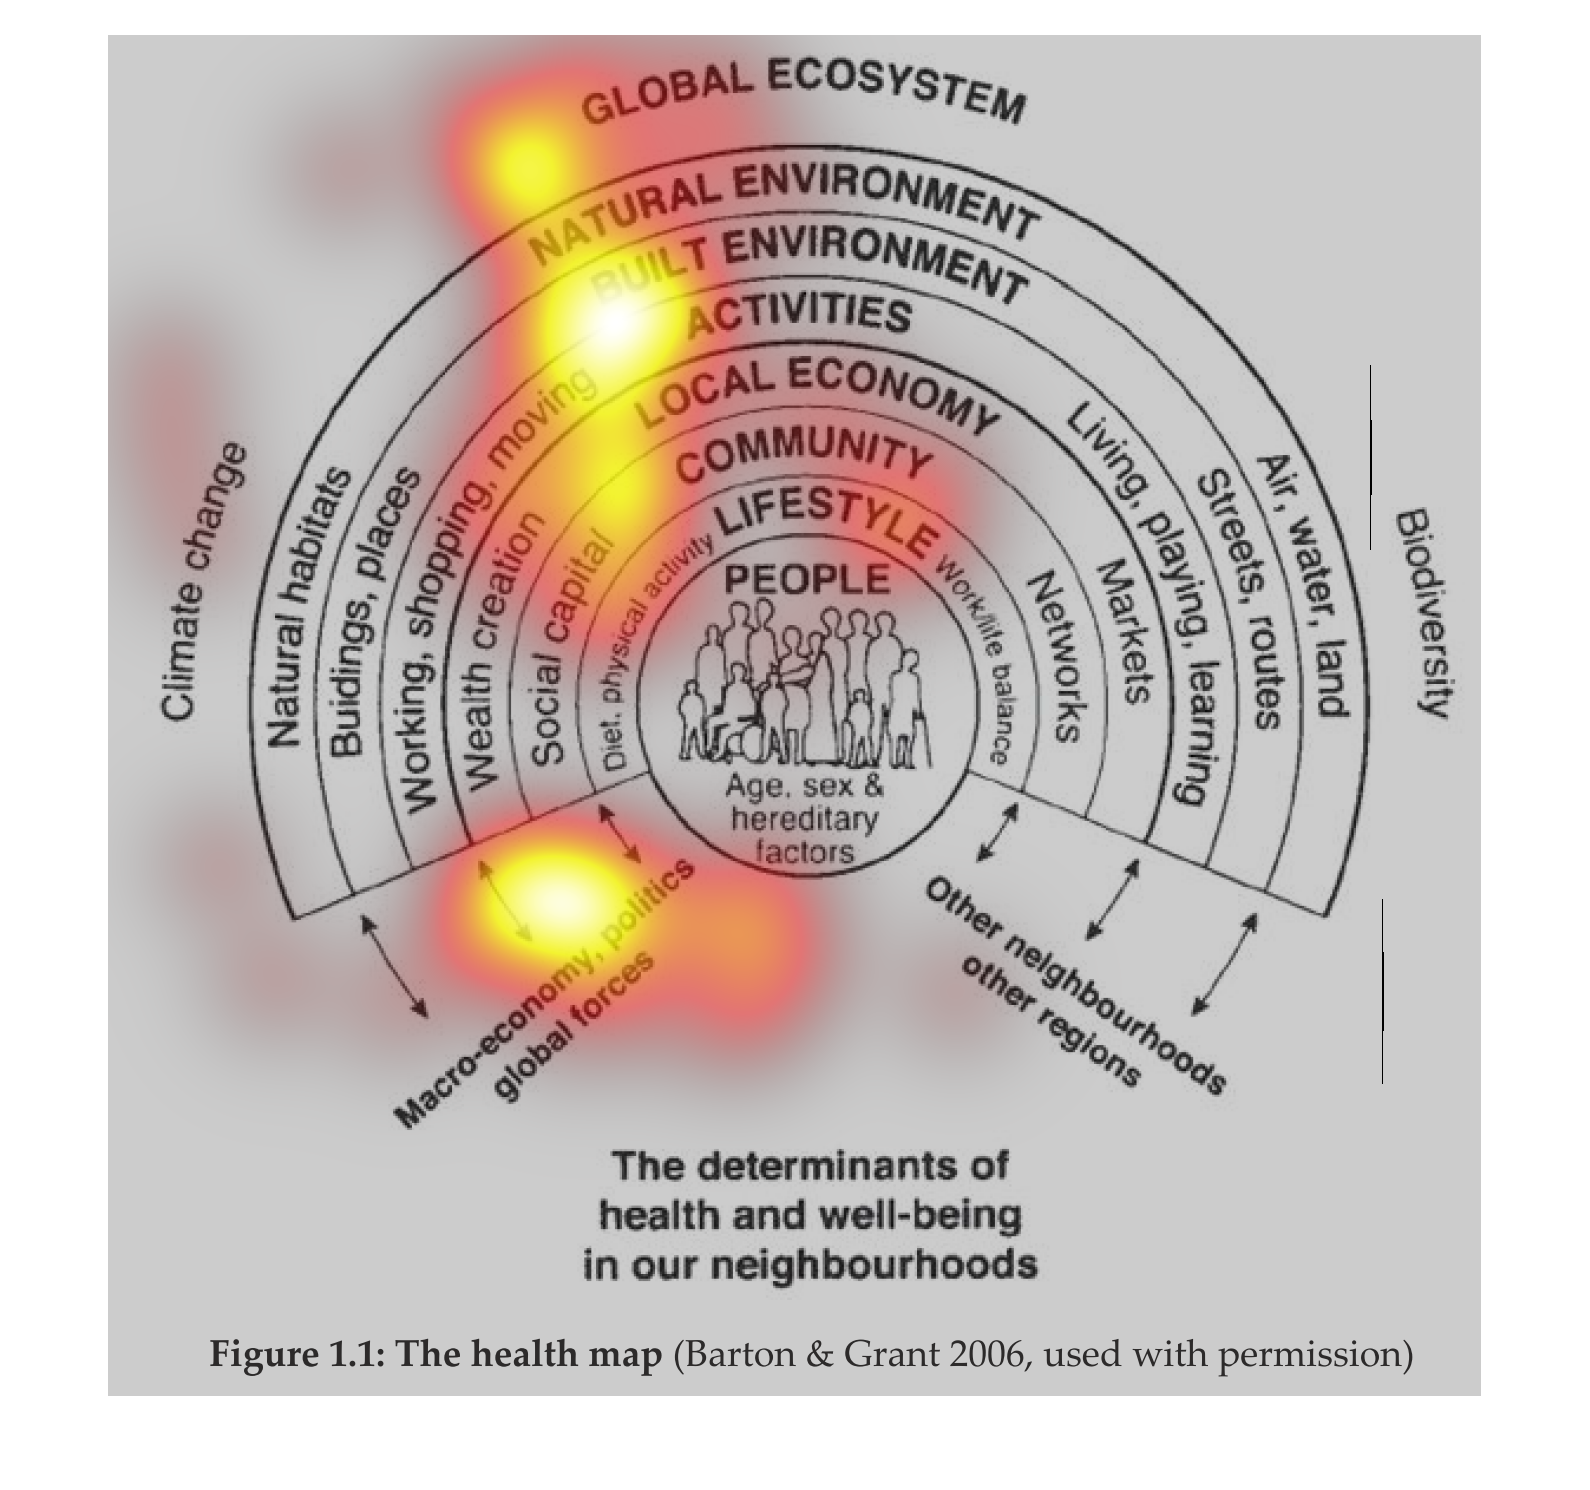
This diagram shows determinants of health and well-being in our neighborhood. It shows climate
change at one portion of the eccentric circles, natural habitats in the next circle, buildings
and places in the consecutive eccentric circles.
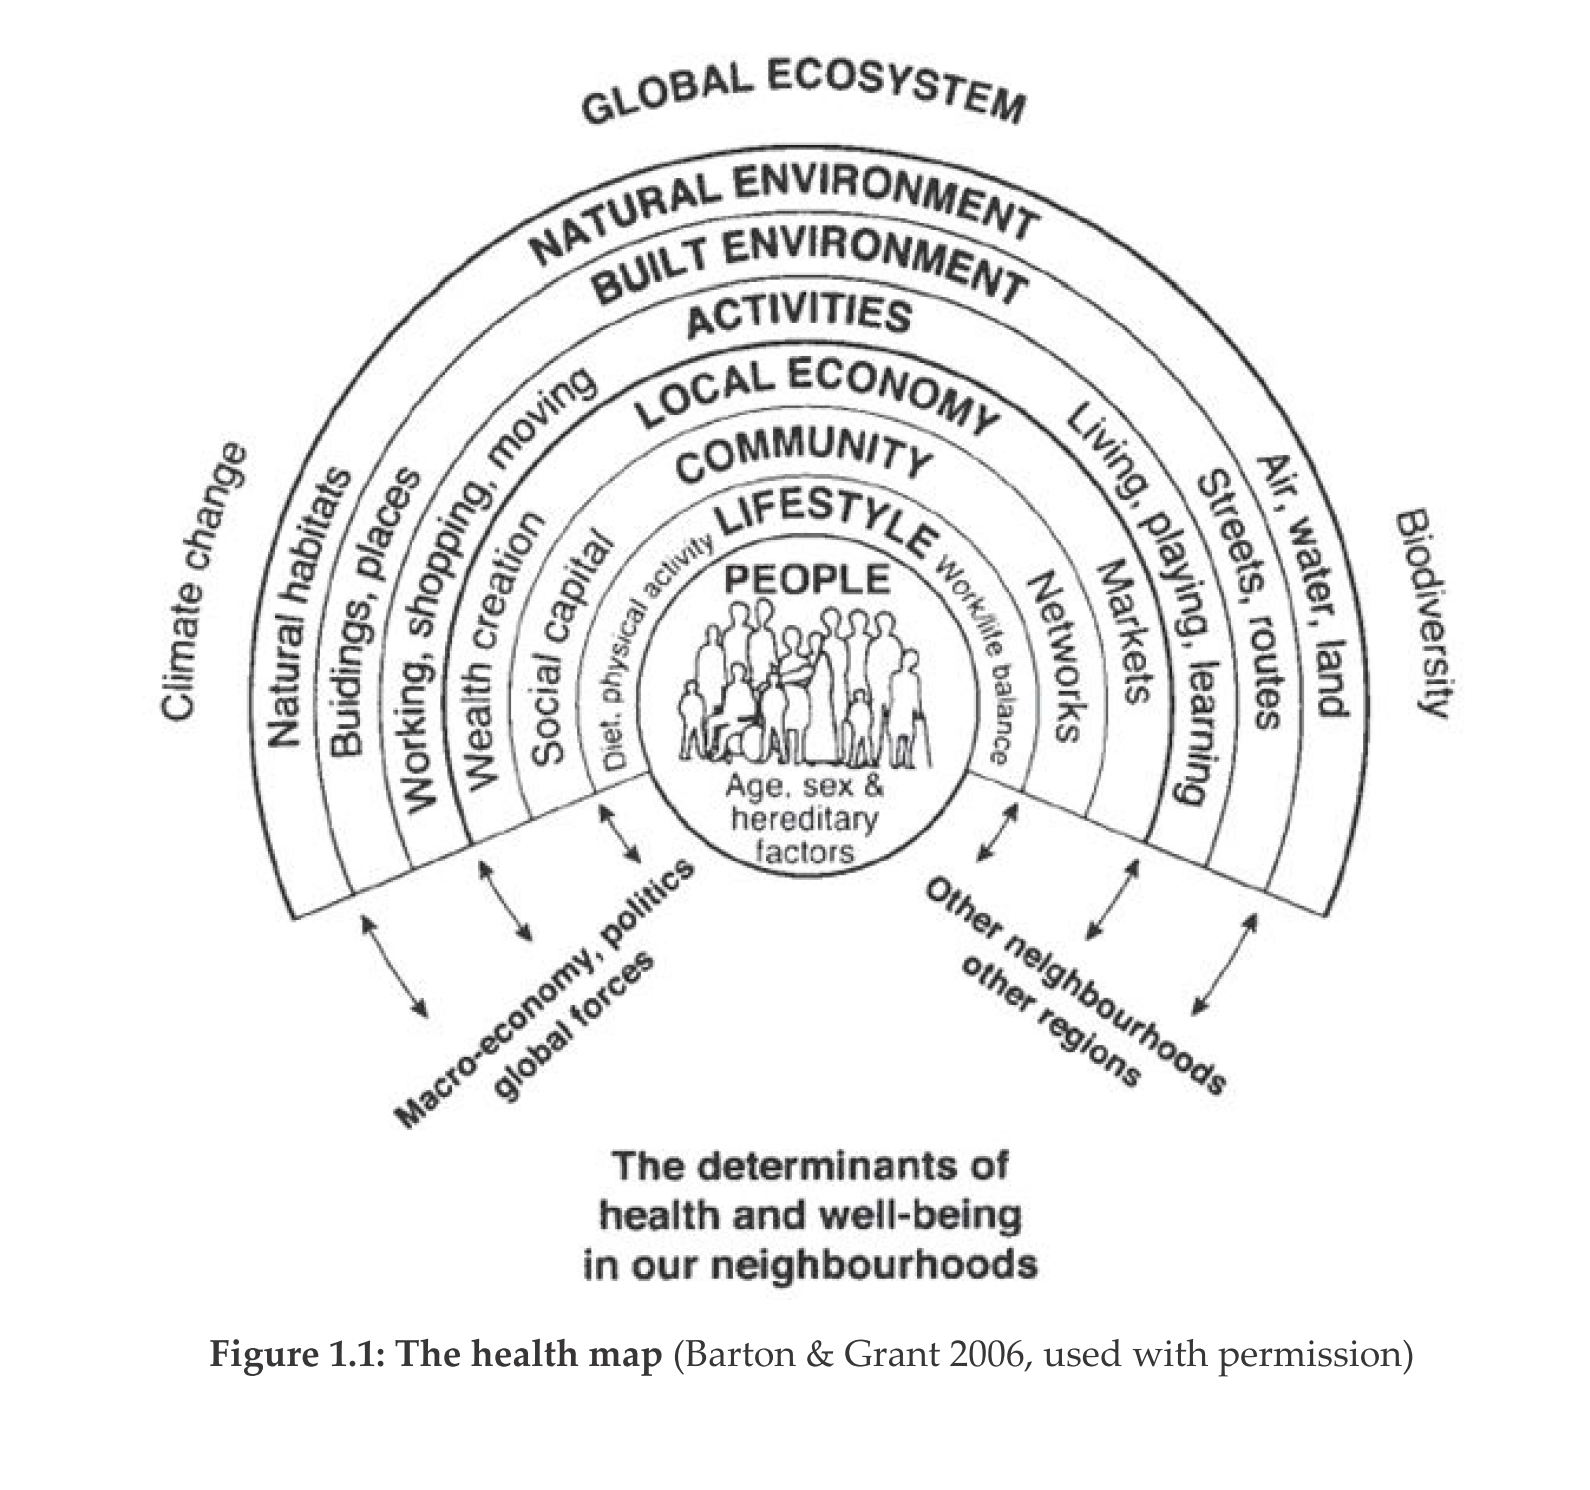
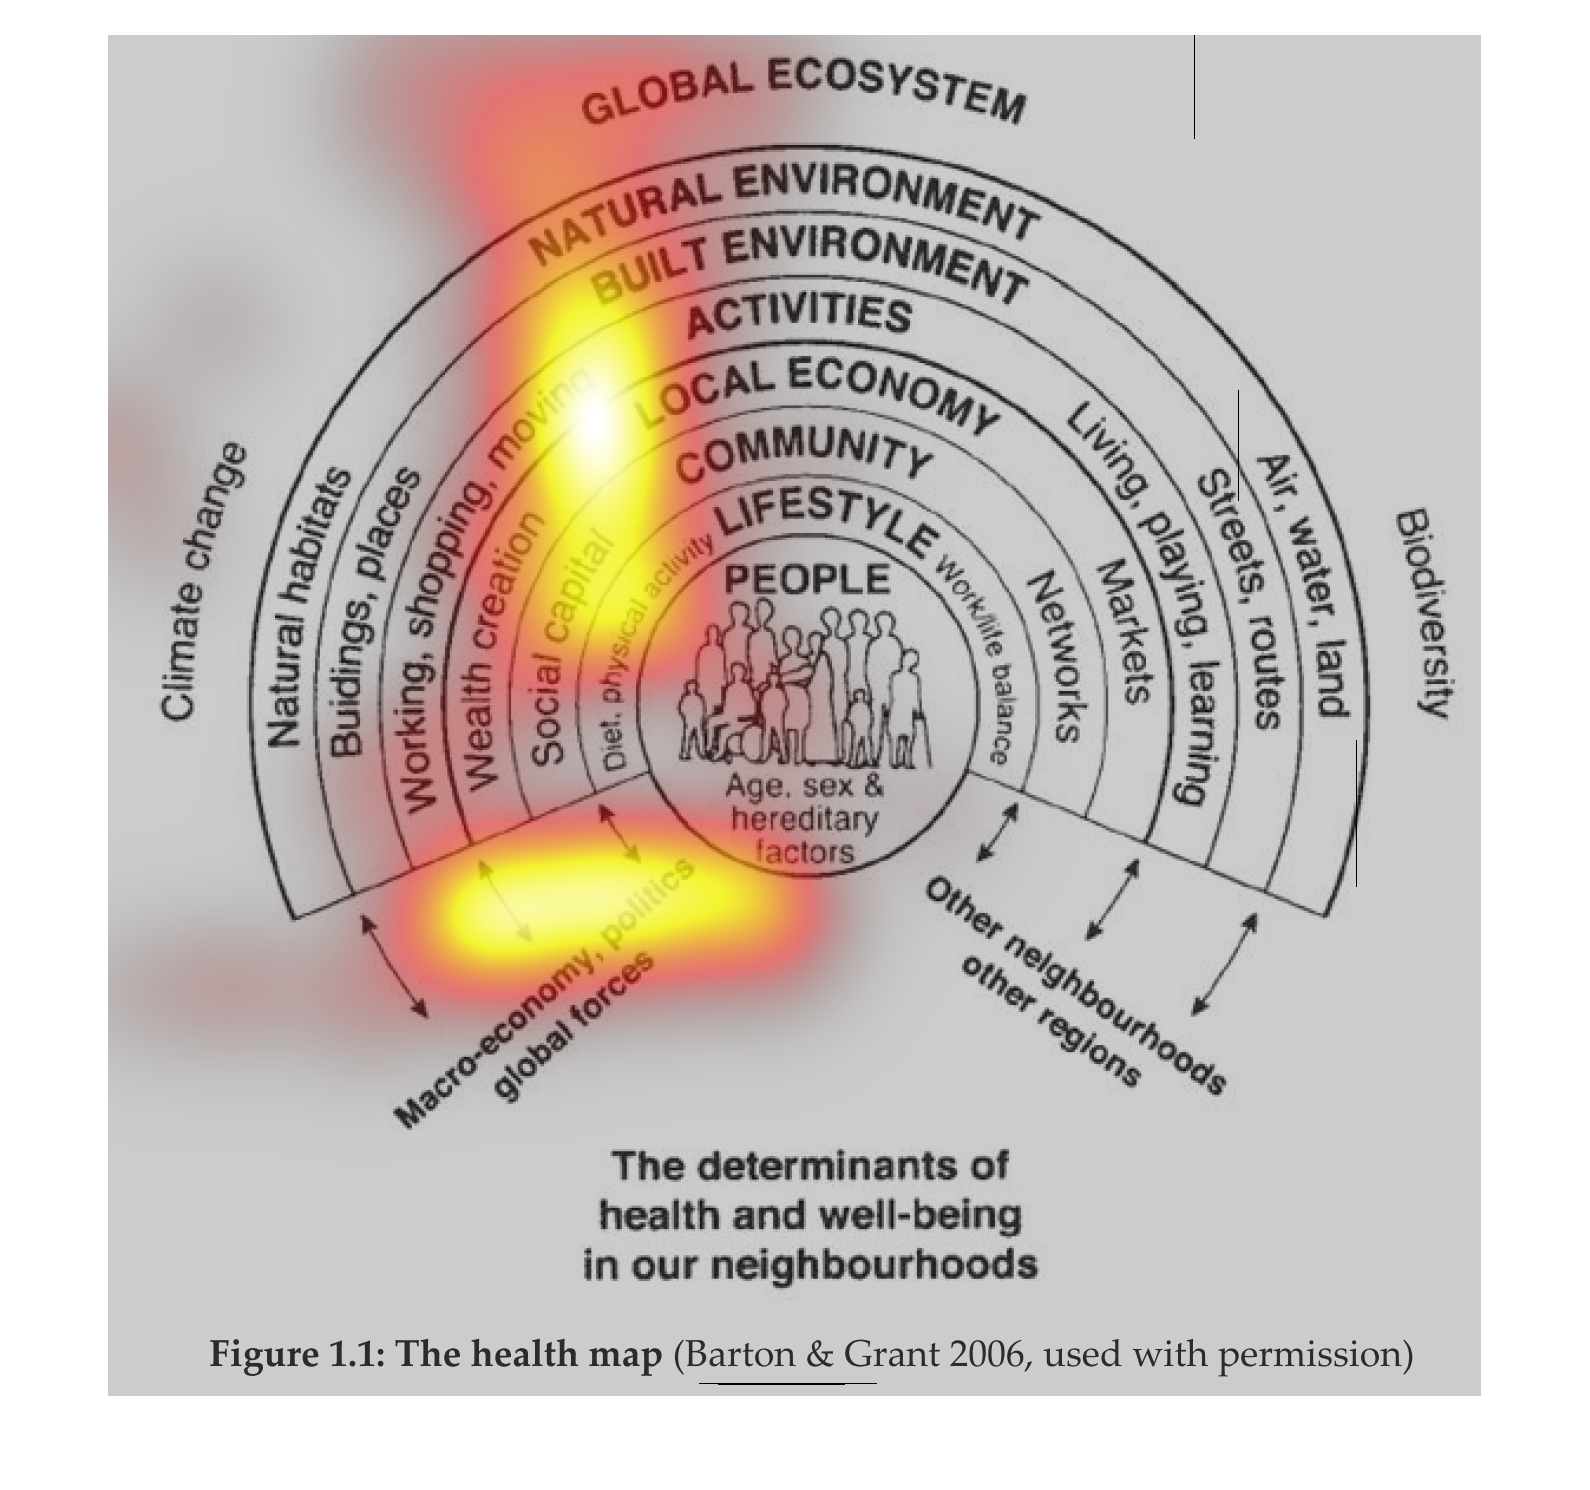
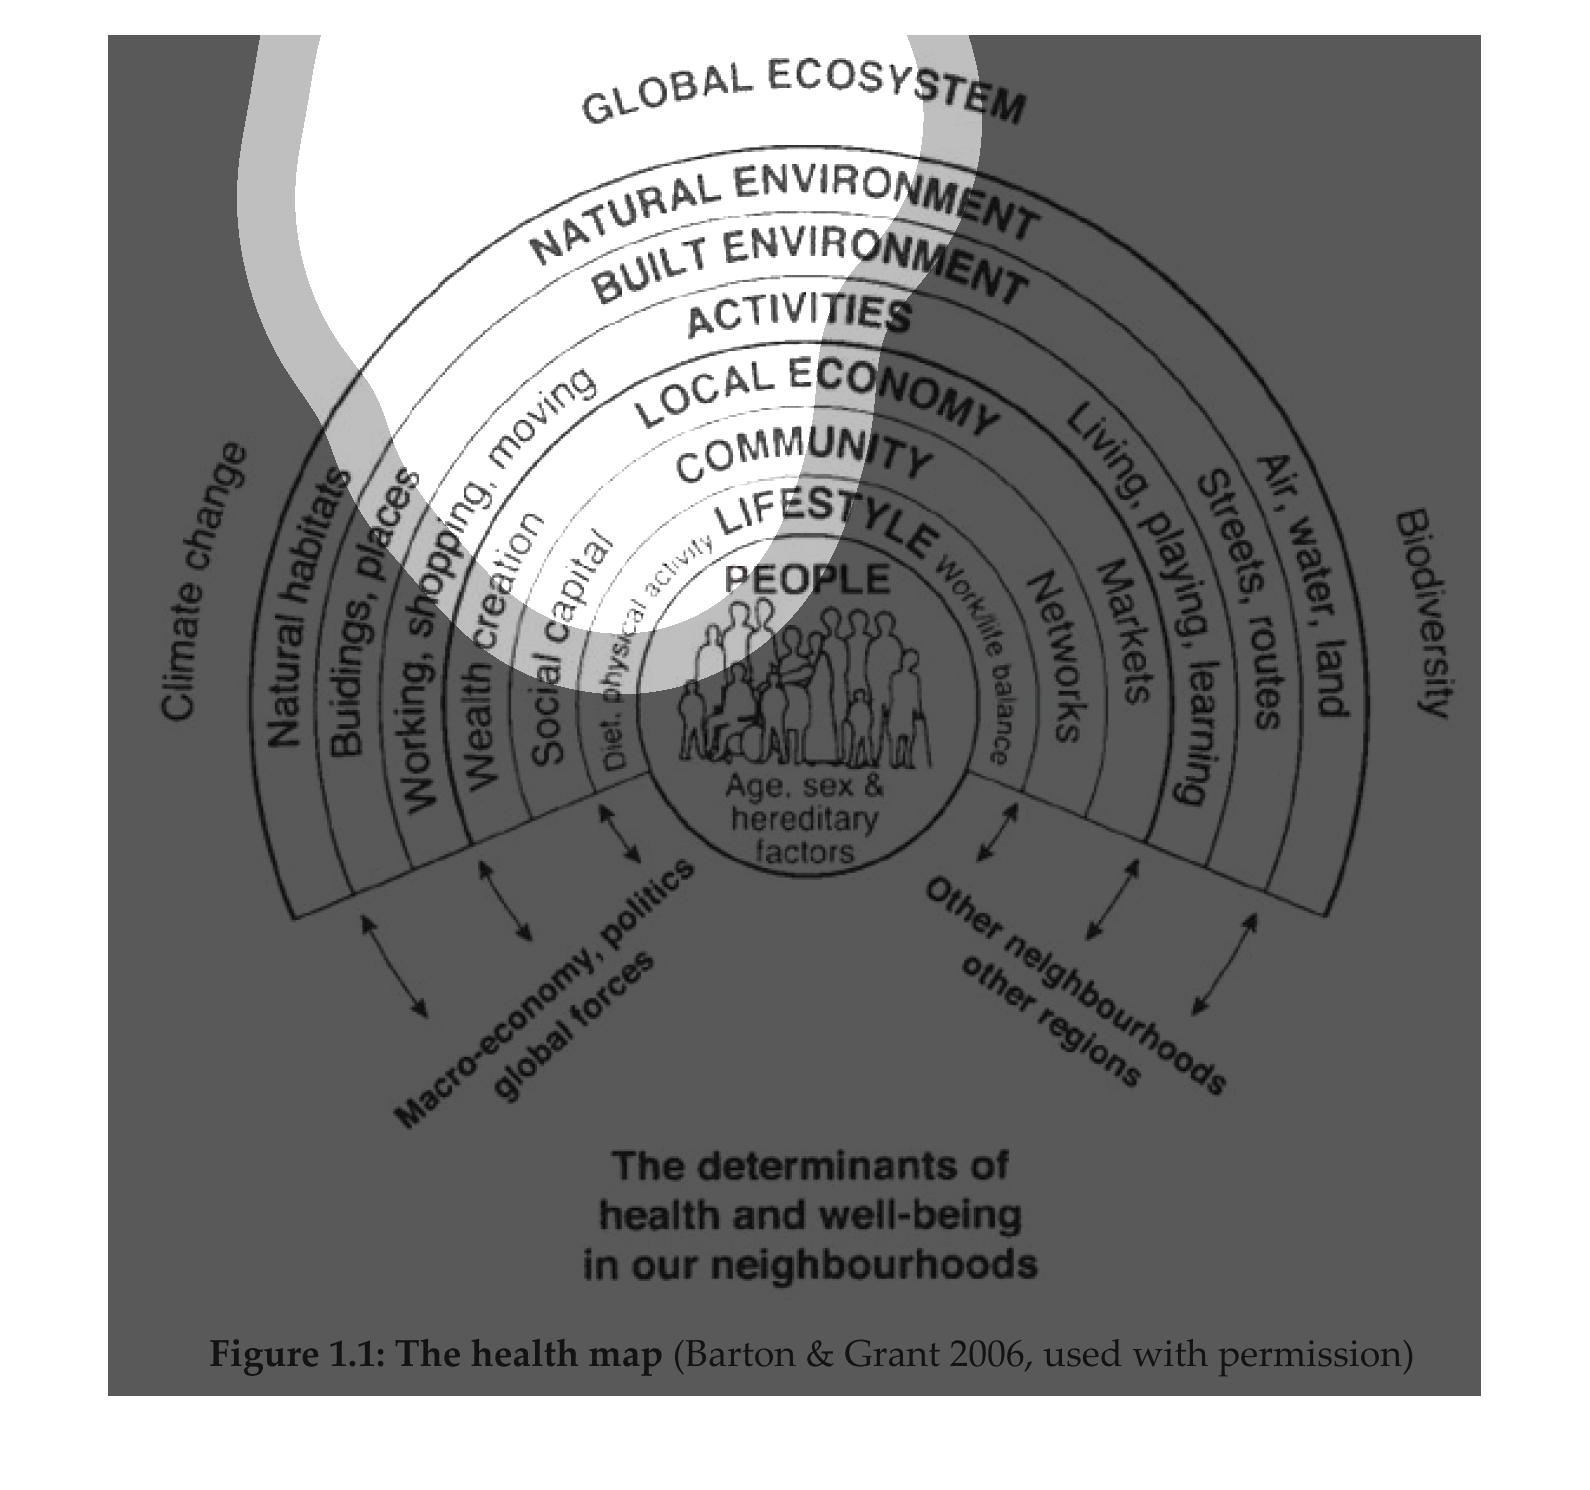
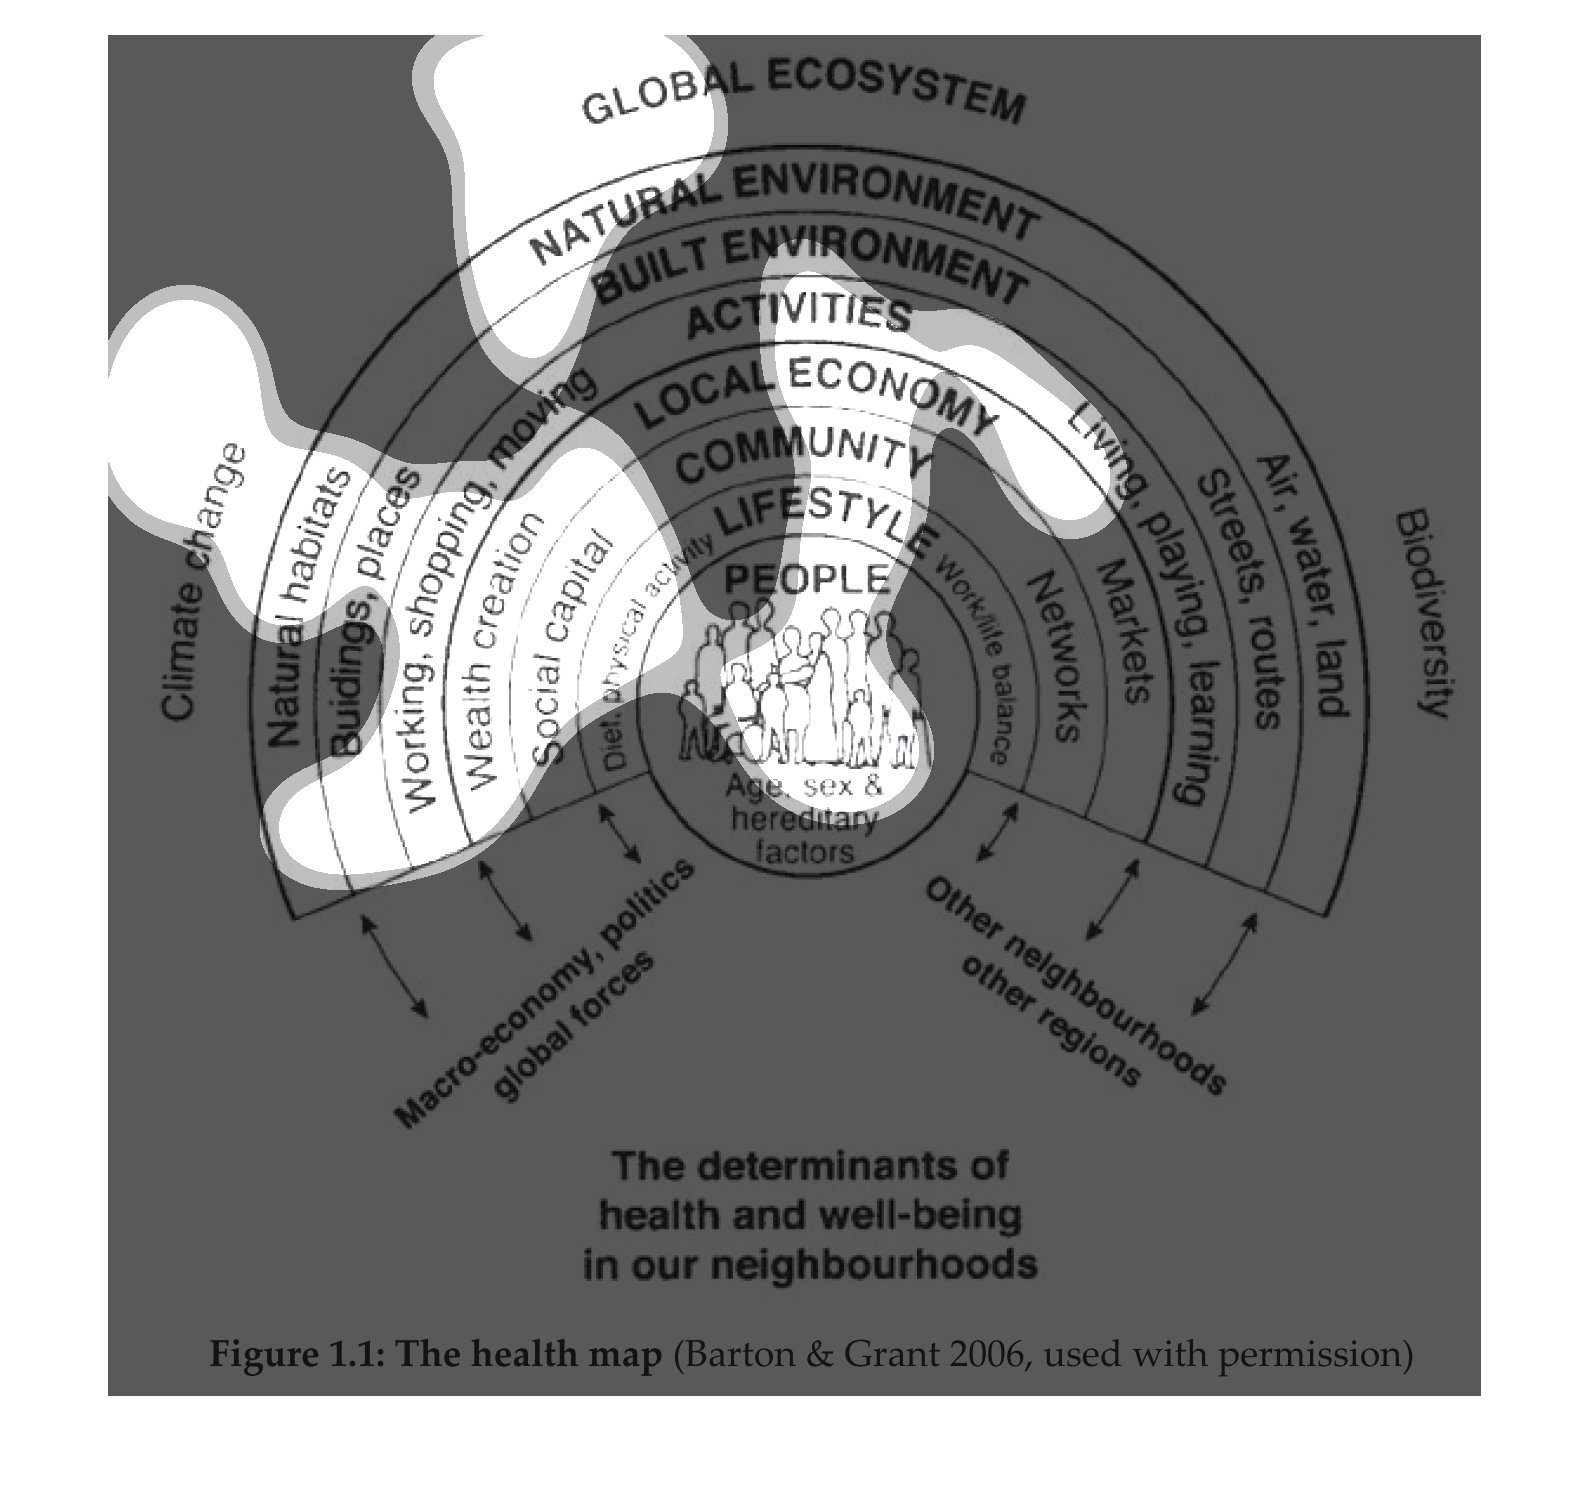
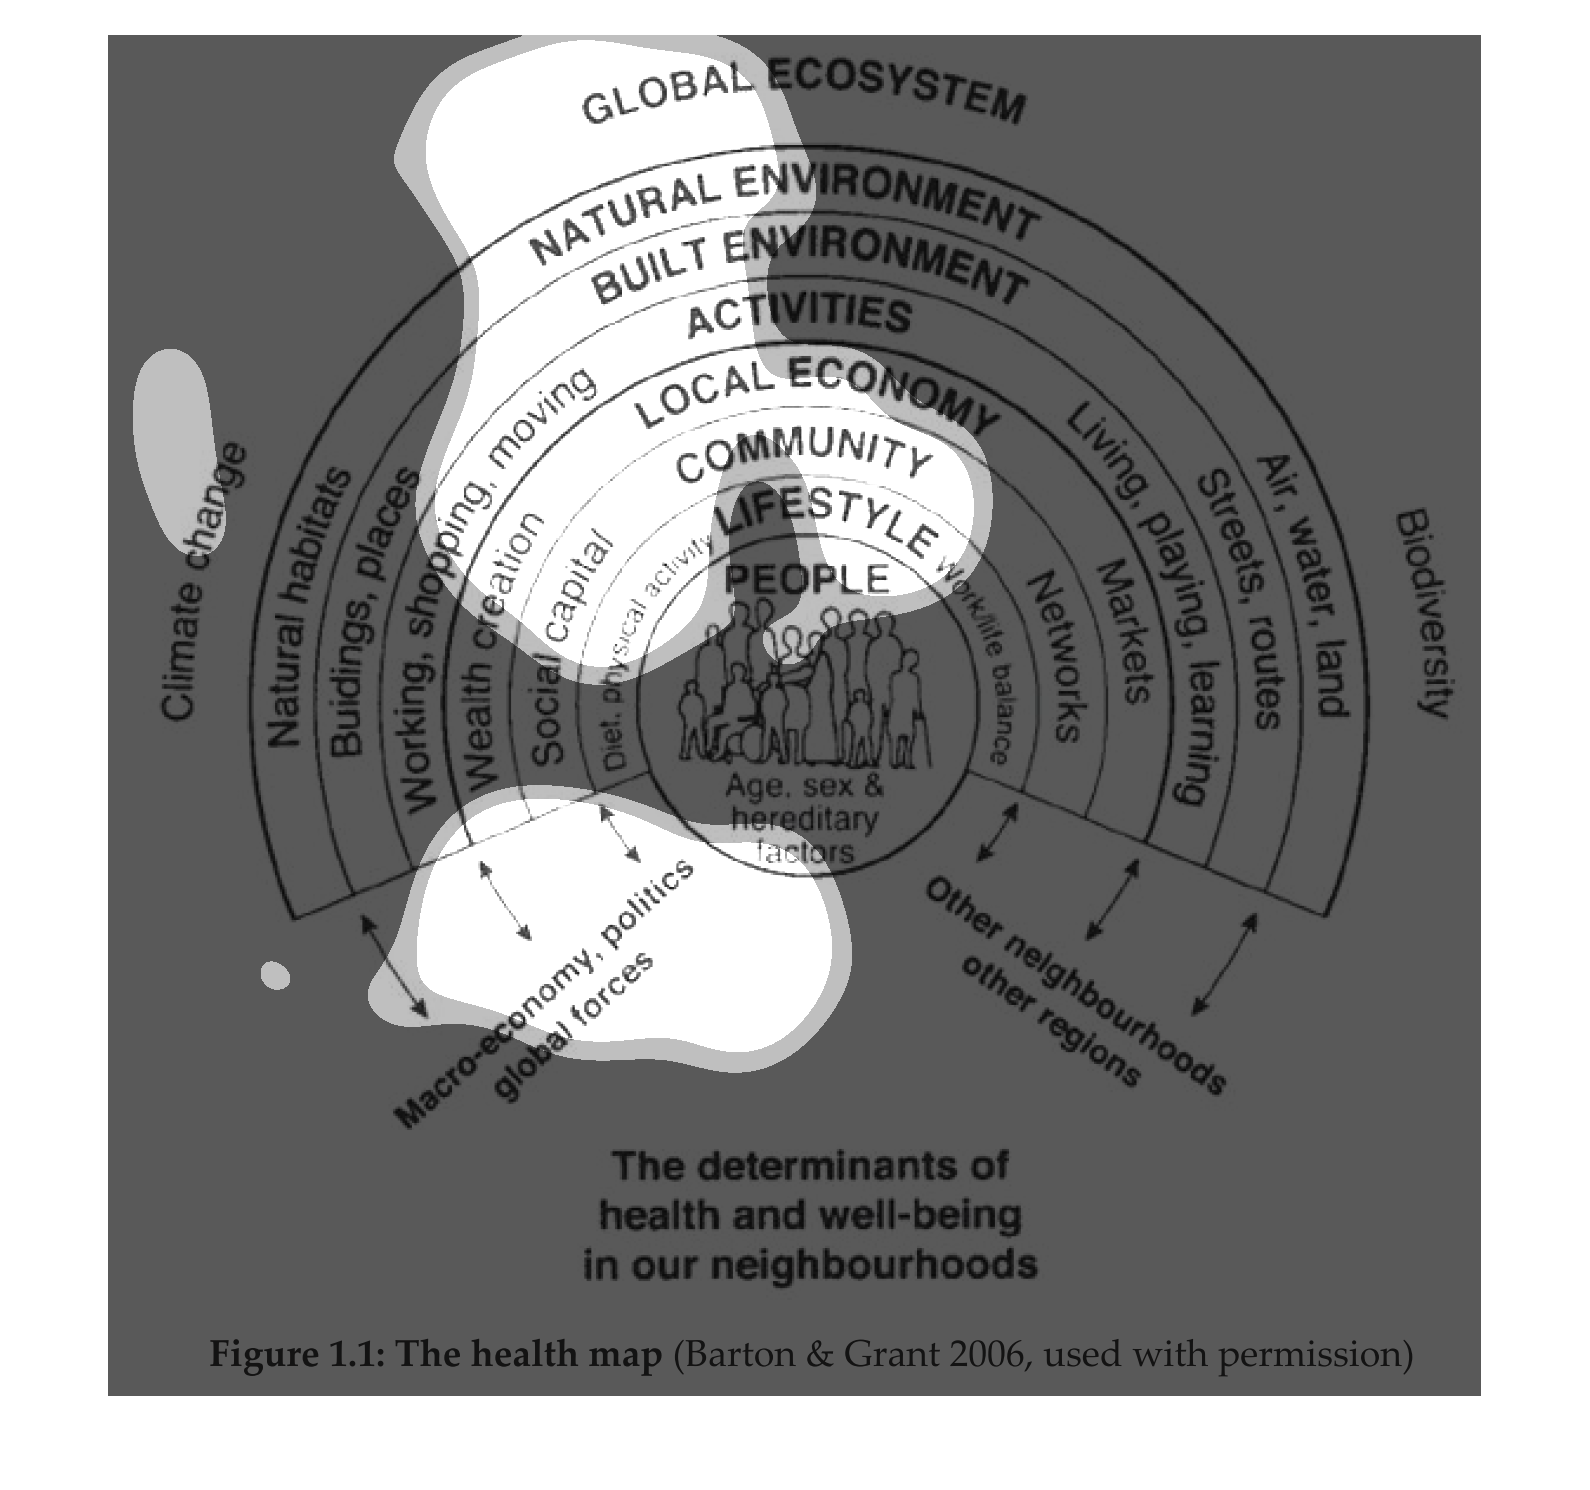
Here we see a concentric circle chart. Starting on the outside going in the categories are:
Global ecosystem, natural environment, built environment, activities, local economy, community,
lifestyle, and people are at the center. Each category has esoteric sub categories
The figure presented is titled Global ecosystem.  The figure is a representation of everything
that actually makes up what we call our Global ecosystem.
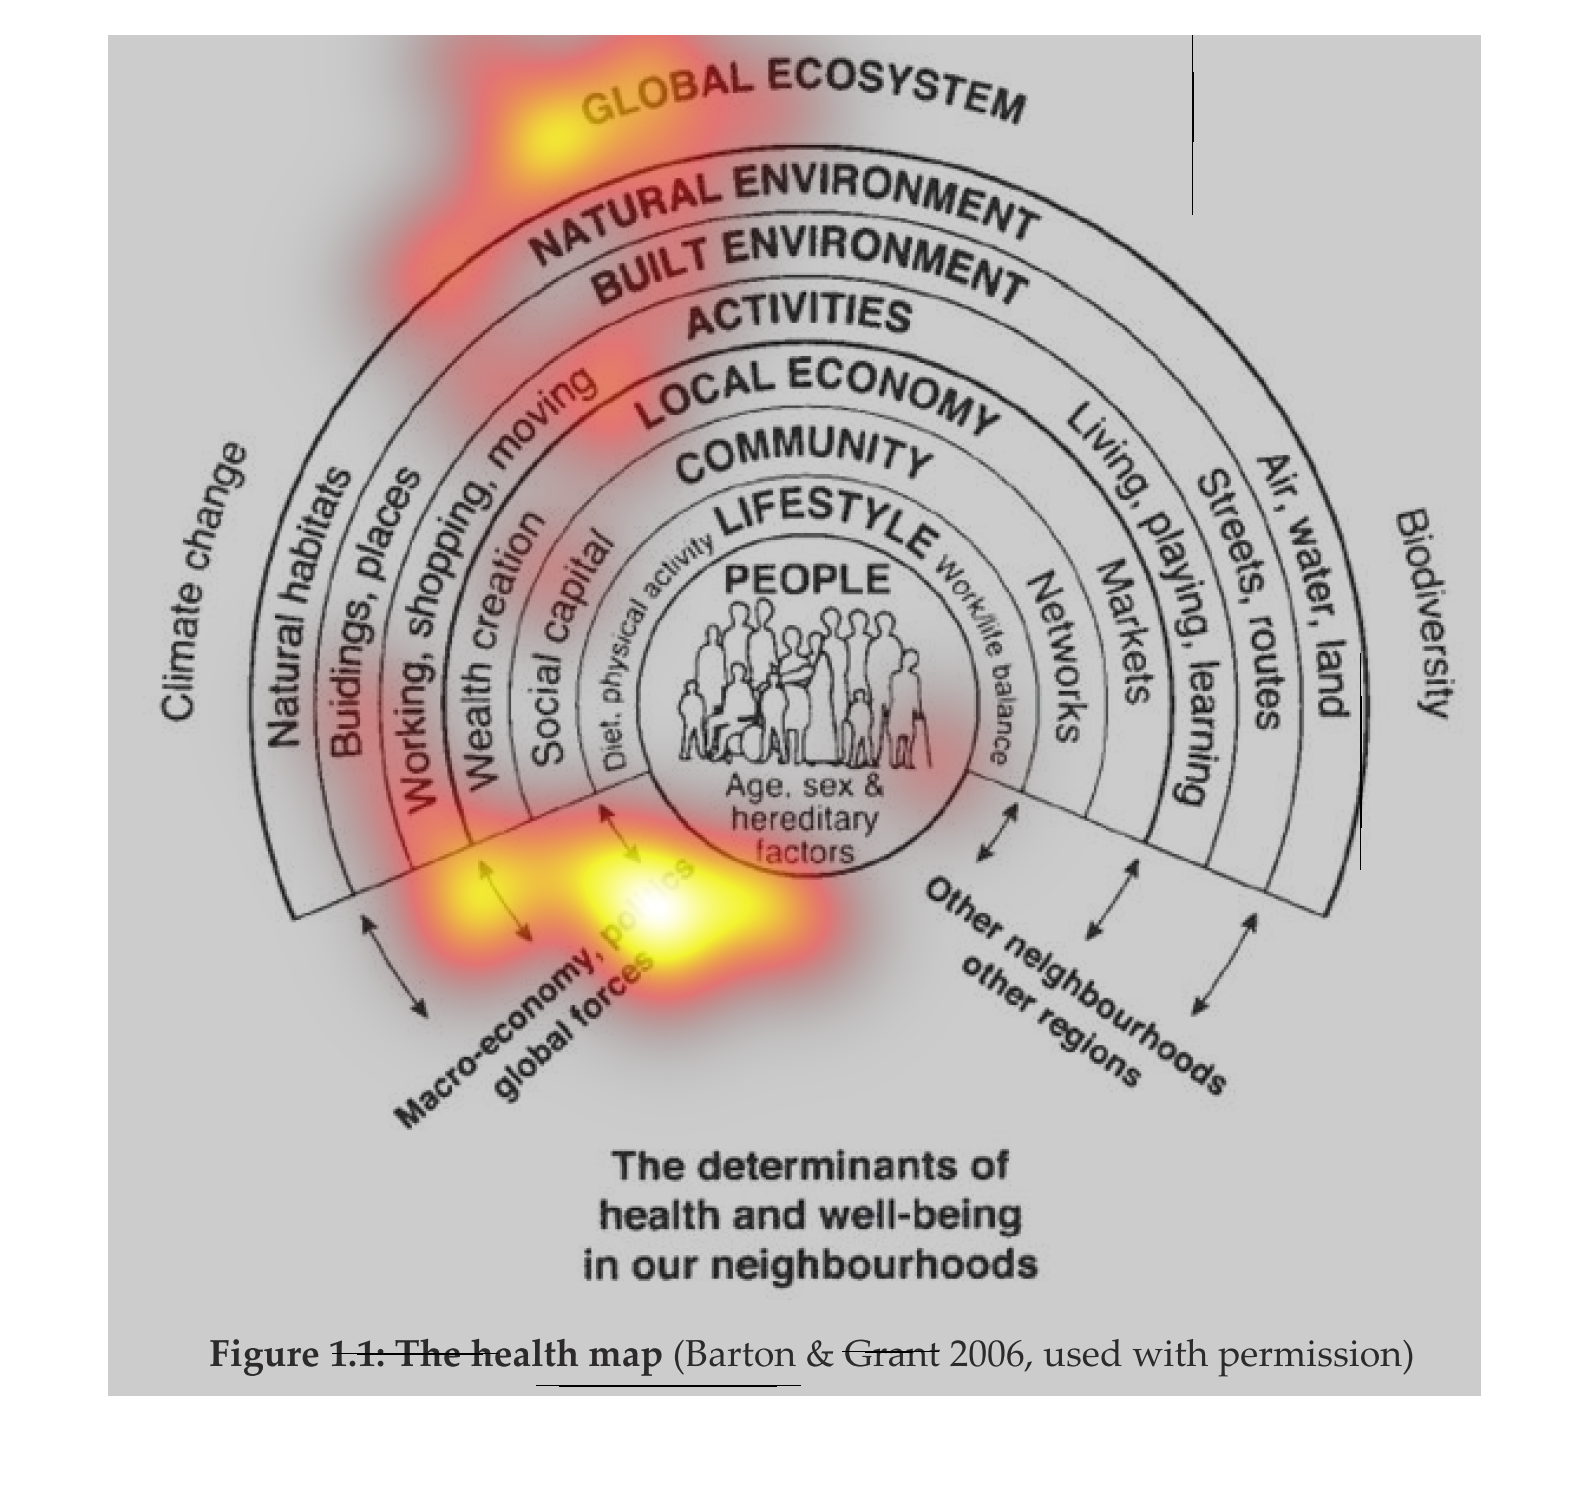
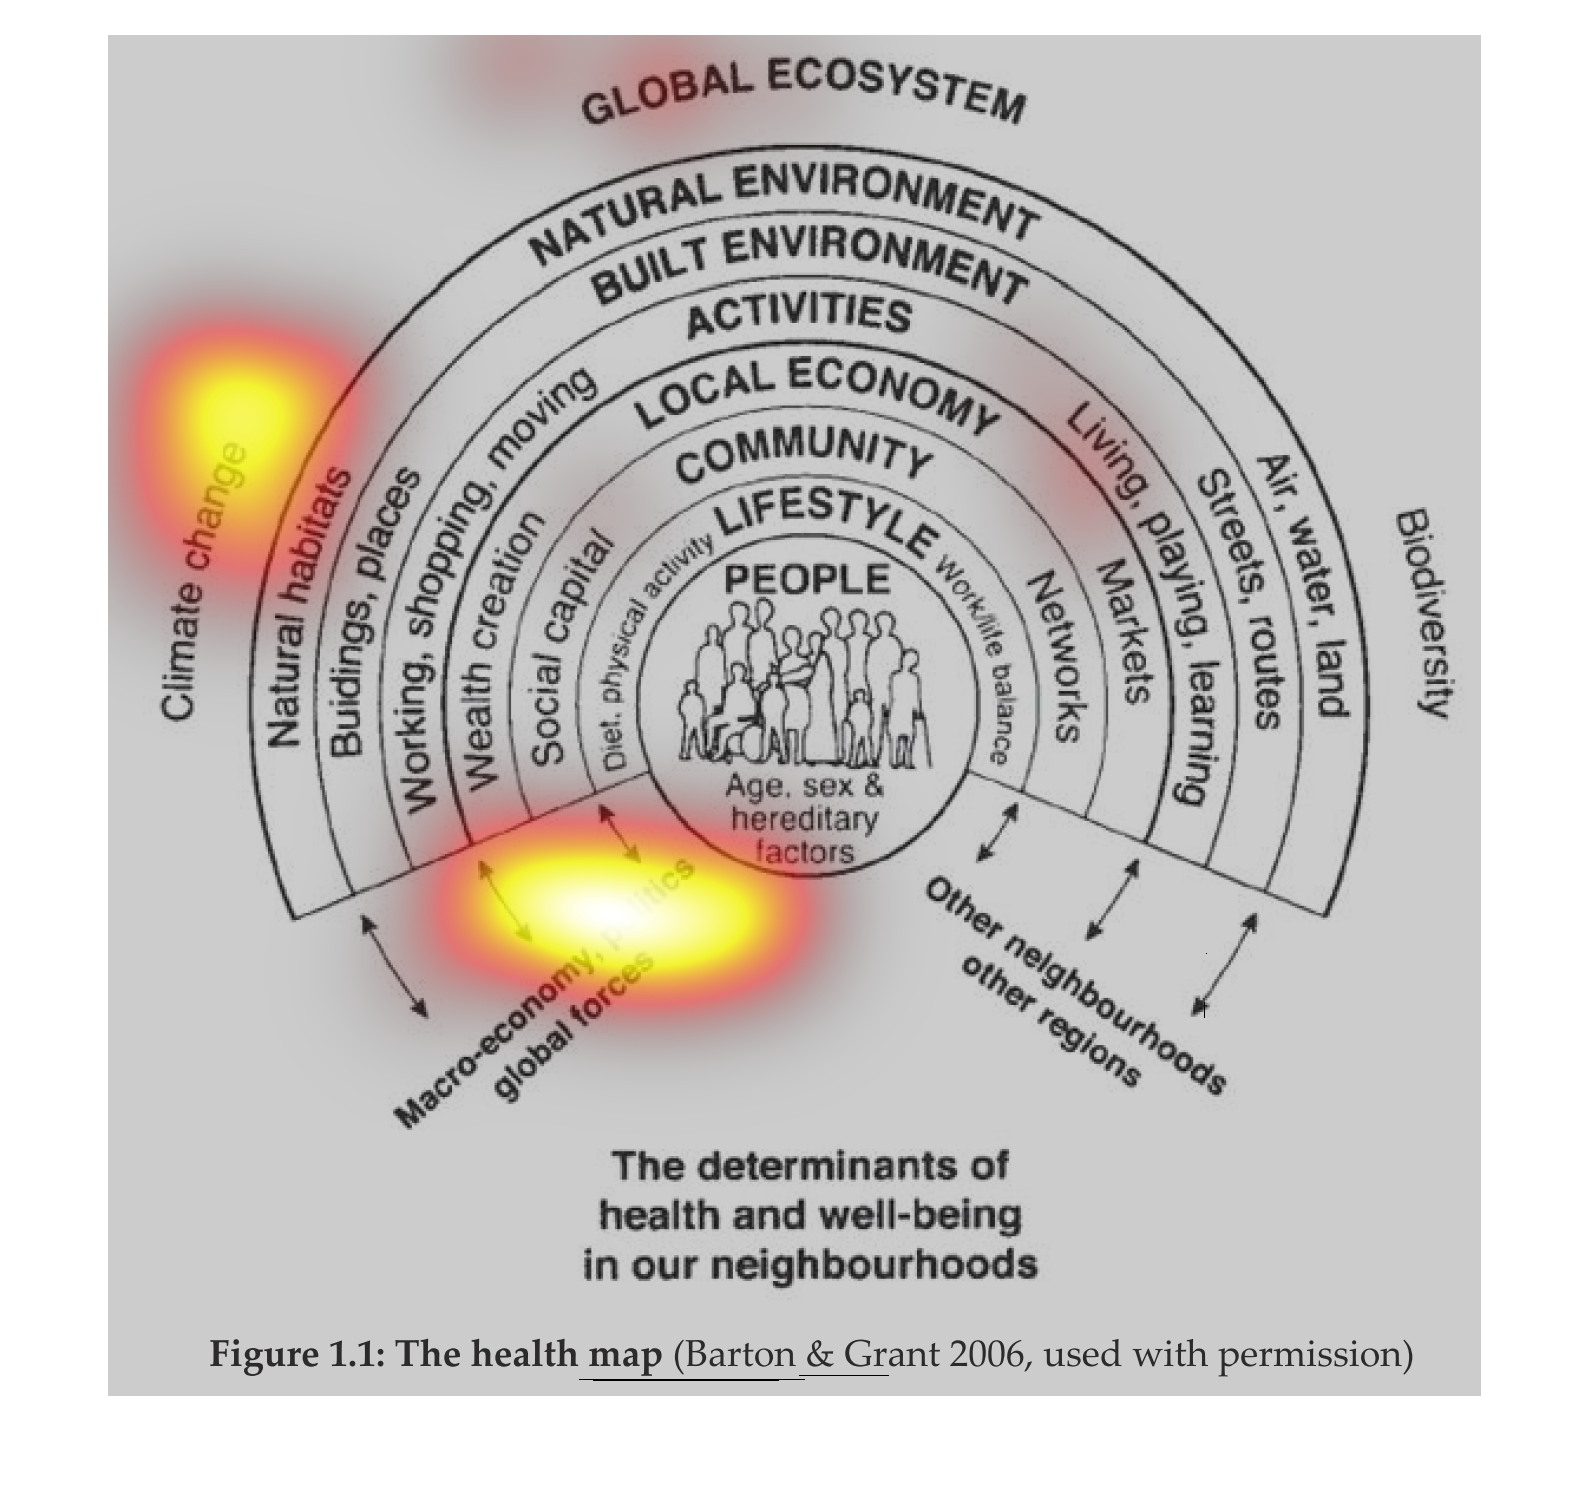
This circular infographic shows the global ecosystem. With people at the center, political
and environmental factors radiate outward in interrelated groups.
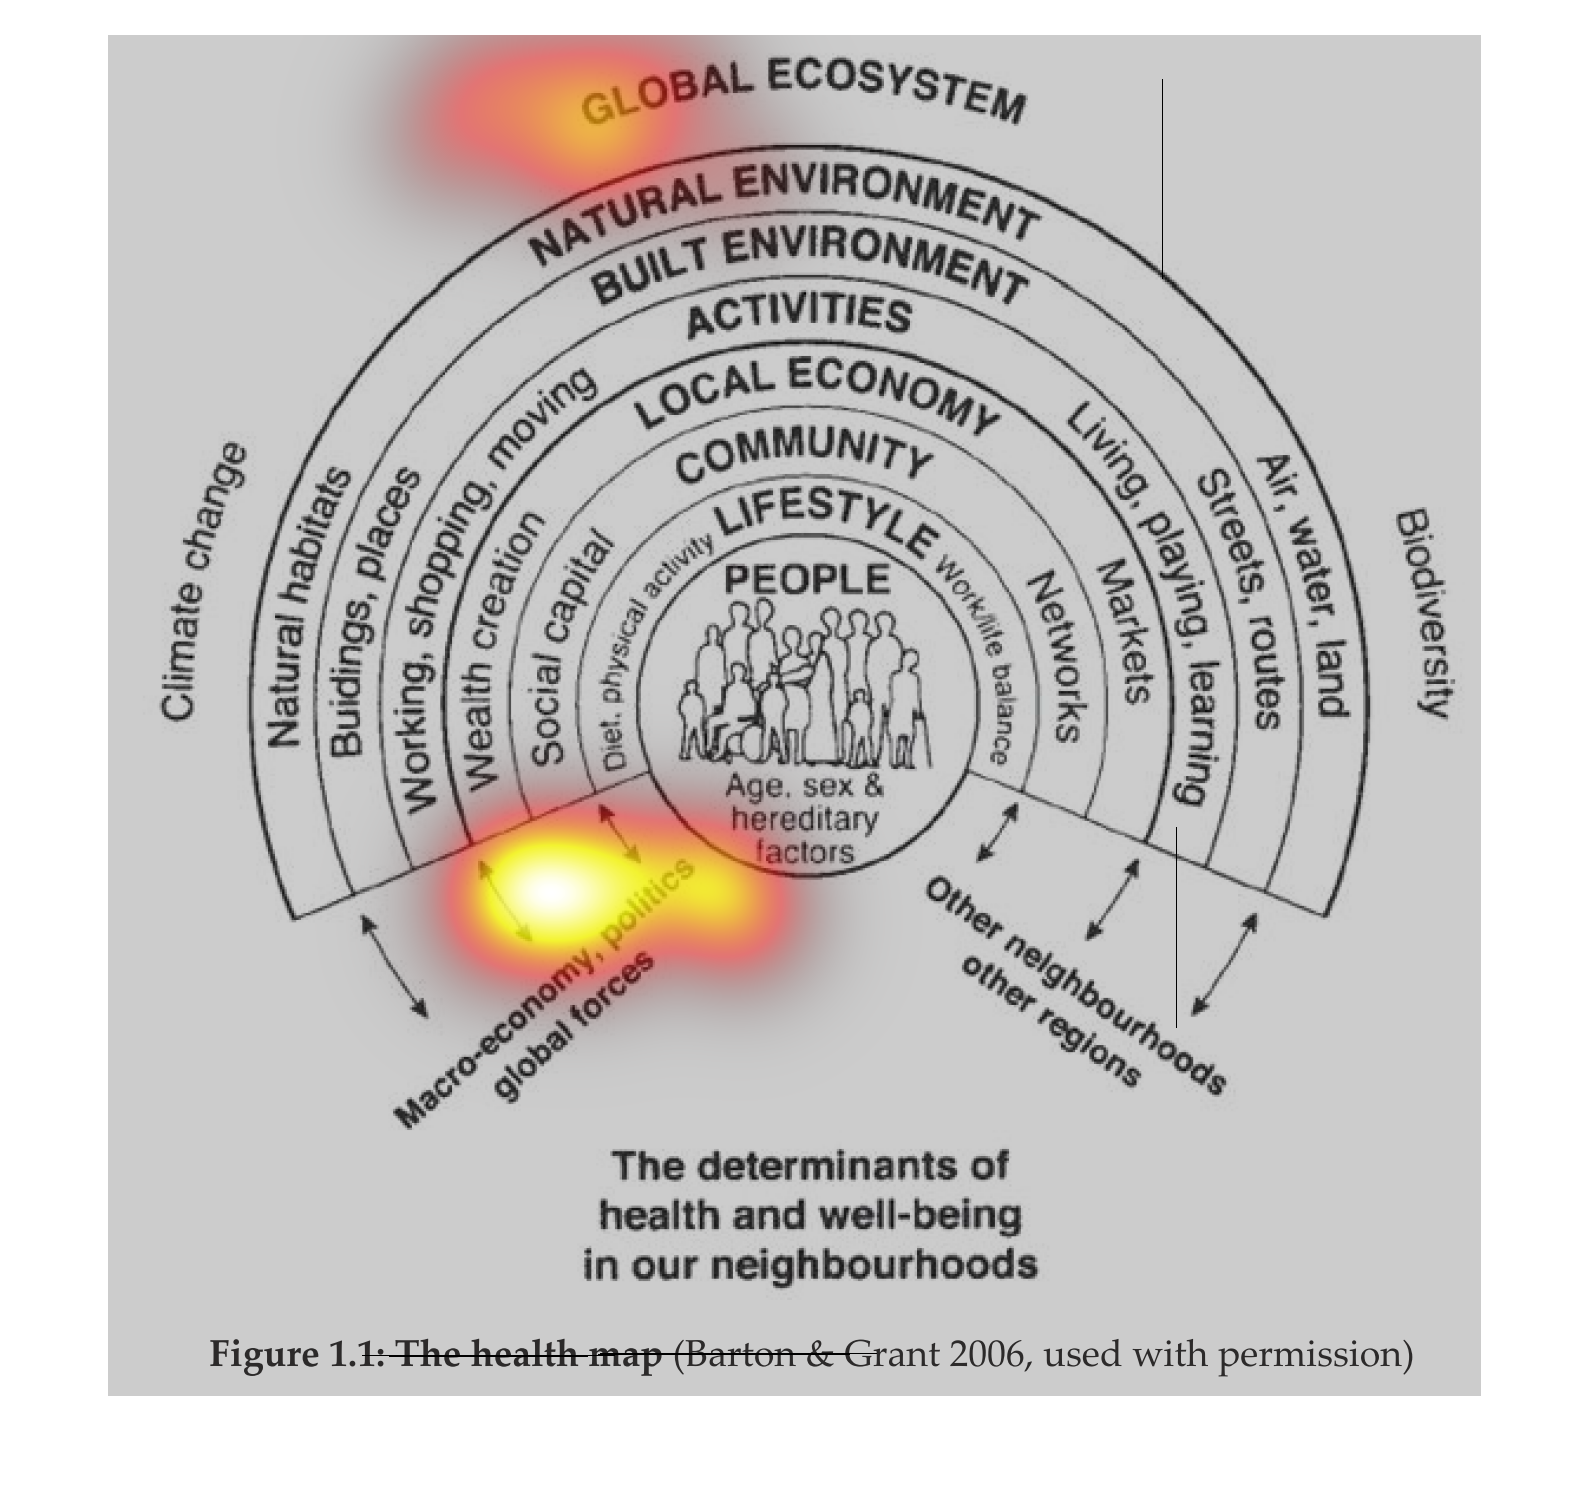
This chart describes the environmental factors that affect people, such as global ecosystem,
with one part about climate change, and one part on biodiversity. There are many sub categories.
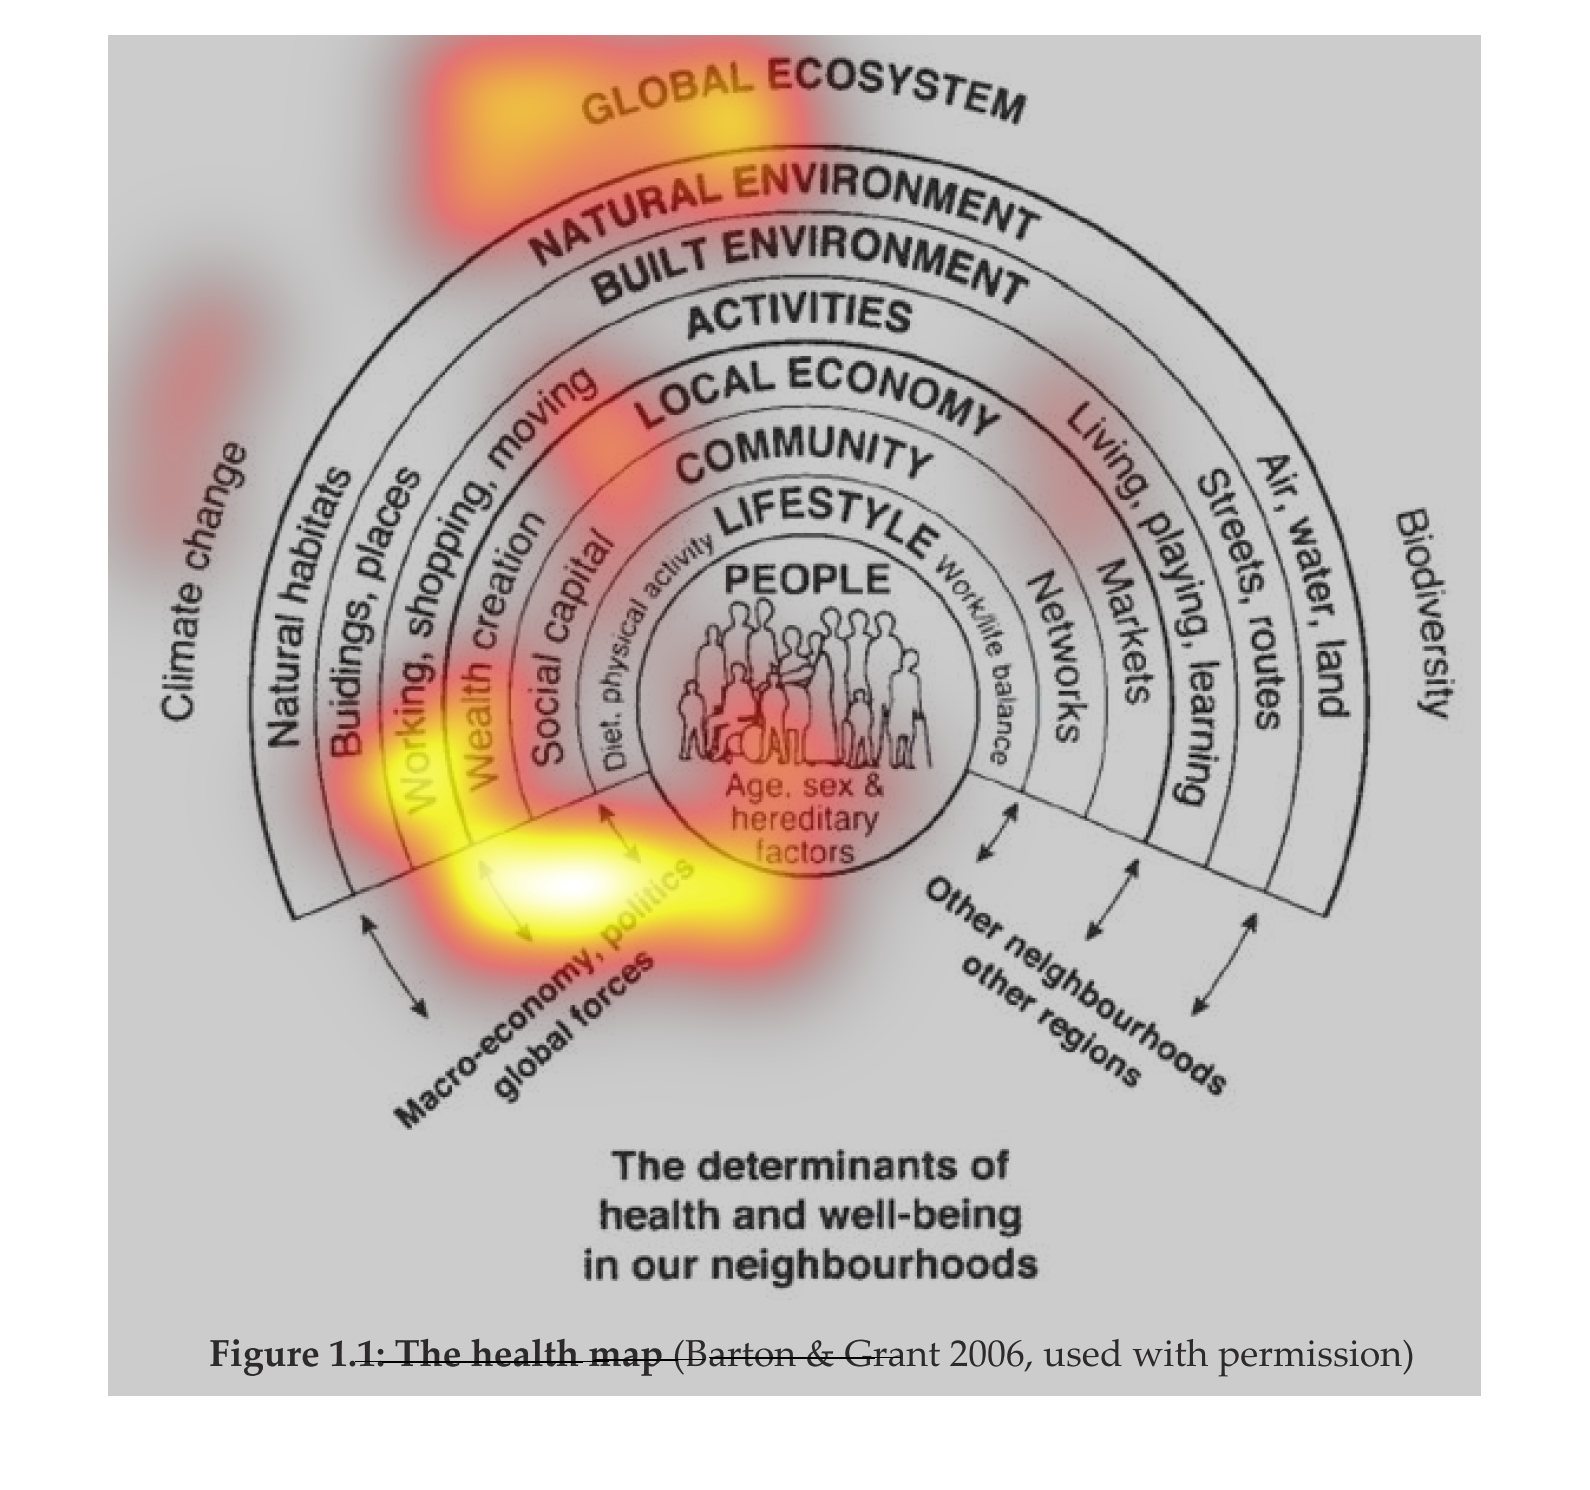
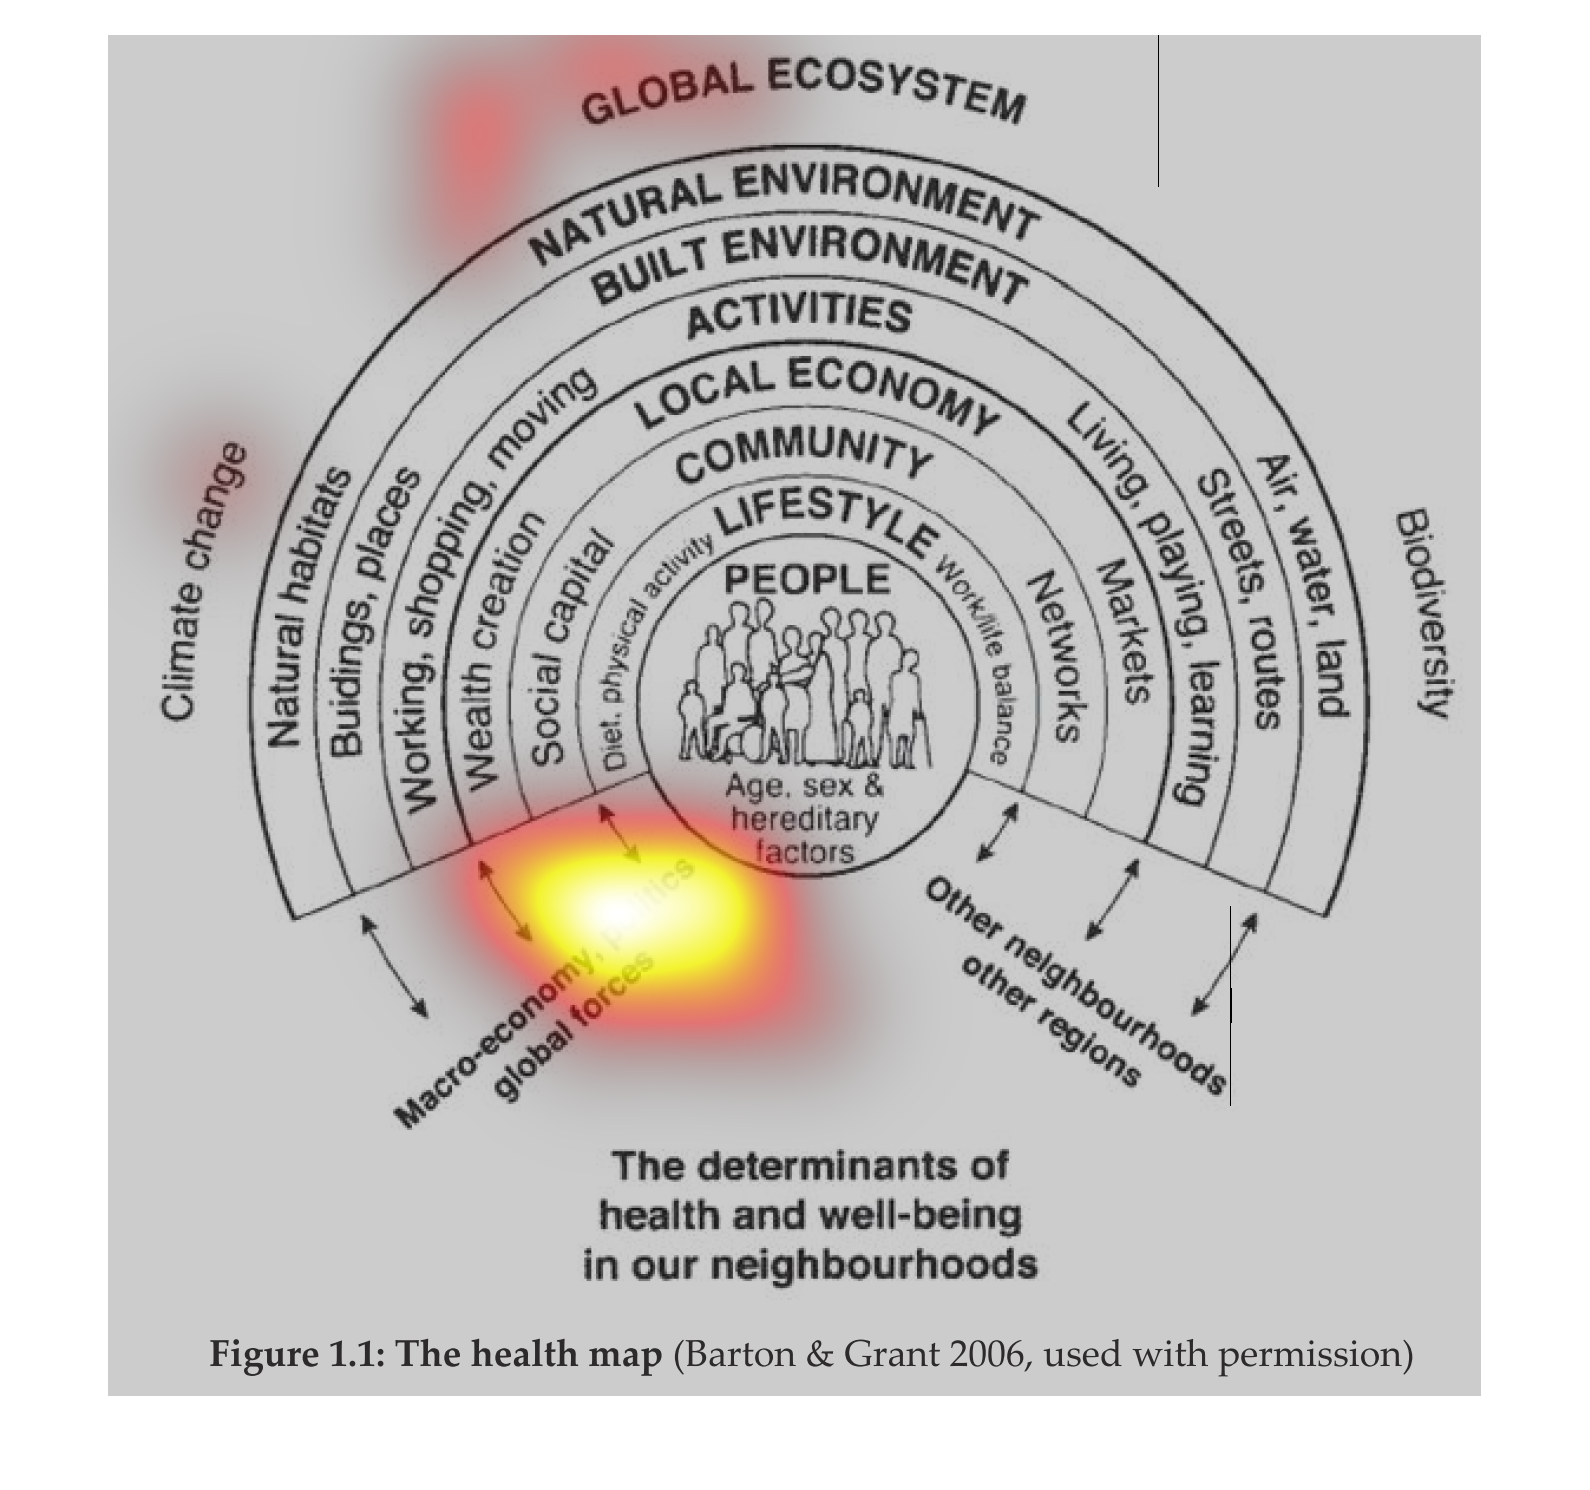
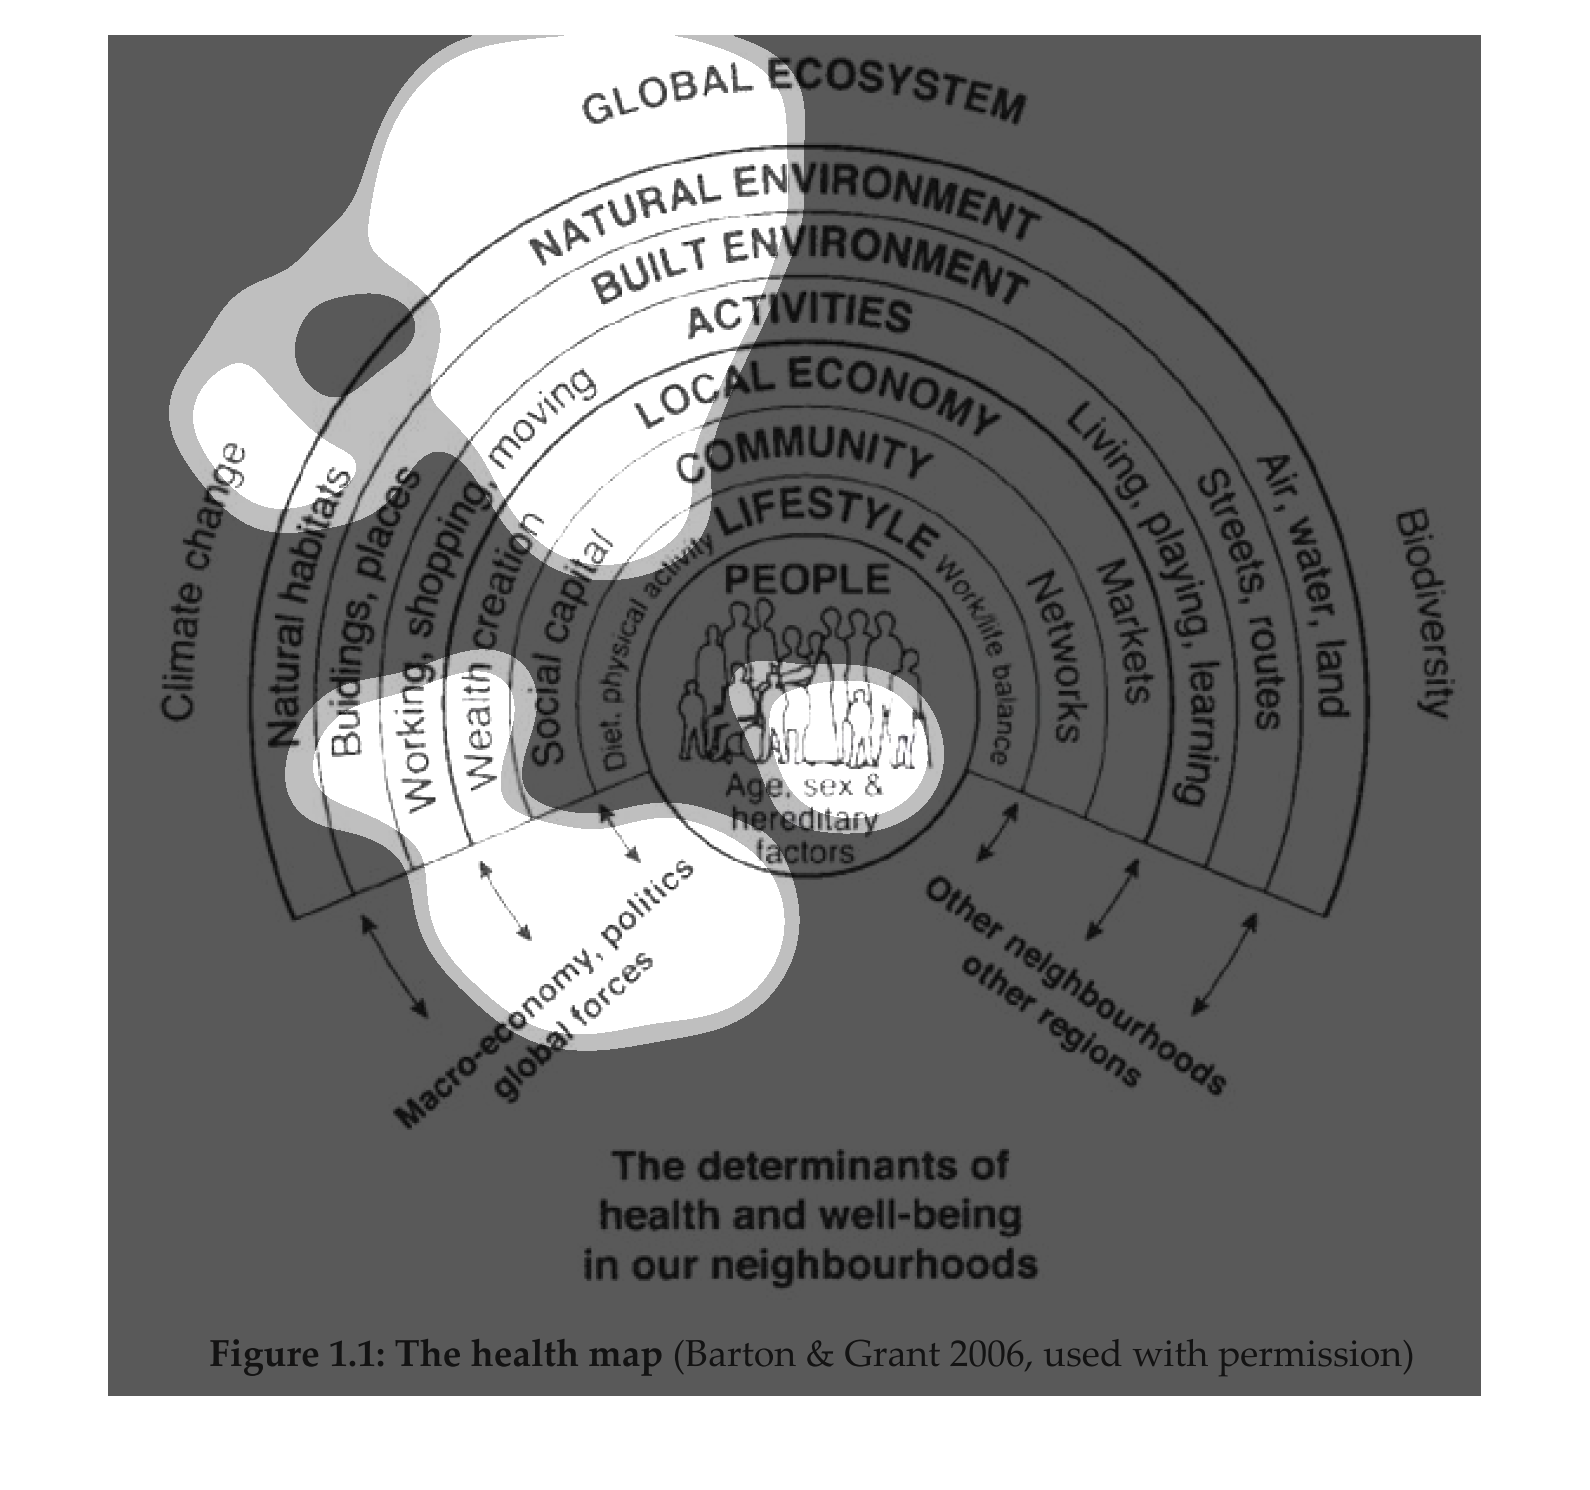
This graphic shows a breakdown of the global ecosystem as a determinant of health and well
being in neighborhoods. At the center are the people of various sexes, ages, and origins.
Flowing out from that is the lifestyle, community, and local economy of these people and the
area. Further out are activities and the natural and man-made environment. All of these contribute
and work together to make a community.
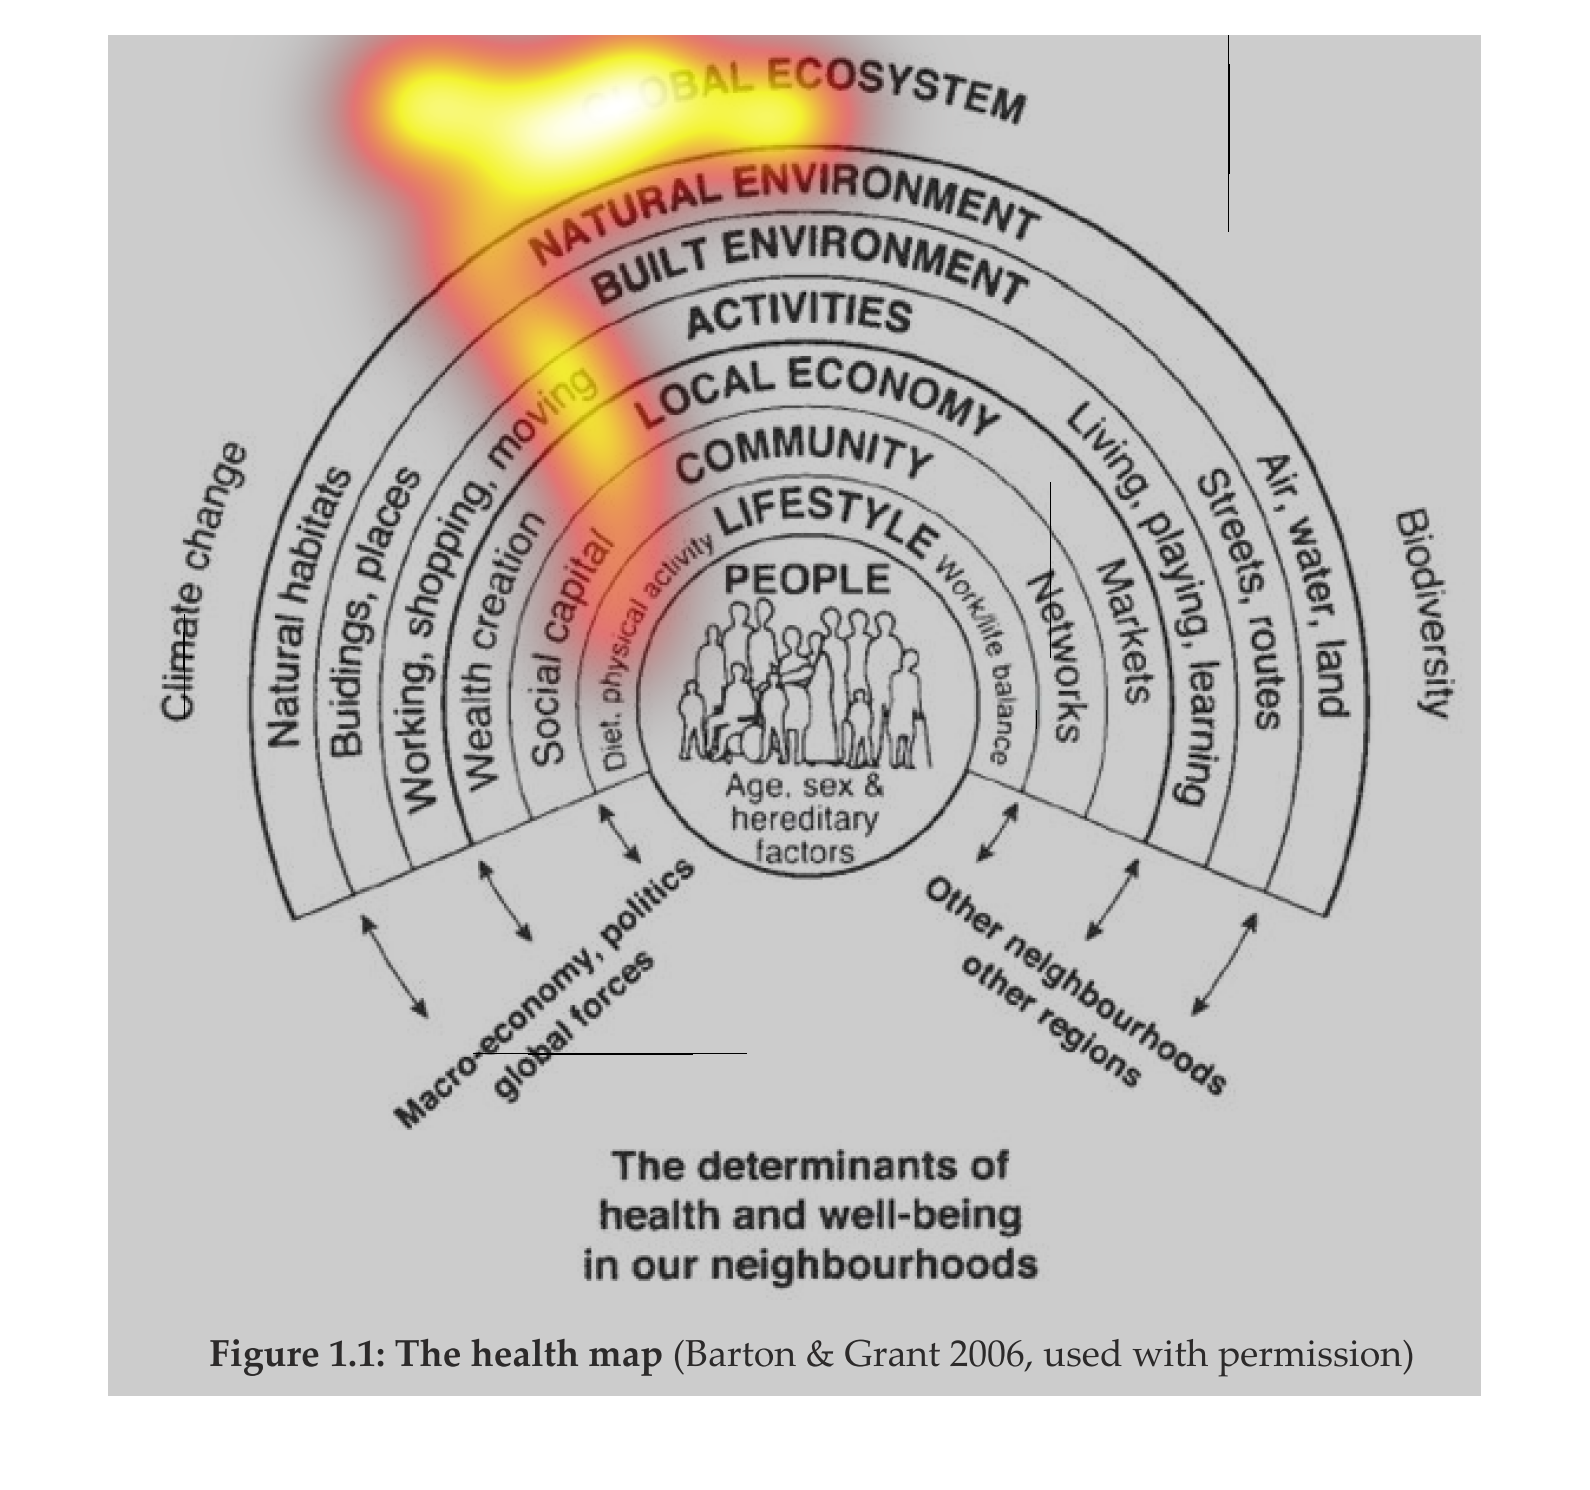
This graph illustrates the determinants of health and well being in our neighbourhoods.  age,
sex, ad hereditary factors are in the middle of the chart.
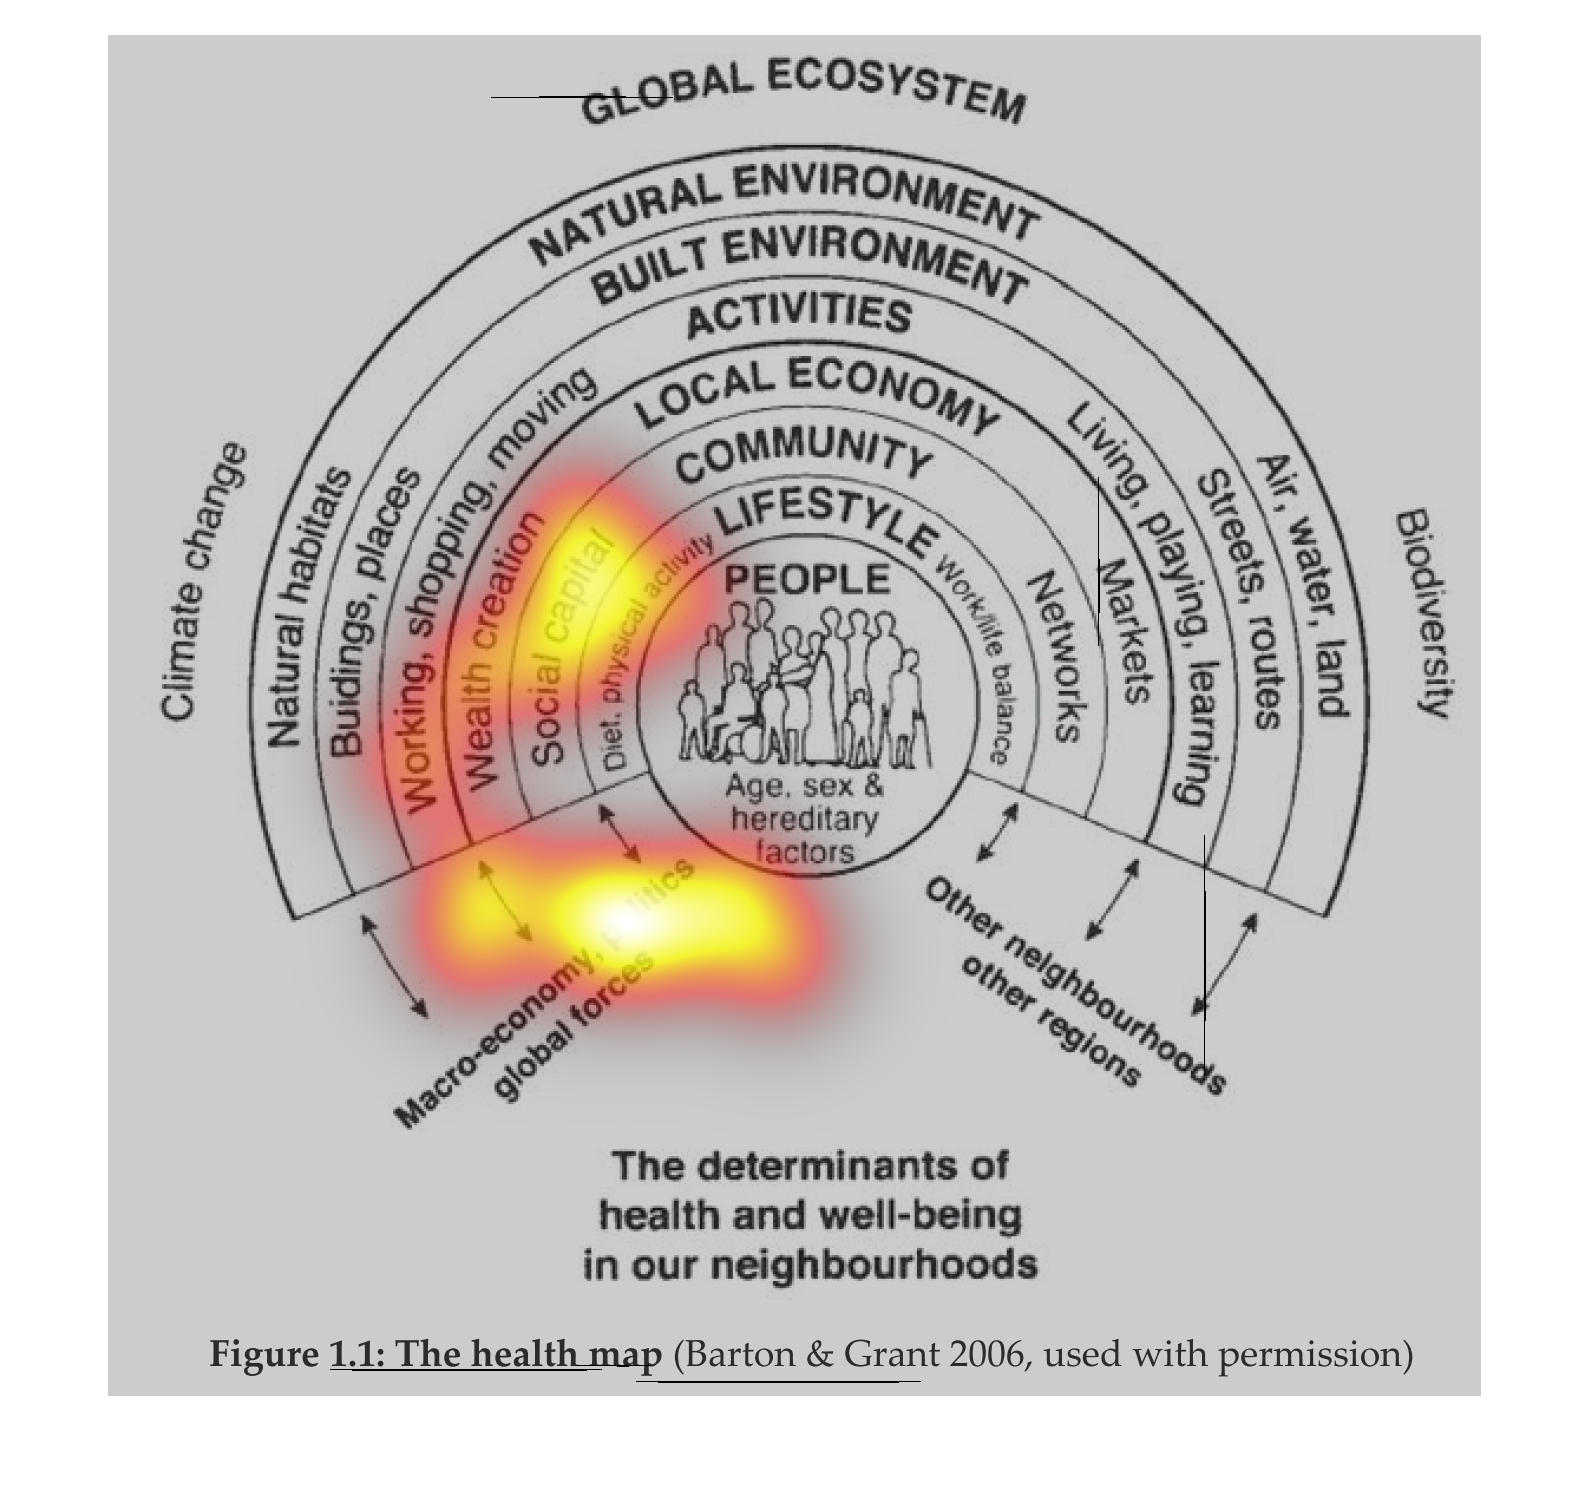
The remnants of health and wellbeing in our neighborhoods. People are the center of our neighborhoods
and are required for a healthy neighborhood. Each neighborhood has a local economy which creates
a community which creates a lifestyle.