This chart describes distribution of most consumed alcohol beverages, in liters of pure alcohol,
for the year 2005. Different categories are represented by different colors.
Beer is the most alcoholic beverage consumed in all the world, according to this illustration.
They then go into detail about other drinks, like wine, rum, whiskey, vodka etc.
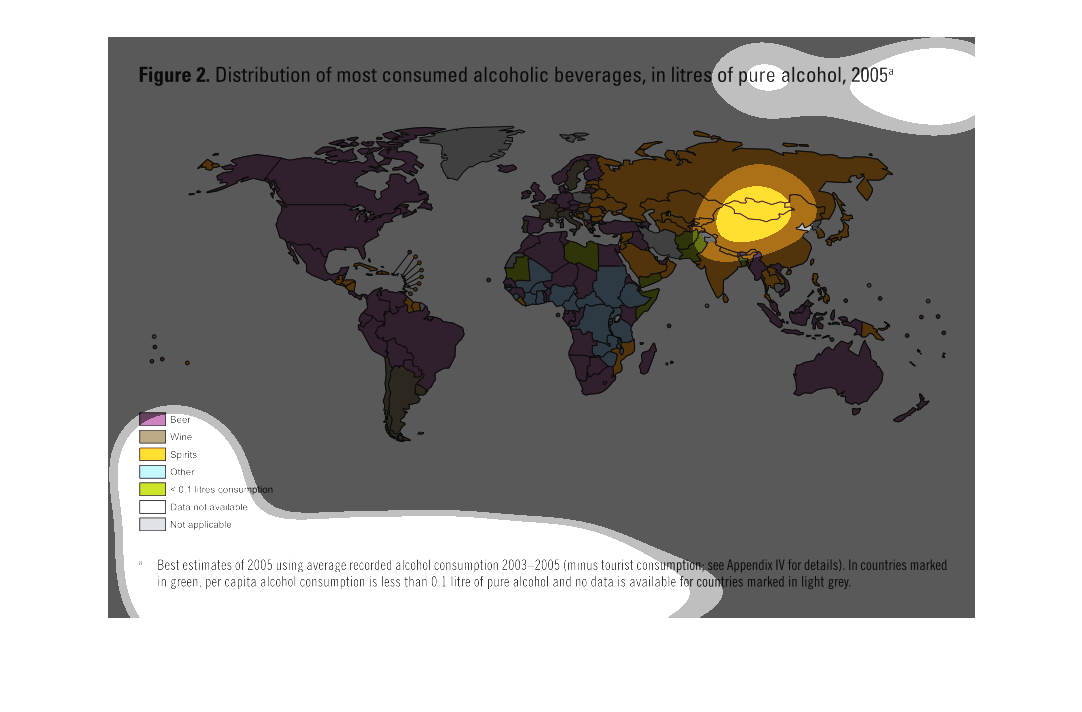
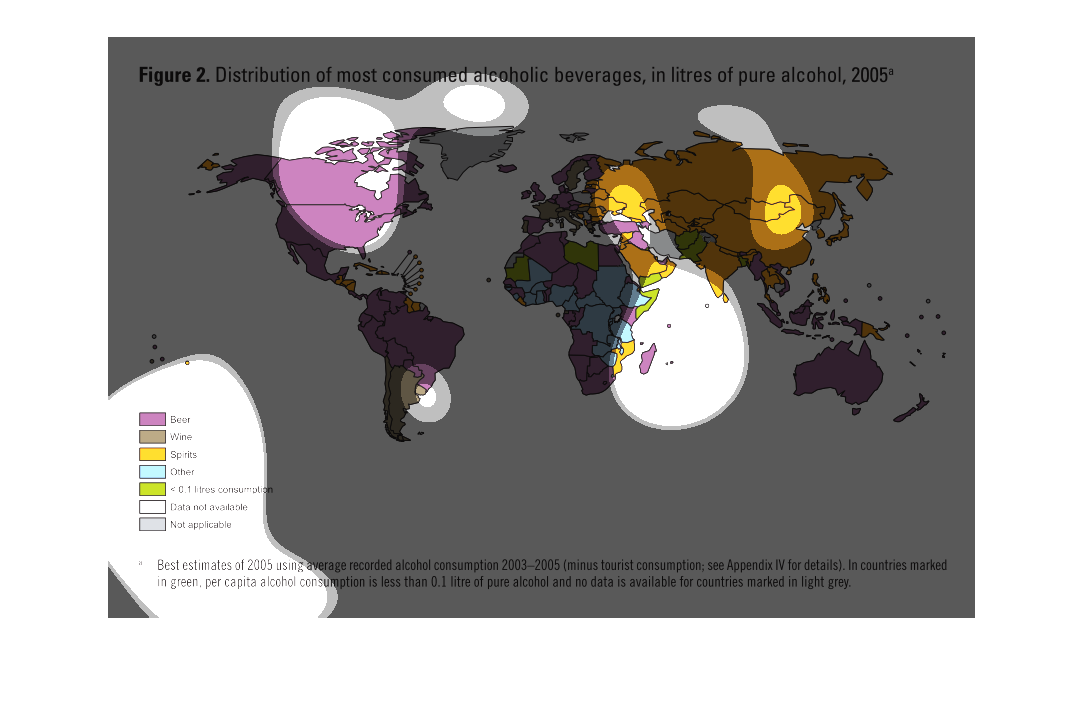
This chart depicts distribution of most consumed alcoholic beverages, in liters of pure alcohol
in the year 2005. We can see that North and South America distributed mostly beer, while in
a few countries in the America's, spirits were the most distributed. Asia and Russia had more
spirits, while Africa, Australia, and Europe mainly had beer. Some countries in Africa seemed
to prefer other alcoholic drinks.
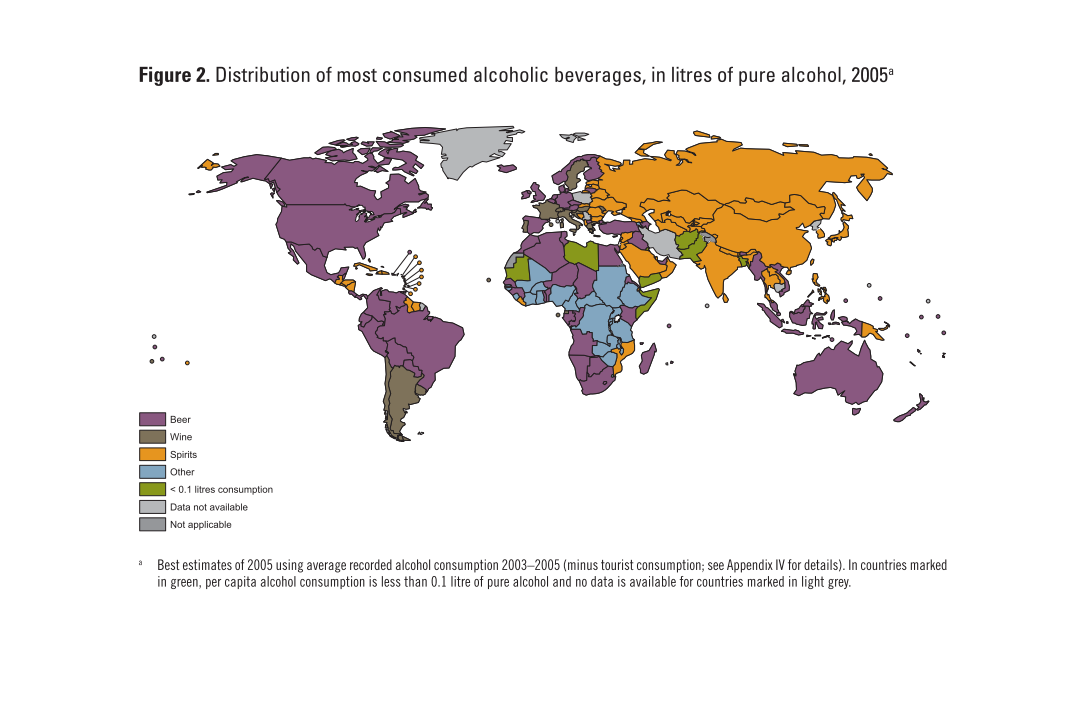
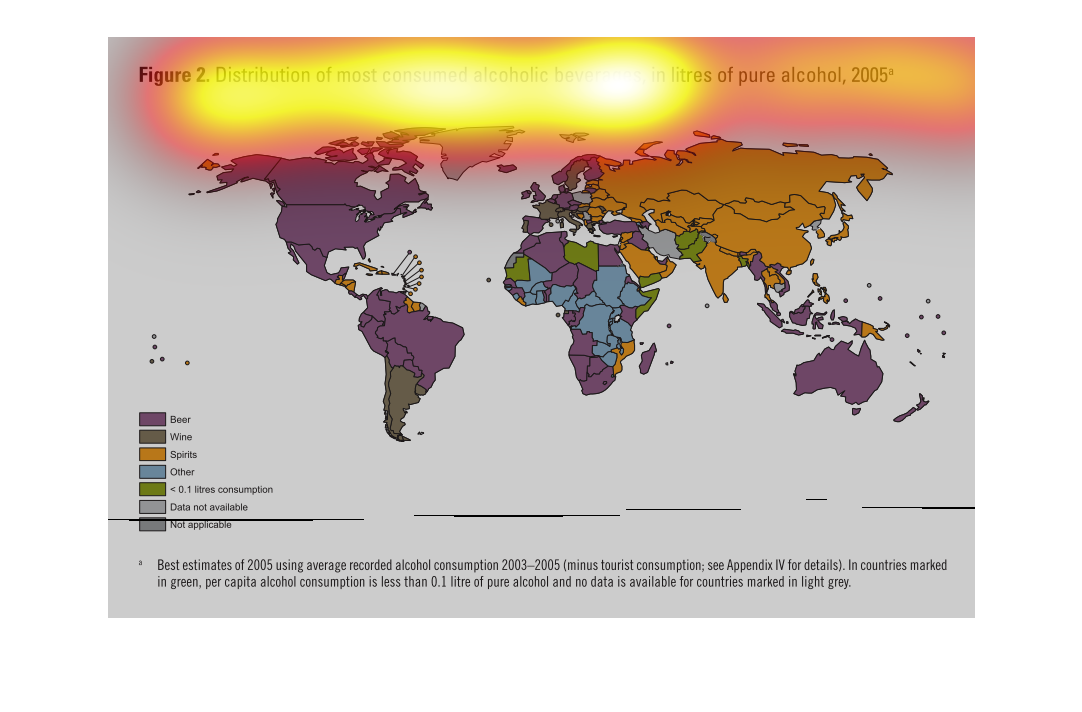
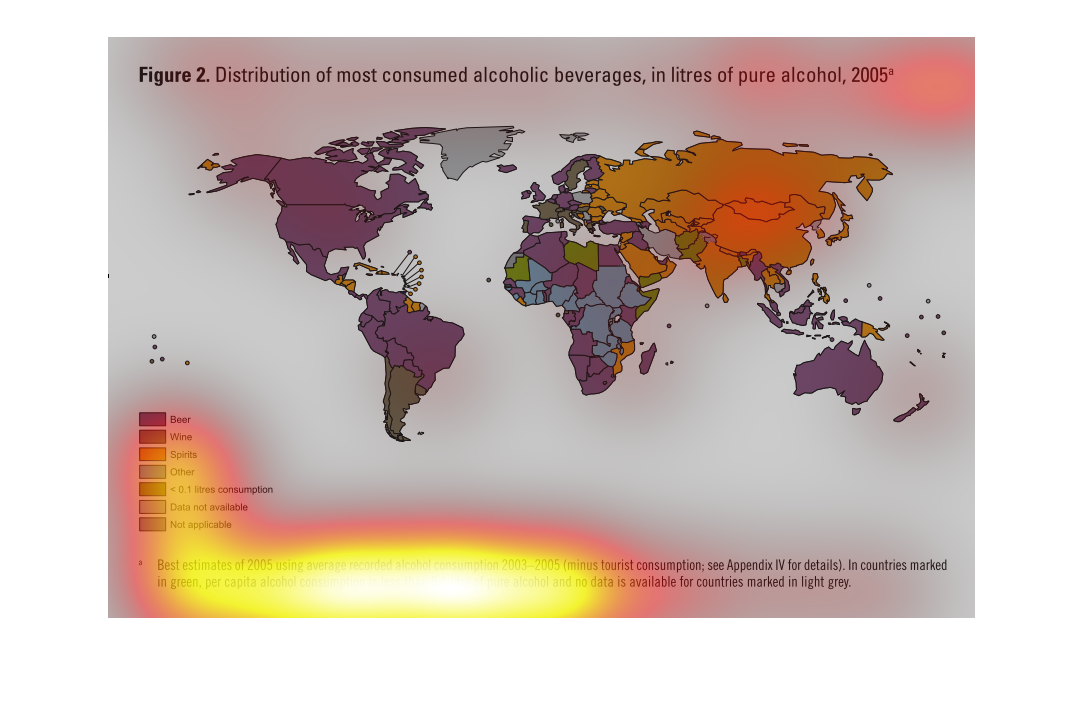
The image shows the distribution of most consumed alcoholic beverages, in liters of pure alcohol,
in 2005*. Data is estimates for 2005, based on data collected from 2003-2005. Beer seems to
be a popular alcoholic item of consumption across the planet, and the "spirits" category is
most heavily consumed in Russia.
The figure presented is titled Figure 2: Distribution of most consumed alcoholic beverages,
in litres of pure alcohol.  The figure is a representation of alcohol.
This is a regional model of distribution of alcoholic beverages consumed by geographic area.
 Each region is generalized into the most popular type of alcoholic beverage consumed based
on the consumption of the beverage type in liters.
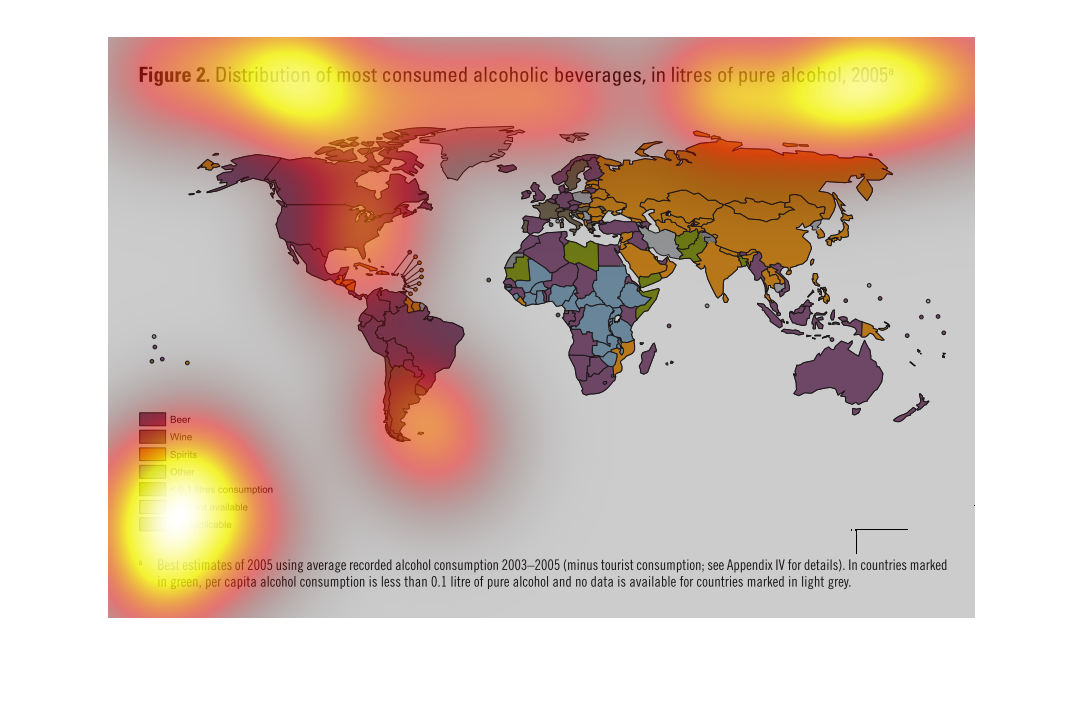
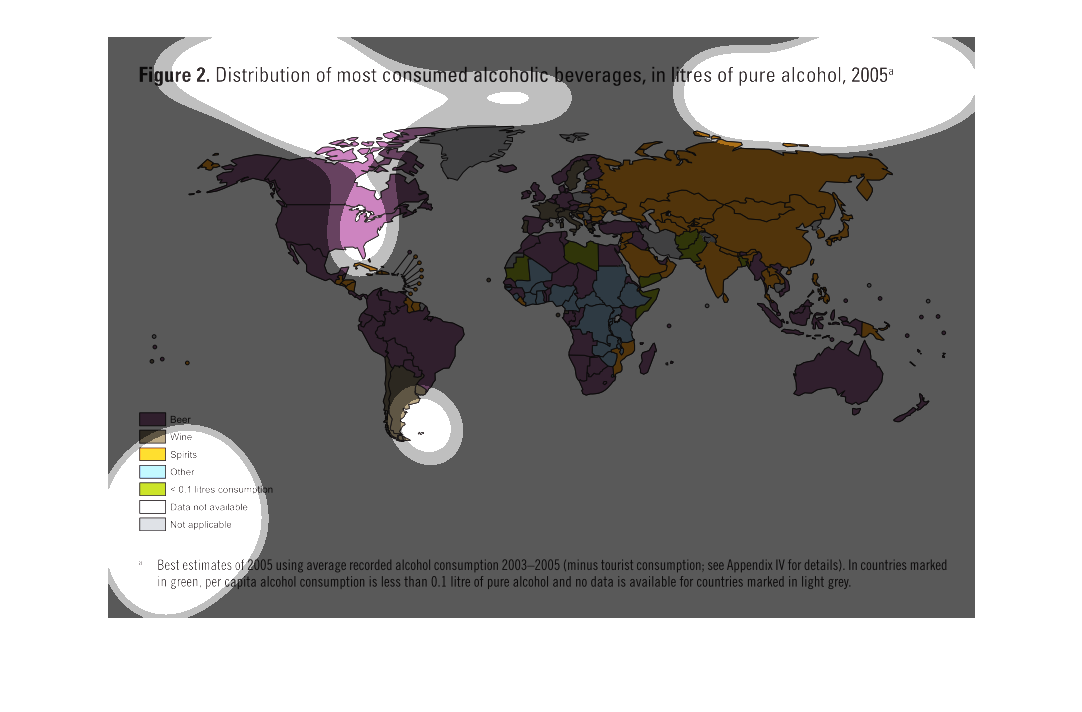
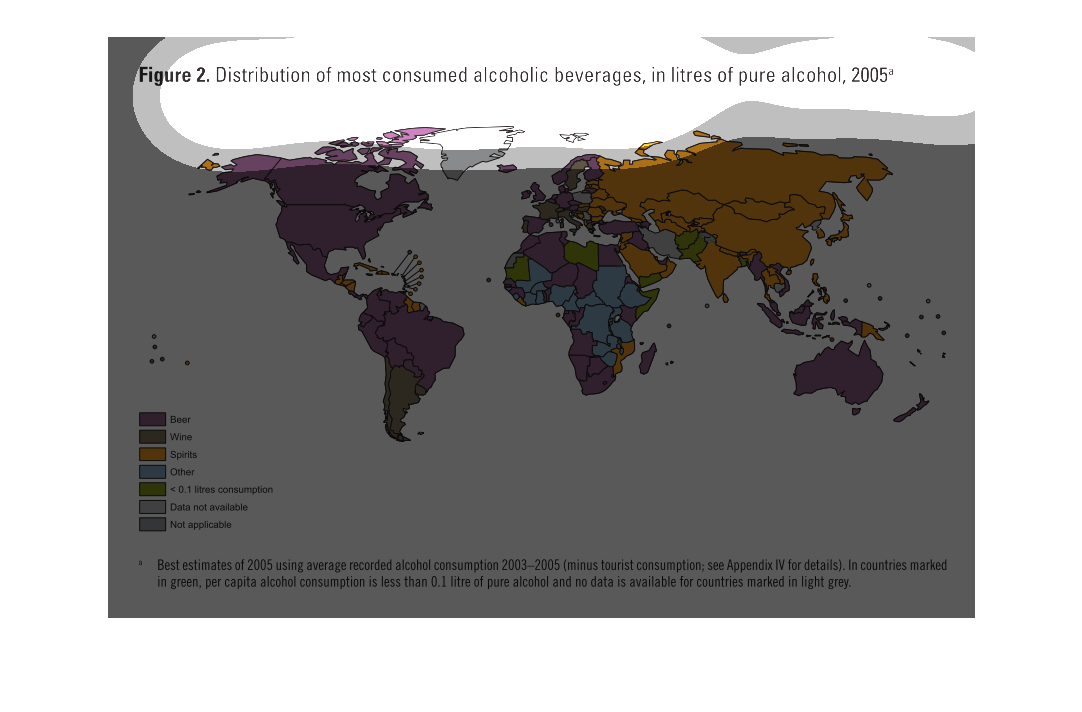
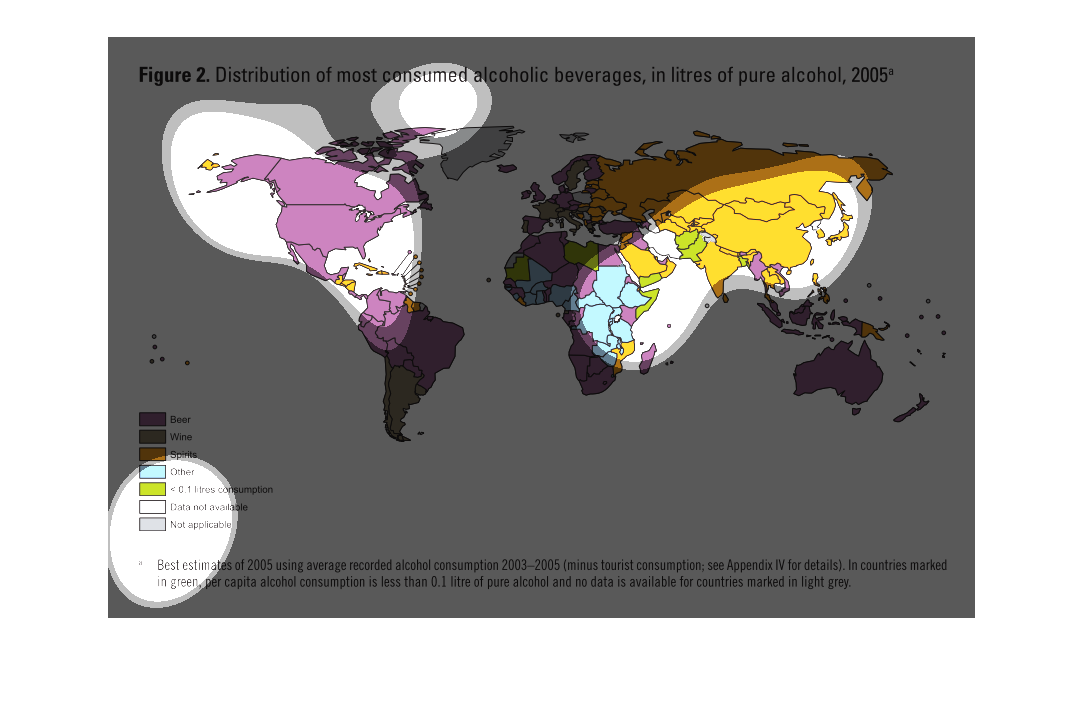
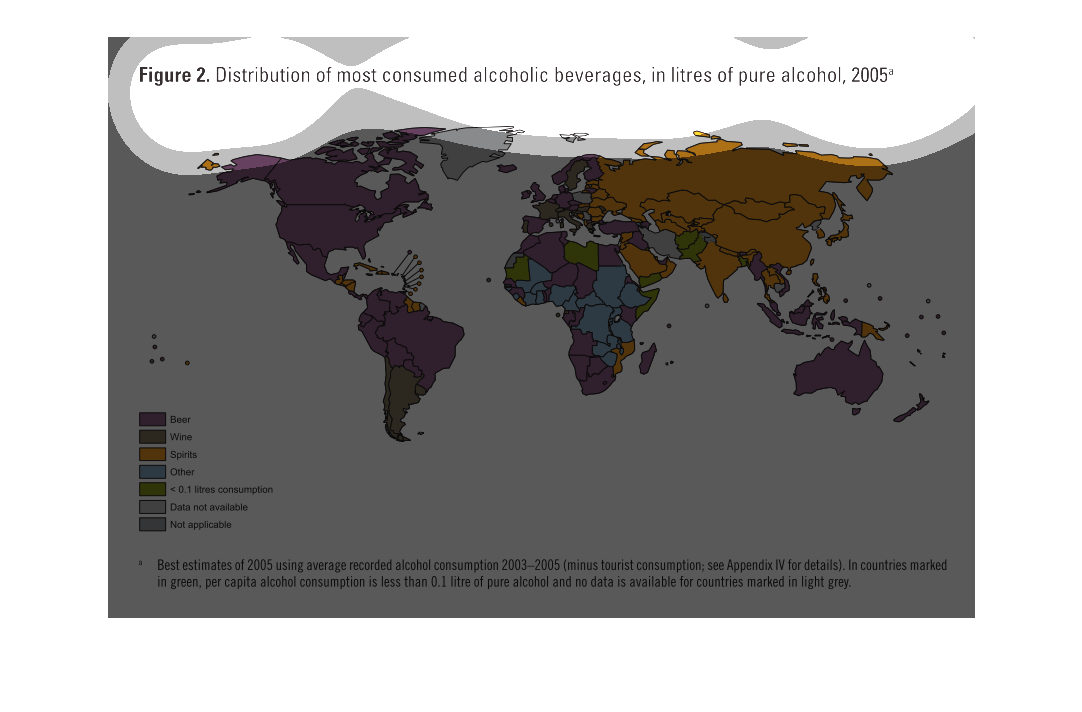
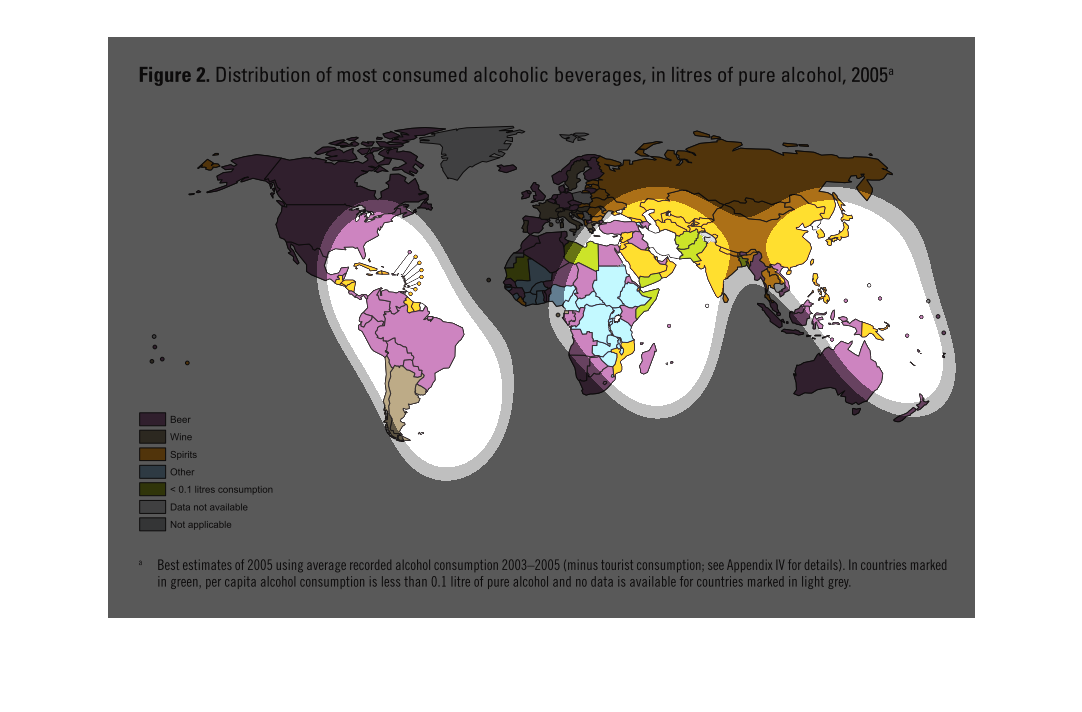
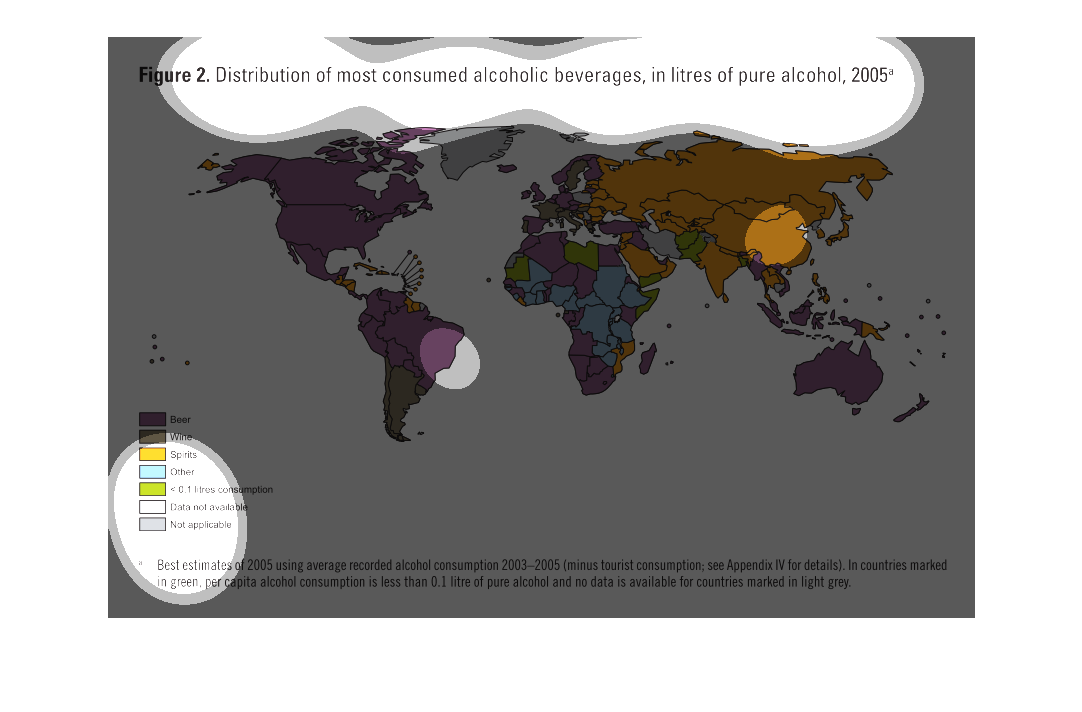
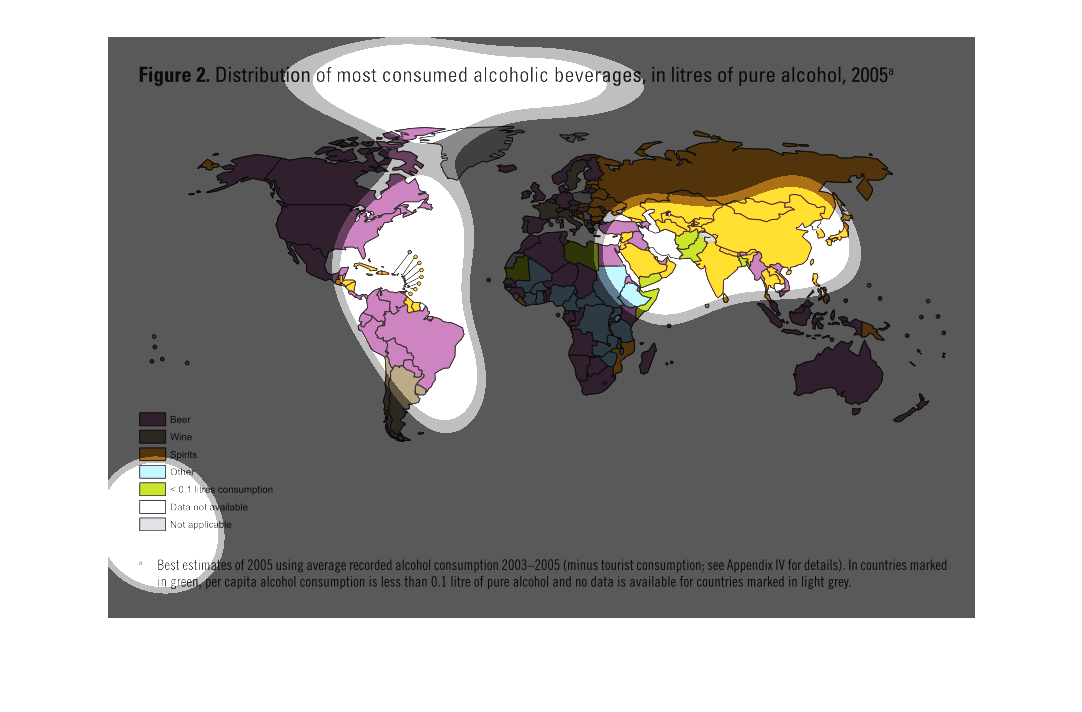
Figure 2 Distribution of most consumed alcoholic beverages, in litres of pure alcohol, 2005.
We see a color coded map of the world displaying the highest consumption levels of beer in
North America and Northern South America, Australia, parts of Europe, Southern Africa and
select other African countries as well as southern Asian island countries. Wine is Mainly
consumed in parts of Europe, and southern  South America. Asia mostly consumes spirits, and
Africa is the main consumer of 'other'.
This chart describes distribution of most consumed alcohol beverage, in liters of pure alcohol,
for the year 2005. Different categories are represented by different colors.
This chart shows the distribution of most consumed alcoholic bevaerages in liters of pure
alcohol. Beer ranks as the highest. Wine is not far behind, followed by Spirits.
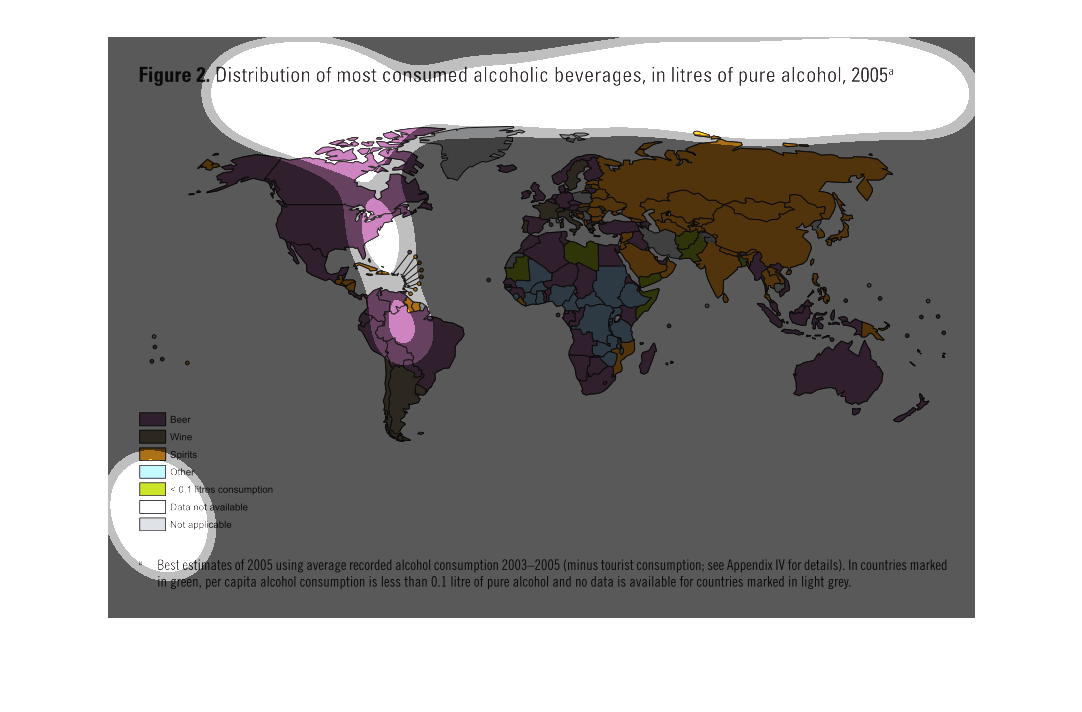
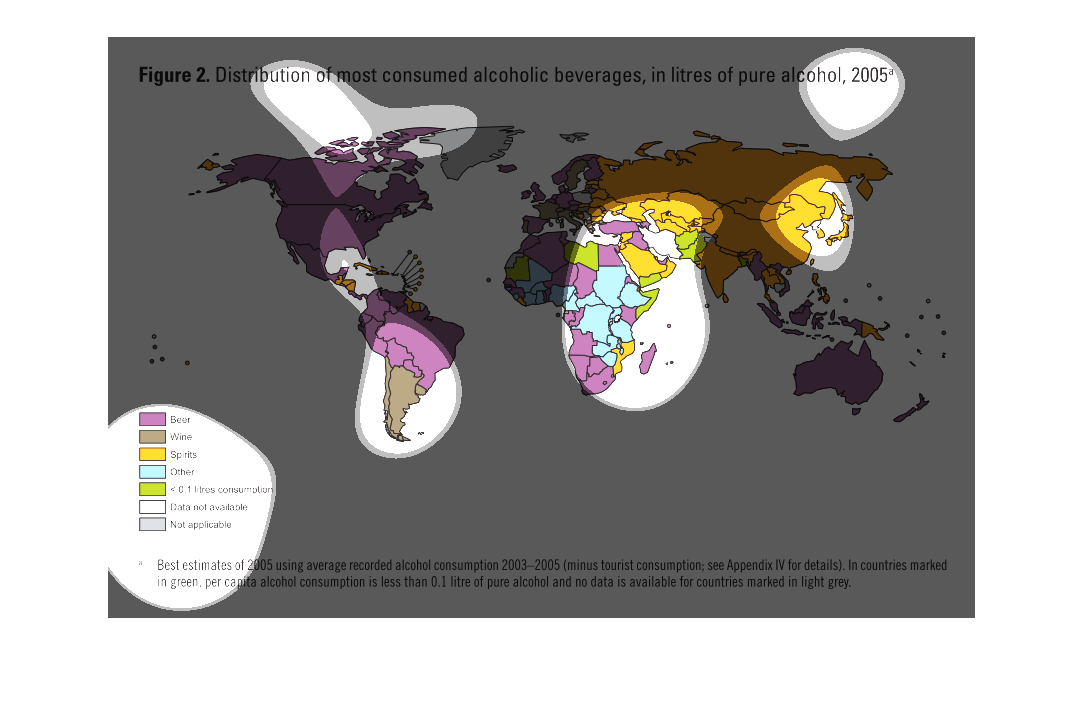
Distribution of most consumed alcohol  by Liters including Beer, Wine, Spirits, Other.  US,
Canada, Brazil, Australia (Beer)  Russia, Most of Eurasia (Spirits)  Mediterranean (Wine)
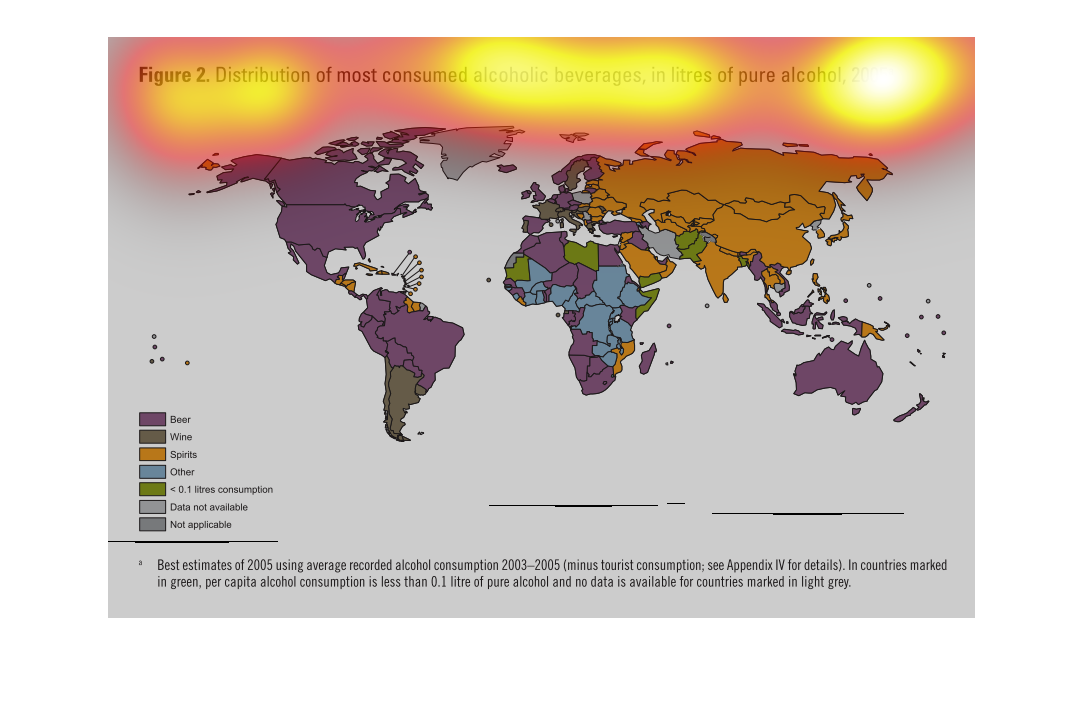
This is a map showing the distribution of alcoholic beverages consumed in liters of pure alcohol
in 2005. The US, South America, Canada, Australia, and most of mexico drink the most beer.
All of Russia and Asia drink the most spirits. A few smaller countries drink mostly wine.
In 2005 most of the world, geographically speaking, consumed mostly beer. However Asia consumed
mostly spirits. There was a considerable portion of Africa in the other category, which is
unclear on the meaning
The picture shows the distribution of alcoholic beverages conscription in 2005. The alcoholic
beverages are considered in the graph, and the amount of drinks.