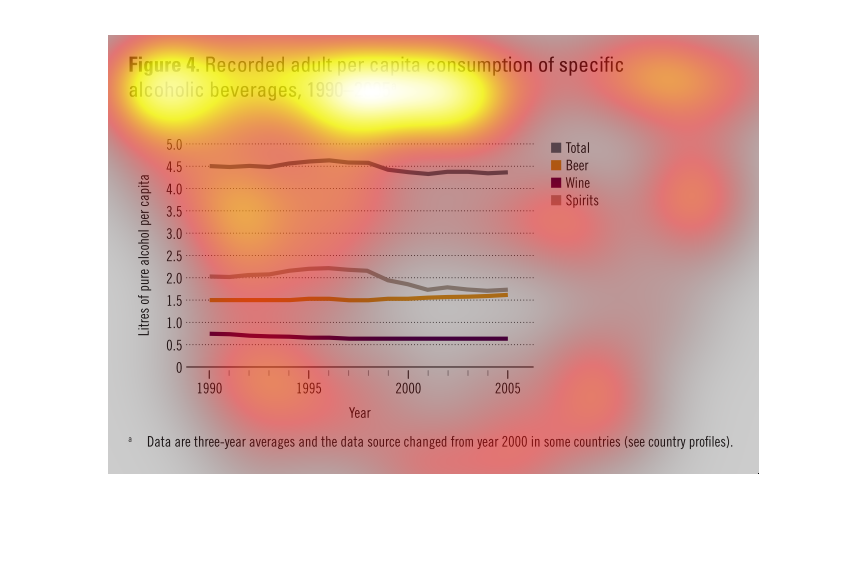
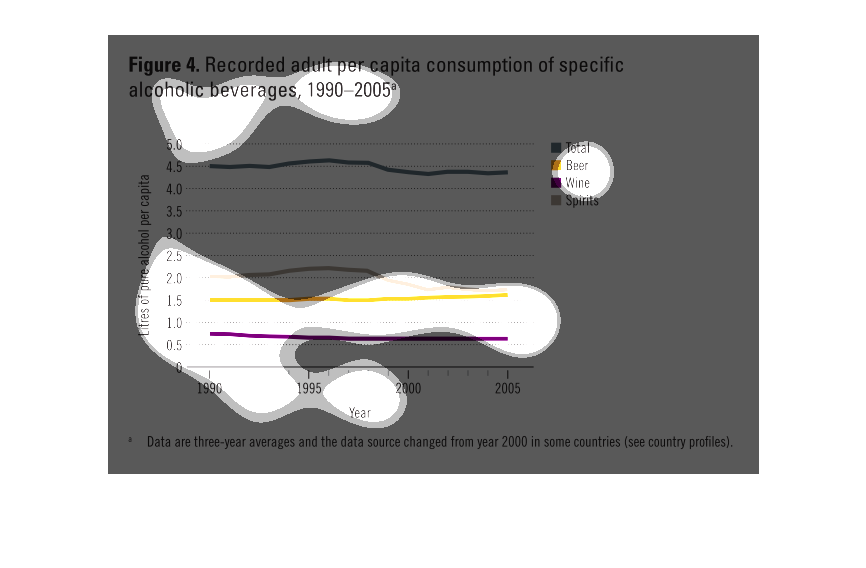
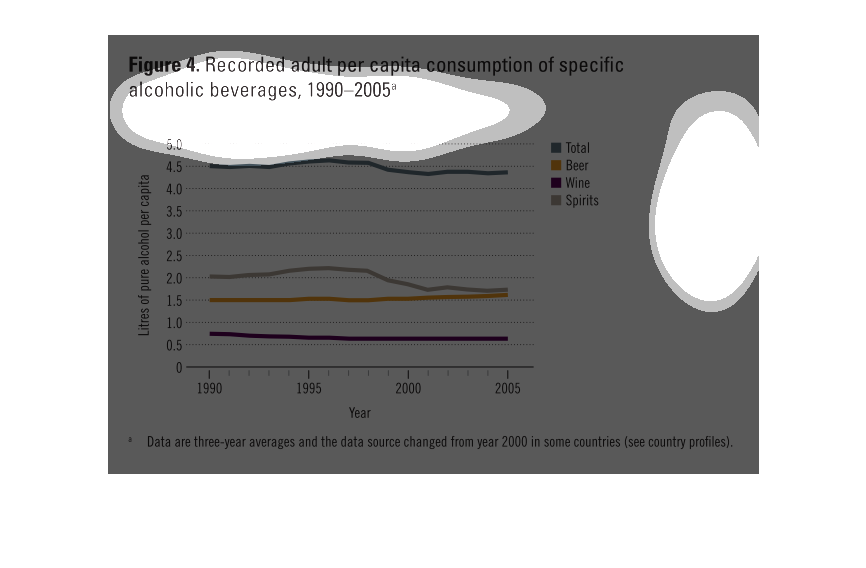
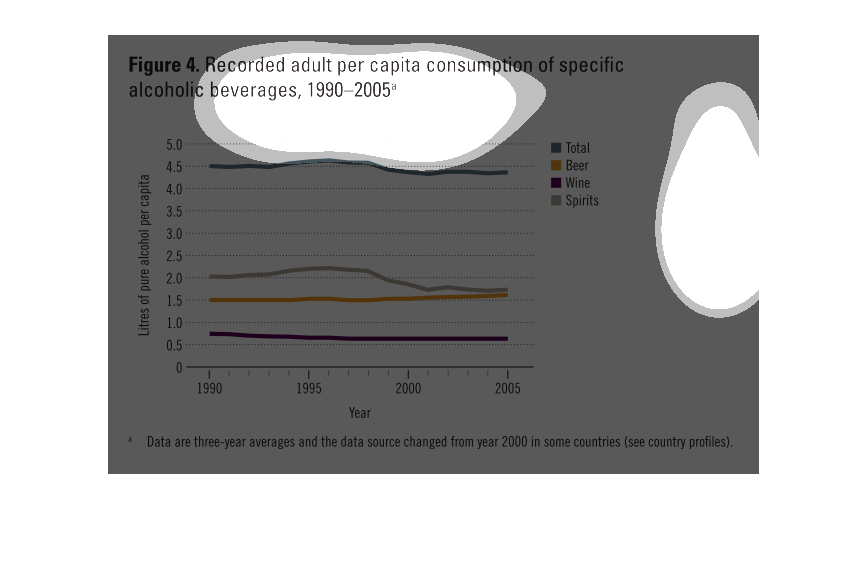
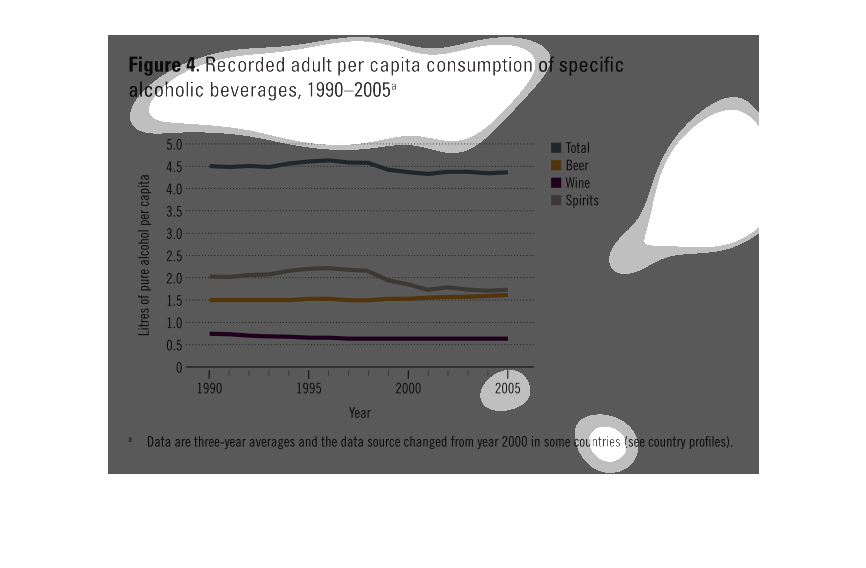
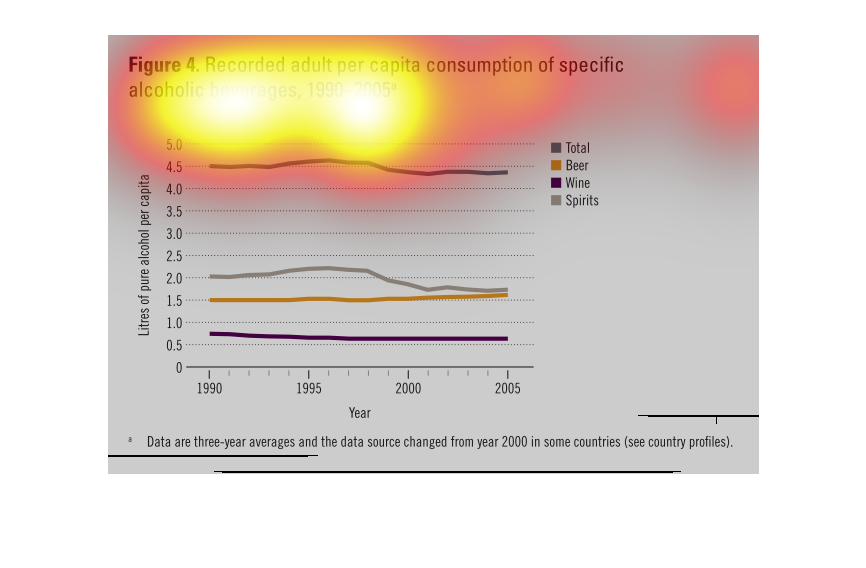
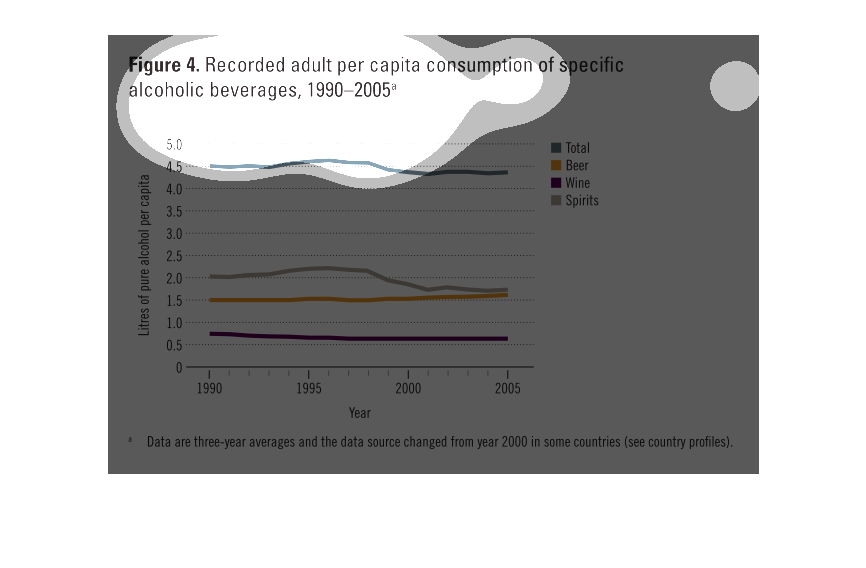
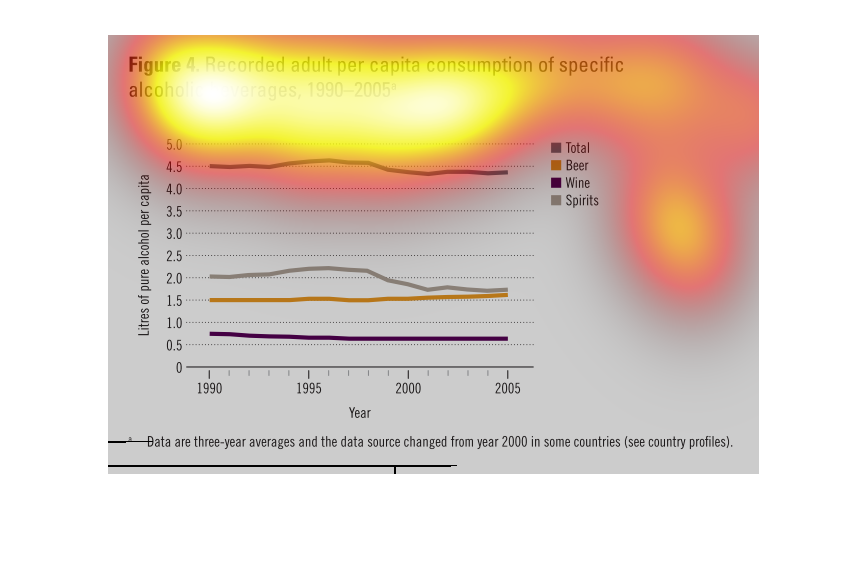
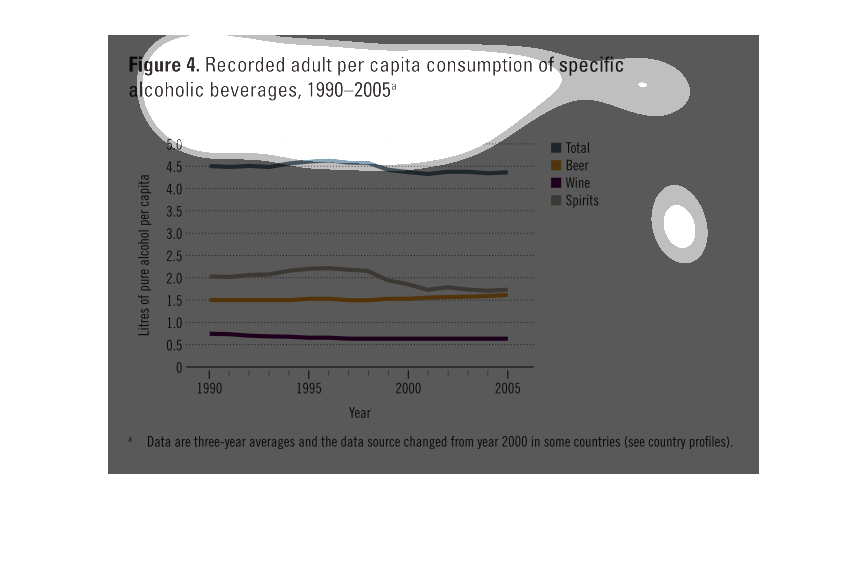
Chart for consumption of adult beverage over the period of 1990 to 2005. Spirits were consumed
the most out of the three which are spirits, beer, and wine.    There was a drop in consumption
of spirits around 1997 but it was still more than the other two.
In this study conducted from 1990-2005, we see that researchers recorded the wide variety
of Alcoholic beverage consumption worldwide. From wine to beer, this charts the world's drinking
habits.
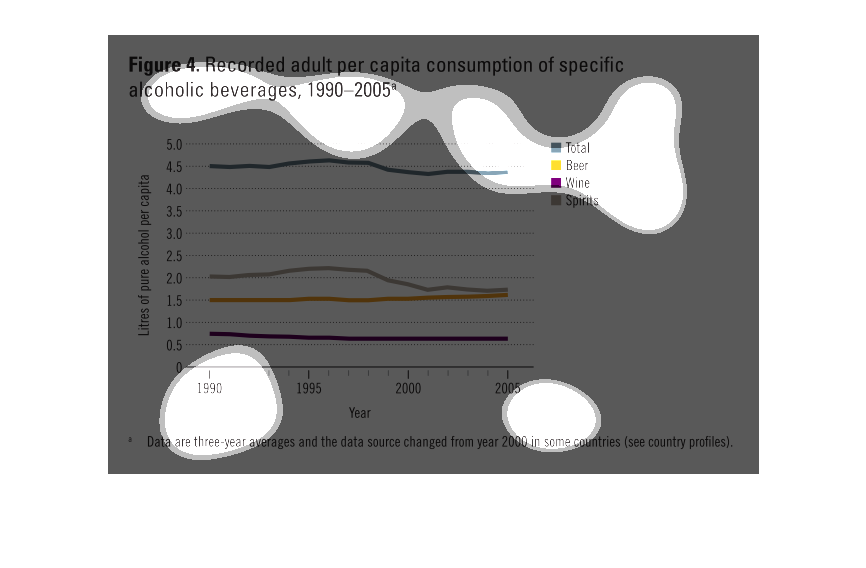
This is a graph that shows the recorded adult consumption of specific alcoholic beverages
between the year 1990 and the year 2005. It shows this in the form of liters of pure alcohol
per capita.
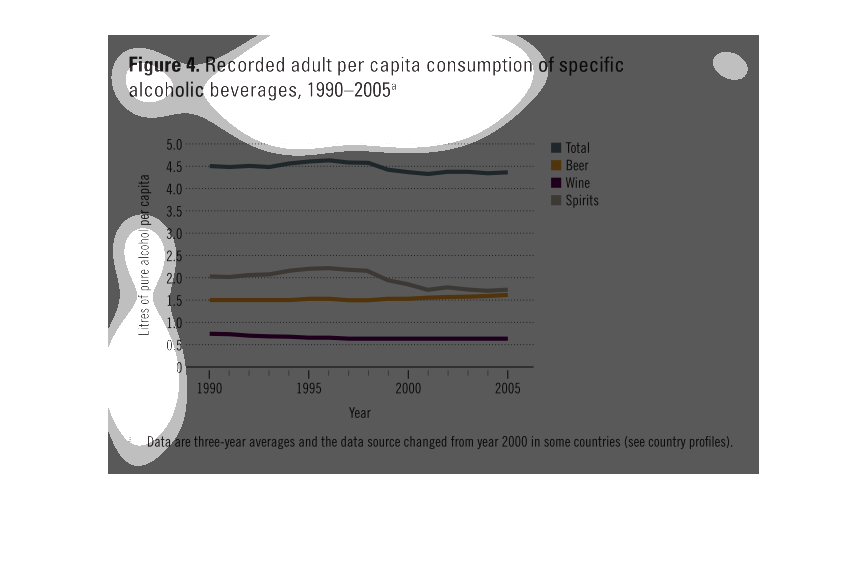
The chart shows the amount in litres of select alcoholic beverages consumed by adults per
capita over the period of fifteen years. Beer and wine consumption has stayed almost constant,
while the total and spirits decreased around 1998.
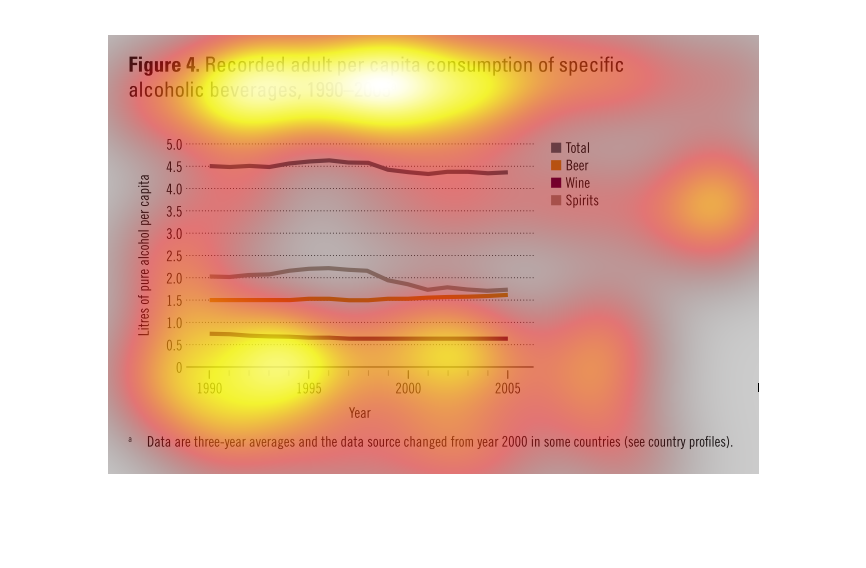
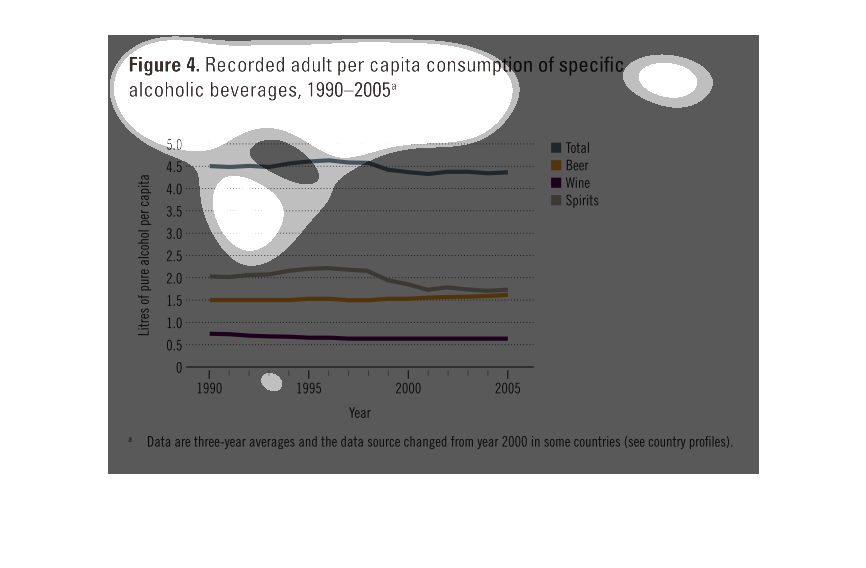
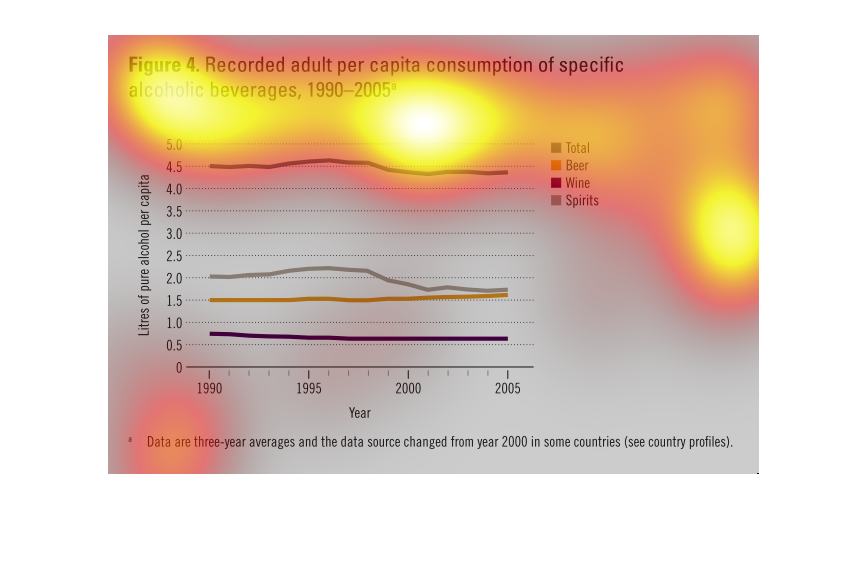
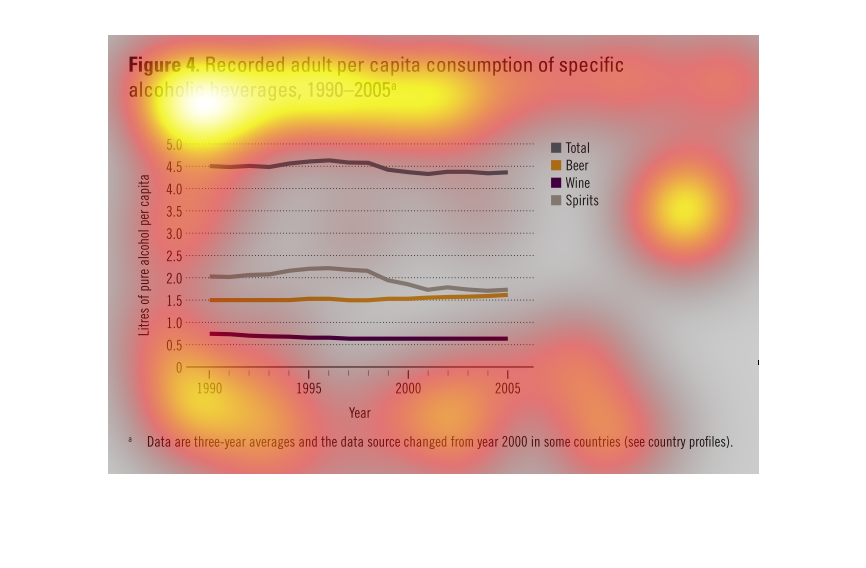
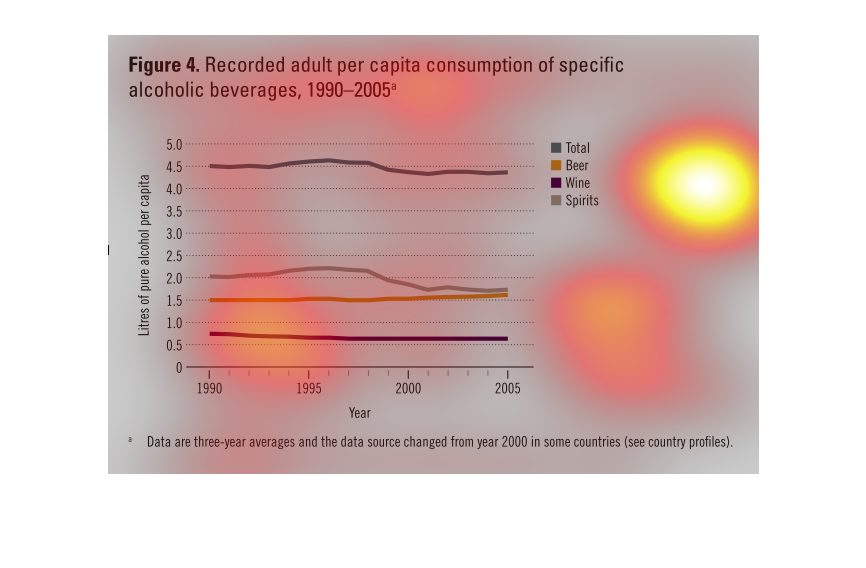
This is a graph of the recorded per capita consumption of alcoholic beverages for adults in
the years 1990 to 2005. Alcohol is broken down into beer, wine and spirits. There is another
line to total the mounts, which is steady.
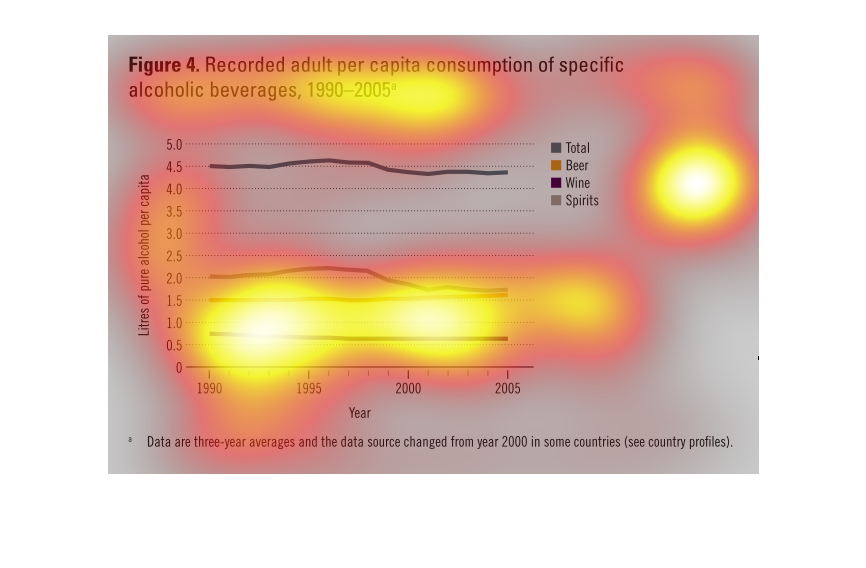
This line graph shows the average consumption of specific alcoholic beverages, per capita,
over time.  Spirits have historically accounted for the most consumption, but beer has recently
been closing the gap as of 2005 and should have passed spirits by 2016.  Wine has stayed consistent
at around 0.60 liters per capita.
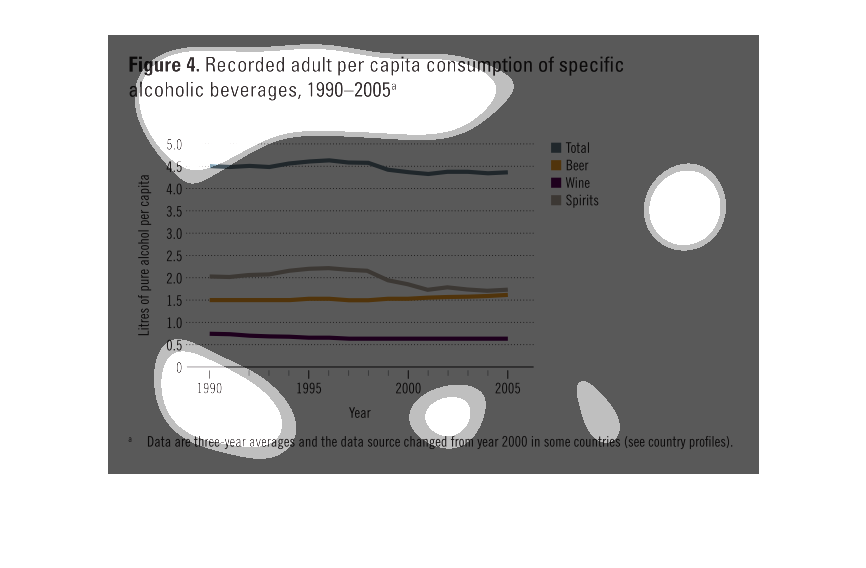
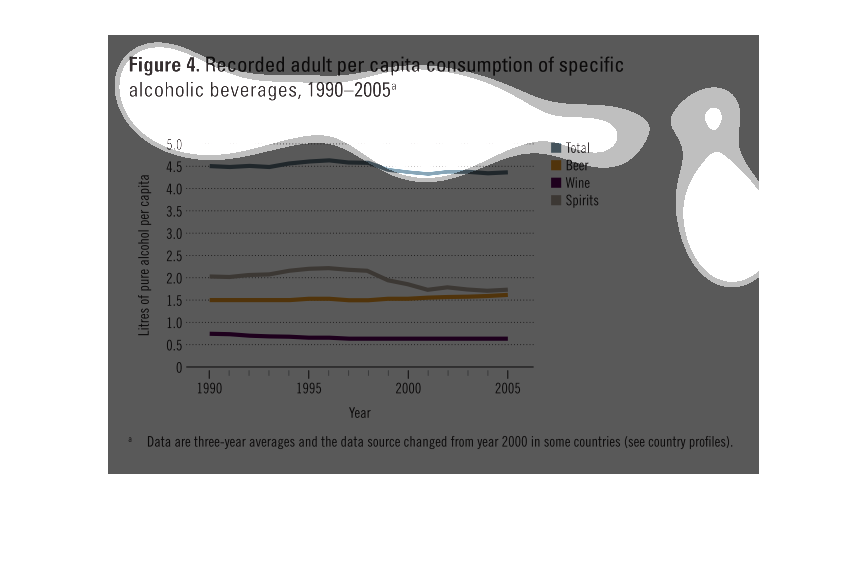
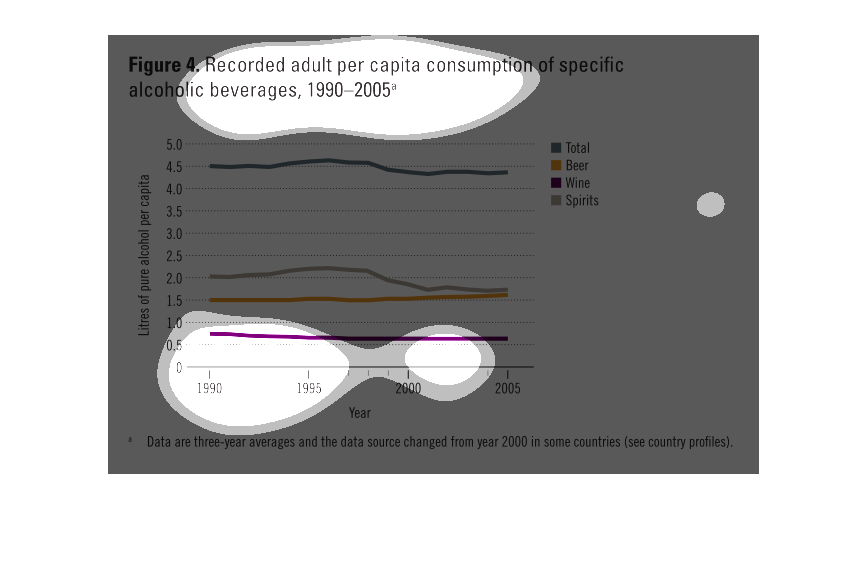
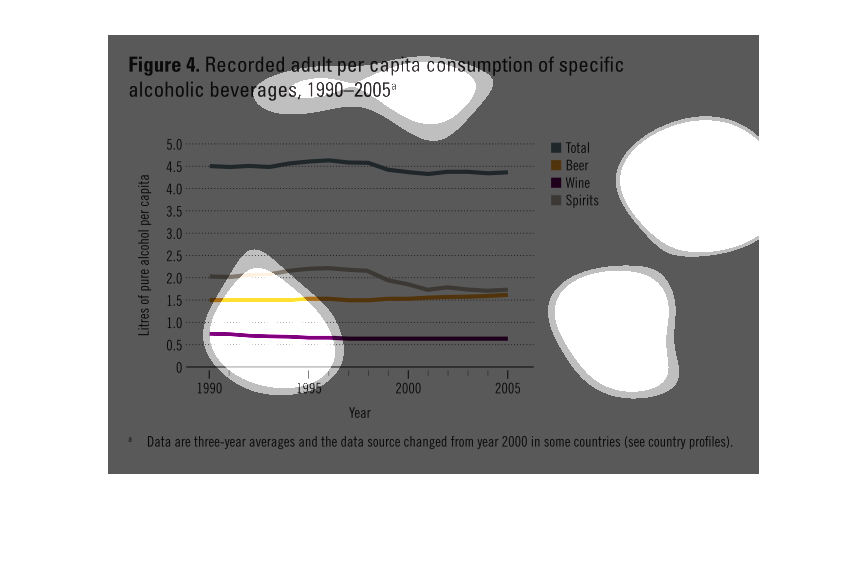
This fifteen year study- 1990 to 2005- shows the predilections over the populace as far as
alcohol consumption goes. This is very telling because it shows a trend towards a lot of beer,
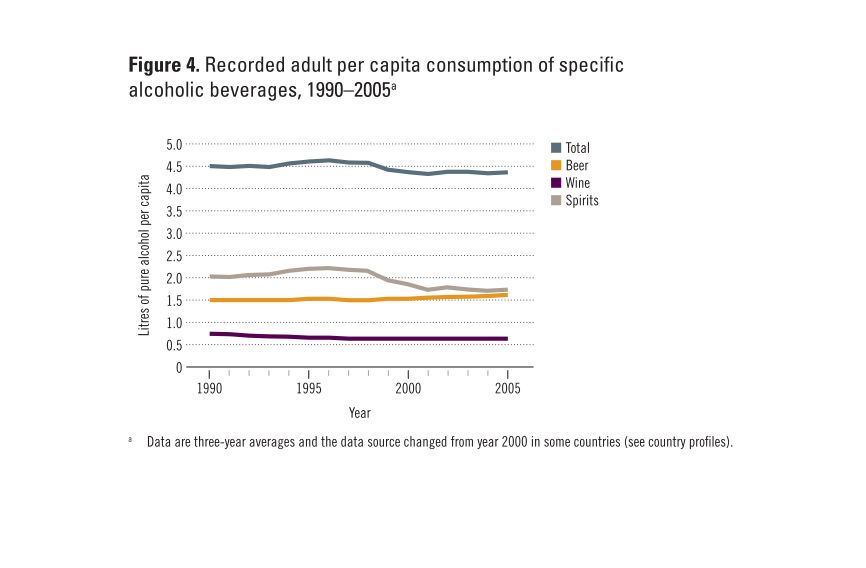
The graph displays the various alcoholic beverages consumed per capita between the years 1990
and 2005. Spirits has been the highest every year, although as of 2005 spirits and beer are
extremely close and almost identical. Wine has not fluctuated at all over the years.
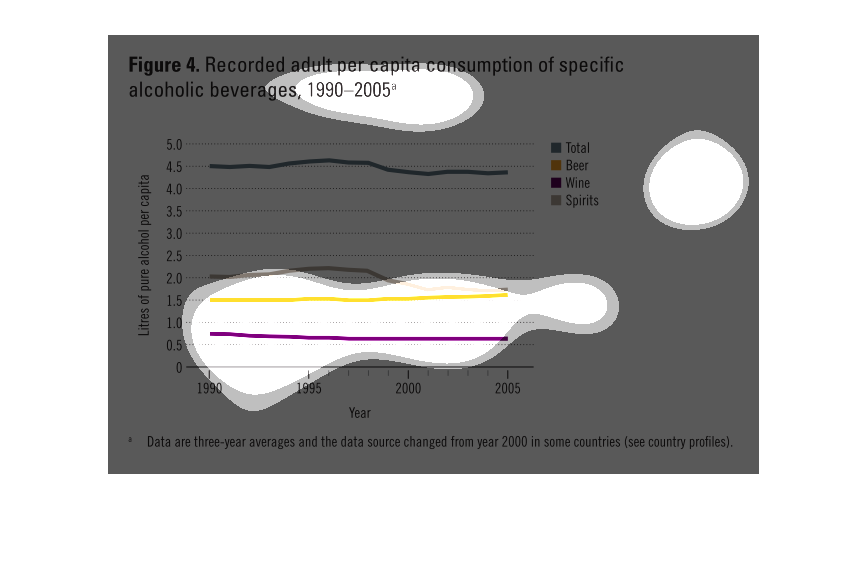
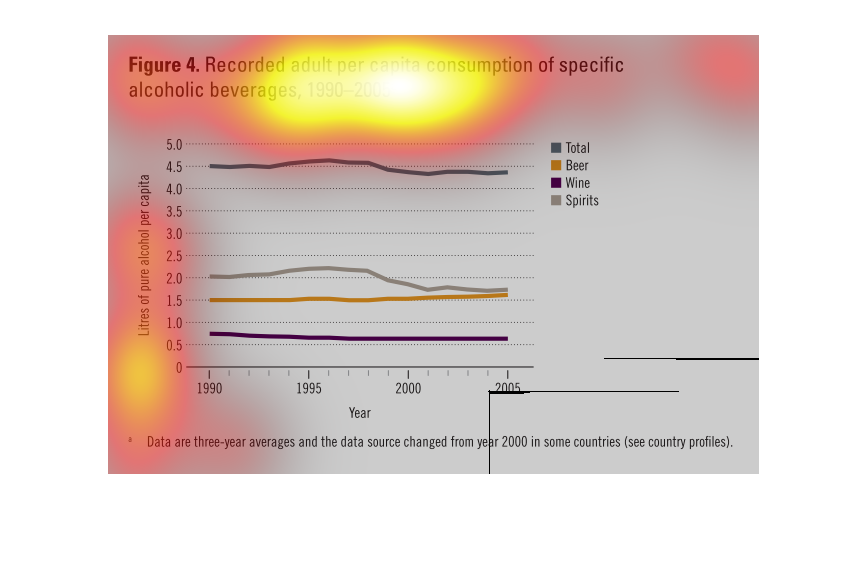
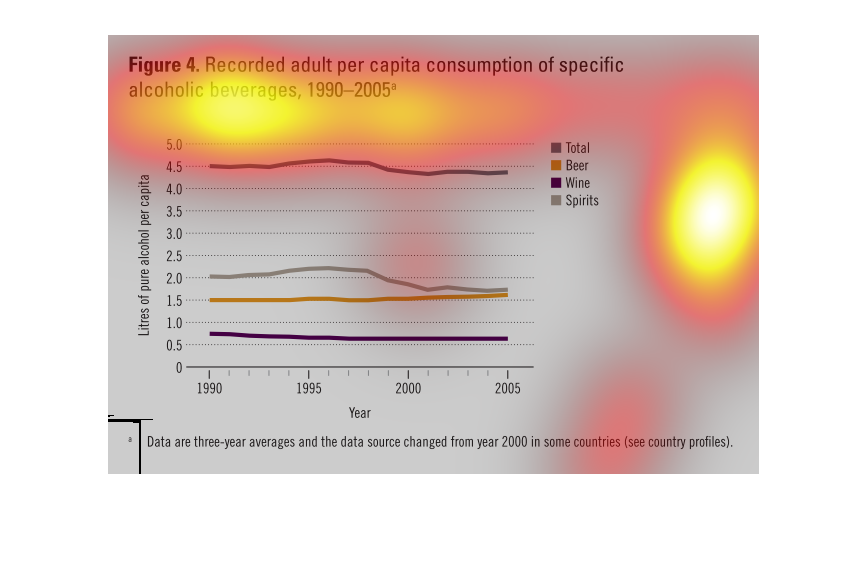
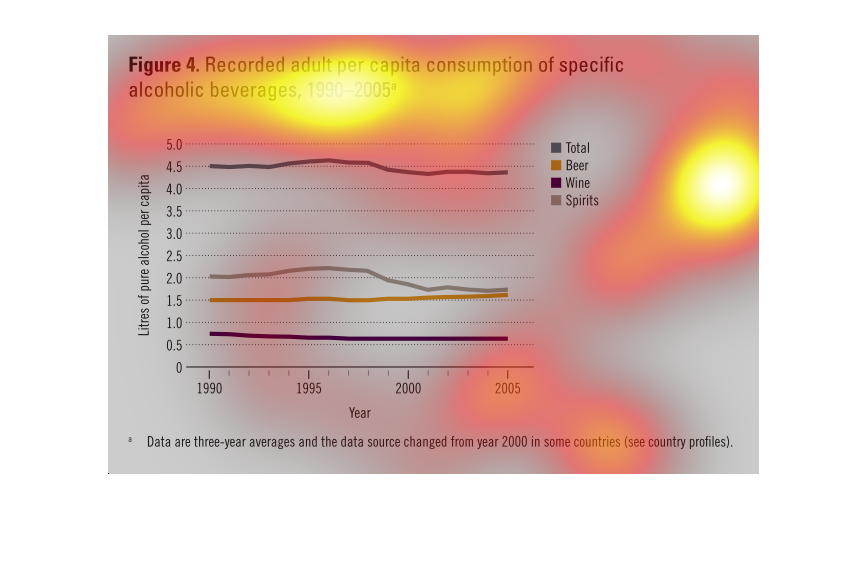
This chart describes recorded adult per capita consumption of specific alcoholic beverages,
for the years 1990 through 2005. Categories on the chart include beer and wine.
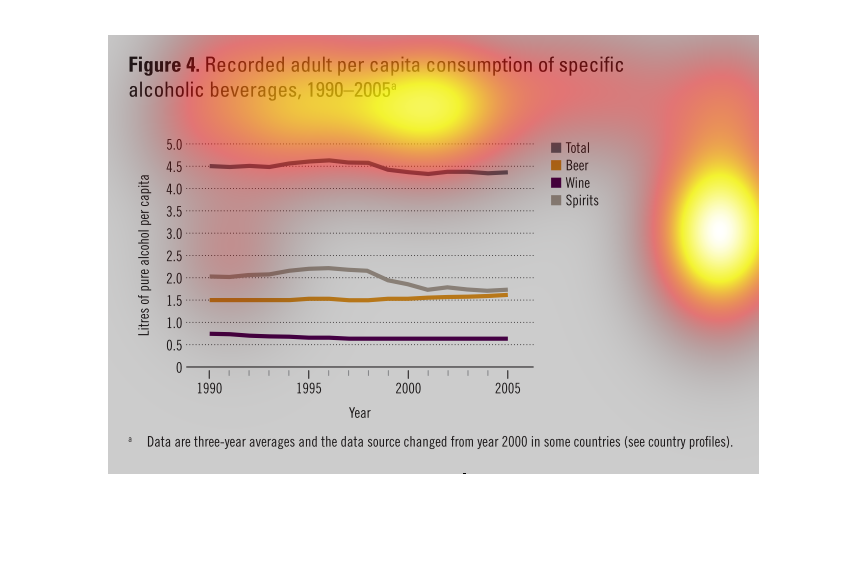
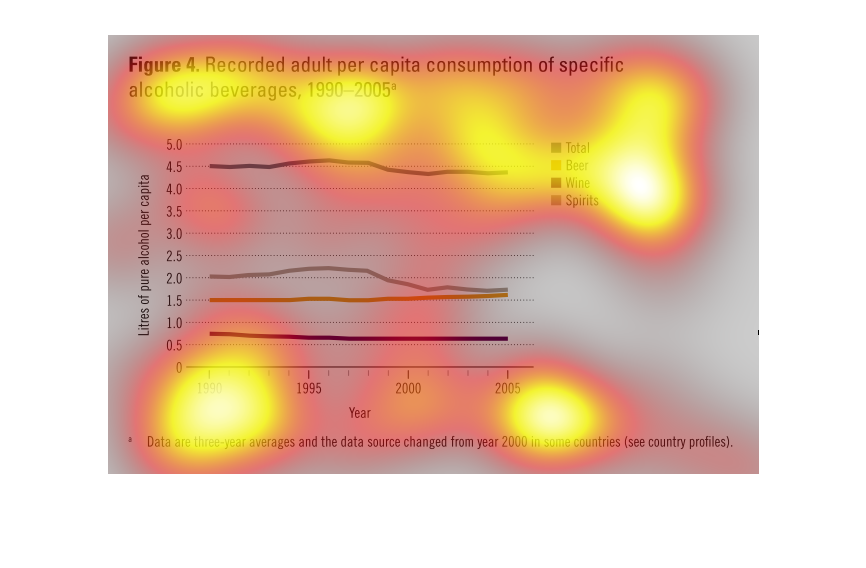
The image depicts recorded adult per capita consumption of specific alcohol beverages, 1990-2005.
Although spirits was the preferred category of drink around 1990, as of 2005 spirits and beer
were statistically tied for most popular alcoholic drink, with wine consistently least preferred.
Total consumption has slightly decreased.
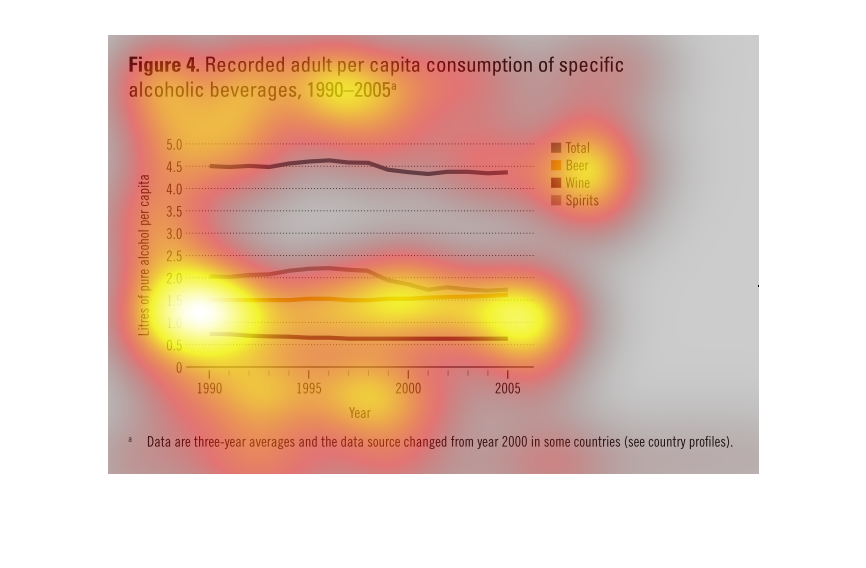
This chart describes the recorded consumption of different alcoholic beverages on adults.
It is seperated by beer, wine, spirits, and the total. It is based on year.
The figure presented is titled reported adult per capita consumption of alcoholic beverages,
1990-2005.  the figure is an actual representation of alcohol consumption.
This chart describes recorded adult per capita consumption of specific alcoholic beverages,
for the years 1990 through the year 2005. categories on the chart include total and beer.
This image recorded the adults per capita who drank specific alcoholic beverages in the years
1990-2005. The categories were divided into beer, wine, spirits, and a total line representing
consumption of all 3. Overall, despite some fluxuation, the numbers remain consistent.