Using a mathematical algorithm, with the help of data collected between 2001 and 2005, we
see that the consumption actually depleted by region, with few spikes in between.
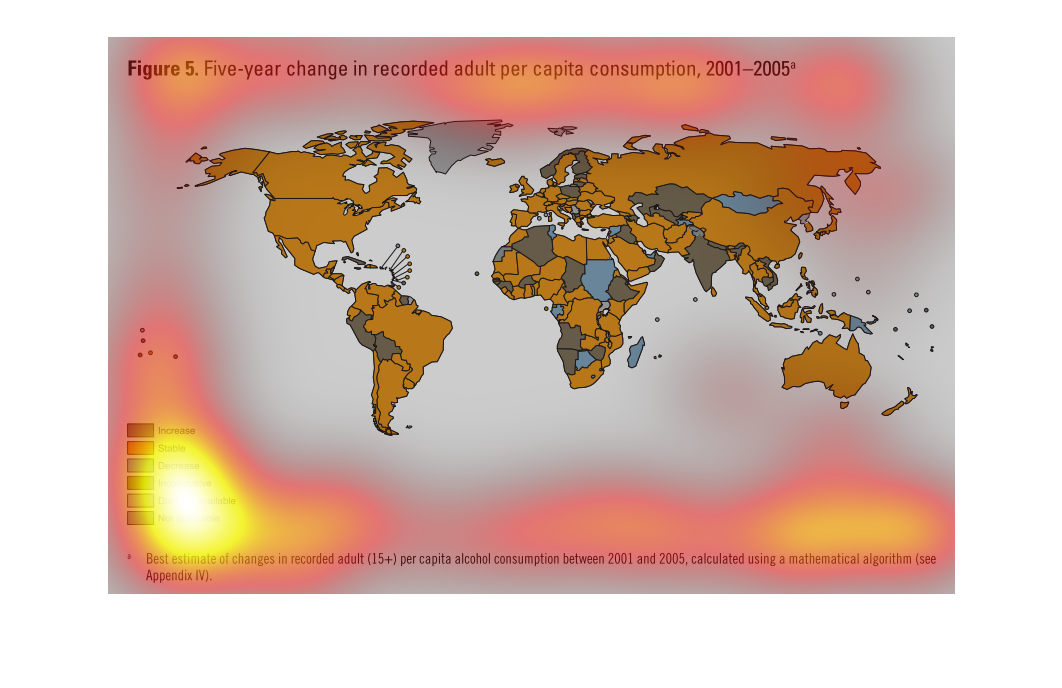

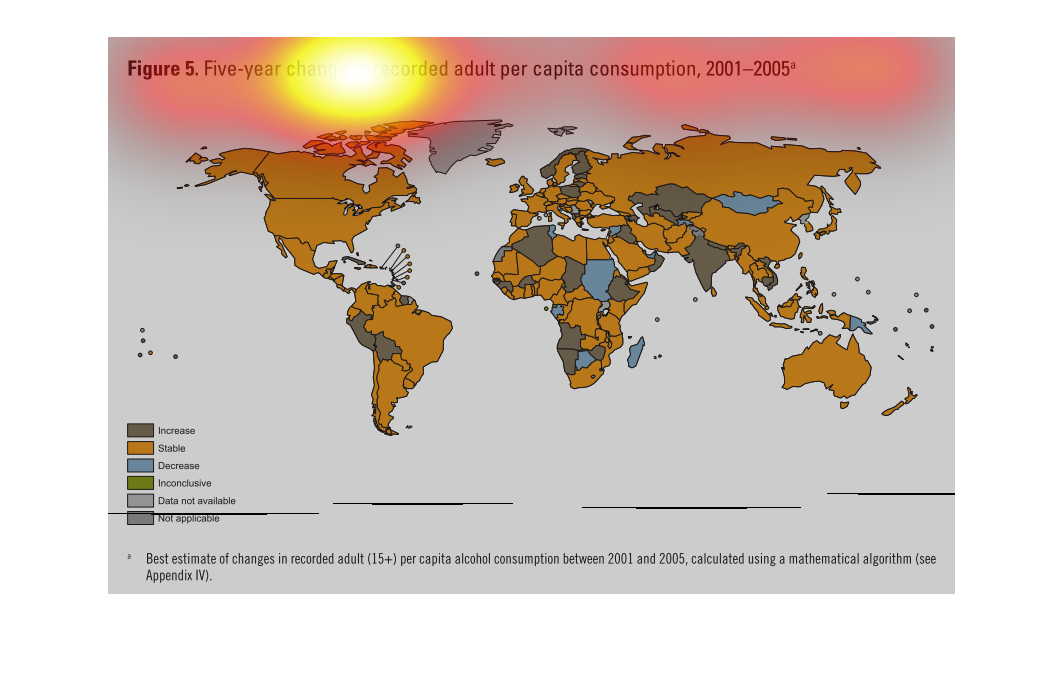
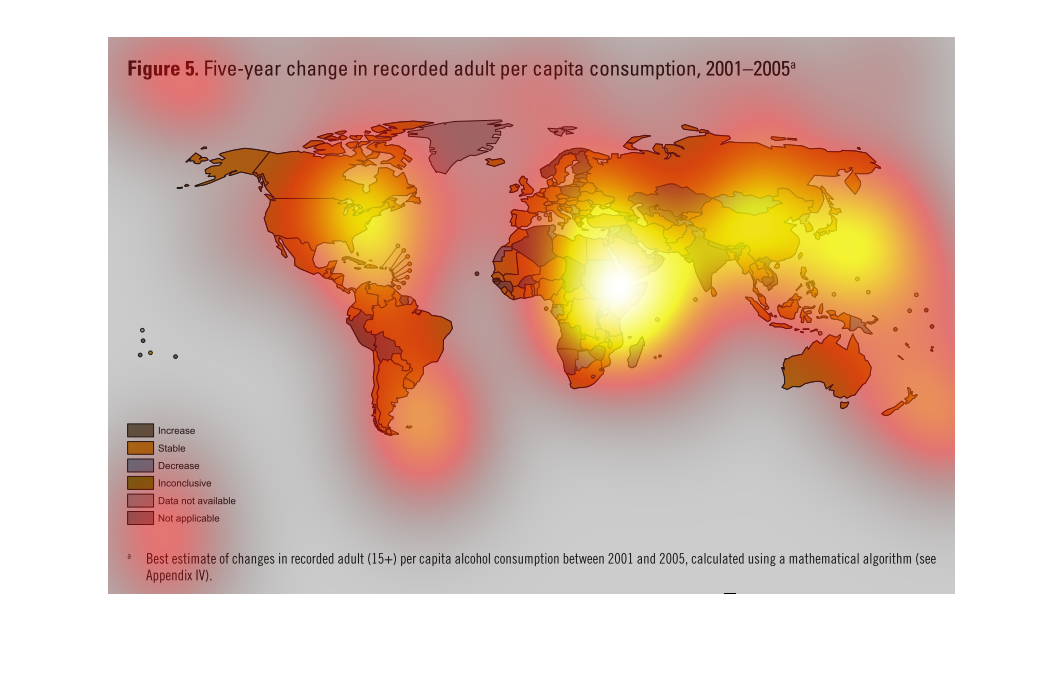
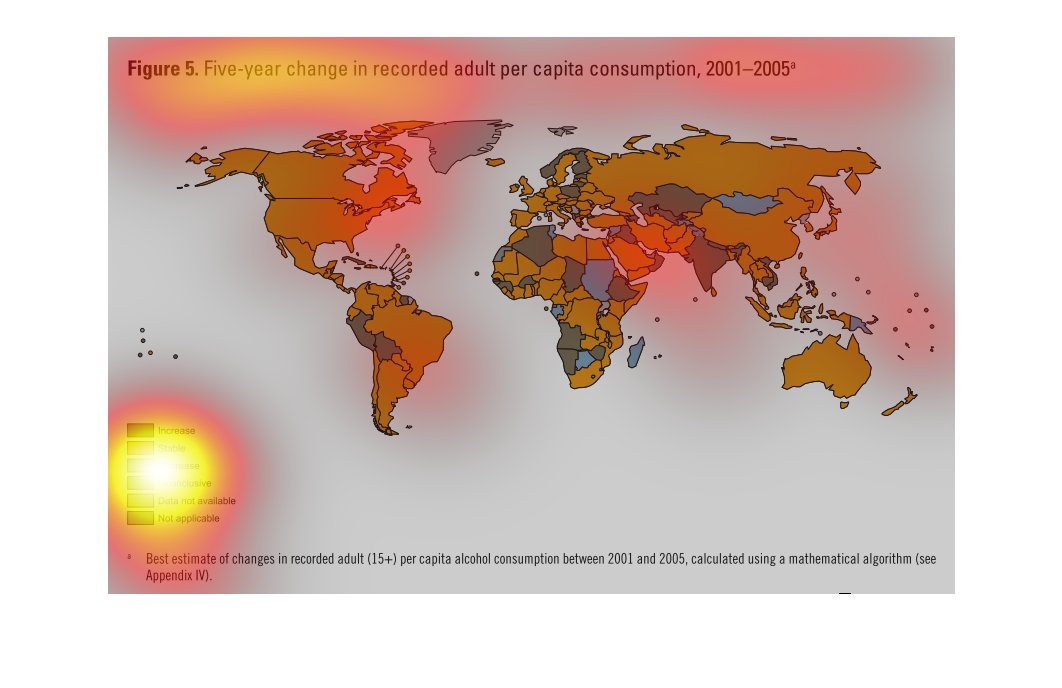
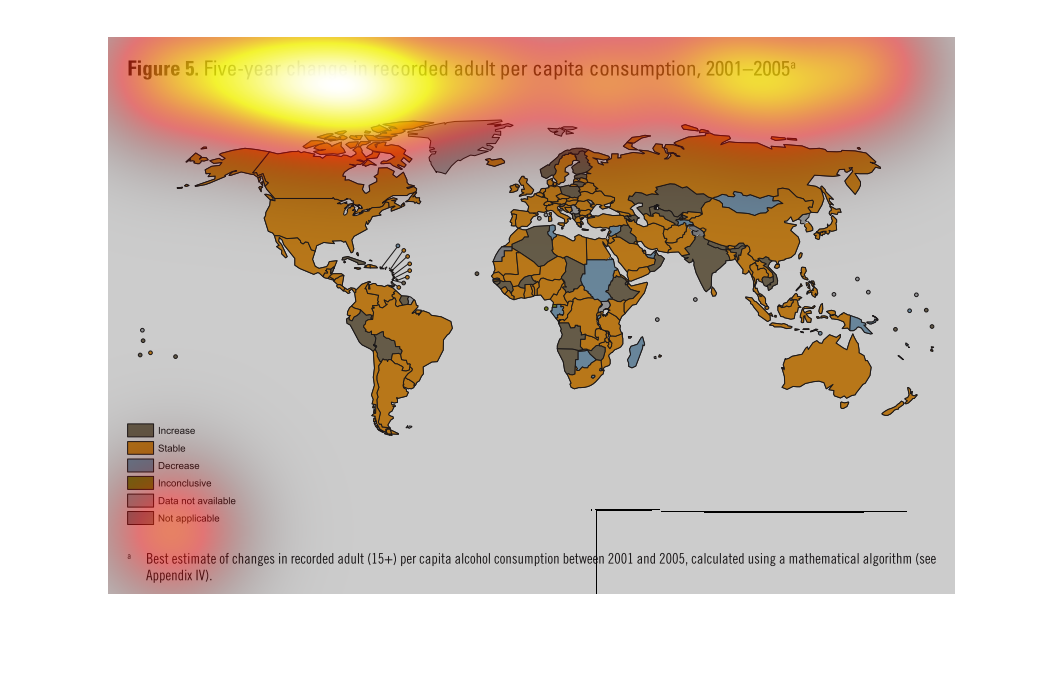
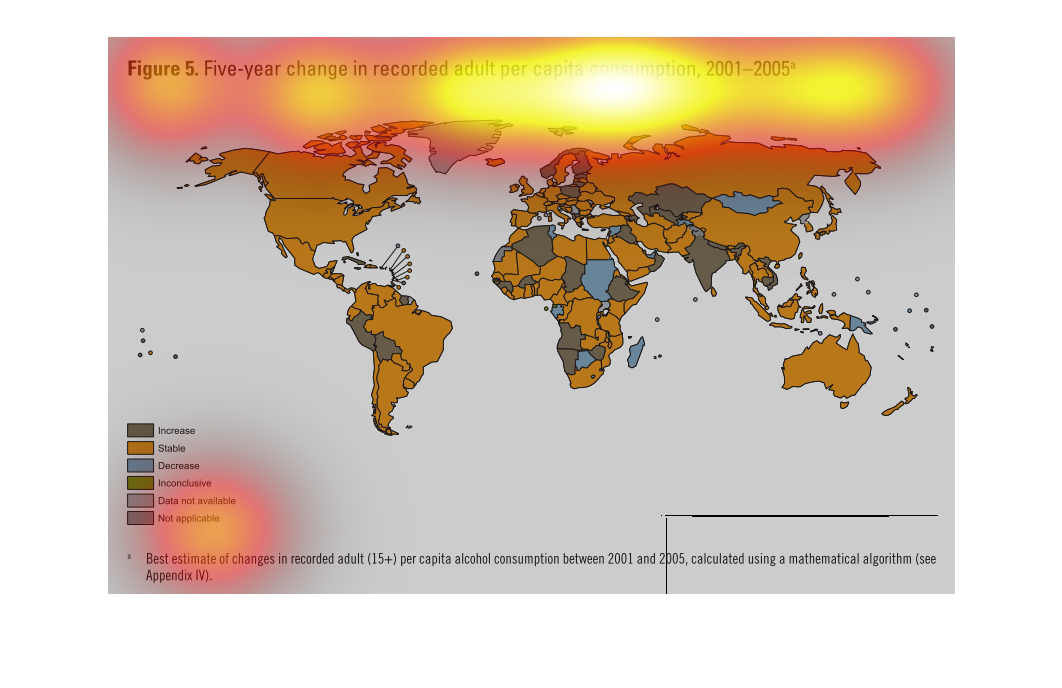
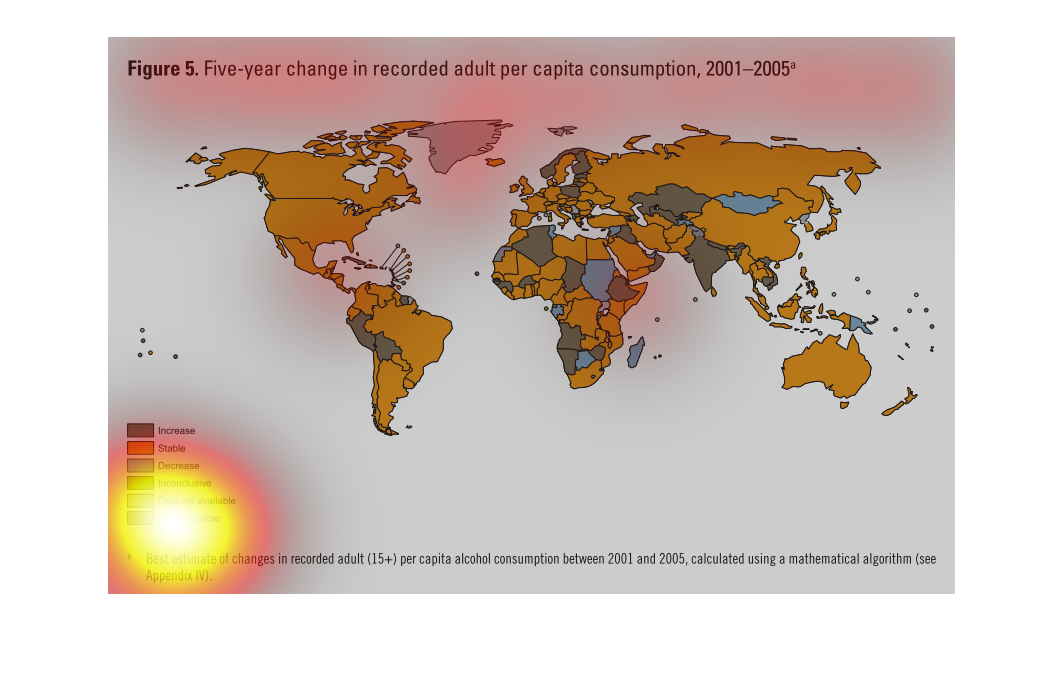
figure 5 five year change in recorded adult per capita consumption, 2001-2005. we see a color
coded map of the world. Most of the western world is coded as stable with few exceptions globally
save for some african and asian countries
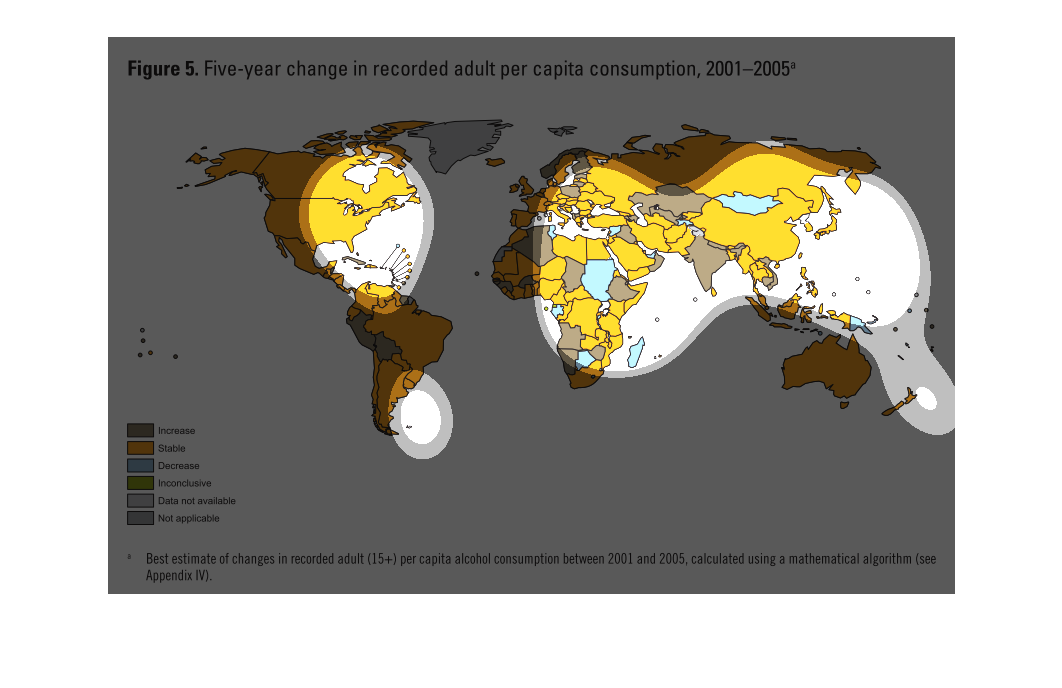
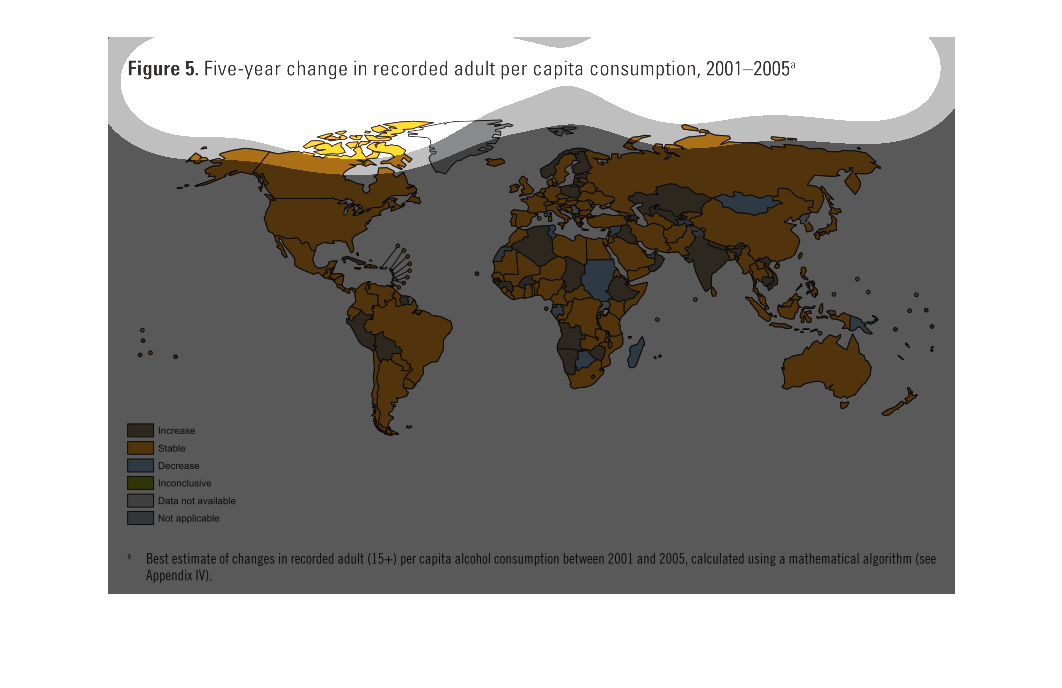
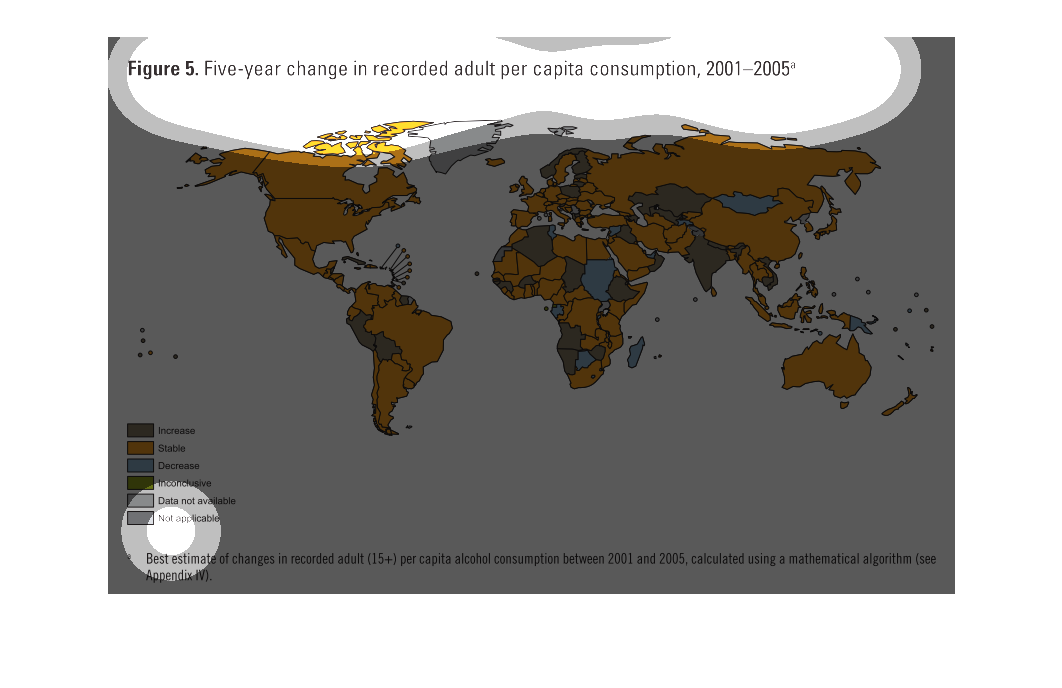
It is another map of the world. It shows five-year changes in recorded adult per capita consumption
between 2001 and 2005. It appears that most of the world's consumption rates stayed steady
throughout the study. It is hard to read the key though so I can't be certain.
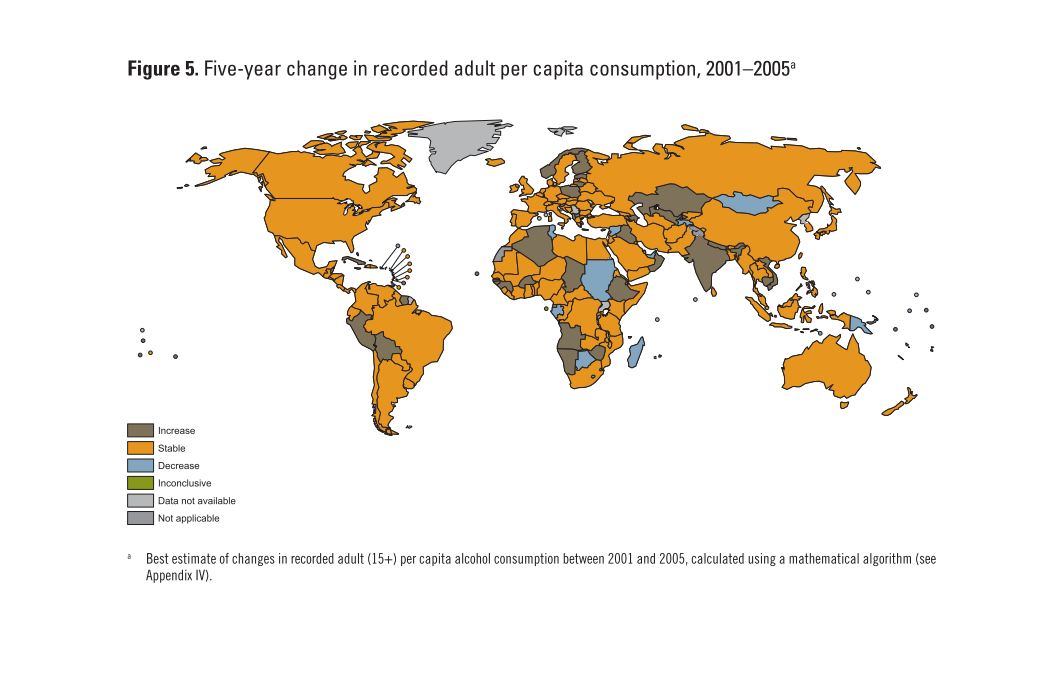
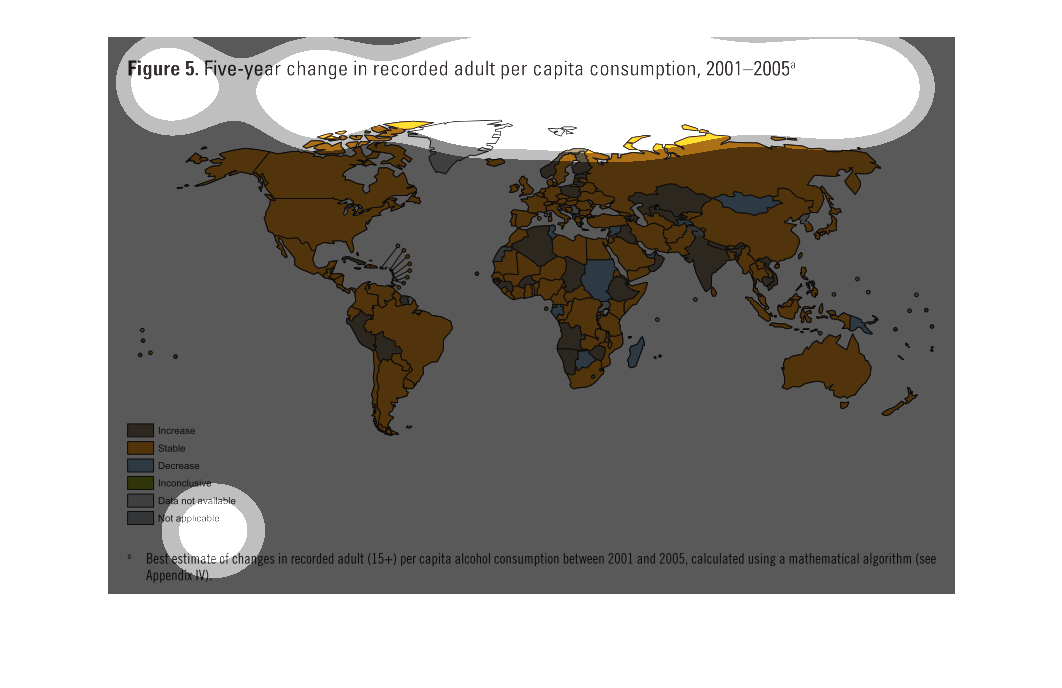
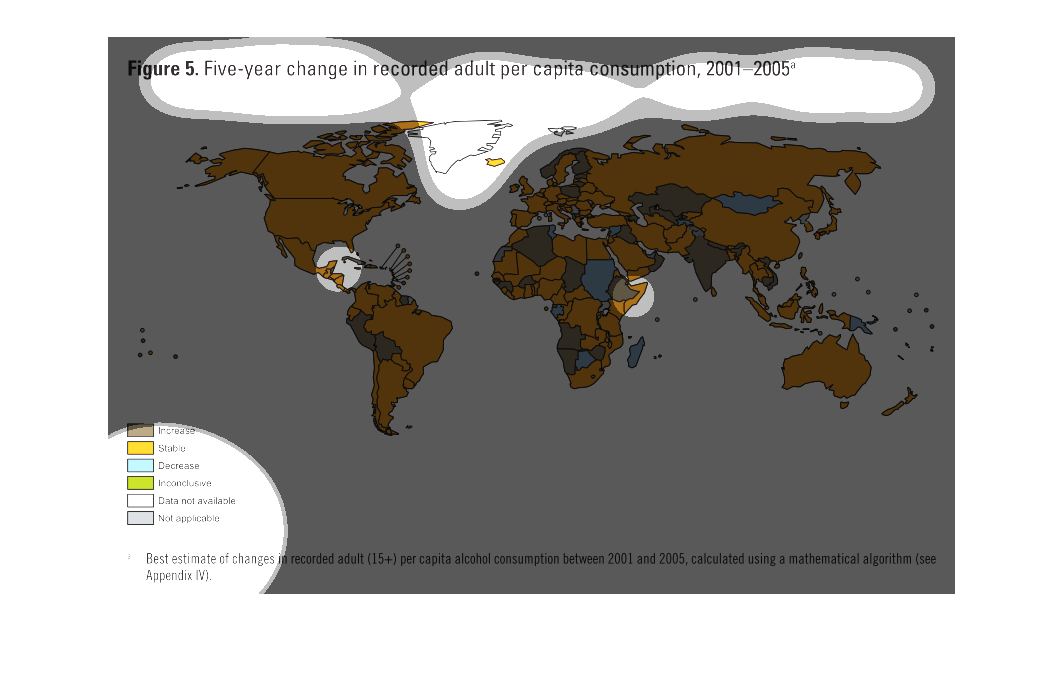
This image shows the pattern of the five year change in recorded adult per capita consumption
from 2001-2005. It appears the change has been stable in most of the world, with a few increases
and decreases, as well as unavailable data and not applicable.
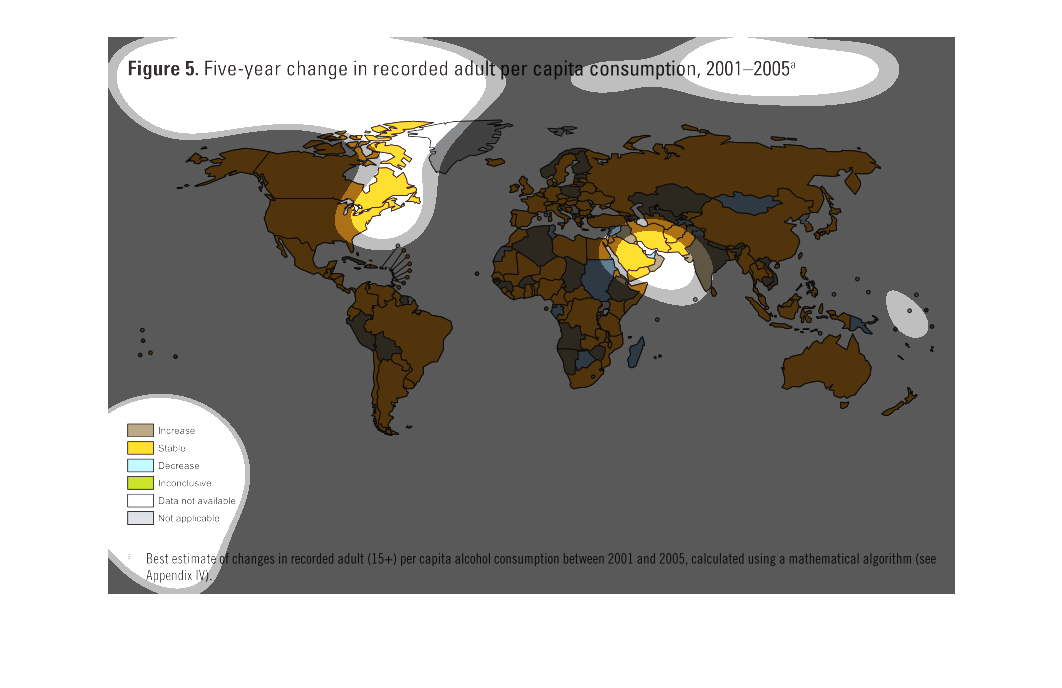
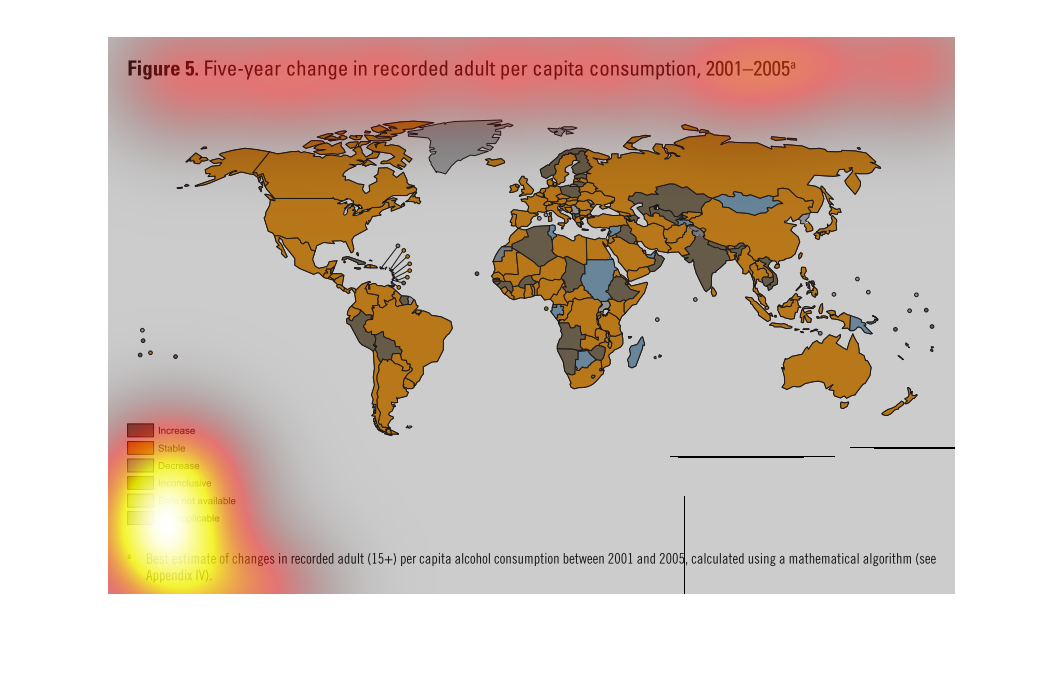
A chart based on data between 2001 and 2005. This chart represents a change in capita per
adult consumption. This chart displays different colors depending if the region has stayed
the same, increased, decreased, is stable, if the results are inconclusive, not applicable,
or if the data is not available. There are portions in each continents that are not applicable
and many that are stable. The United States and Canada are two that appear to be completely
stable, while Europe and Africa appear to have of an Increase compared.
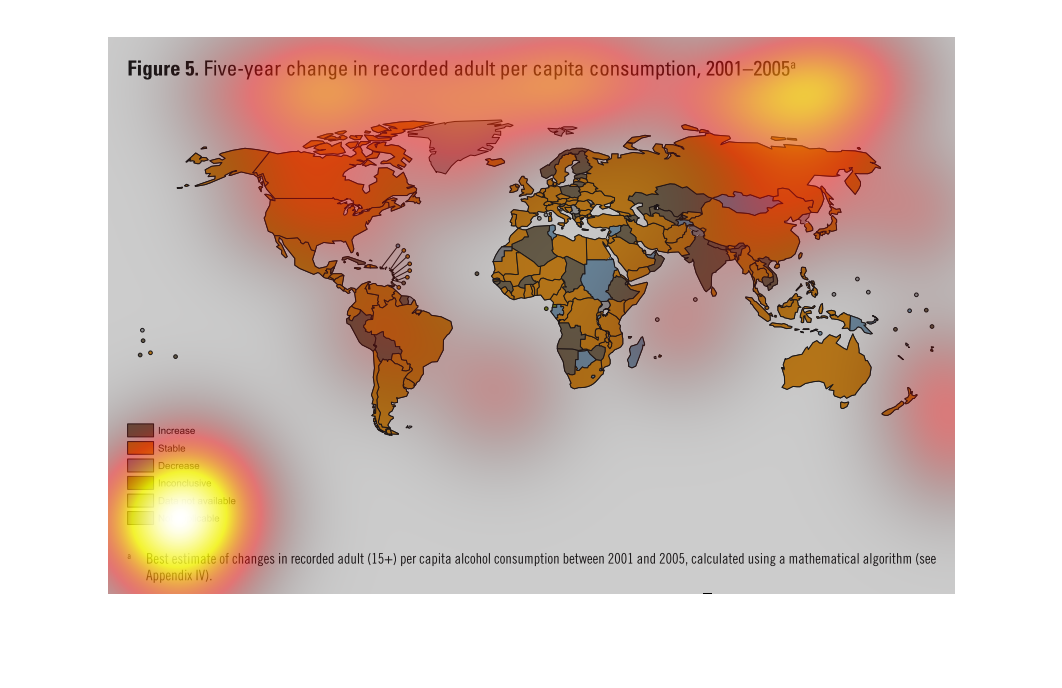
This chart describes the five years change in recorded adult per capita consumption, for the
year years 2001 through to 2005. Different categories on the chart are represented by different
colors.
The image shows a map with the statistics of five year change in recorded adult per capita.
The majority of countries are within  the normal range with very few in the increase.
This is a map that shows that there is a change in the five year period for recorded per capita
consumption for the adult population. It shows all the major continents sampled.
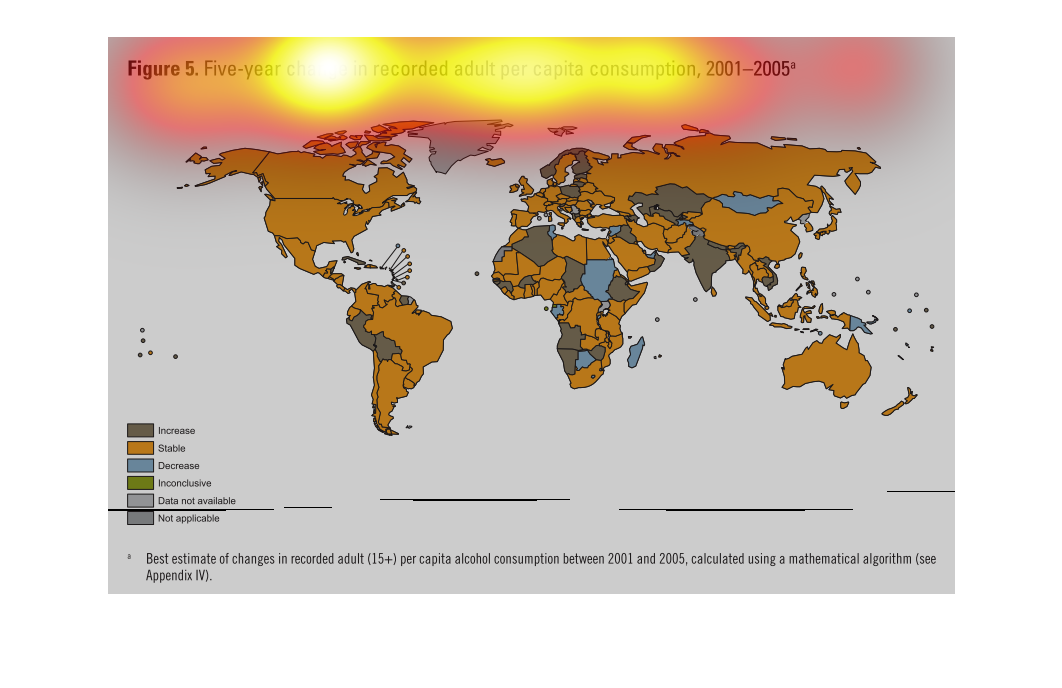
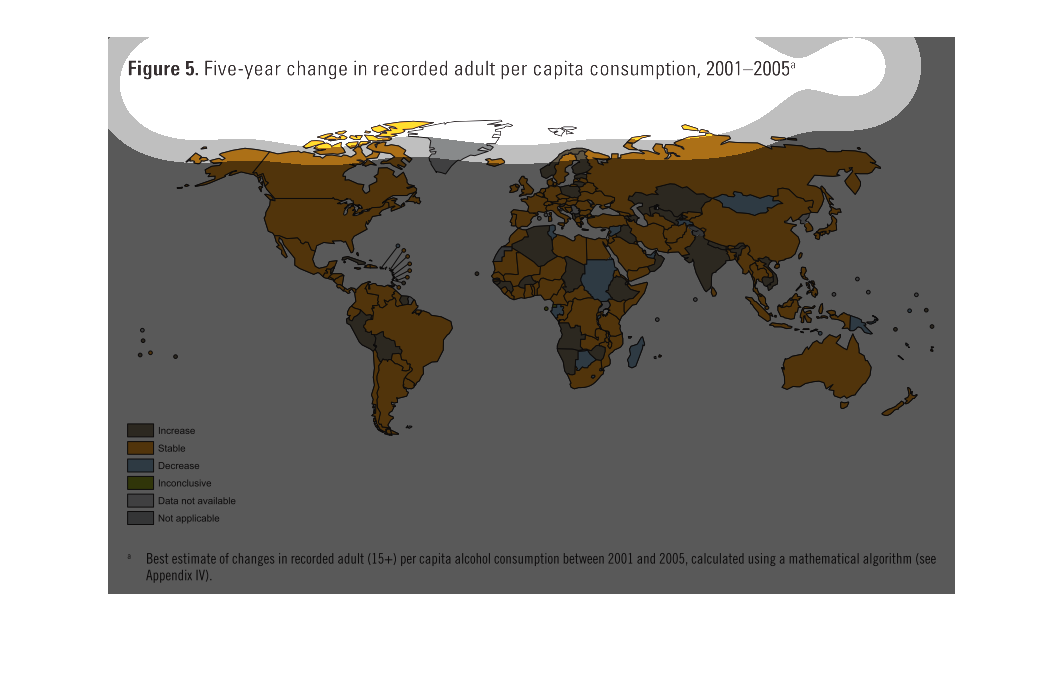
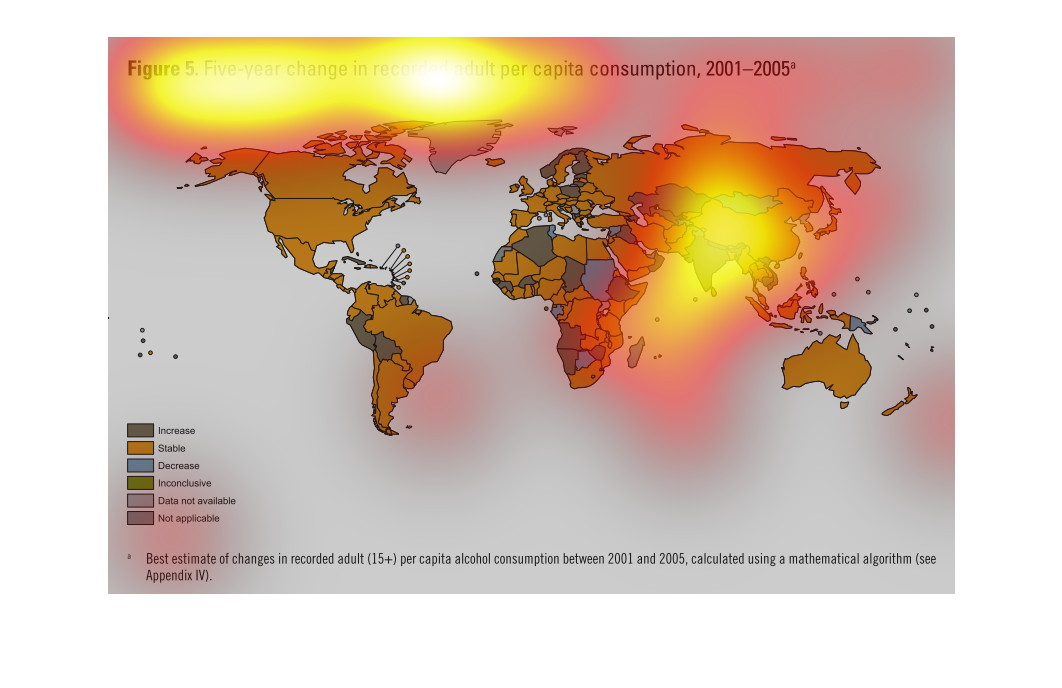
figure 5, five year change in recorded adult per capita consumption, 2001-2005. We see a color
coded map that shows which countries had an increase, stable, decrease, inconclusive, and
no data.Most of the world stayed stable, some african and asian countries saw an increase.
This world map shows the 2001 to 2005 change of consumption in adults, per capita. Each country
is colored, representing an increase, decrease, stability, or inconclusiveness.
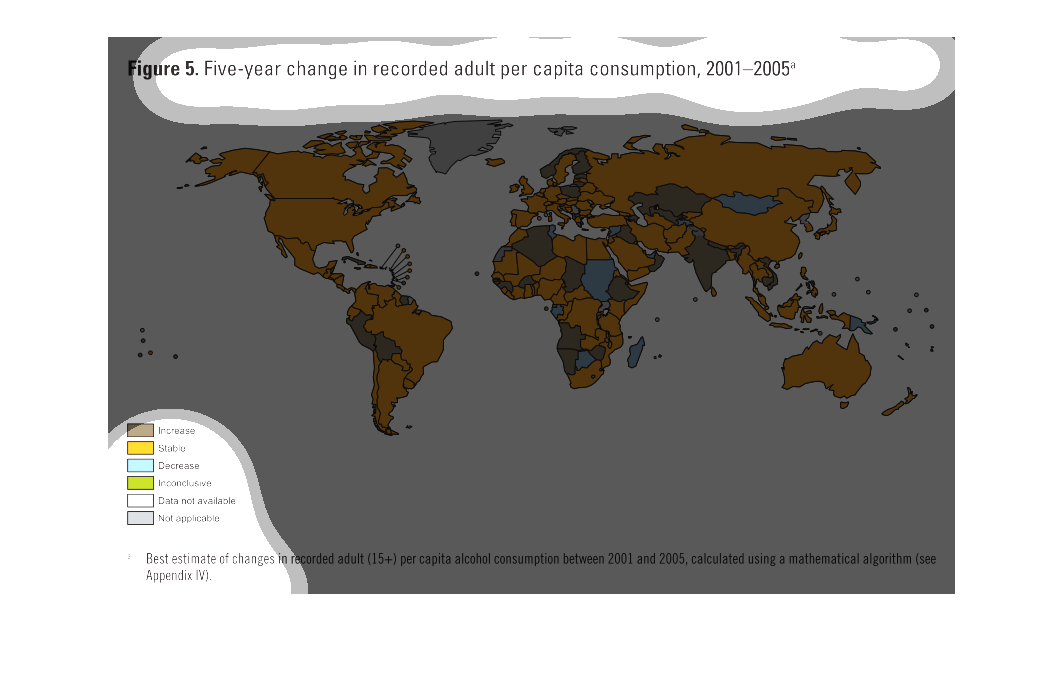
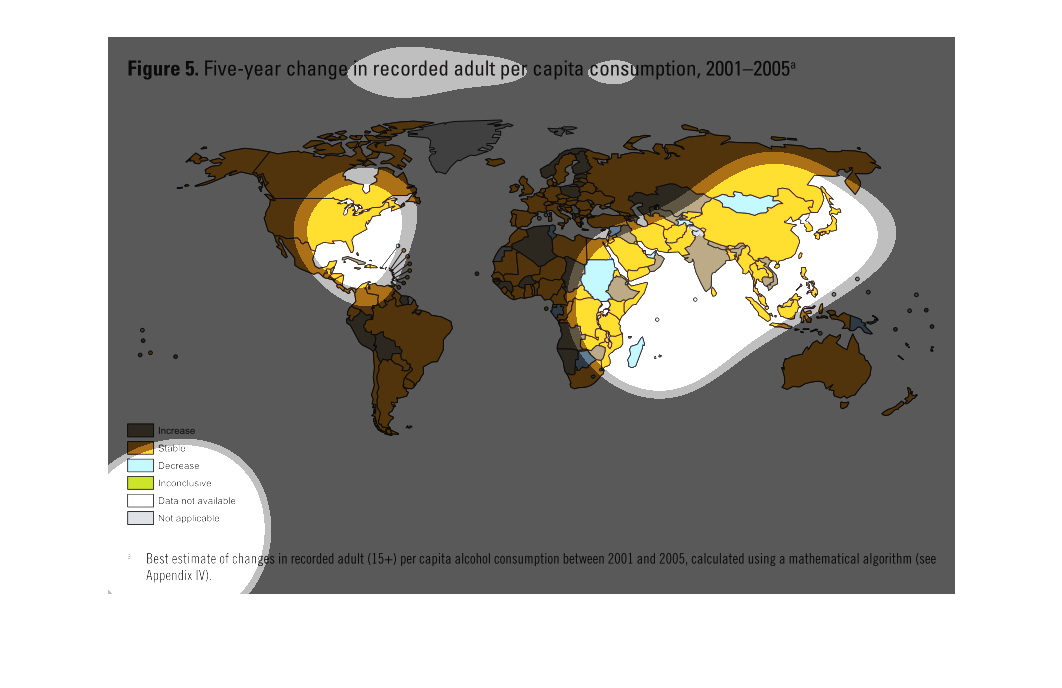
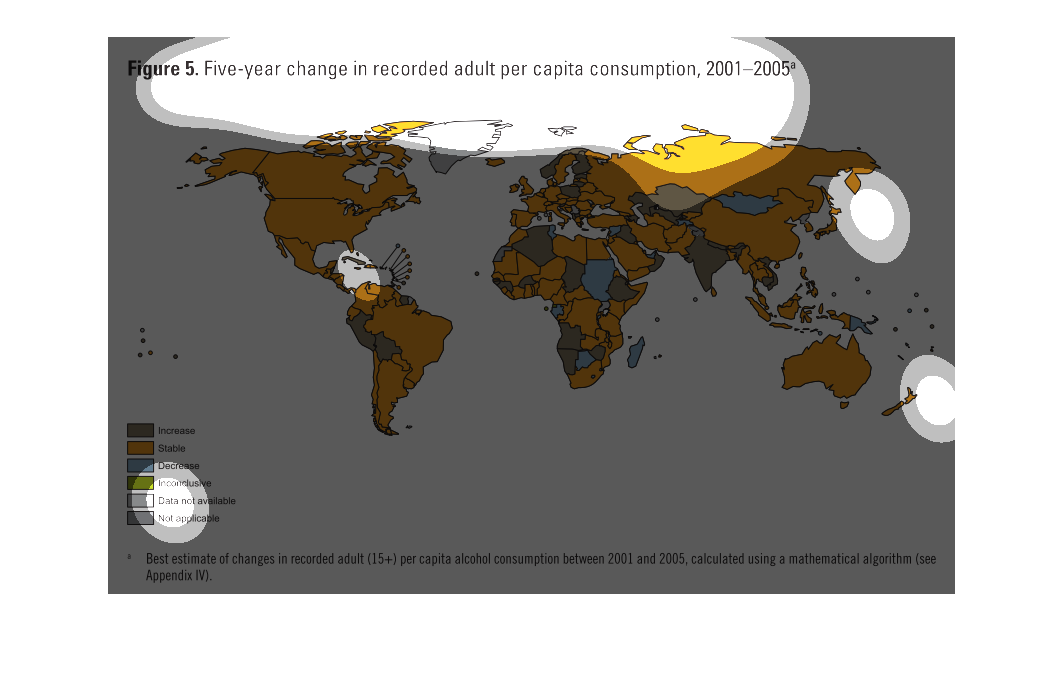
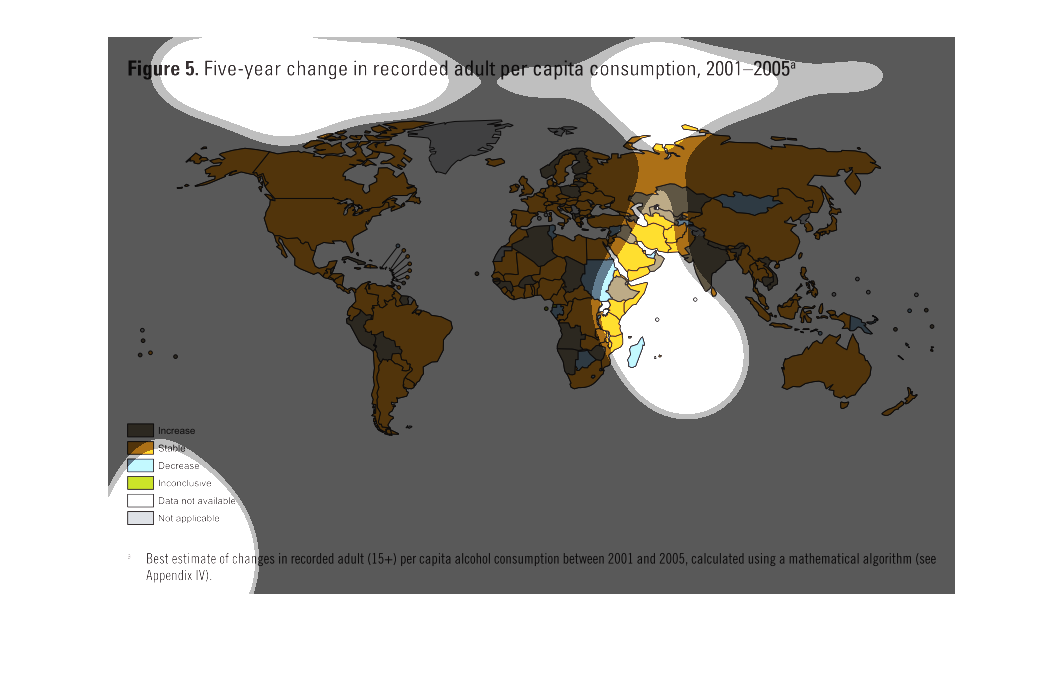
This tracks five years in recorded per capita for adults consumption from 2001-2005. Most
of the world is stable (orange), but there is a decrease in parts of Africa and Mongolia,
and there are scattered increases.
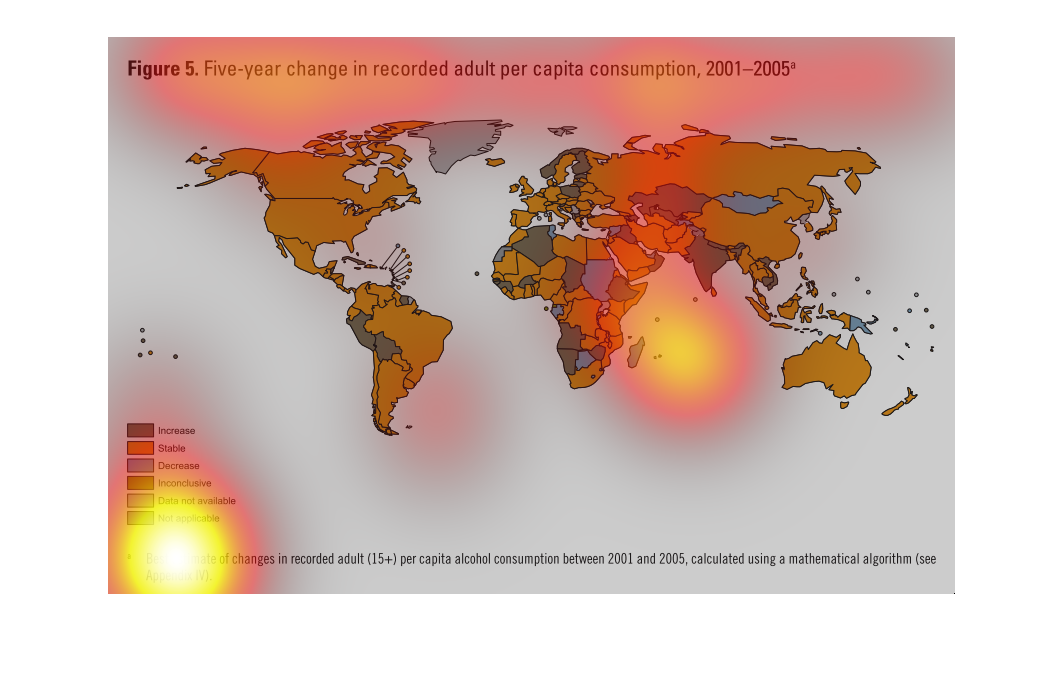
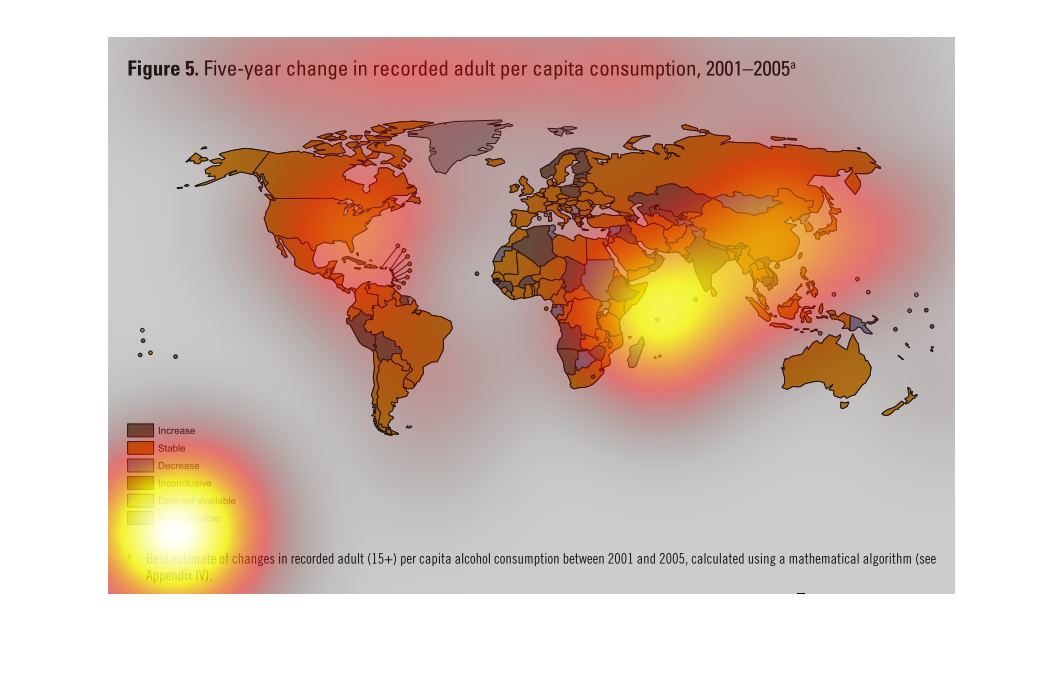
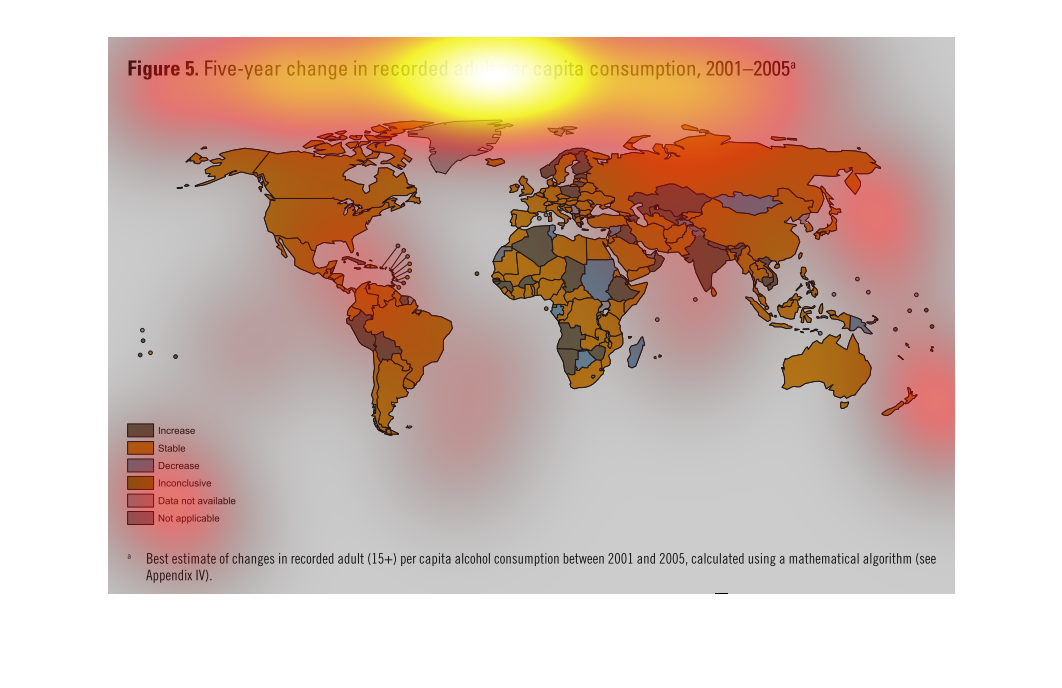
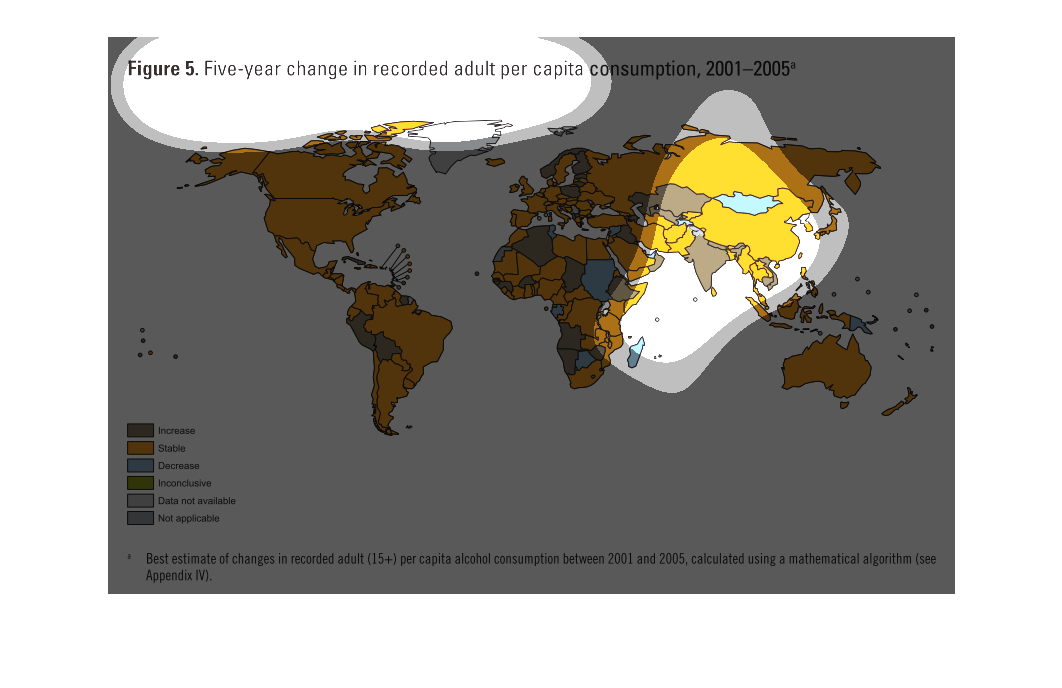
This graph illustrates a world heat map of the five year change in global adult consumption
from 2001 to 2005.  It is color coded with varying levels of changes present.
This is a map of the counties of the world that shows the five year change in recorded adult
per capita consumption from 2001-2005. For the most part the majority of countries are stable.
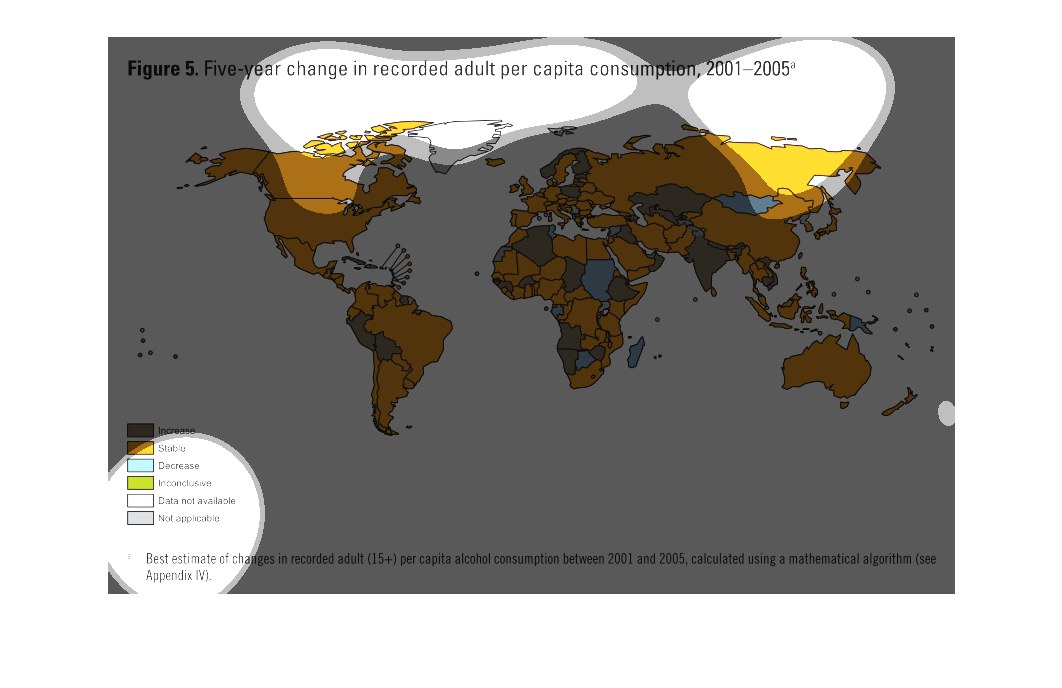
The figure presented is titled figure 5: five-point change recorded adult per capita consumption,
201-2005.  The figure is a representation of five-point changes.