This chart describes prevalence of heavy episodic drinking among past-year male drinkers,
for the years 2004. Different regions on the chart are represented by different colors.
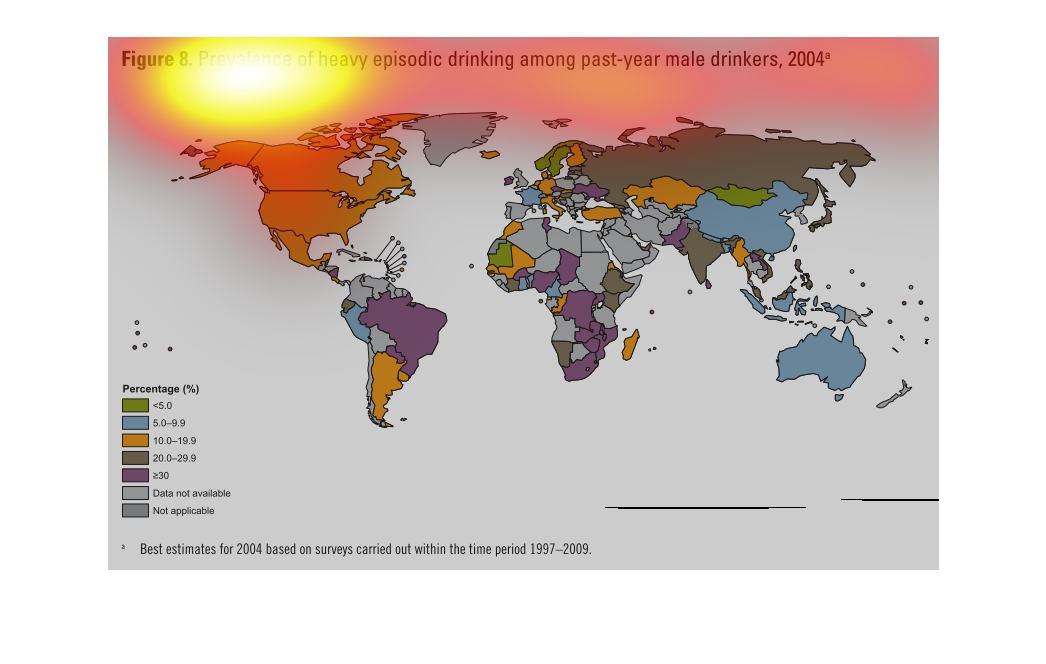
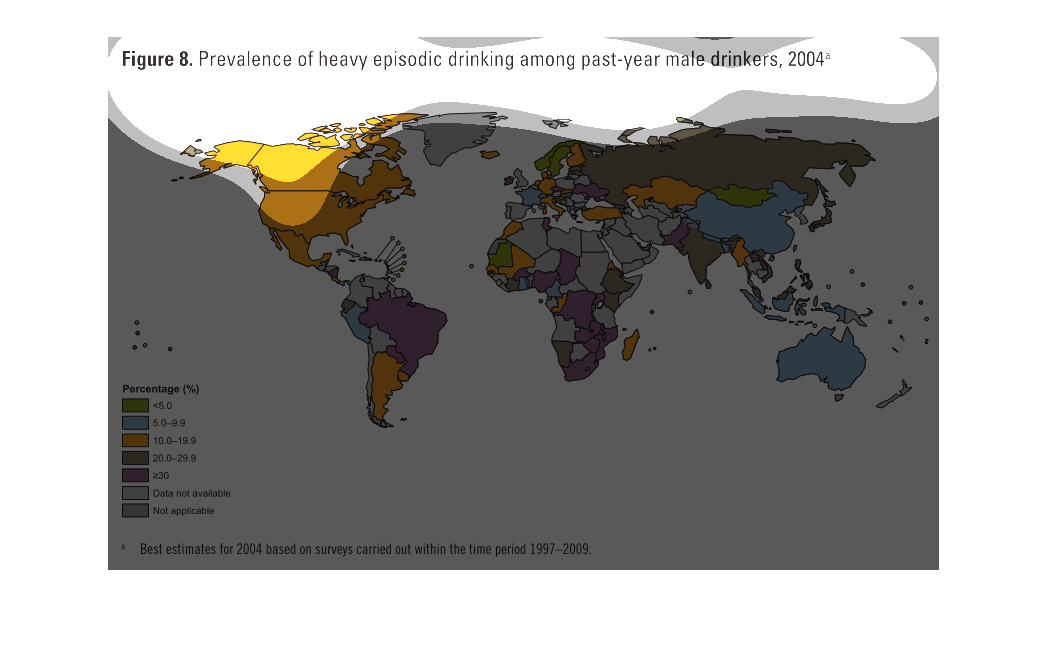
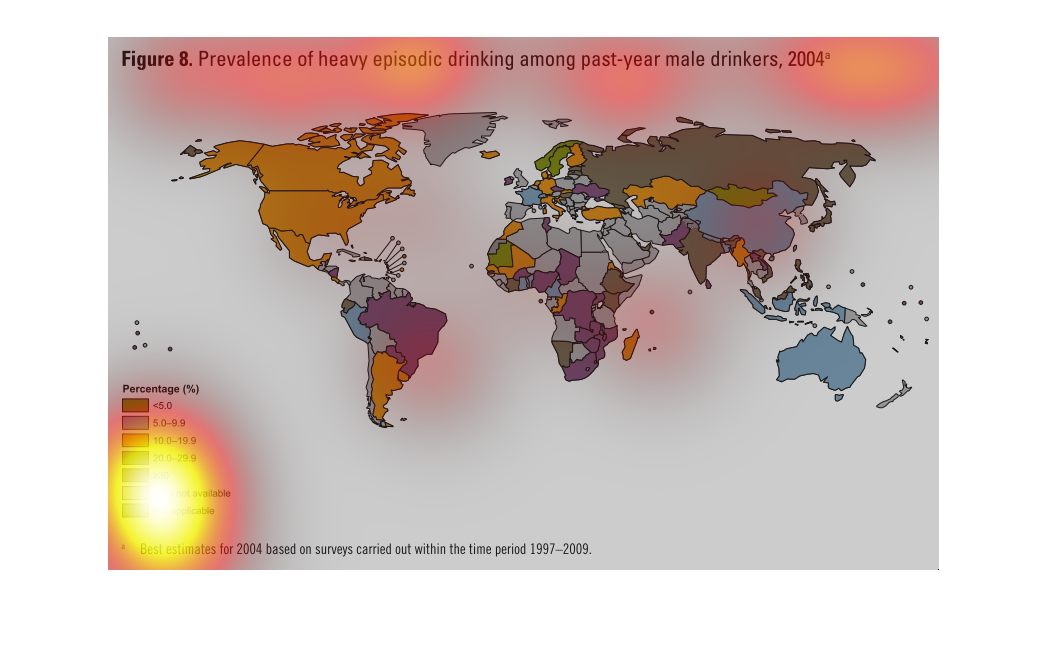
This graph shows the percentages throughout the world in 2004 of heavy episodic drinking among
past-year male drinkers. south america and Africa seem to have the highest percent where Europe
seems to have the least.
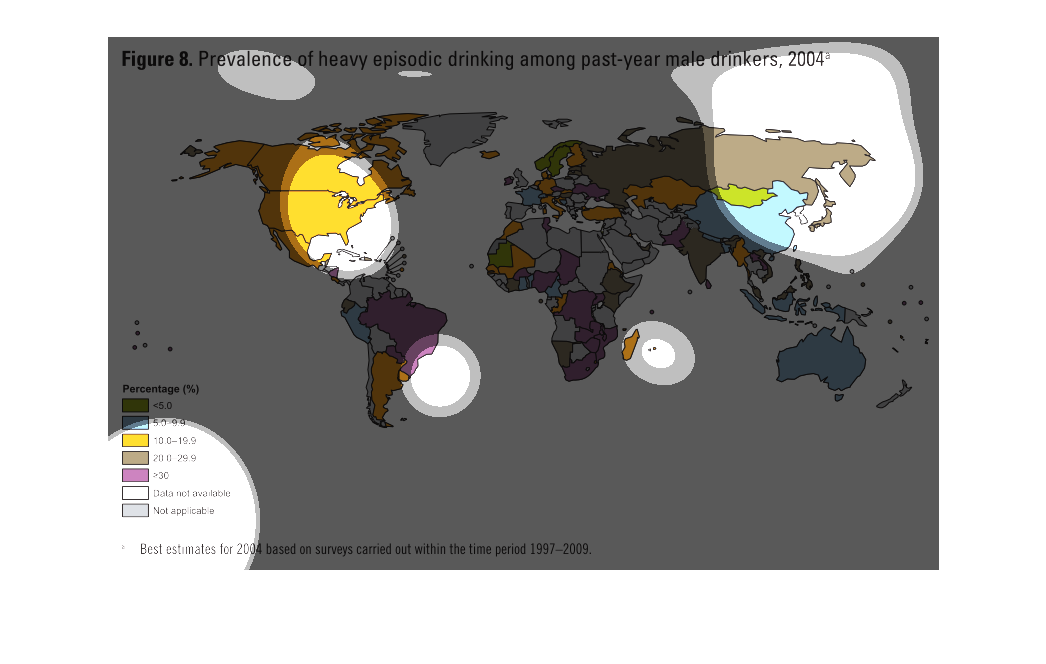
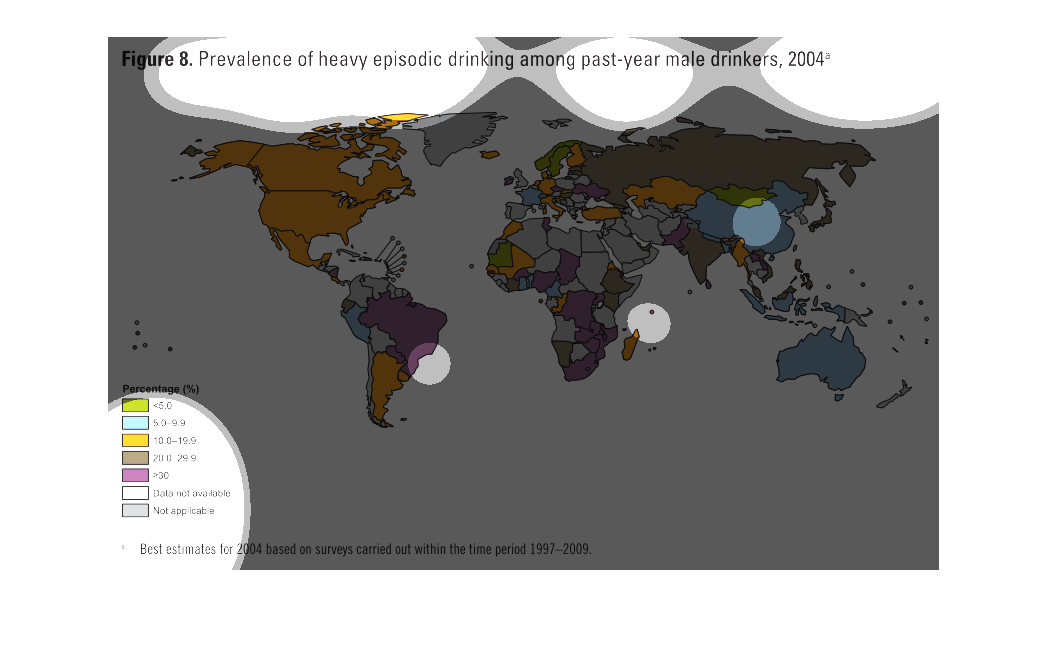
This is a color coded global map depicting the prevalence of heavy episodic drinking among
past-year male drinkers in the year 2004. It shows that overall South America and Africa have
the highest rates.

This is a table showing the prevalence of heavy episodic drinking among past-year male drinkers
in 2004. the highest percentages were in South America and South Africa.
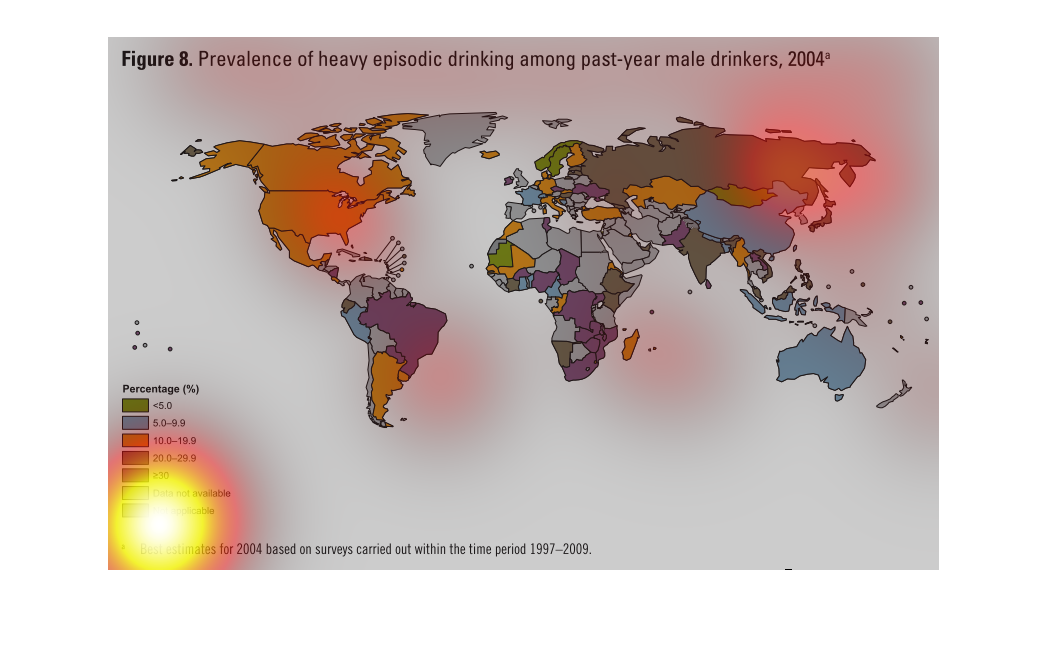
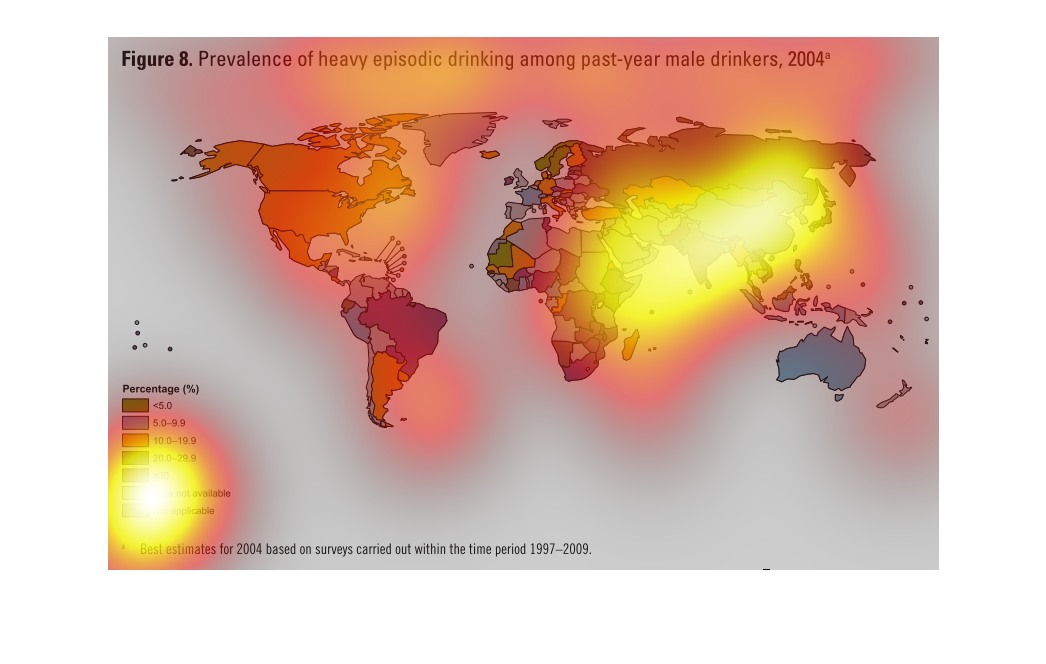
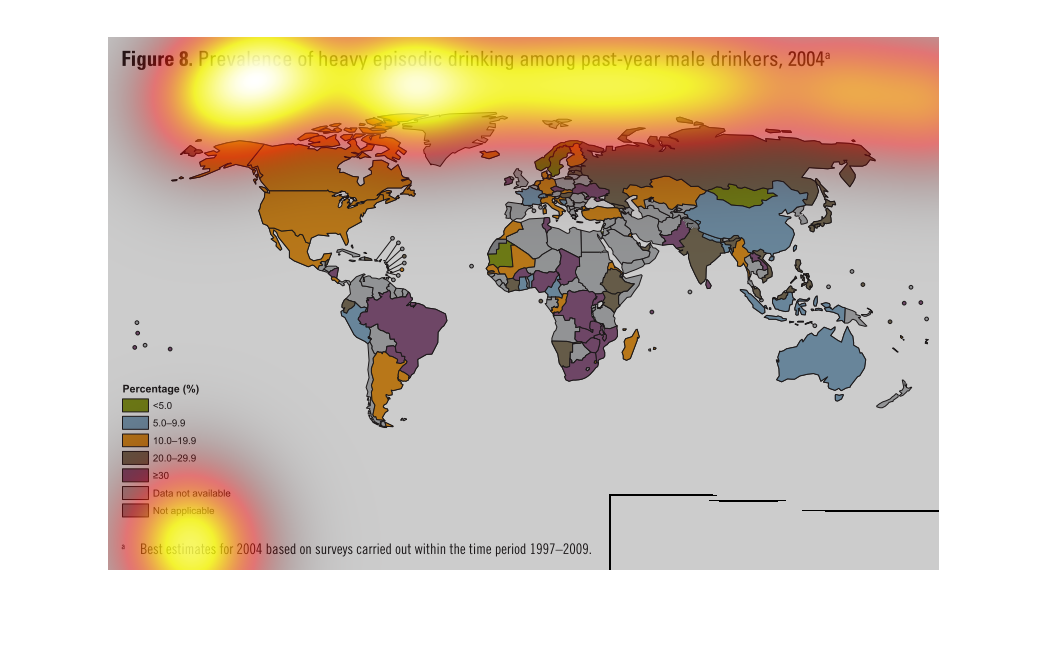
The image depicts the prevalence of heavy episodic drinking among past-year male drinking,
2004. US/Canada seem to be somewhere around average in terms of episodic drinking, with Russian
numbers slightly higher, and parts of Africa and South America having much higher numbers.
This world map shows the prevalence of heavy drinking among male past-year drinkers, from
2004. Each nation is shaded, denoting a percentage of drinkers worldwide.
This chart describes prevalence of heavy episodic drinking among past year male drinkers,
for the year 2004. Categories are represented by different colors.
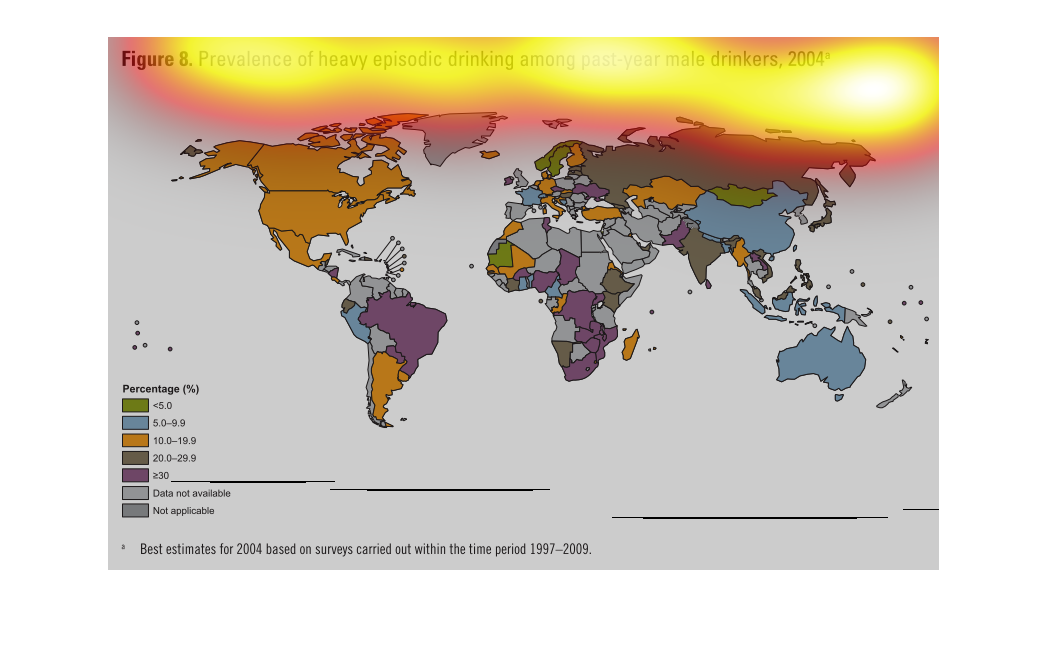
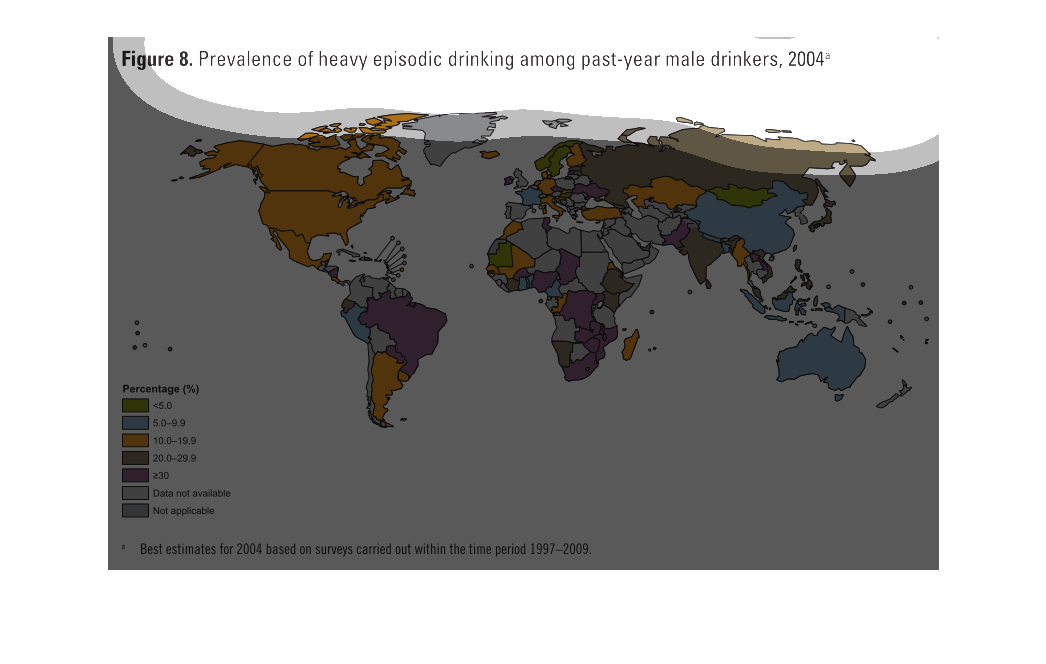
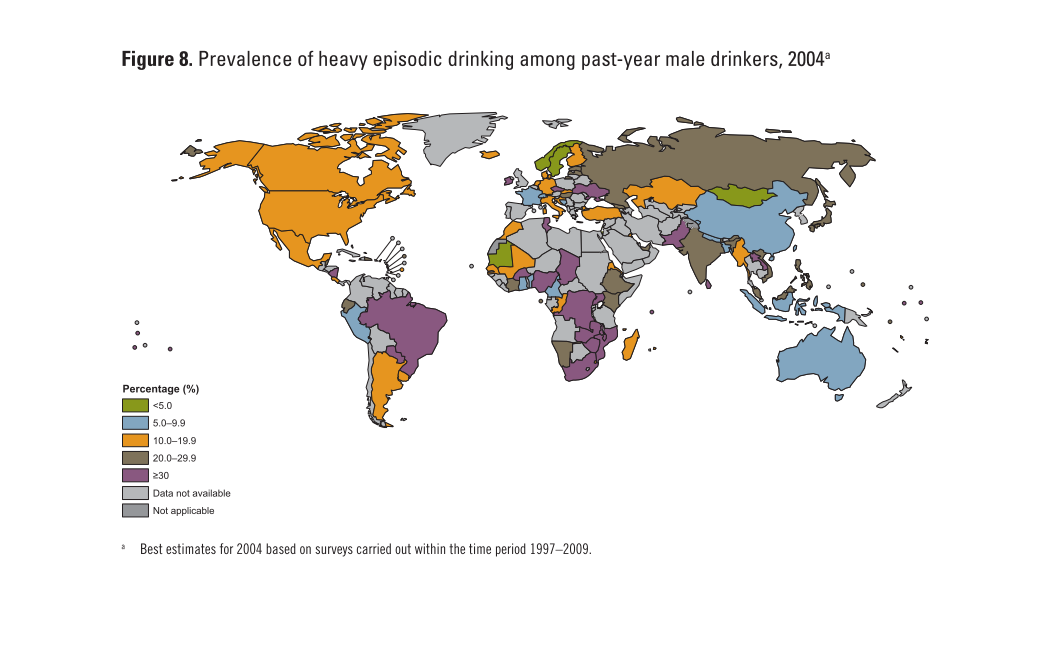
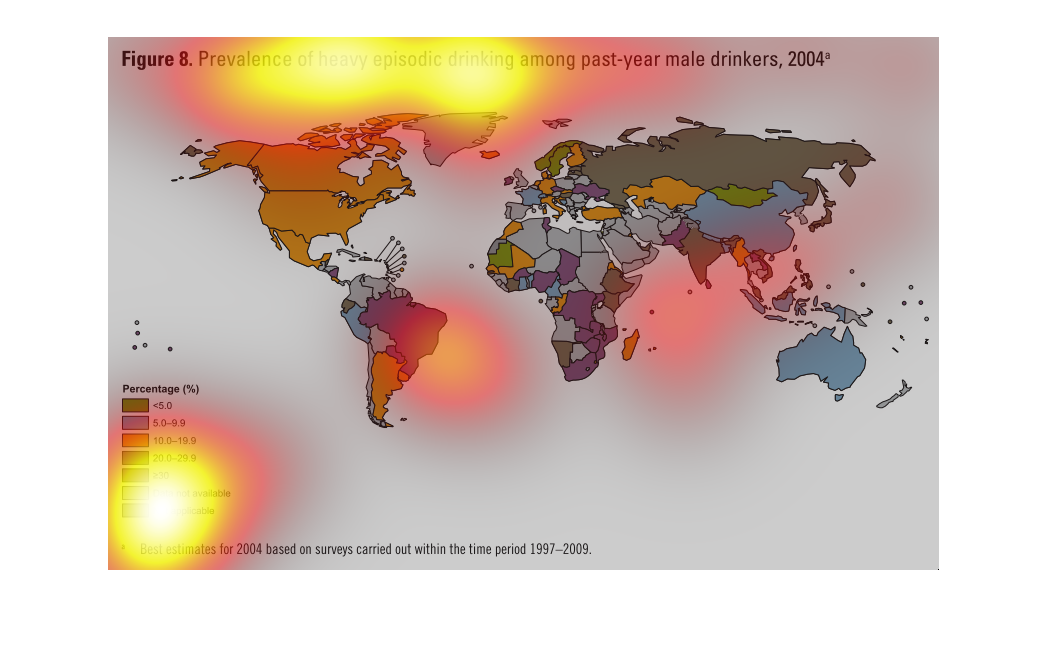
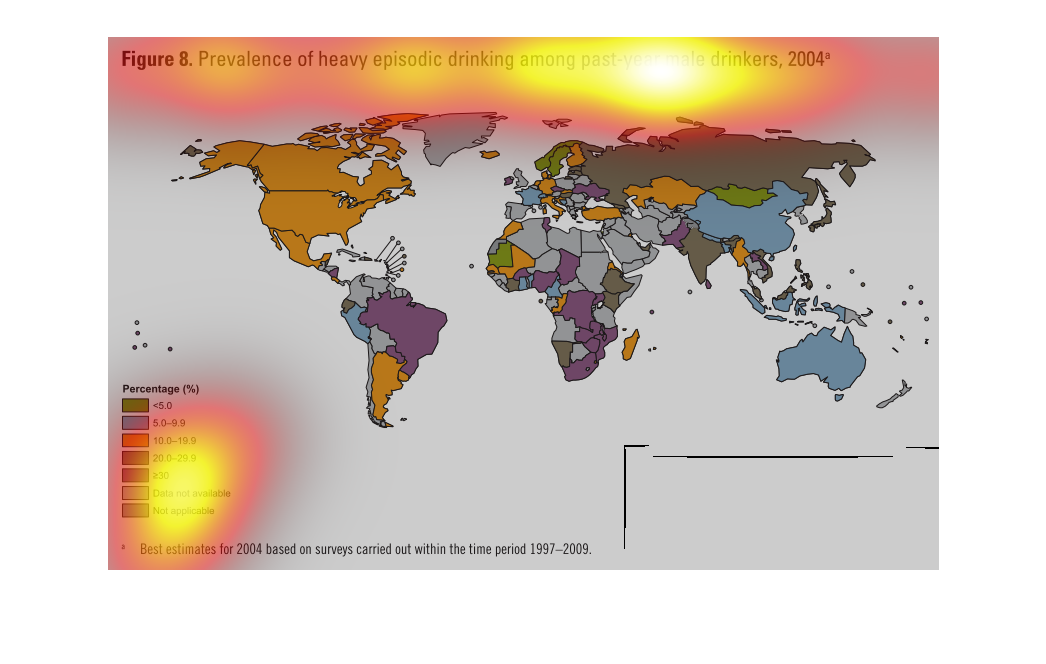
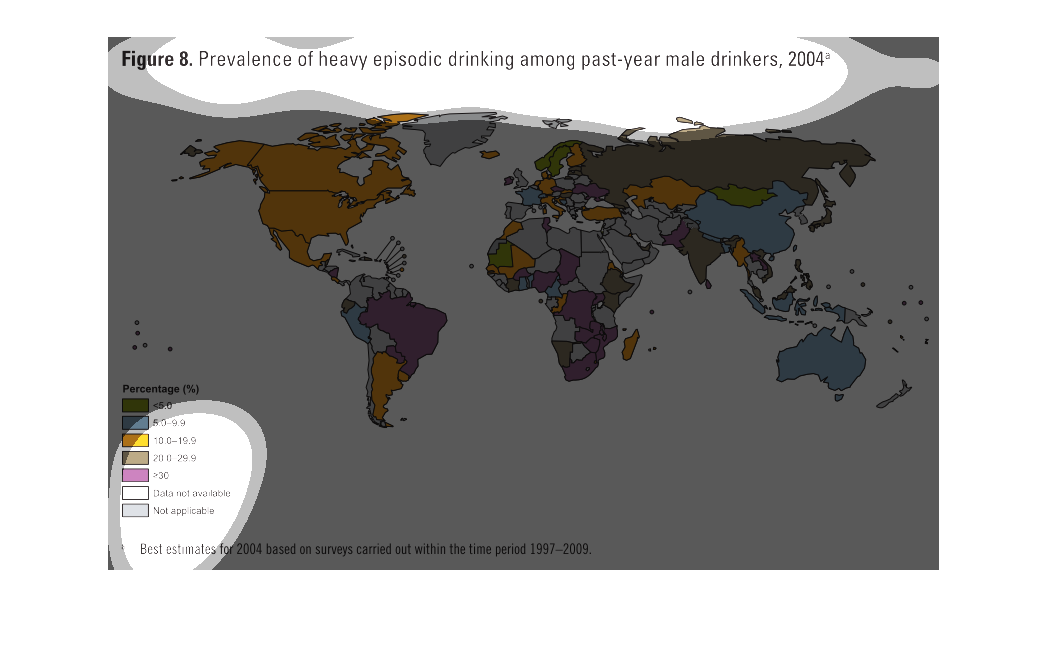
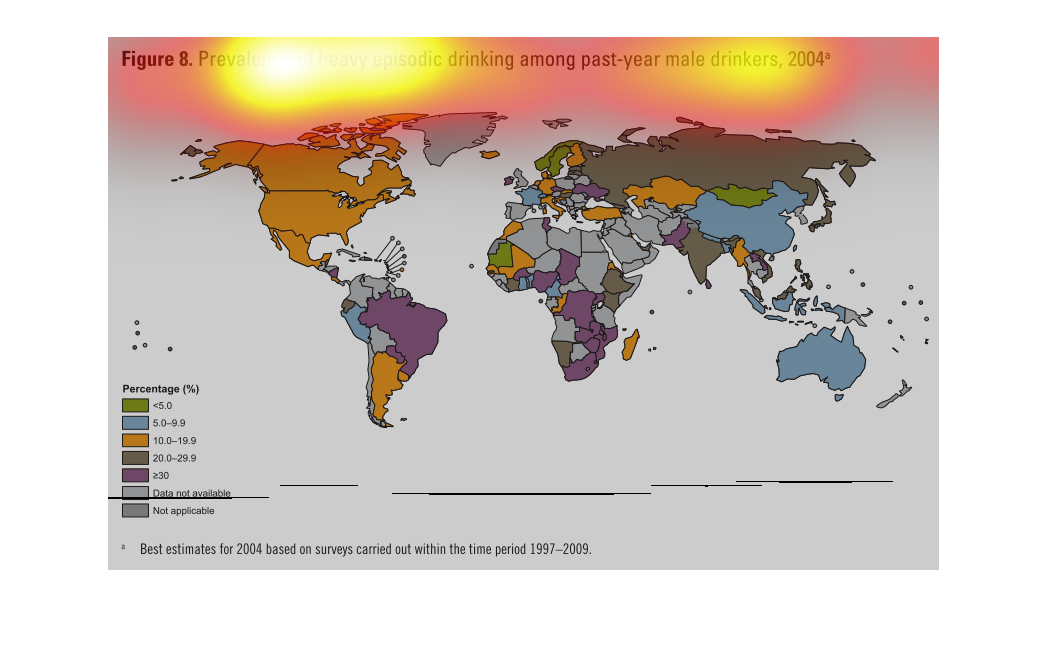
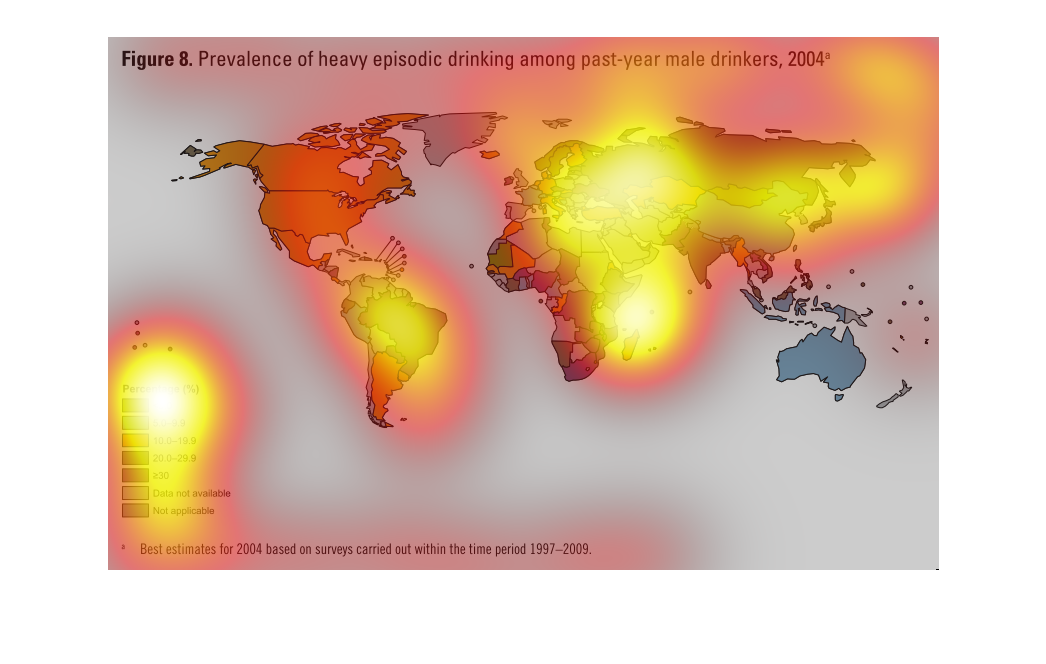
The figure presented is titled Figure 8: prevalence of heavy episodic drinking among past-year
male drinkers, 2004.  The figure represents the prevalence of drinking.
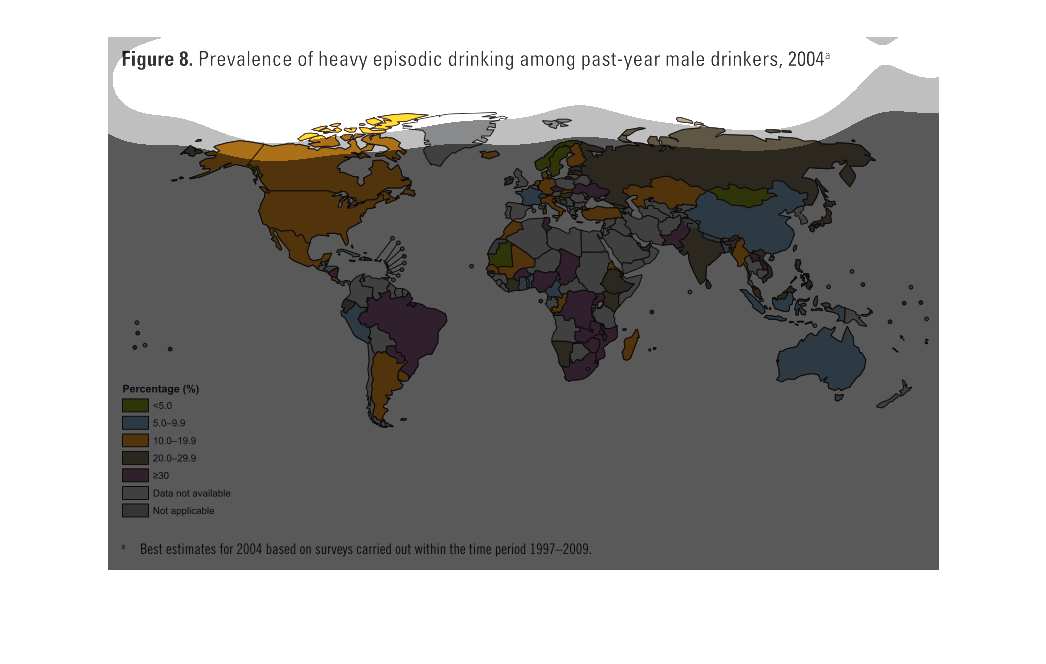
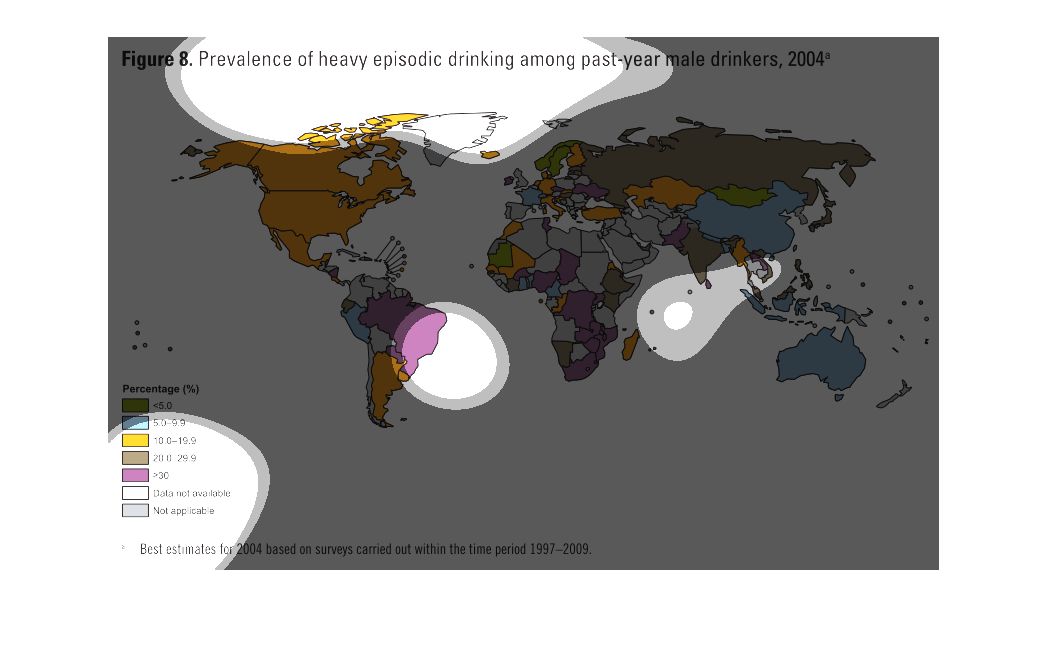
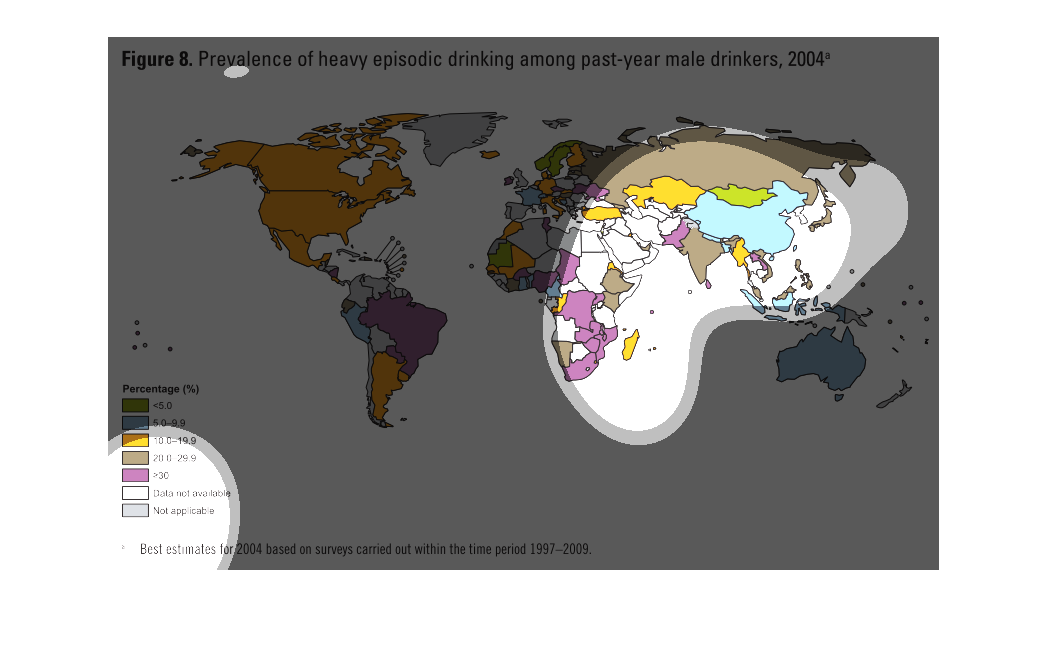
This world-wide chart shows the prevalence of heavy episodic among past-year male drinkers
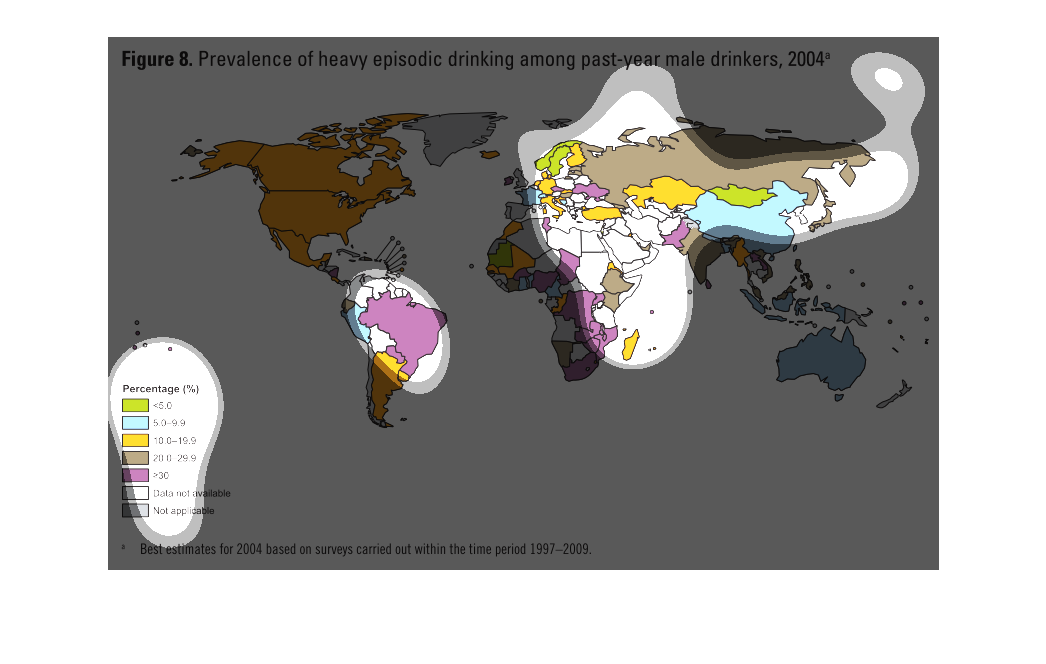
in 2004. North America had 10-19%, while some parts of South America had >30%. Asia had 5-9%.
Areas in Europe and northern Africa had some of the lowest rates <5%.
prevalence of heavy episodic drinking among past year male drinking as of 2004. America his
consistently high but parts of Africa and South America were the highest
these map shows the percentage of prevalence of heavy drinker of episodic drinking among pass-year
male drinker. Each color corresponds to specific percentage.
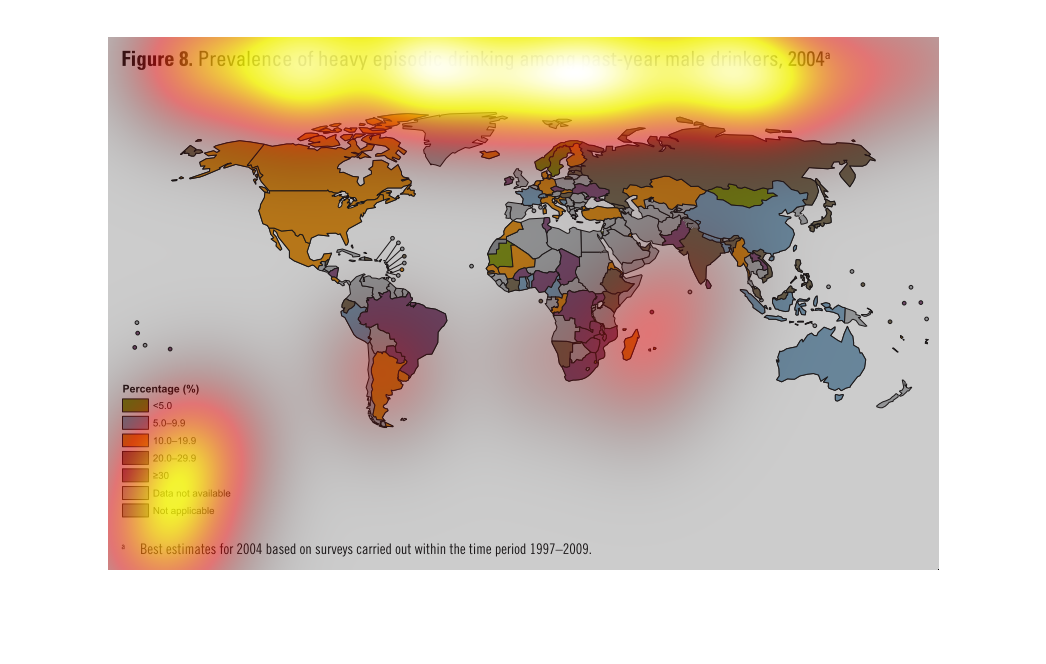
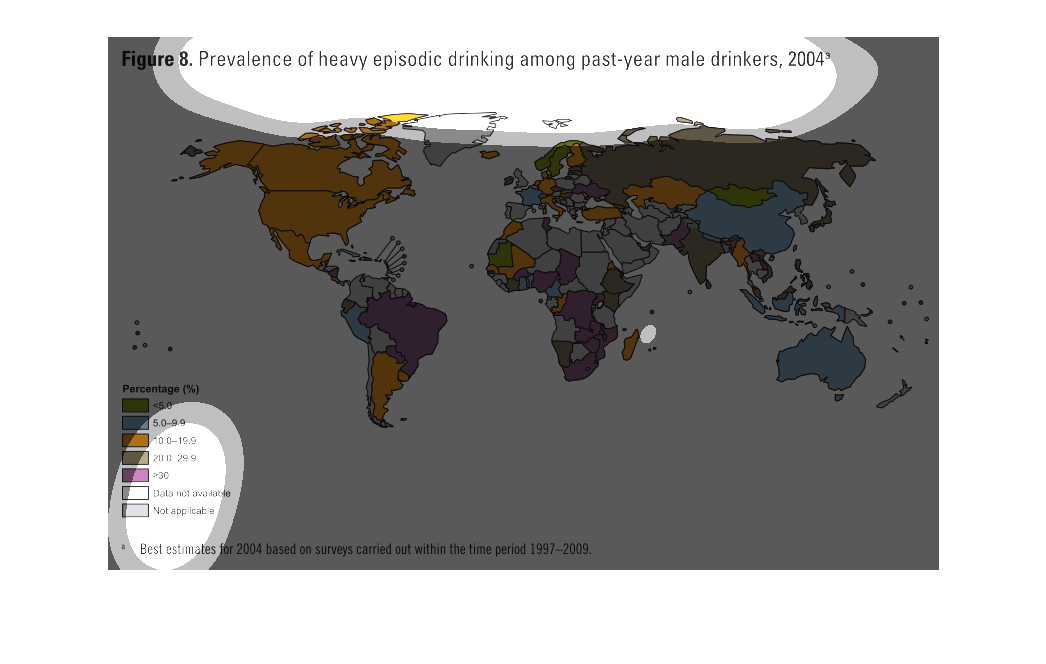
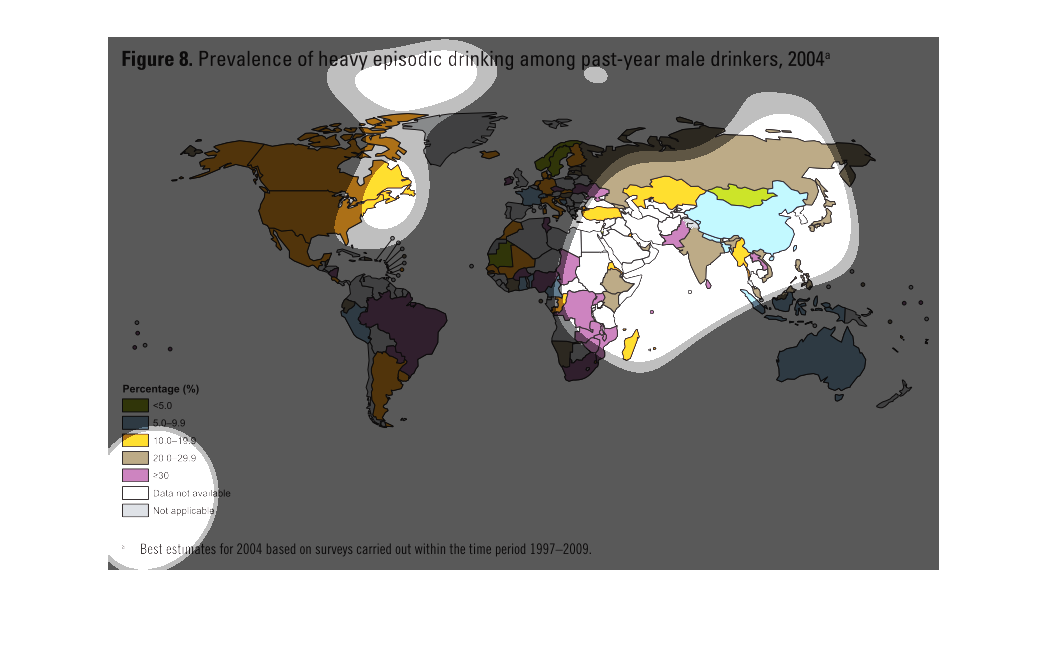
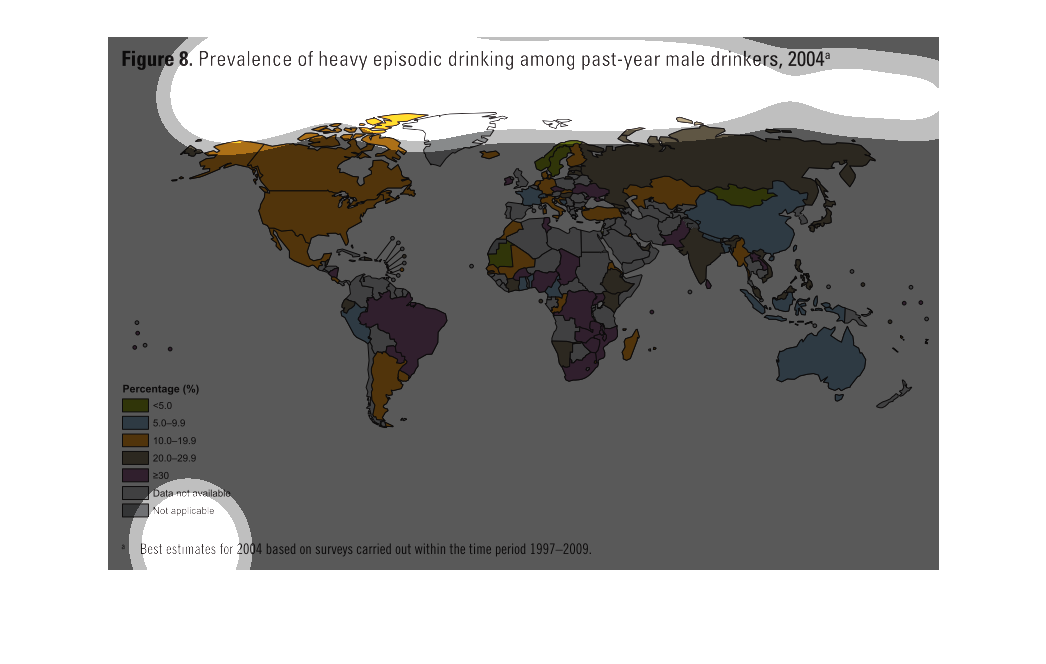
figure 8 prevalence of heavy episodic drinking among past year male drinkers, 2004. Color
keyed map of the world. Most commonly seen in some african countries, brazil, followed by
russia, india, japan, america, some of europe and then the rest of the world
This world map denotes the percentage of heavy drinking among males, from 2004, as a past
year report. Nations are color coded and shaded by percentages.
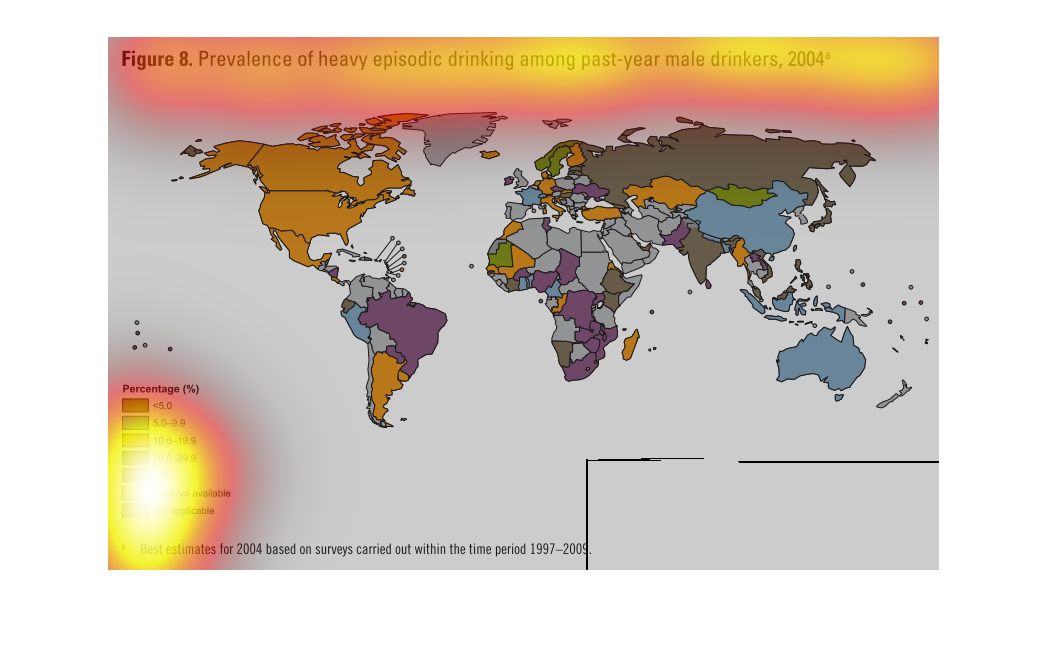
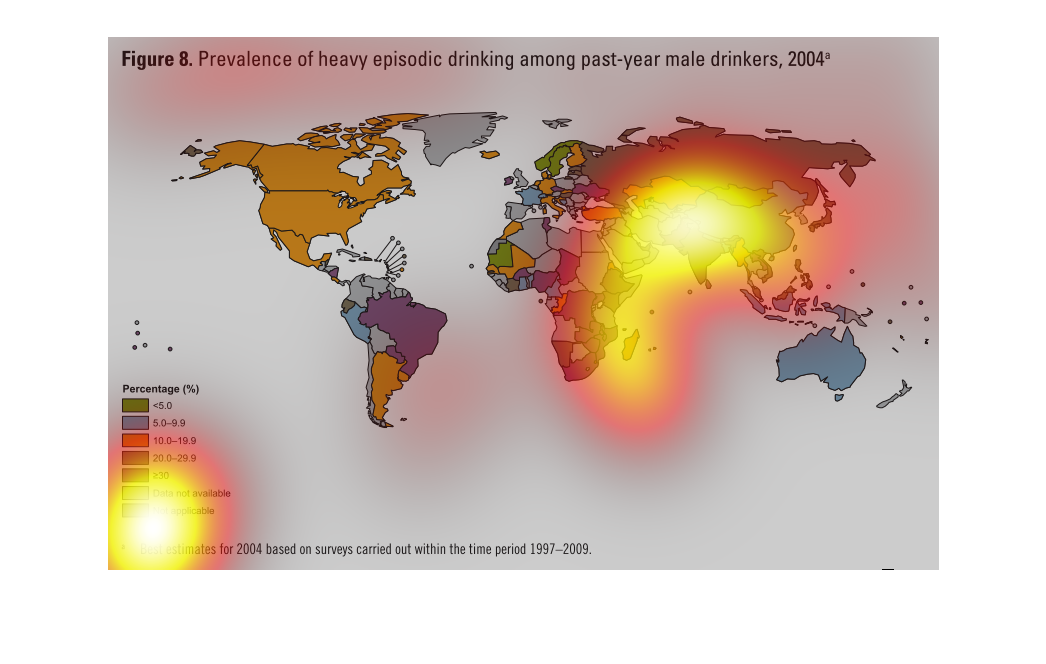
Prevalence of heavy episodic drinking among past-year male drinkers in 2004. Countries are
shown colored by percentage, beginning with less than 5% and ranging up to equal or greater
to 30%.  Some countries do not have data available and some are not applicable.  The percentages
are based upon surveys carried out between 1997-2009.  Countries in South American and Africa
had high percentages, along with a few European countries.
It's a map of the world with all countries color coded based on the percentage of the prevalance
of heavy episodic drinking among past year male drinkers in 2004