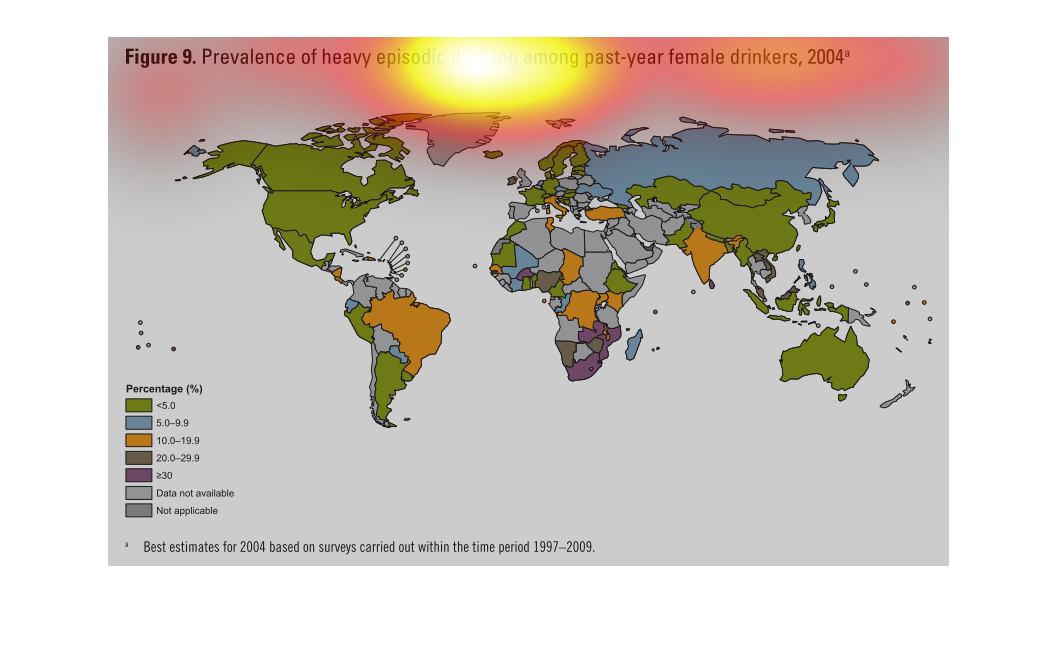
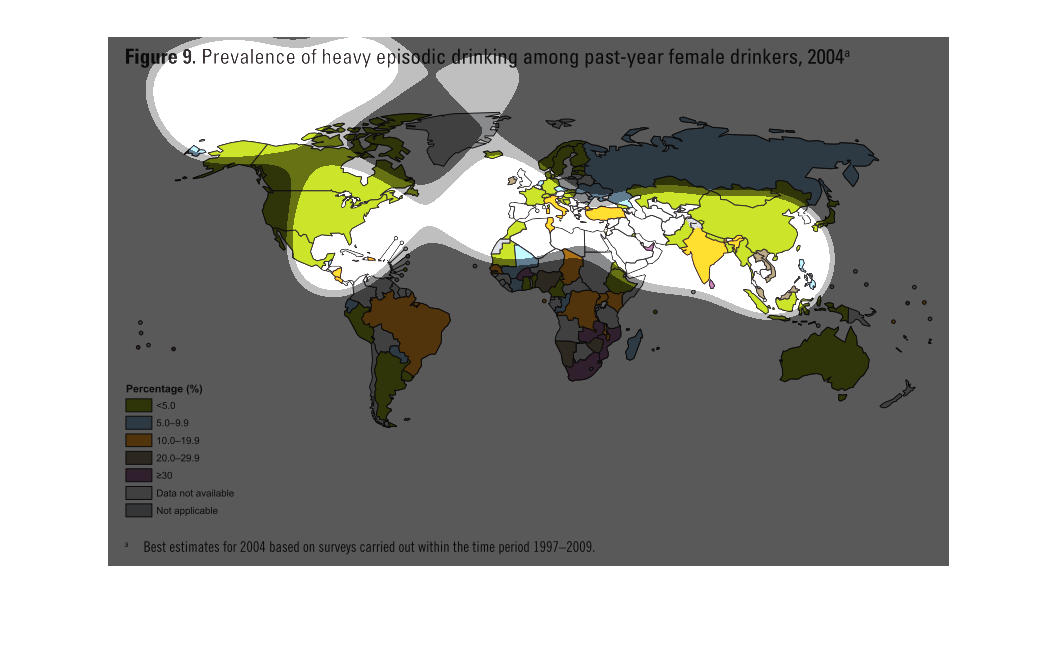
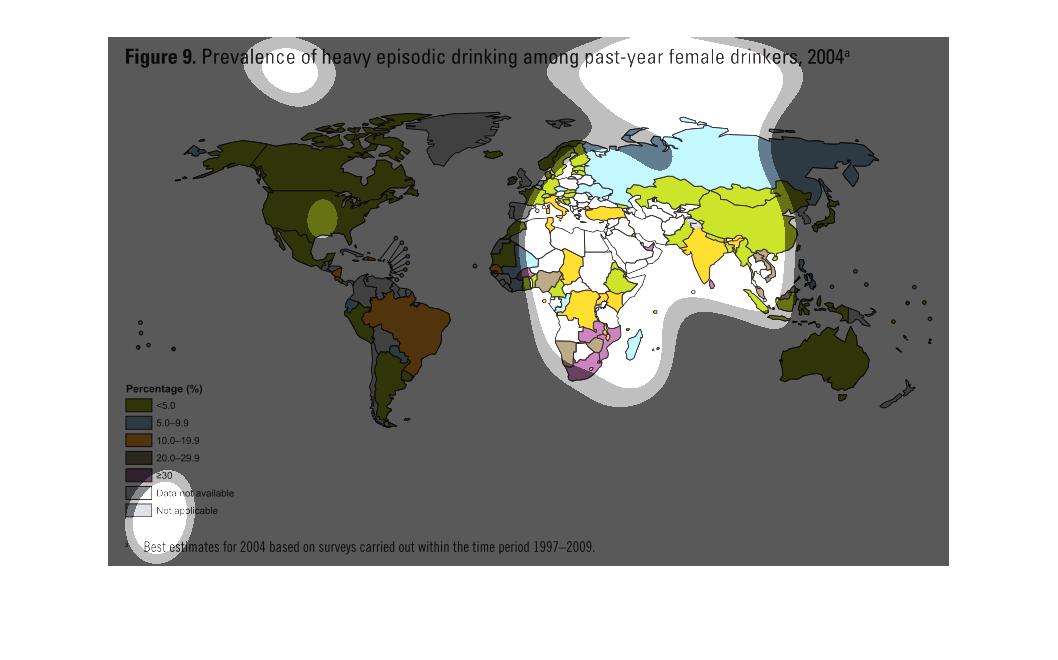
figure 9 prevalence of heavy episodic drinking among past year females drinking, 2004. we
see a color coded map of the world that us color coded according to a key, highest occurrence
in westernized countries, all of north america australia, europe and parts of asia
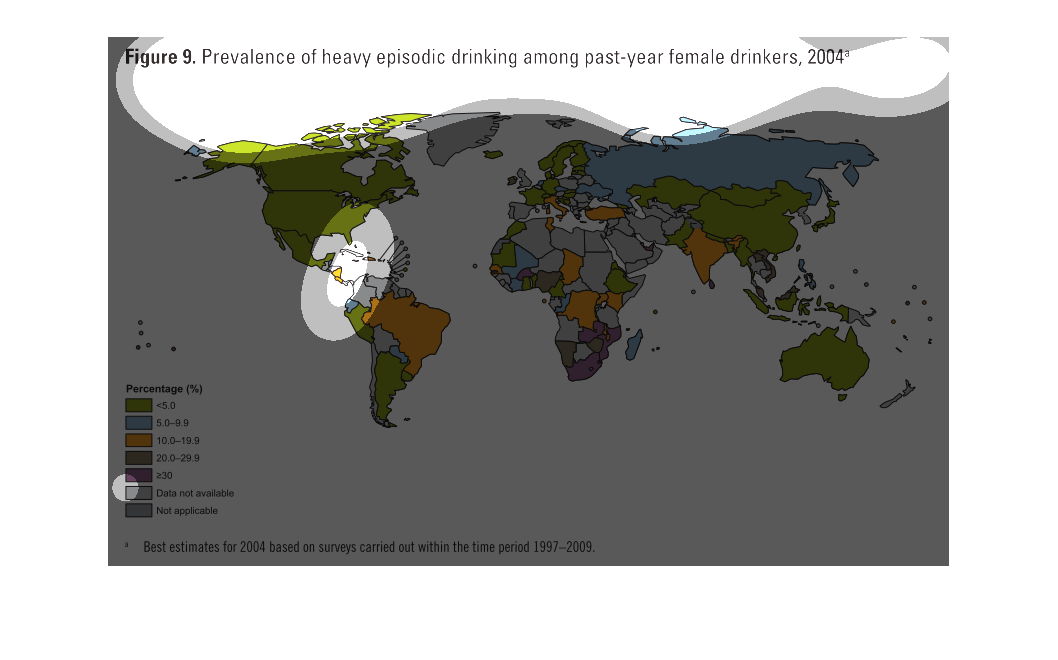
The image is a map of the world. It presents data on heavy episodic drinking amongst females
in the year 2004. It uses color to visualize the data for each country. Different shades of
color represent different percentage amounts. Without clicking on the entire earth to reveal
data it appears that Russia has a low percentage of female episodic drinking while China,
Australia and both Americas have higher instances. Africa appears to have the highest percentage.
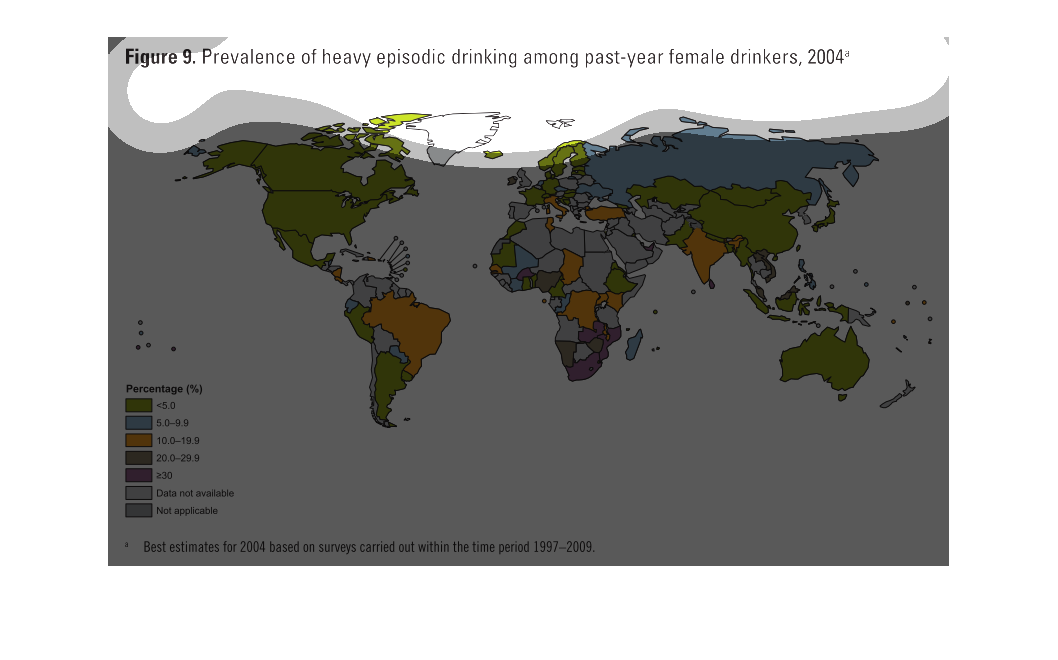
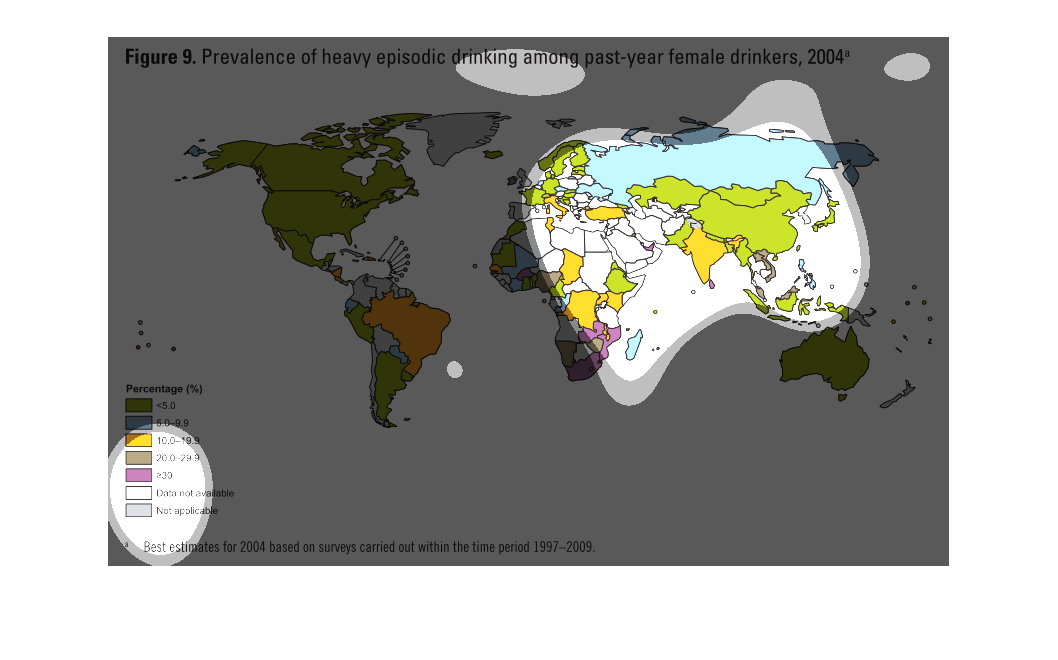
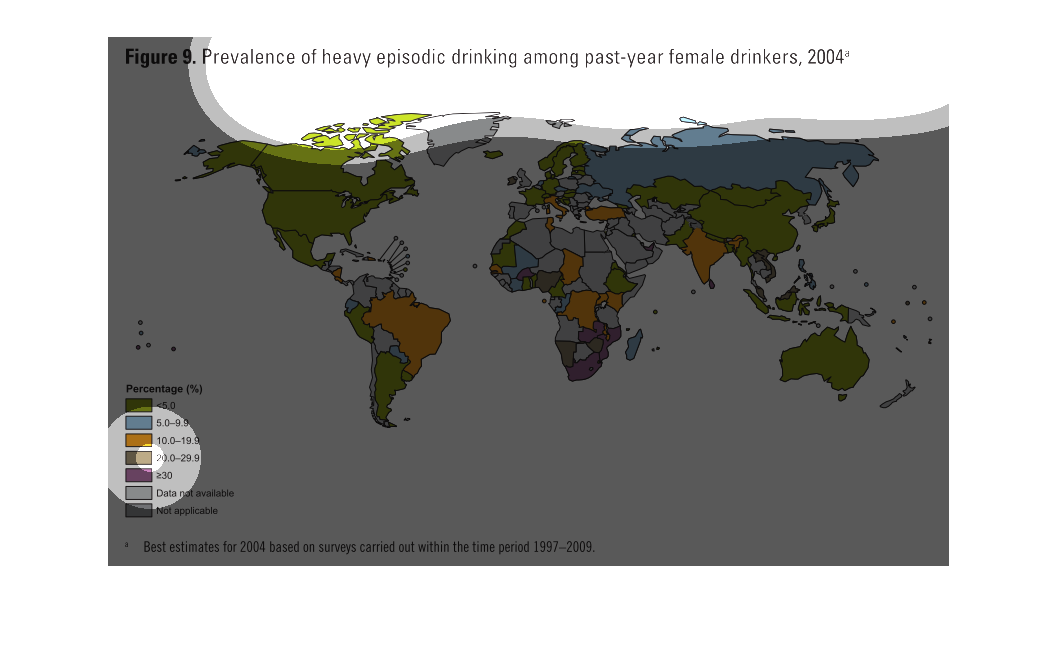
Figure 9 shows the prevalence of heavy episodic drinking among past year female drinkers in
2004. This phenomenon appears to occur mainly in North America, Europe and Russia.
This study- conducted in 2004- is trying to show- by region- the deaths of females because
of alcohol during the span of that year, by age and demographic.
The chart shows the prevalence of heavy episodic drinking among past year female residents
throughout the globe in the year 2004.  The highest concentration is in southern Africa.
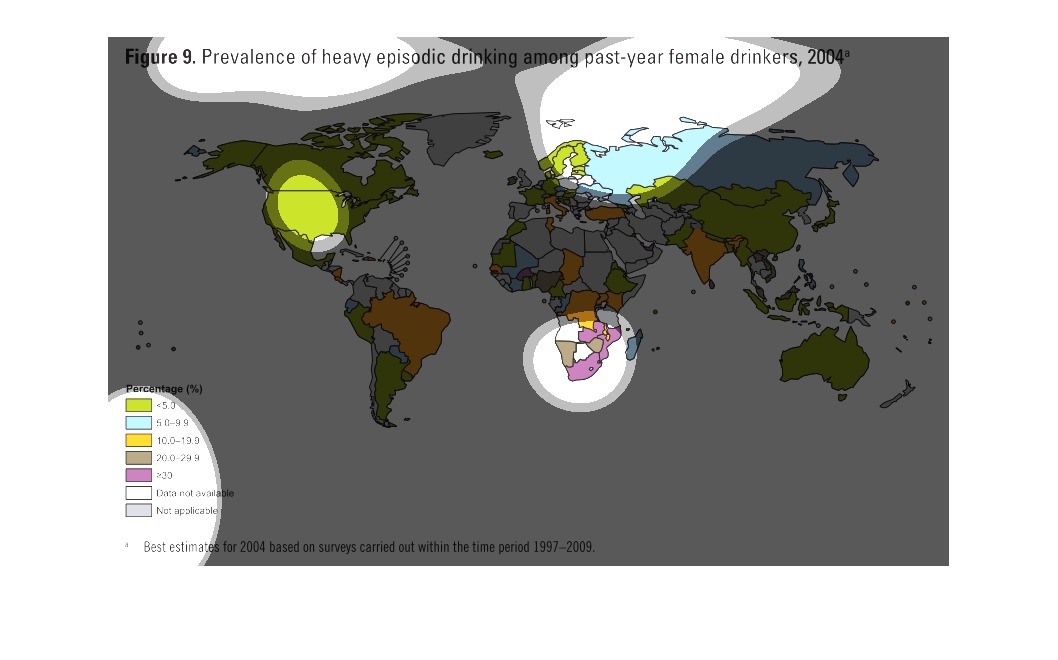
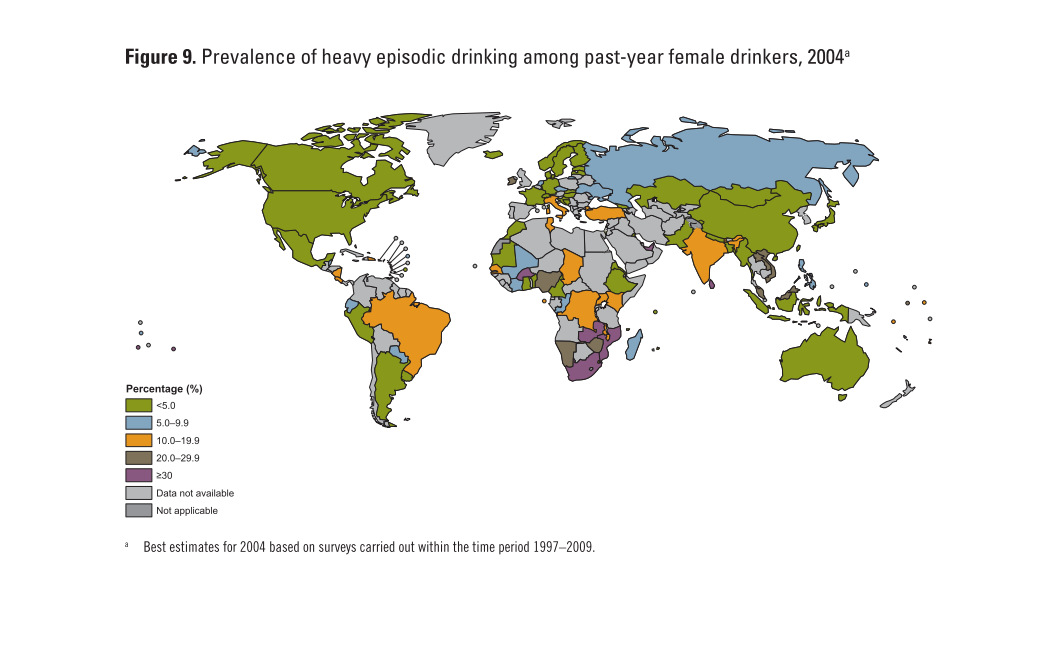
This chart represents data of heavy female drinkers, in 2004. The U.S. appears to be among
those in the 5.0 category or less. Africa appears to be in the 10.0 to 19.9 category, which
is quite larger than the U.S. and Europe. The highest female drinkers appear to be on the
south coast of Africa, at or over 30.0. The other portions of Africa appear not be applicable.
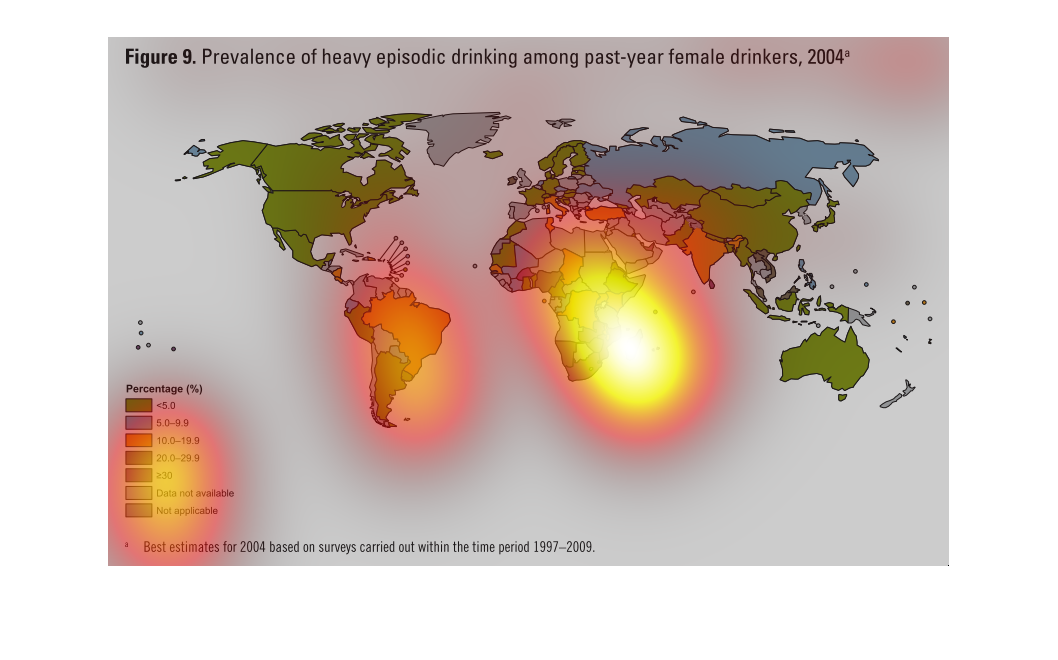
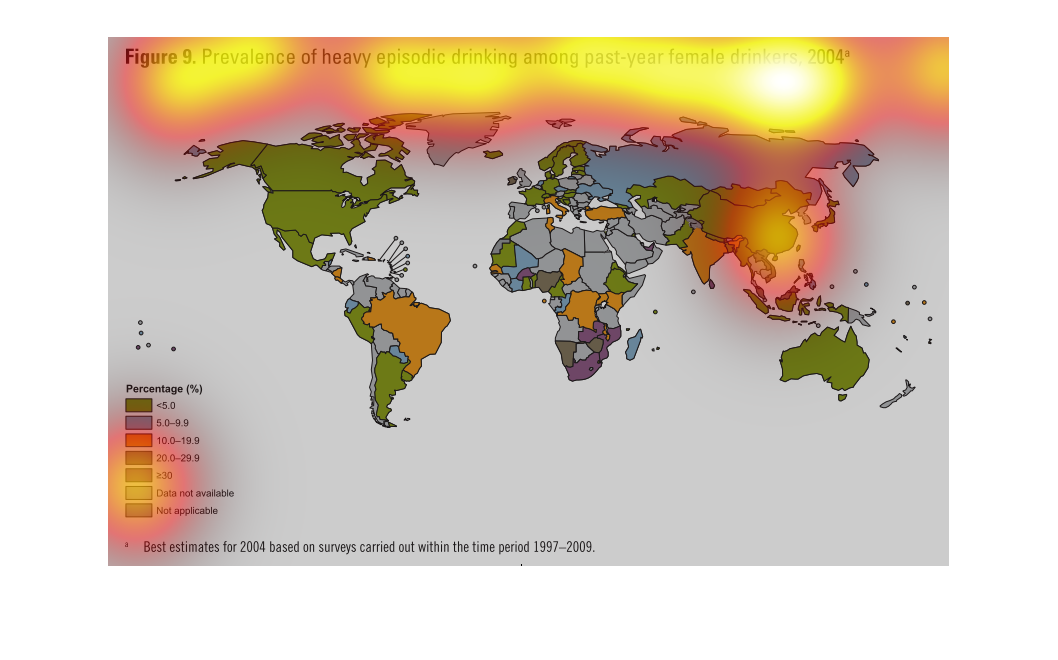
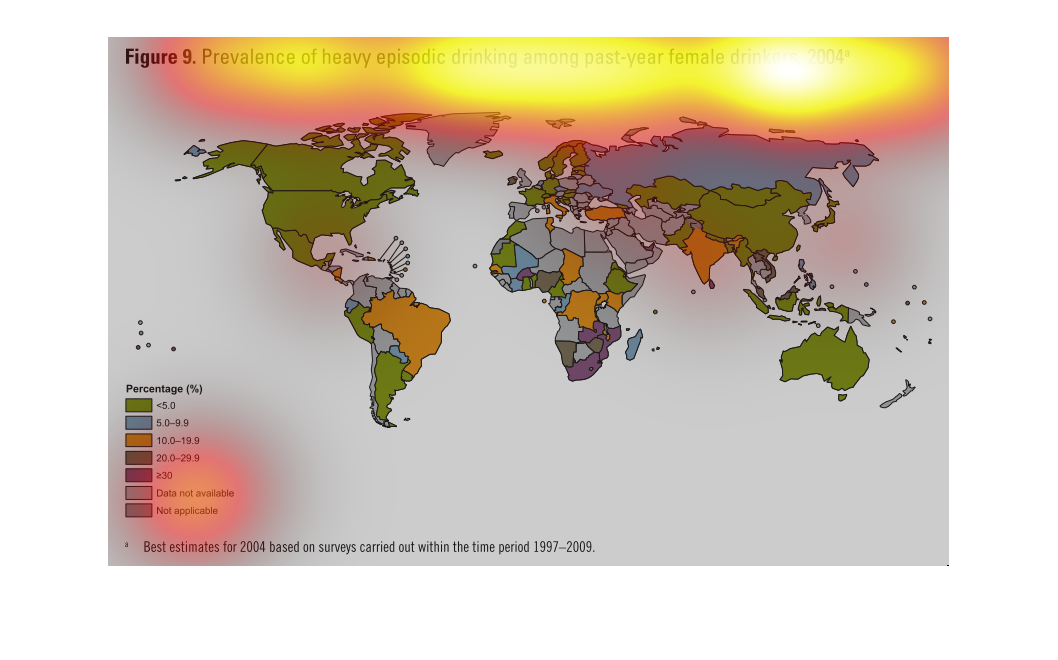
The image depicts the prevalence of heavy episodic drinking among past-year female drinkers,
2004*. The heaviest episodic drinking appears to occur in South Africa, with Russia having
elevated statistics as well as parts of South America, while most other countries have less
elevated statistics.
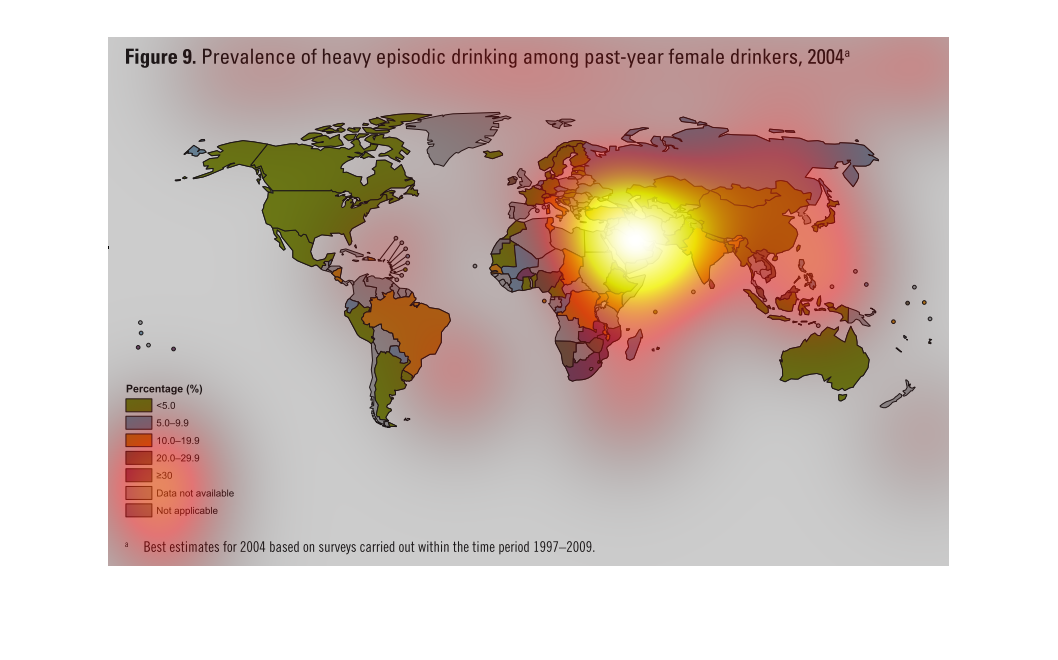
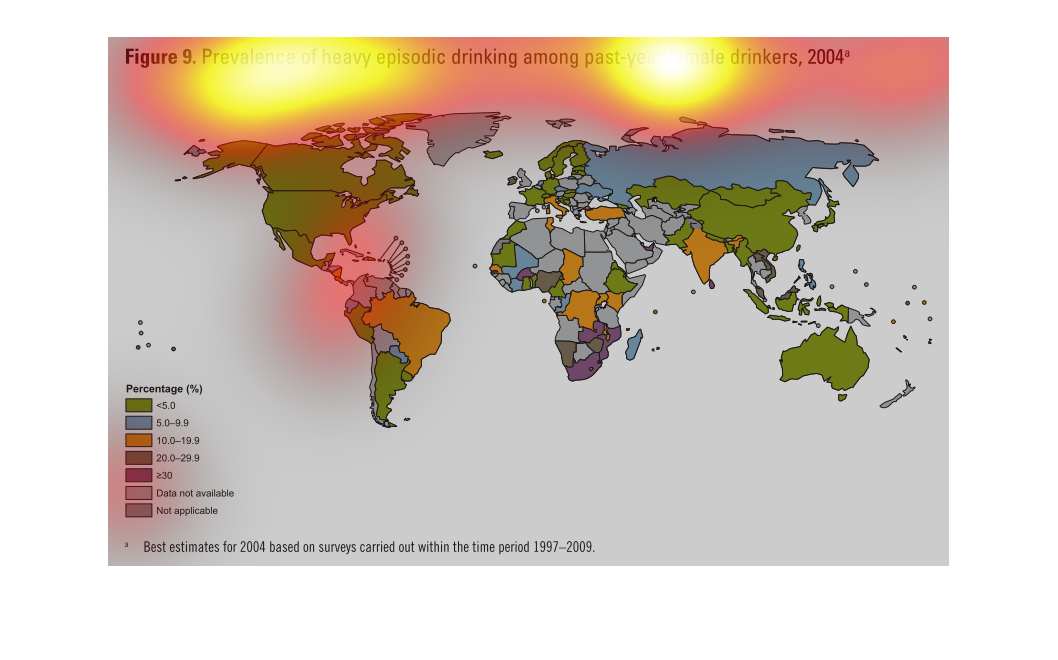
This is a global heat map that represents the prevalence of heavy alcoholic drinking in females
in the past year for the year 2004. Highest levels shown are in the US and Asia.
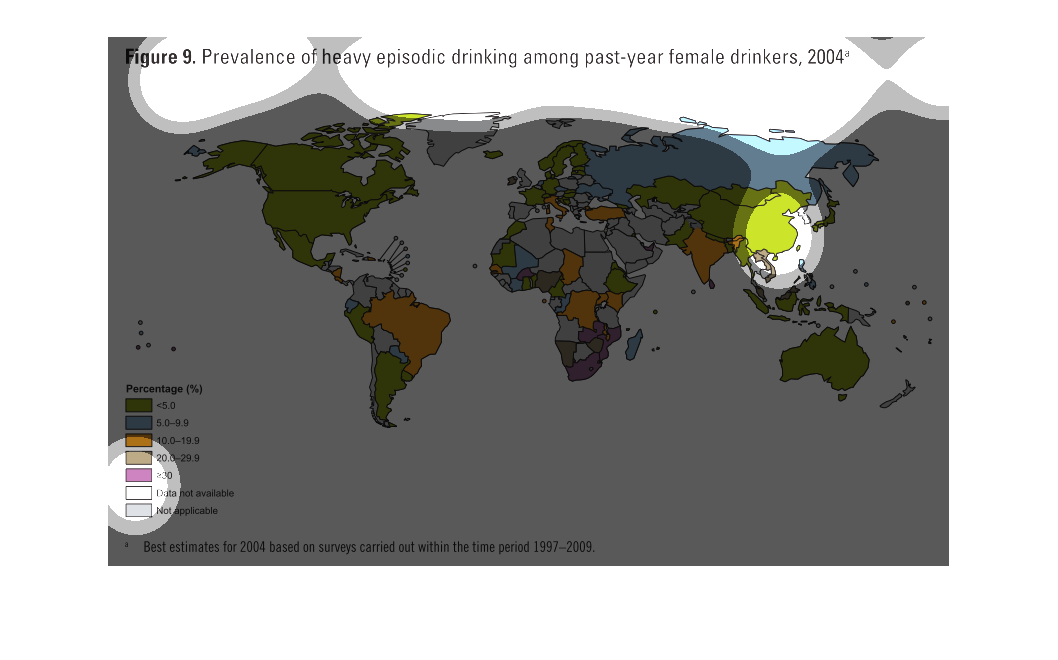
This chart describes prevalence of heavy episodic drinking among past-year  drinkers, for
the year 2004. Different categories on the chart are represented by different colors.
This map shows the prevalence of heavy episodic drinking among past year female drinkers.
The united states and many other large countries exceed the 5% mark.
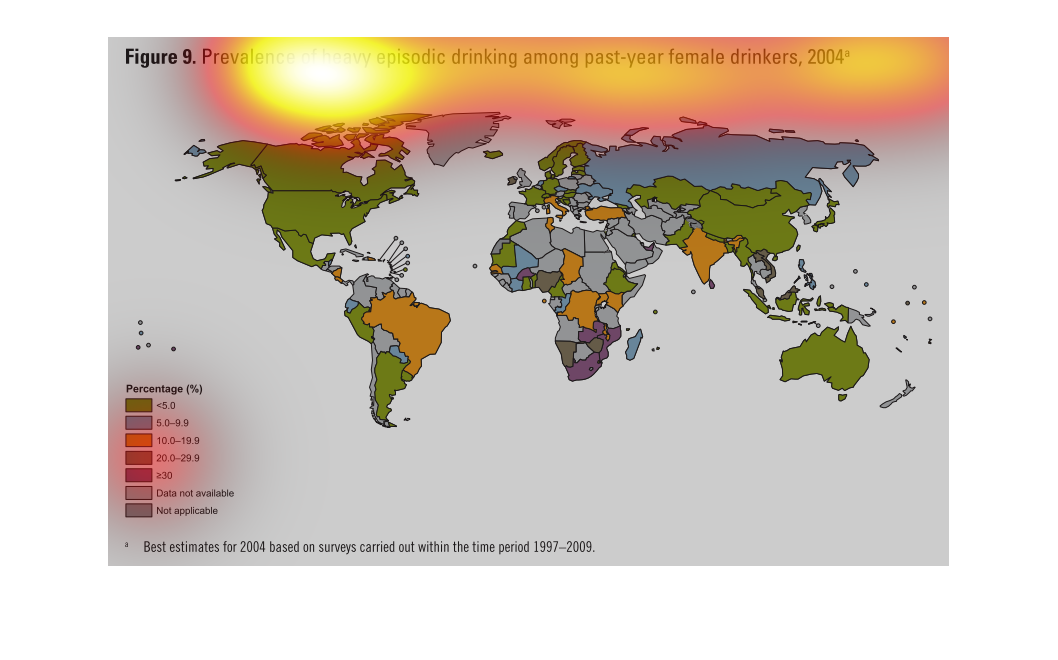
This chart describes the prevalence of of heavy episodic drinking among past year female drinkers
for the year 2004. Different categories are represented by different colors.
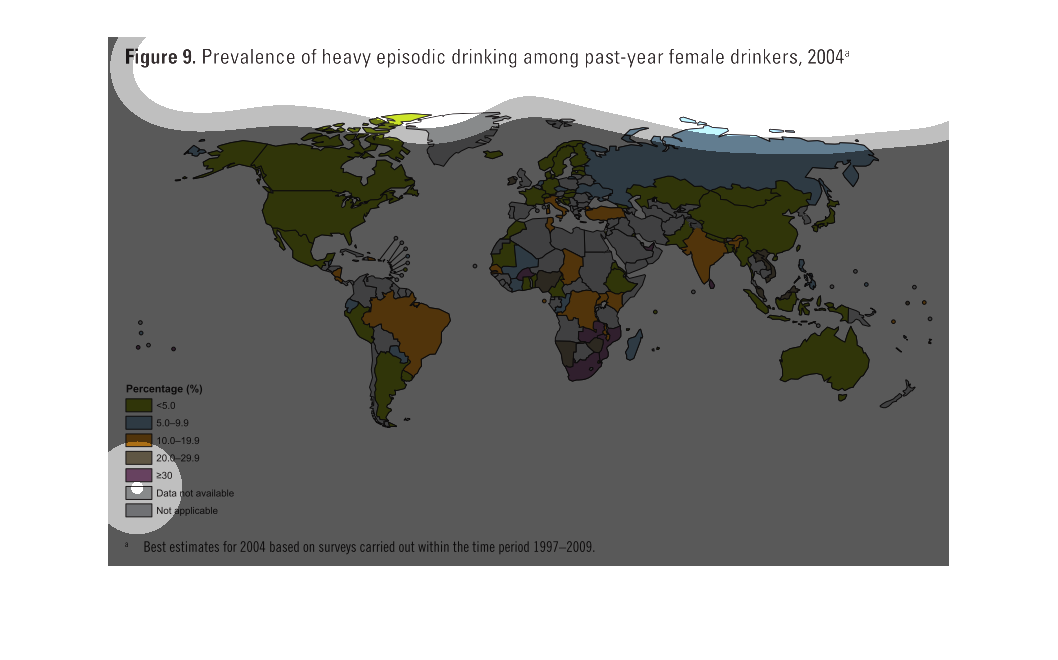
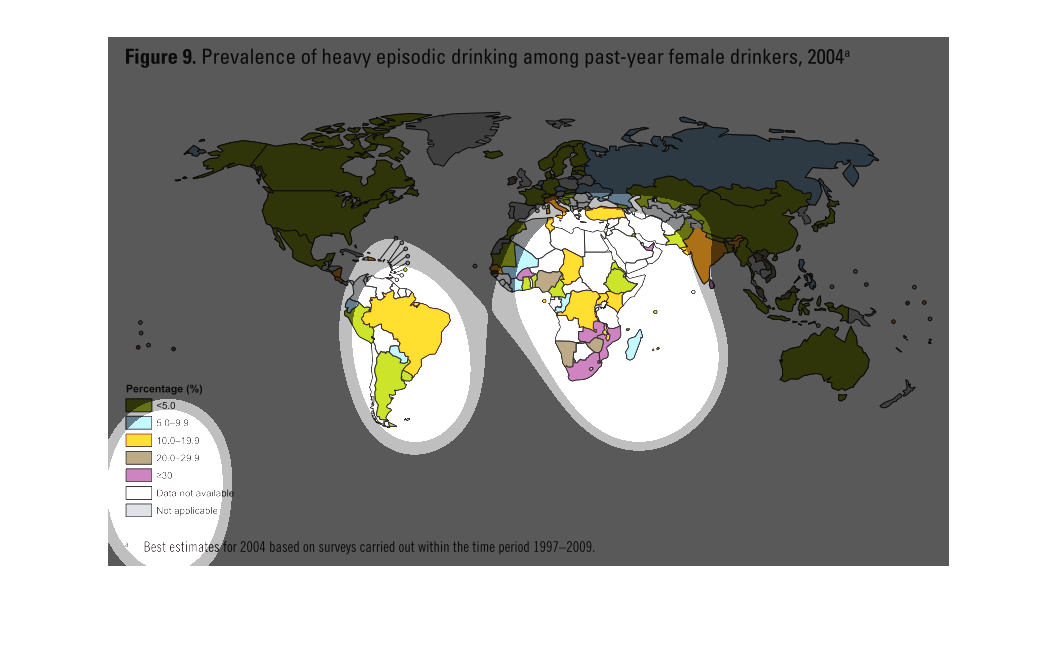
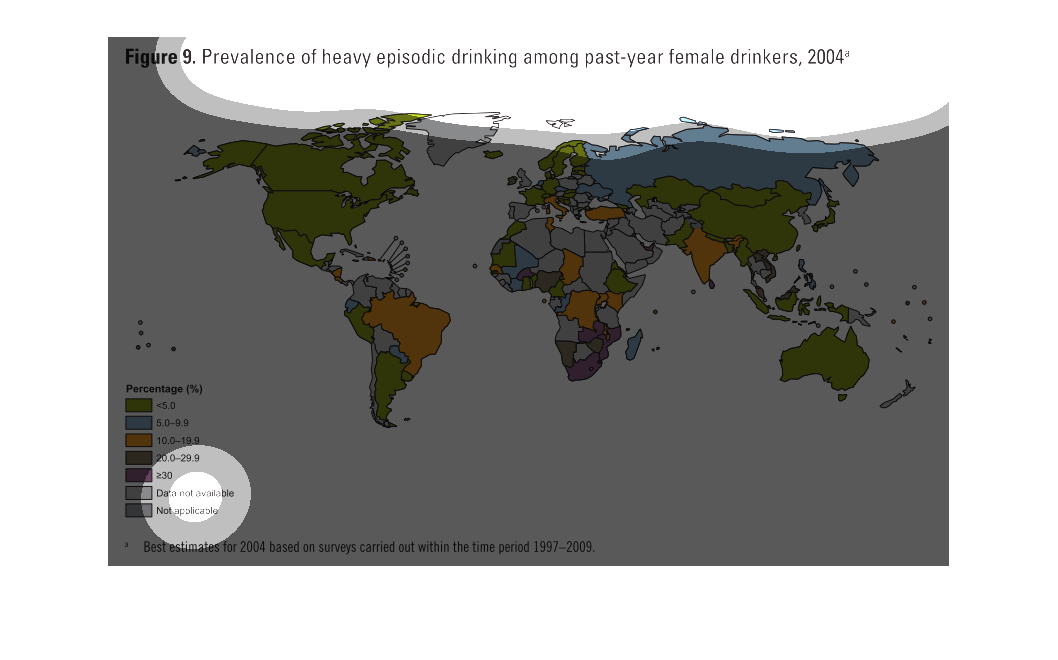
This shows instances of binge drinking among women in 2004 based on percentage of the drinking
population, up to over 30%. The largest percentage of binge drinkers are, surprisingly, in
southern Africa. Equally surprising in the smallest percentages are in the US and Australia.
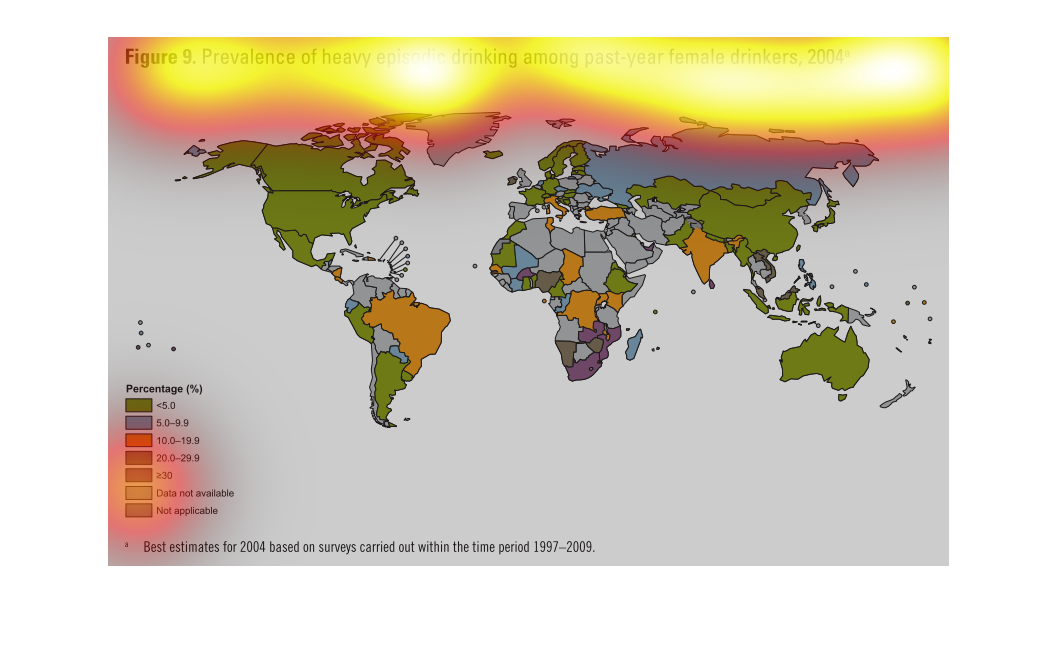
This is a map of the countries of the world that describes the prevalence of heavy episodic
drinking among past year females in 2004. There does not seem to be a reliable pattern in
this map.
The figure presented is titled Figure 9: prevalence of episodic drinking among past-year female
drinkers, 2004.  The figure represents data for female drinkers.