To much of a good thing ultimately winds up being bad for you. Alcohol is meant to be consumed
moderately- with friends at gatherings and celebrations- but beyond that it can really do
alot of damage to your body, as this illustration demonstrates.
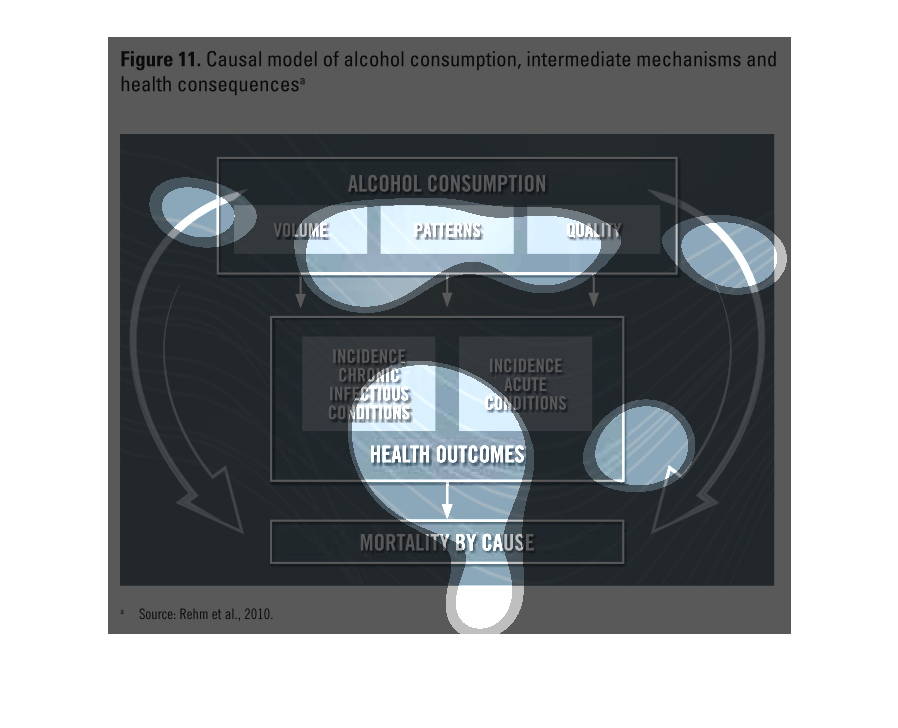
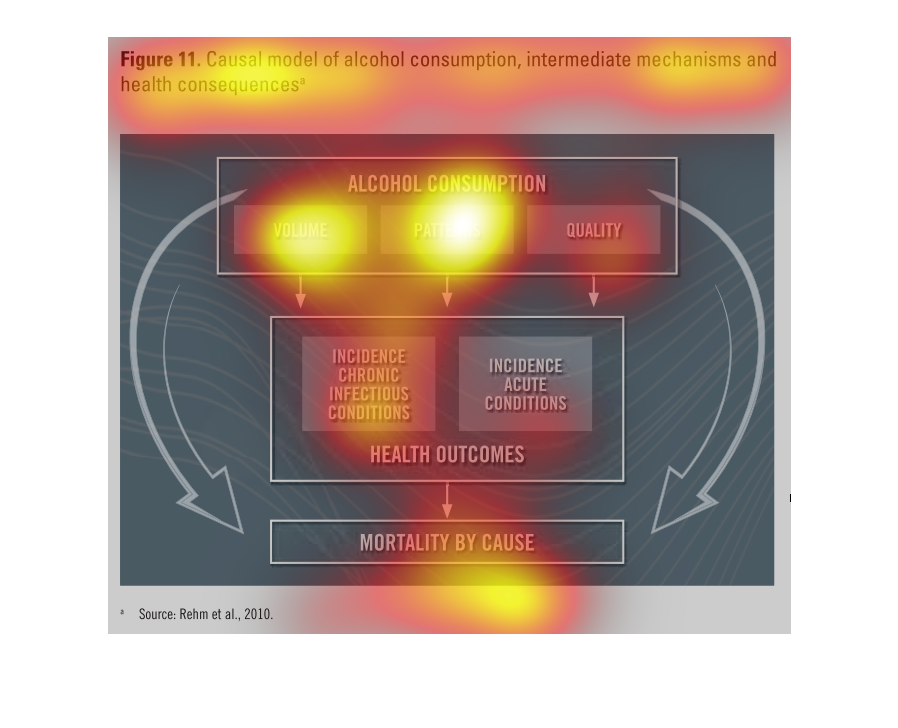
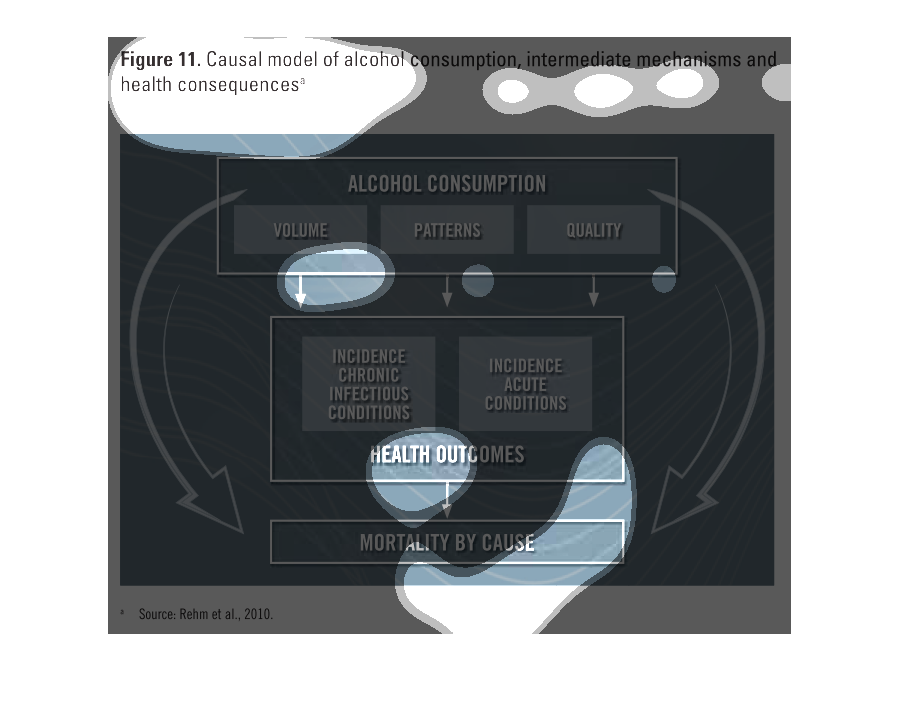
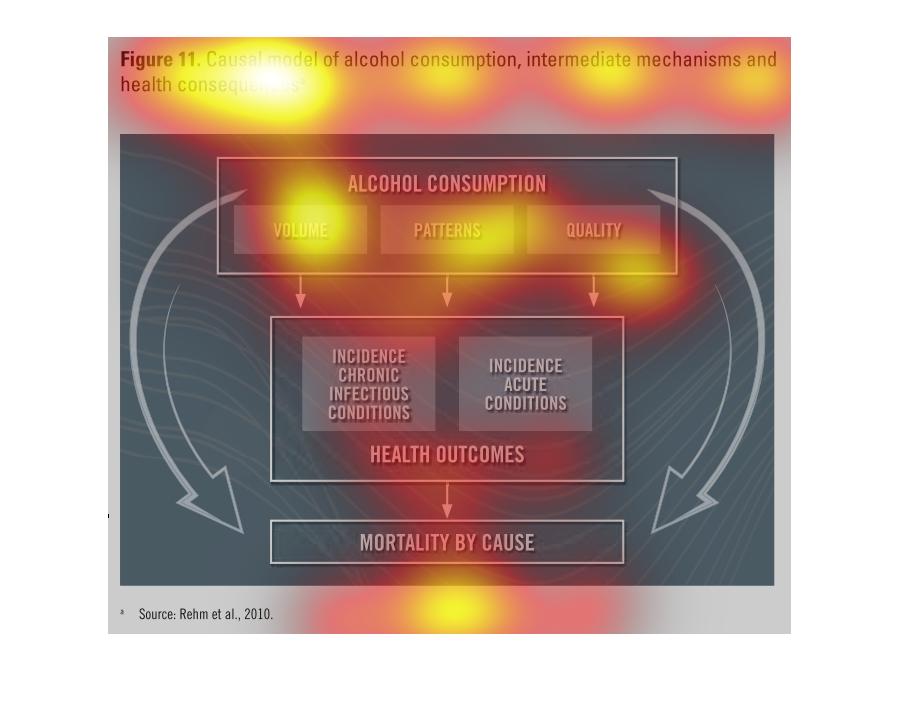
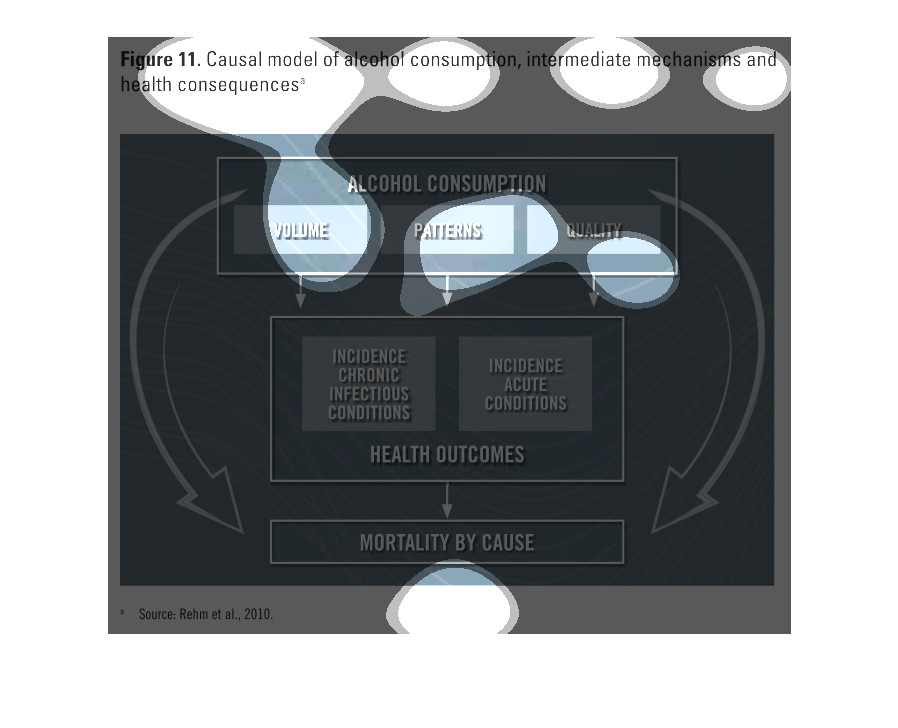
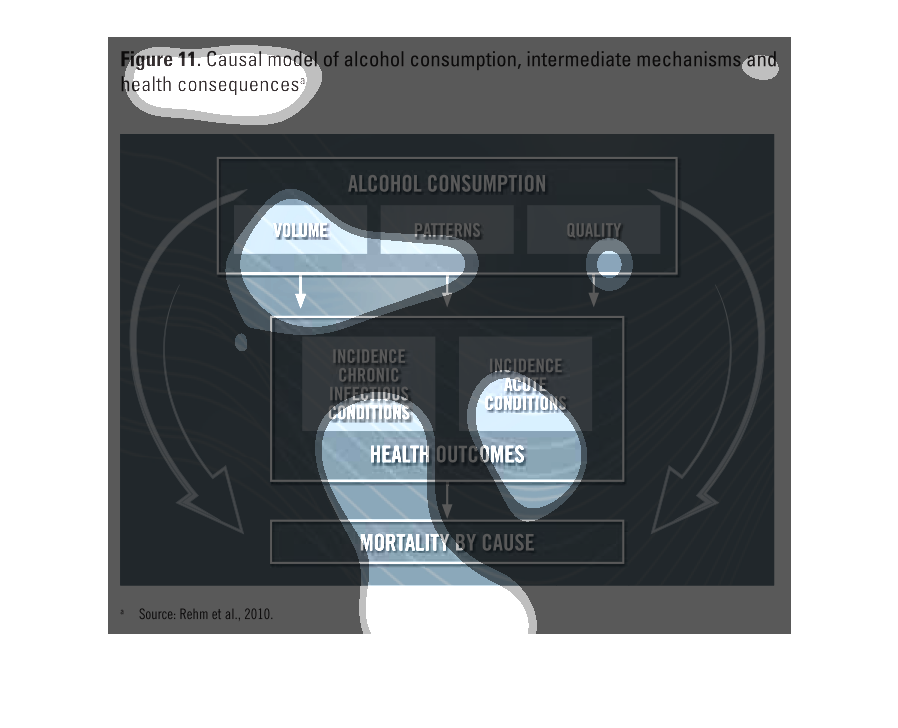
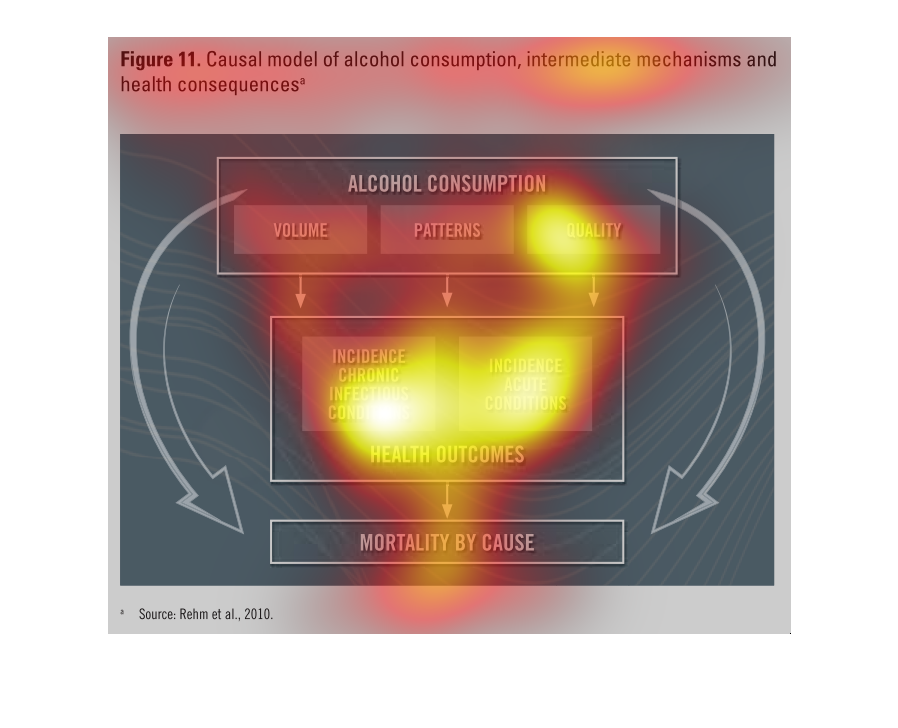
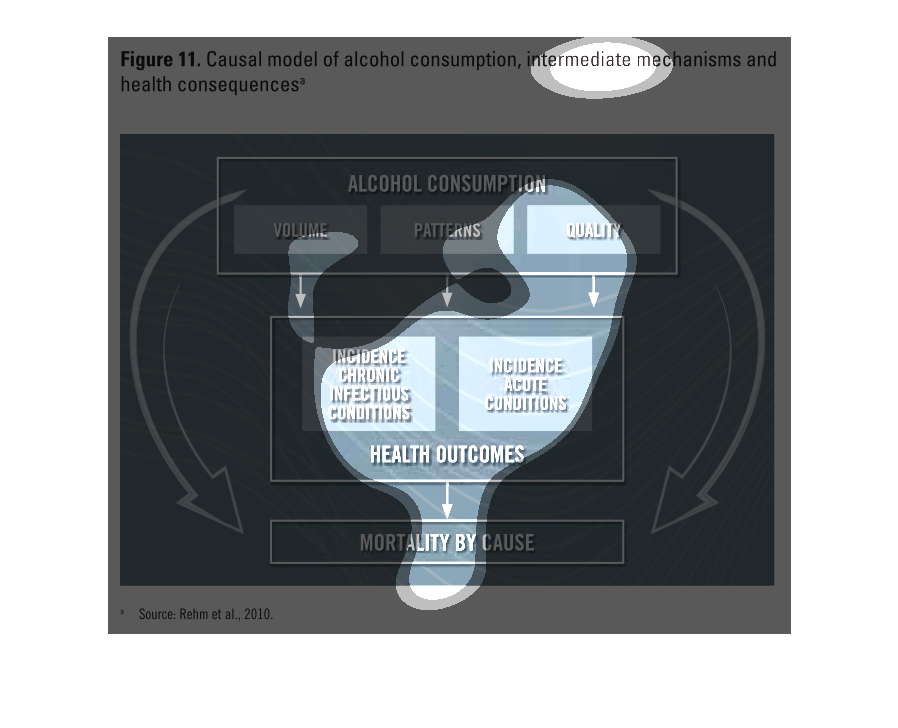
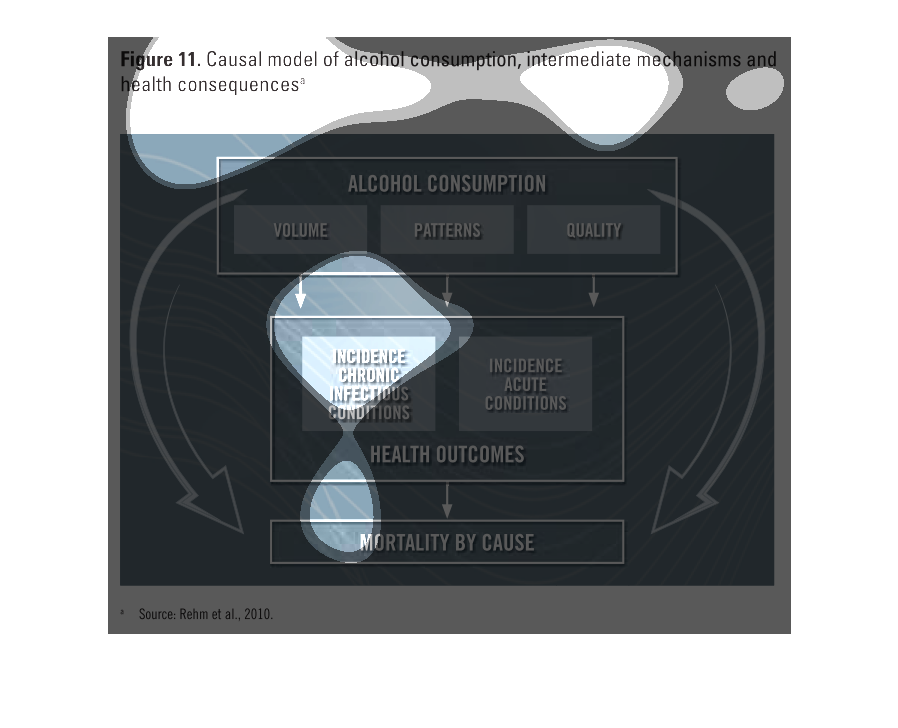
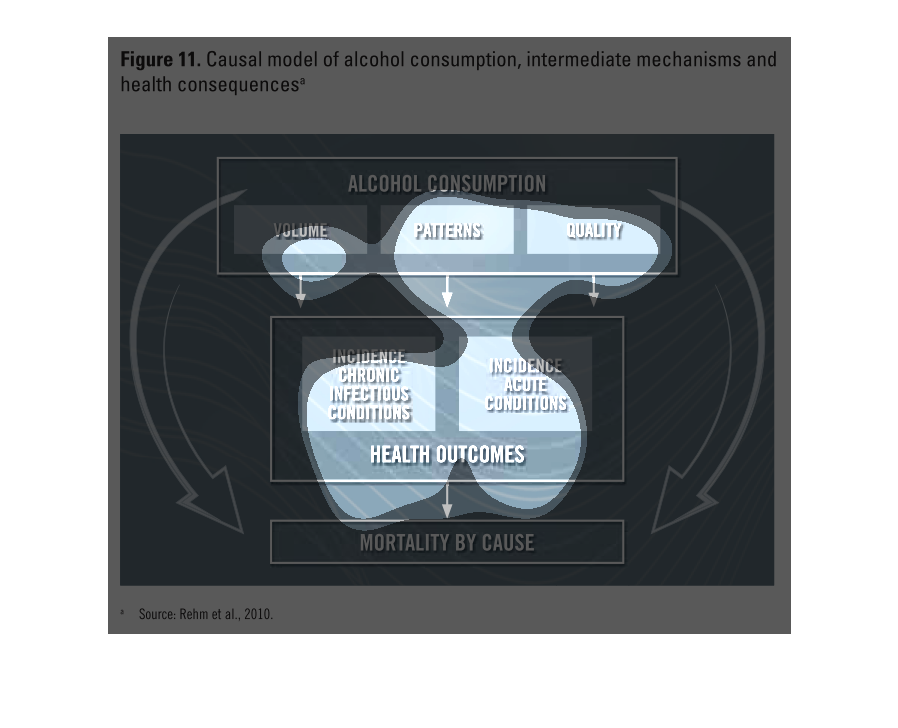
A casual model of alcohol consumption, intermediate mechanisms, and health consequences. The
model shows how volume and pattern leads to incidence chronic infectious conditions, while
patter and quality leads to incidence acute decisions, while all of them lead to the same
health outcome of mortality by cause.
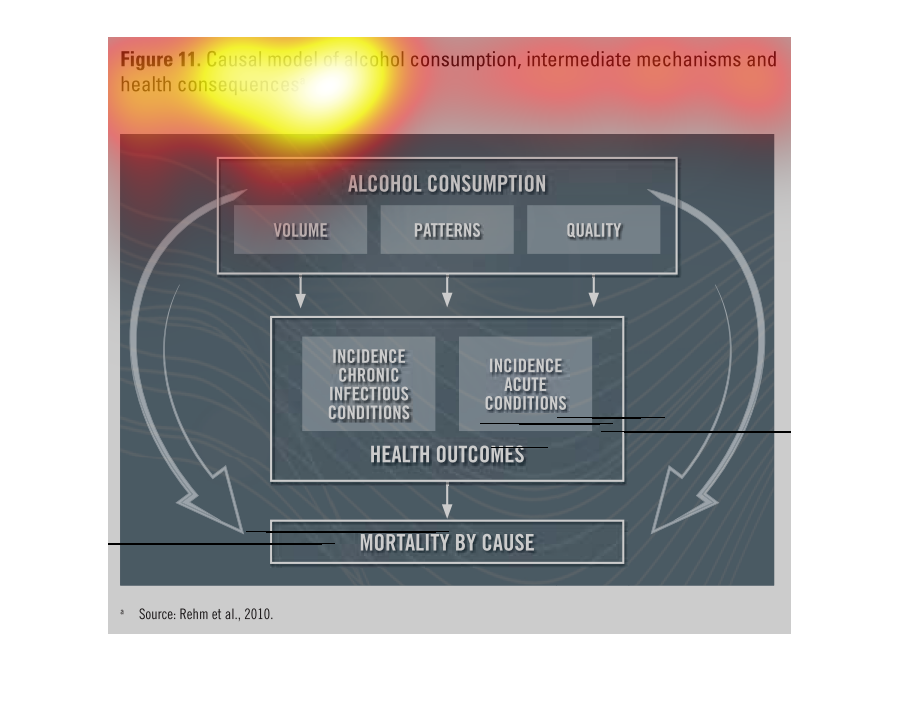
This illustrates a causal model of alcohol consumption and health related consequences.  Factors
of alcohol include volume, patterns, and quality of beverage.
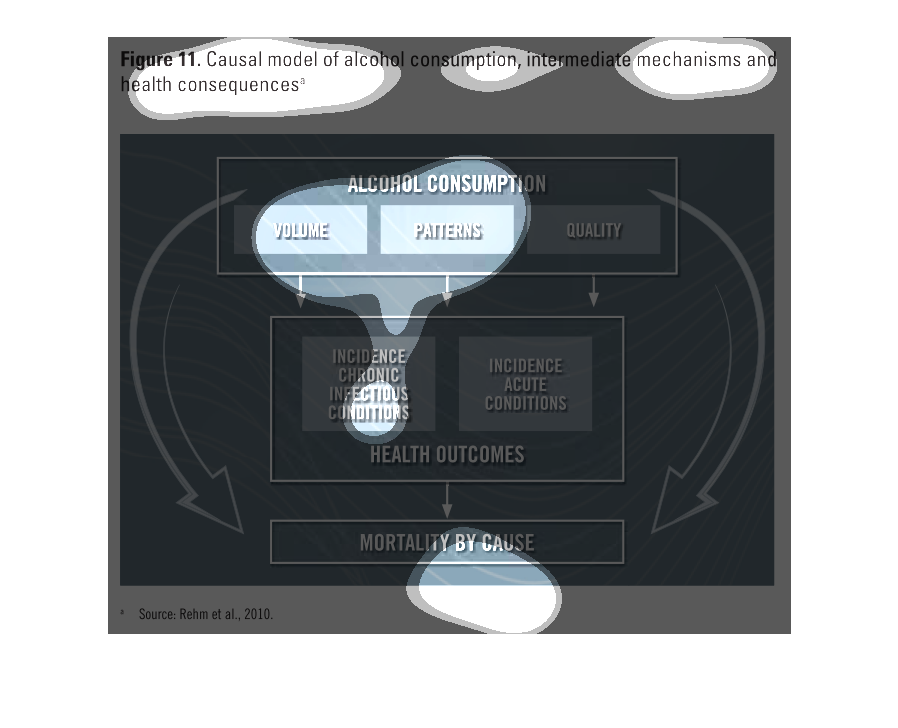
This model shows the causal effects of alcohol consumption. The factors contributing to overall
poor health include volume, patterns, and quality. Chronic and acute conditions as a result
are caused.
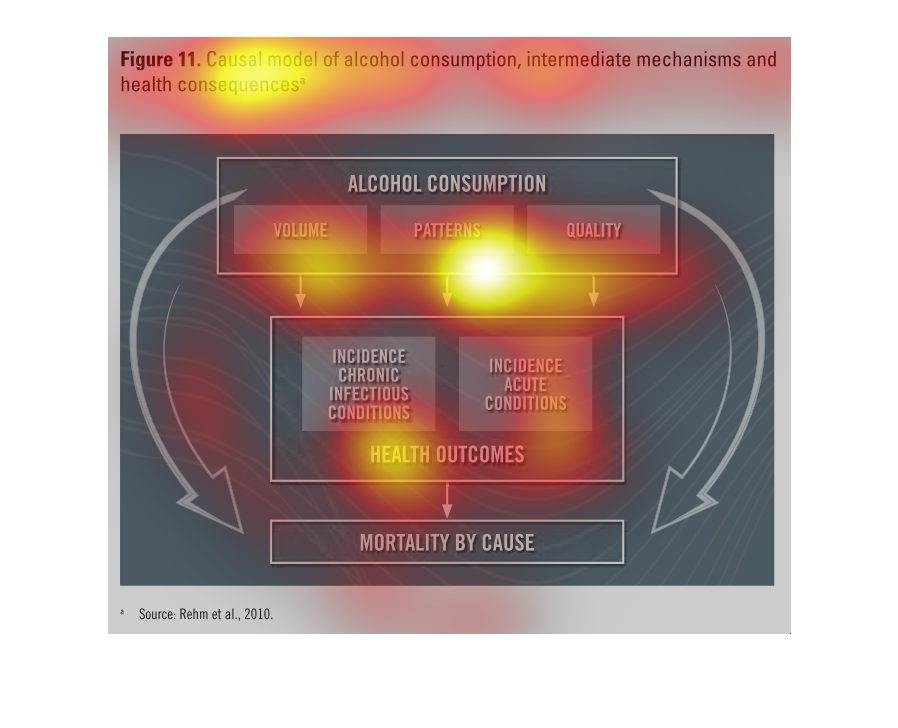
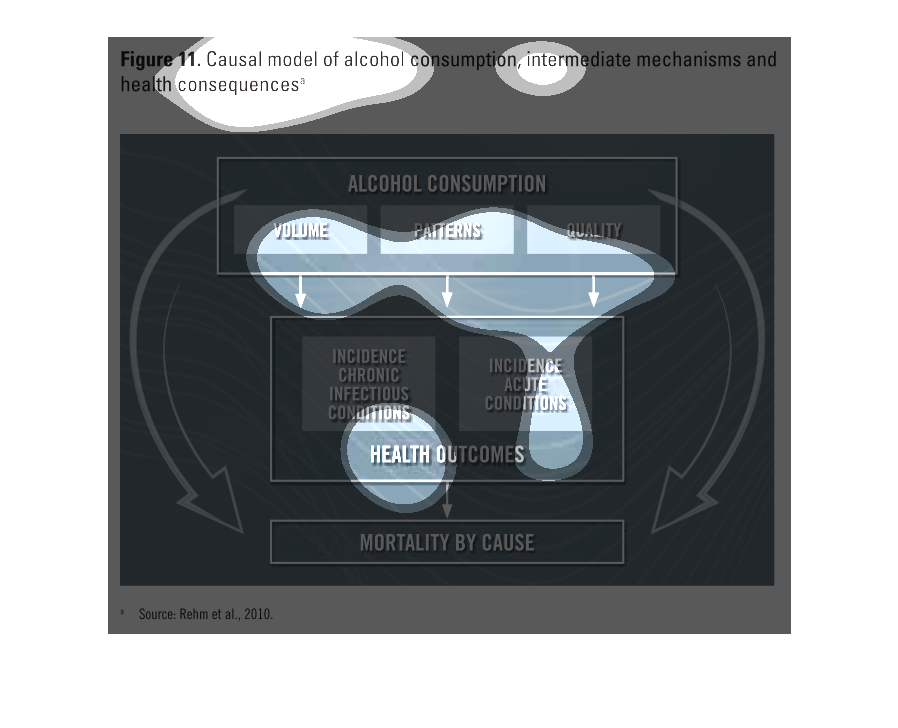
This image describes the mechanisms that connect alcohol consumption to health conditions.
It starts off with 3 mechanisms: volume, patterns, and quality which feed into one of 2 types
of health conditions: chronic and acute that ultimately lead to mortality (death).
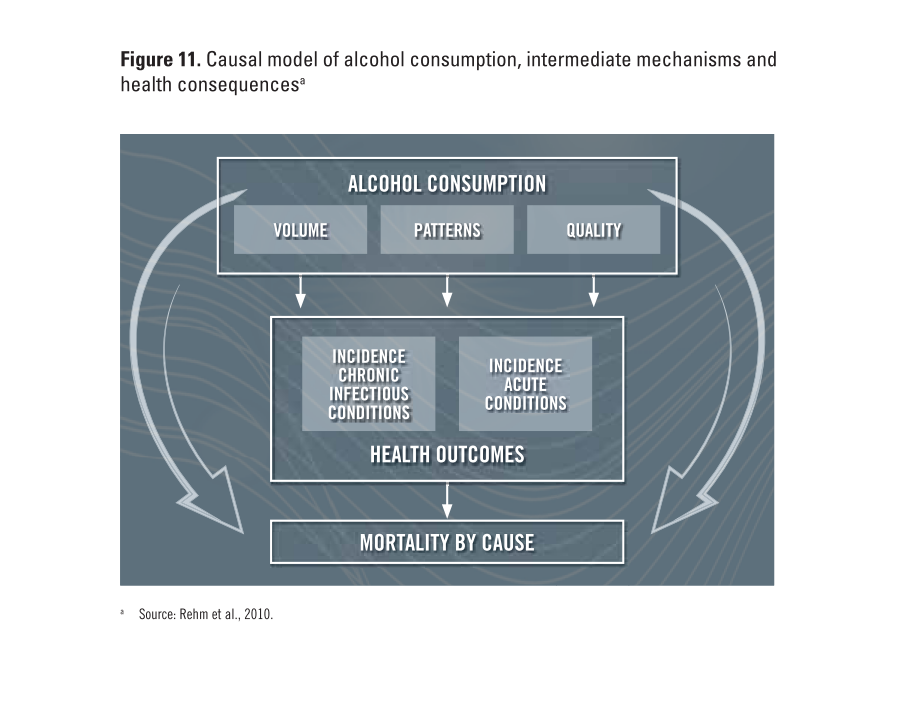
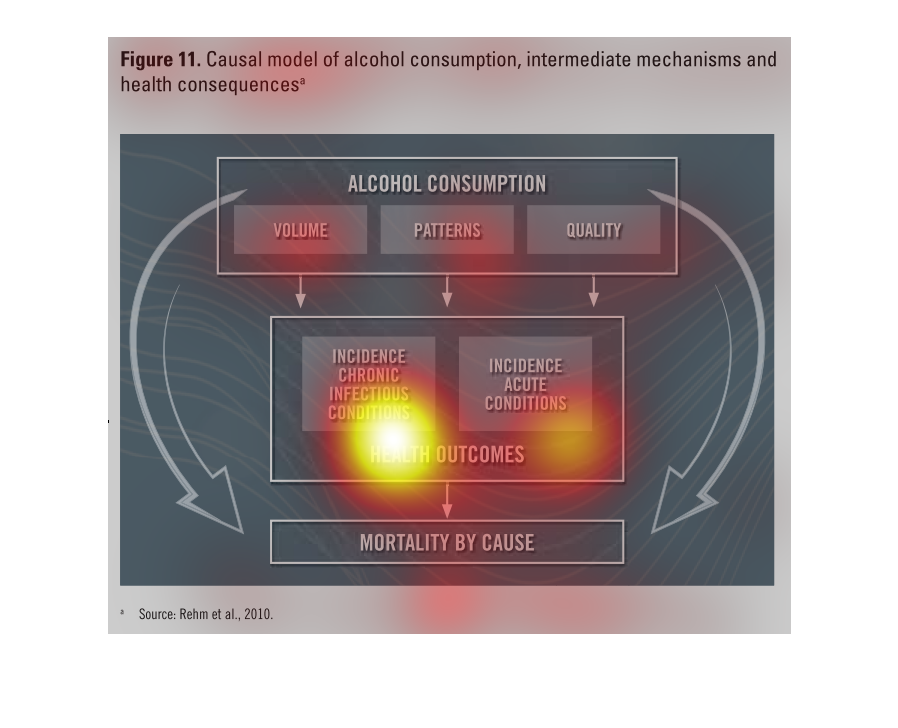
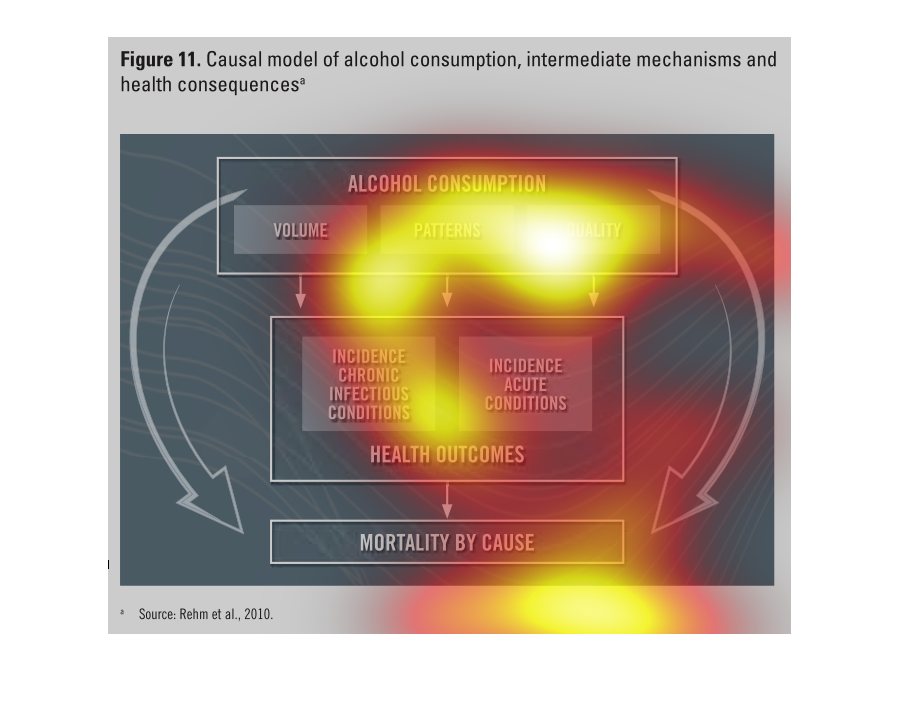
The figure presented is titled Figure 11: causal models of alcohol consumption, intermediate
mechanisms and health consequences.  The figure represents alcohol data.
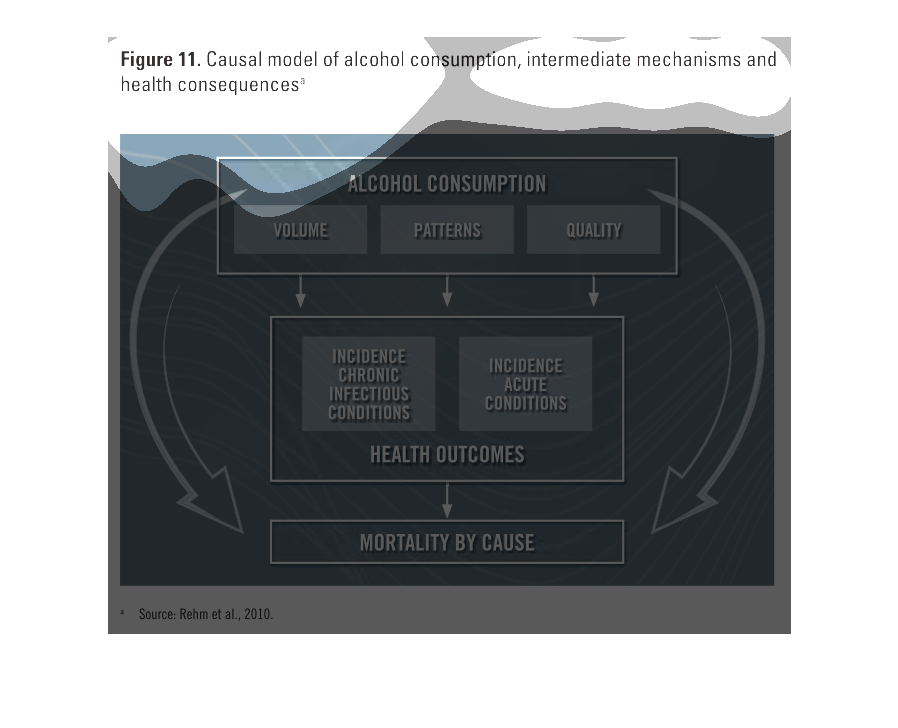
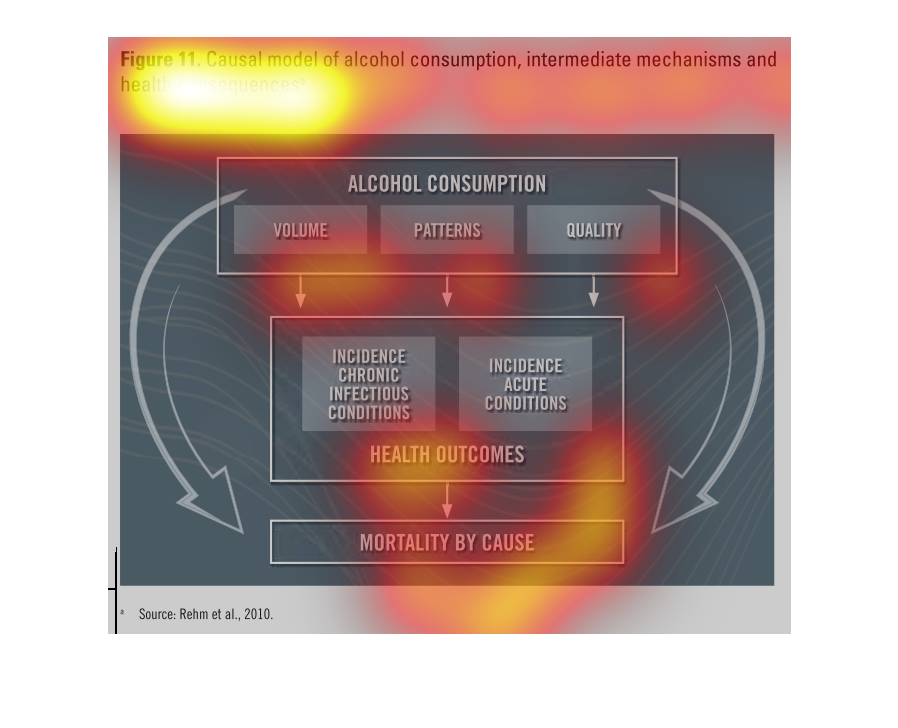
This is a flow chart of the progression of consumption of alcohol beginning with how much
is consumed, in what pattern, and the quality of the alcohol moving toward health concerns,
and then to health outcomes and finally mortality rates.  It is simply a flow chart that does
not convey in solid statistical data
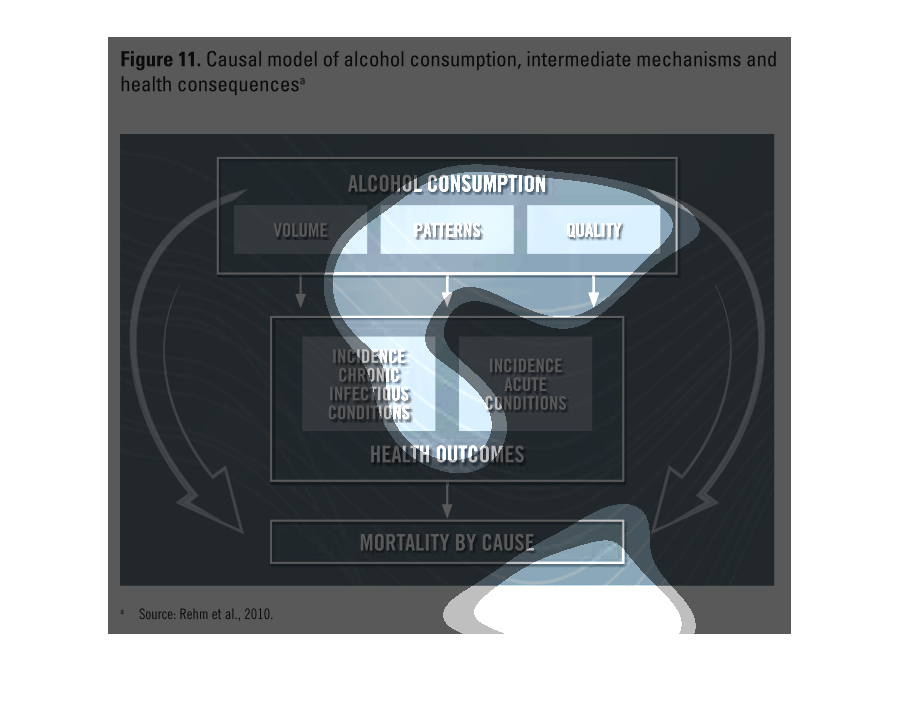
This chart describes casual model of alcohol consumption, intermediate mechanisms and health
consequences. Categories on the chart include health outcomes.
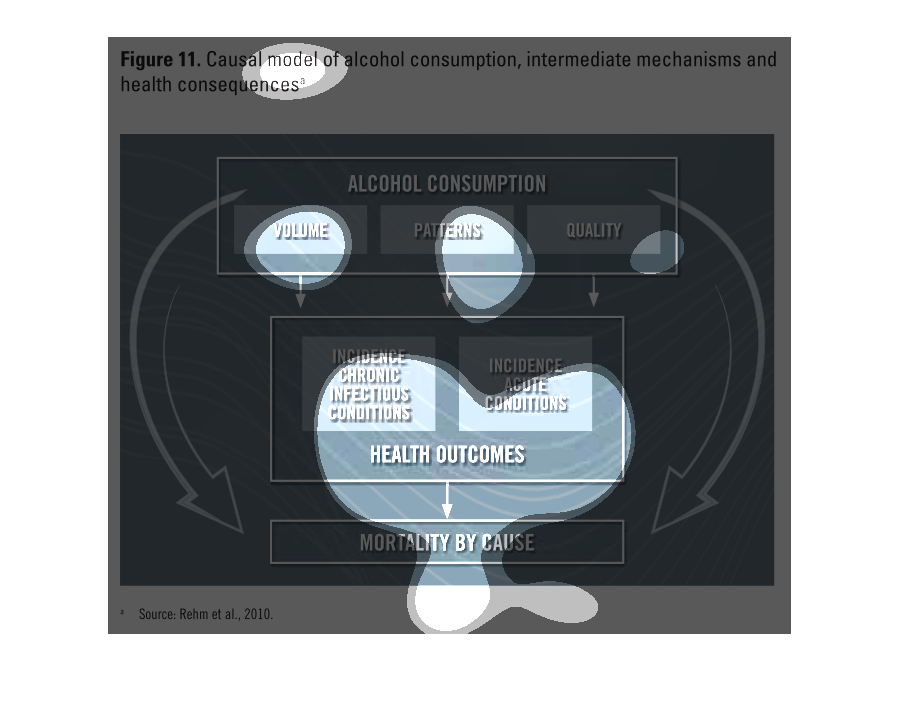
Alcohol consumption behavioral chart; Volume, Patterns, and Quality. Incidence Chronic infectious
condition. Incidence Acute condition. Health Outcomes, mortality by cause
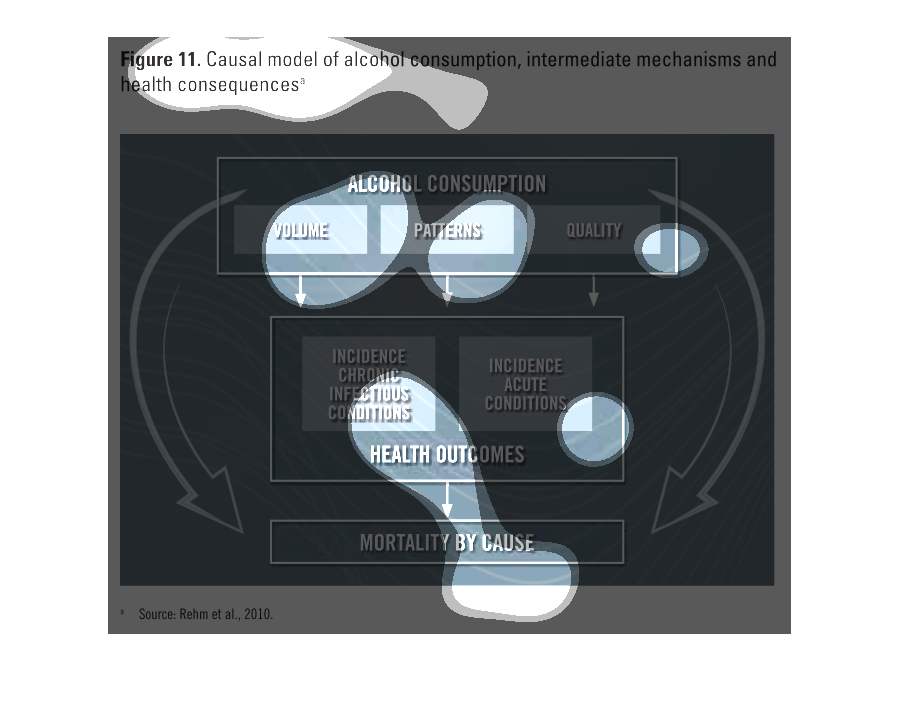
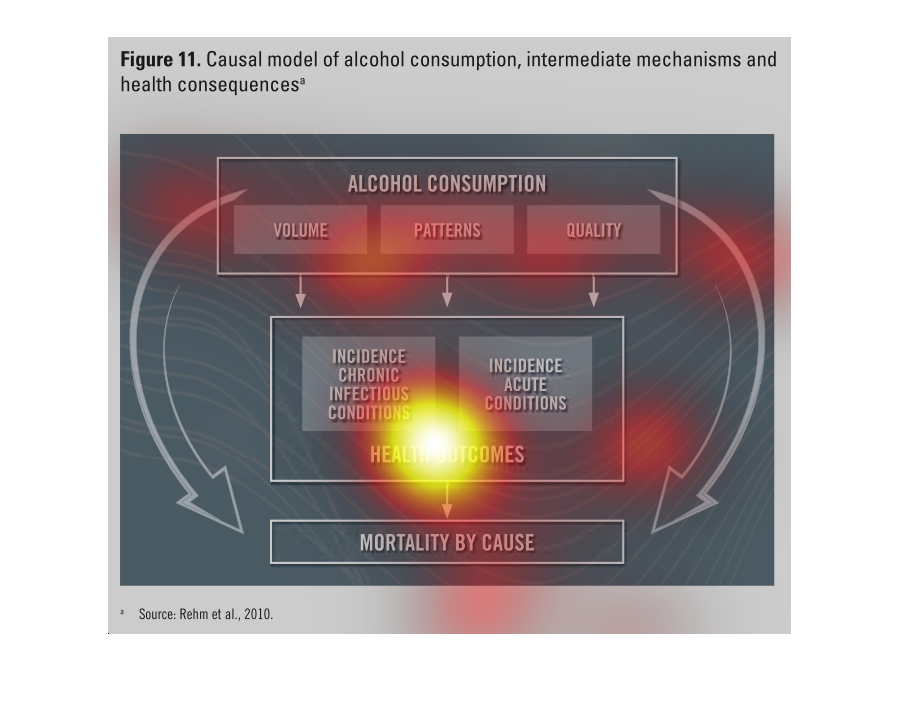
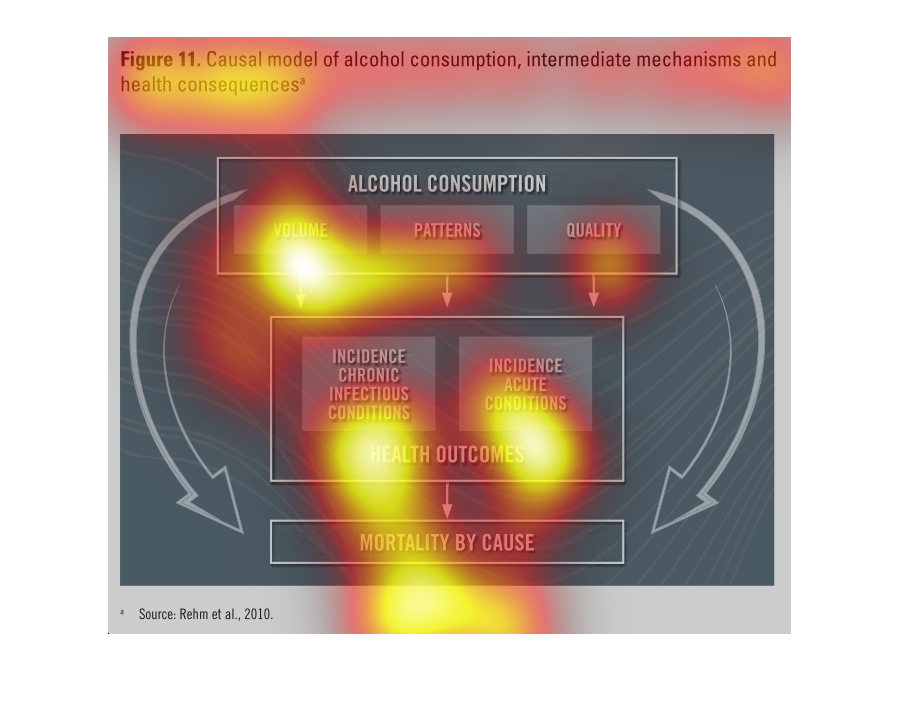
Model of alcohol consumption, intermediate mechanisms and health consequences. This shows
that the higher amount of alcohol, the more frequently, and the lower quality of alcohol you
drink can lead to acute conditions, or chronic infectious conditions, which can ultimately
lead to mortality.
This chart describes causal model of alcohol consumption, intermediate mechanisms and health
consequence. Categories on the chart include volume and patterns.
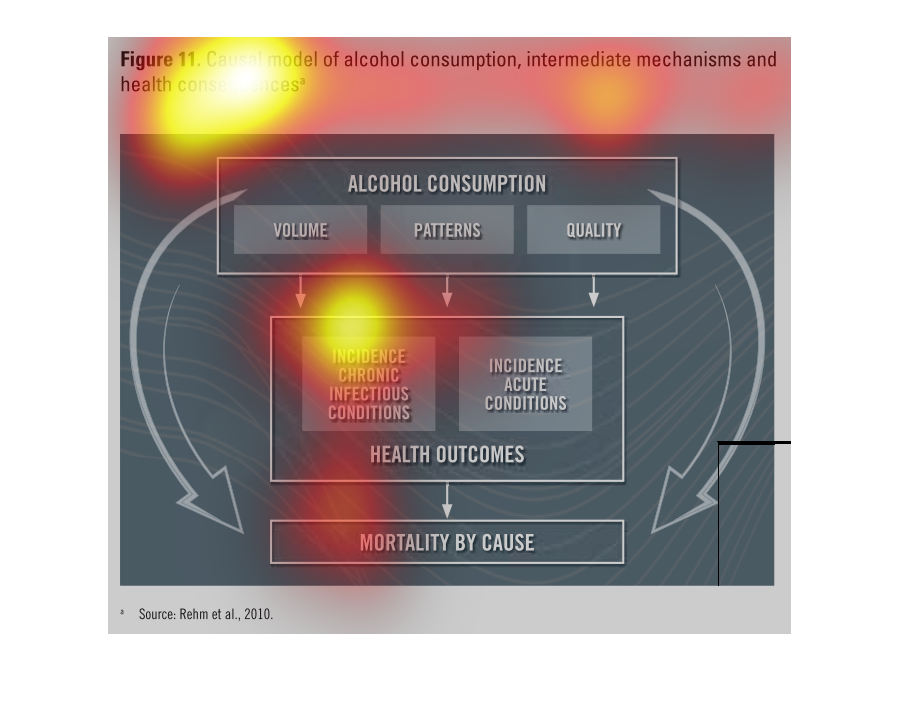
The chart shows how alcoholic consumption volume, patterns and quality affects the incidence
of chronic infectious conditions and incidence acute condition. And how these factors affect
the health outcomes and mortality by cause.
This chart shows the casual model of alcohol consumption, intermediate mechanisms and health
consequences. Increased volumes and frequents patterns of alcohol use increase chronic and
acute health conditions.
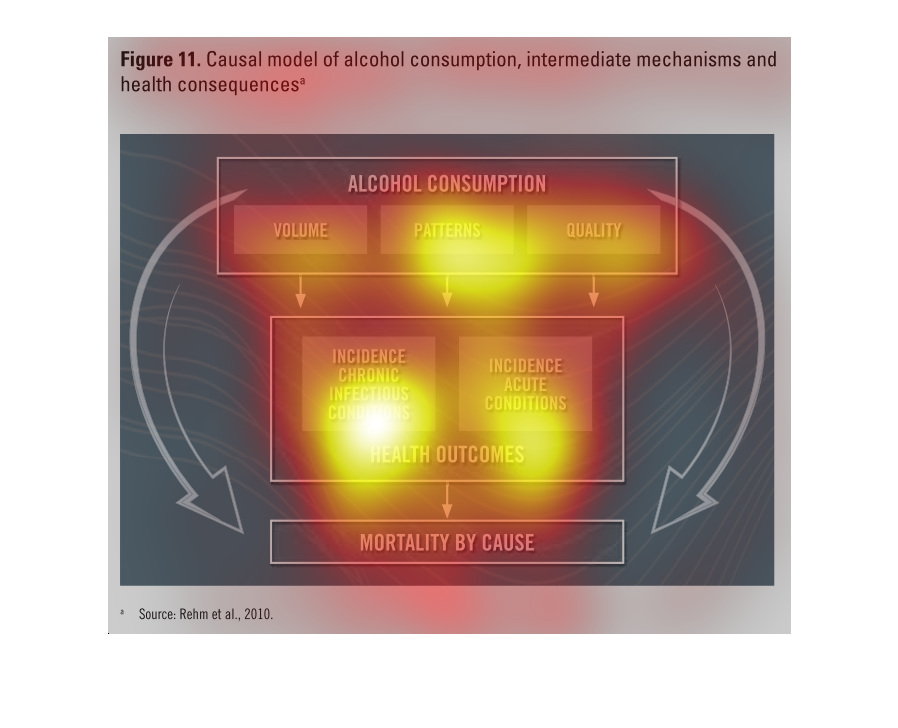
This is a diagram of alcohol consumption and shows its intermittent mechanisms and its health
affects.  It includes volume, quality, and patterns. Mortality is the final stage