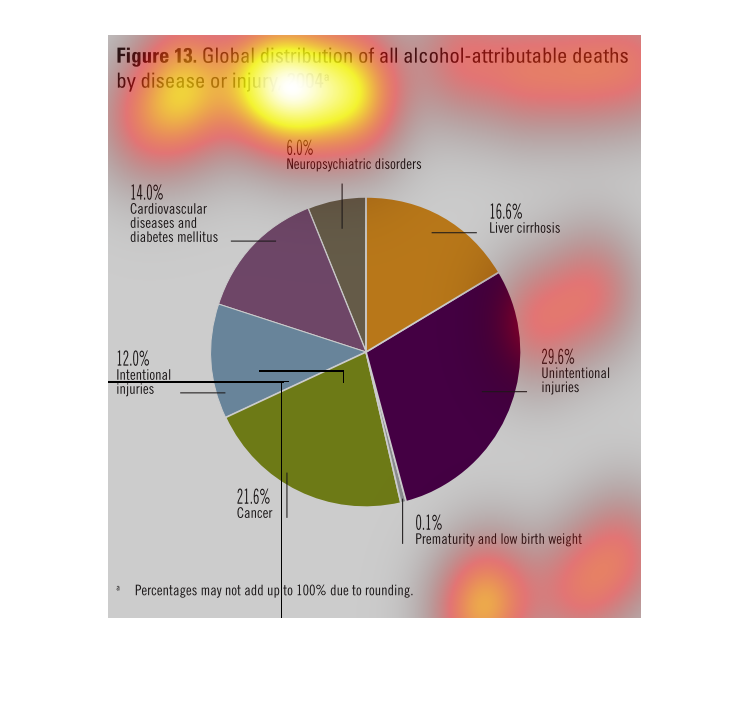
This chart clearly displays the global distribution of all alcohol attributable deaths by
disease or injury during the year 2004. 21.6 percent of the deaths have been from cancer.
The pie chart shows the global distribution of all alcohol attributed deaths by disease or
injury. The number one cause for alcohol attributed deaths is accidental injuries.
The figure presented is titled global distribution of all alcohol attributable deaths by disease
or injury 2004.  The figure is a pie chart which represents the data.

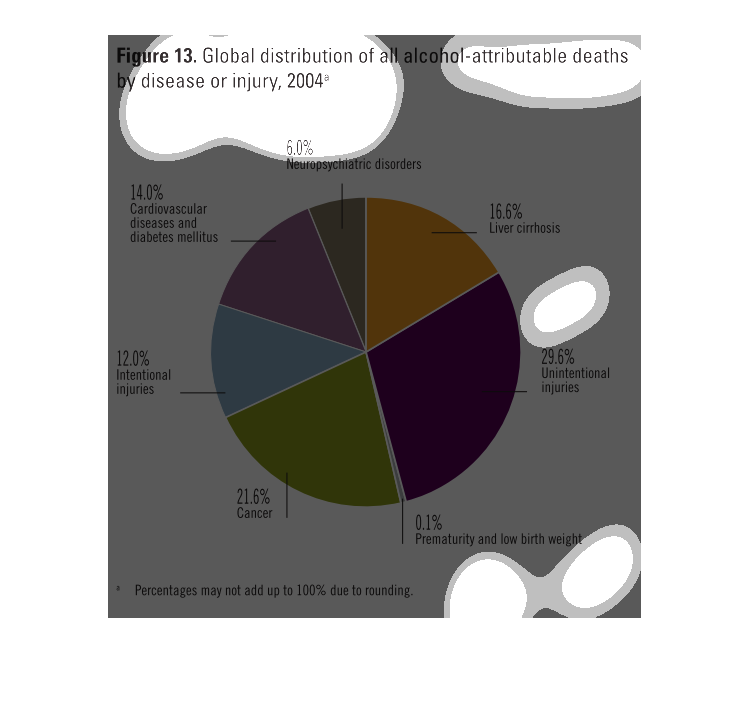
This pie chart shows the distribution of worldwide deaths attributable to alcohol, as a percentage
of the injuries or diseases eventually causing morality.
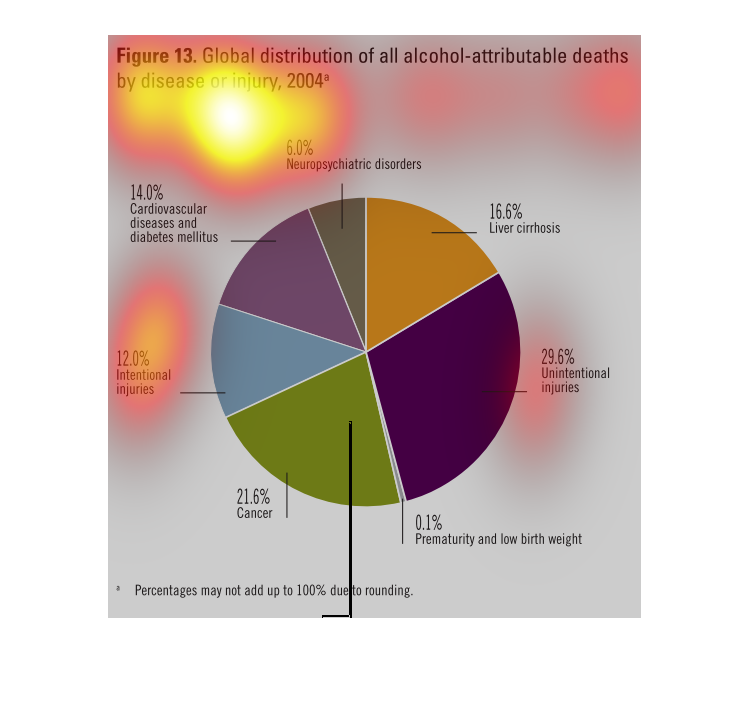
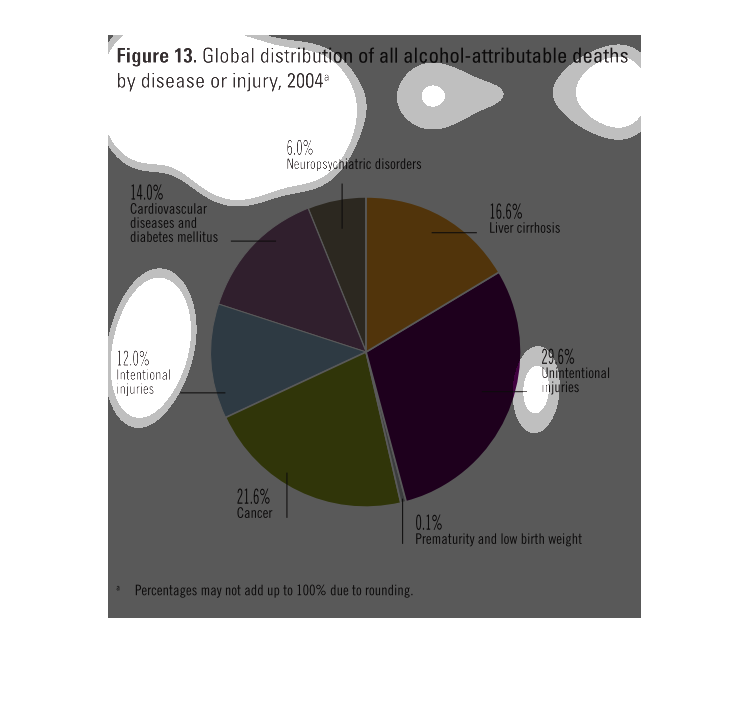
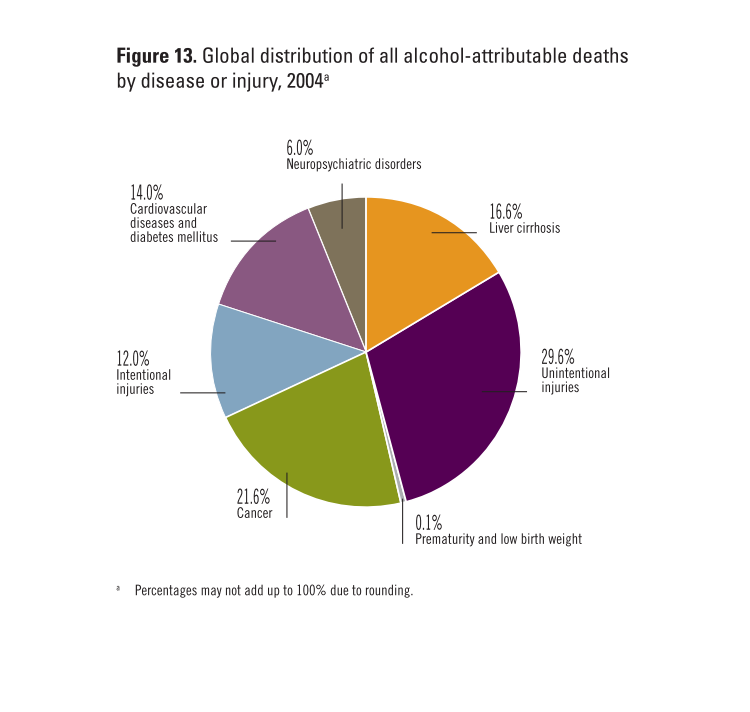
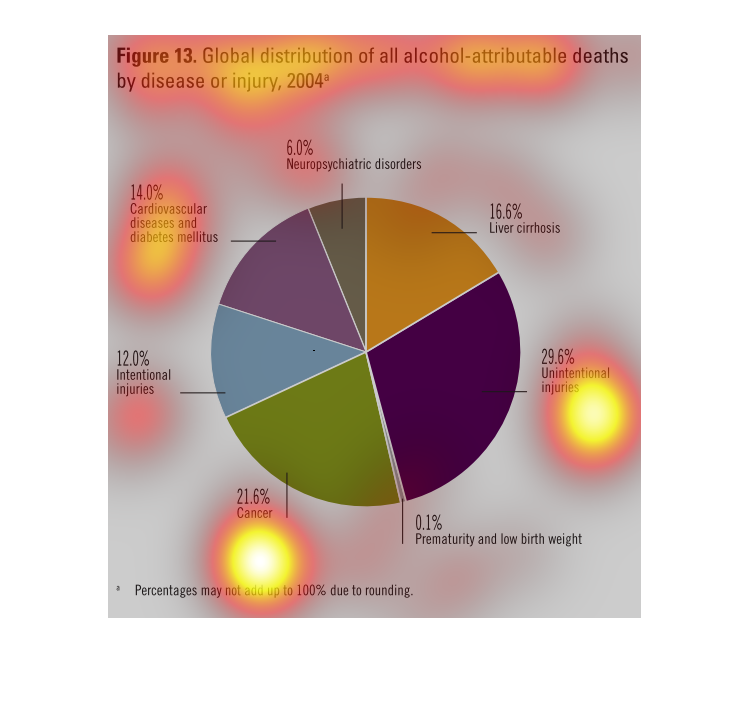
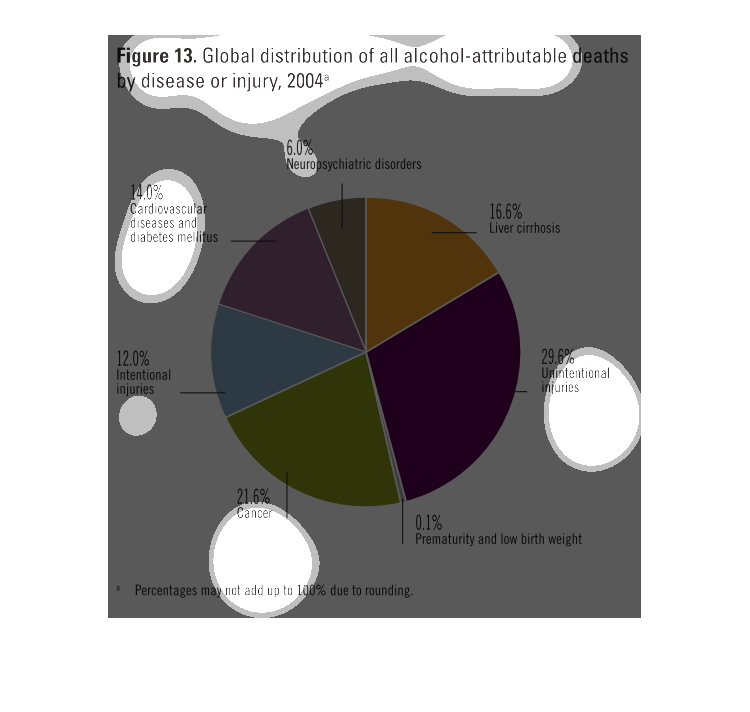
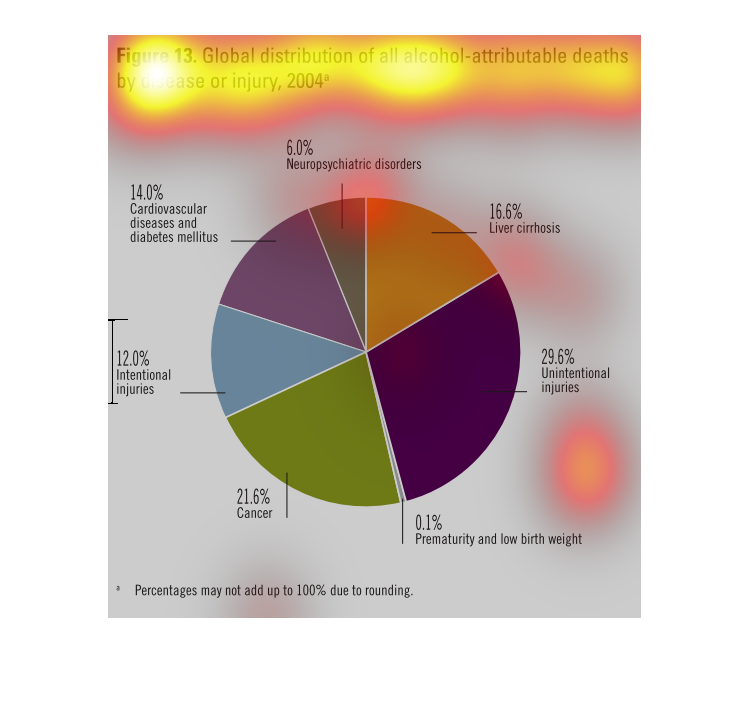
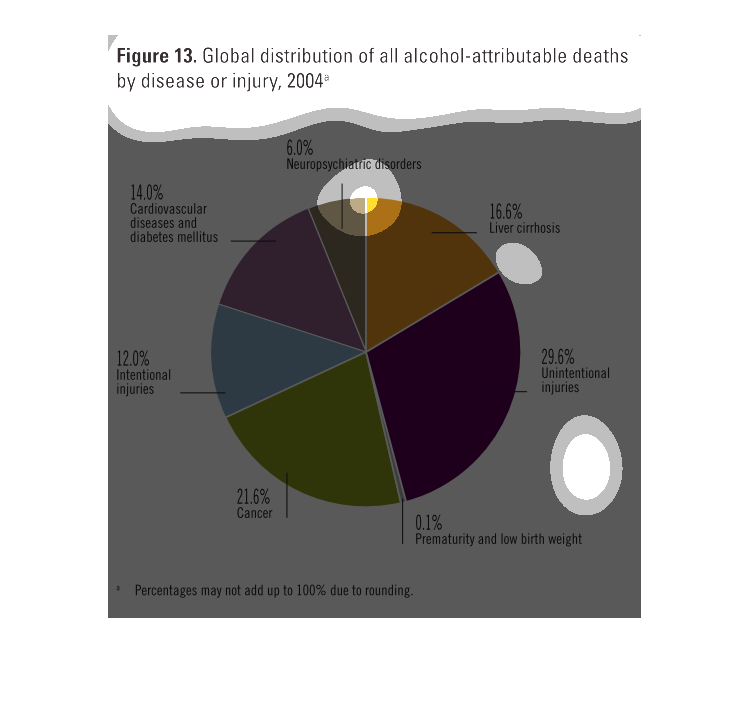
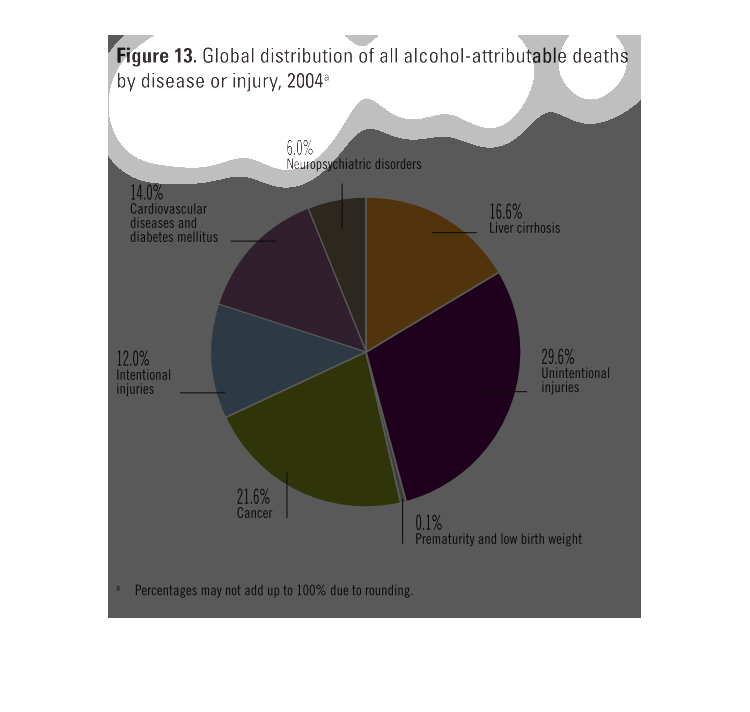
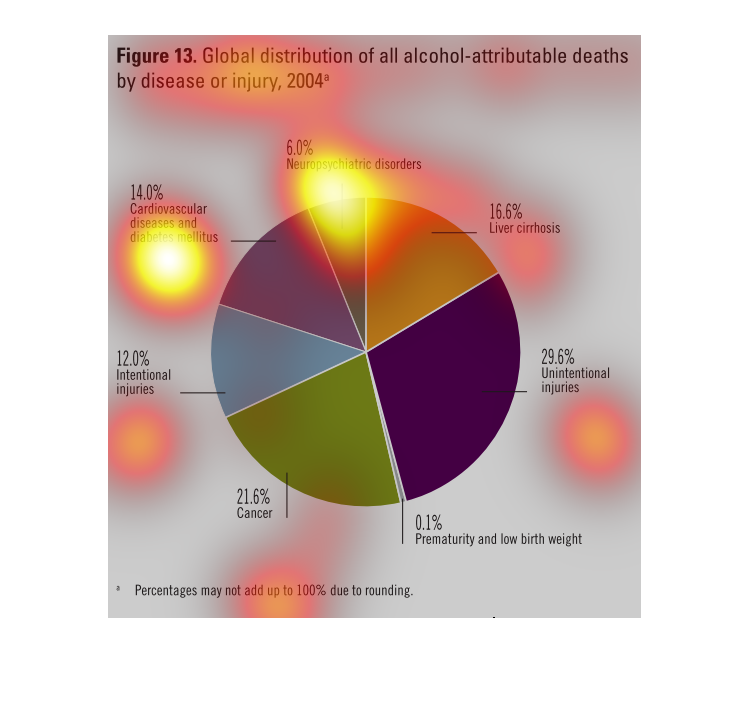
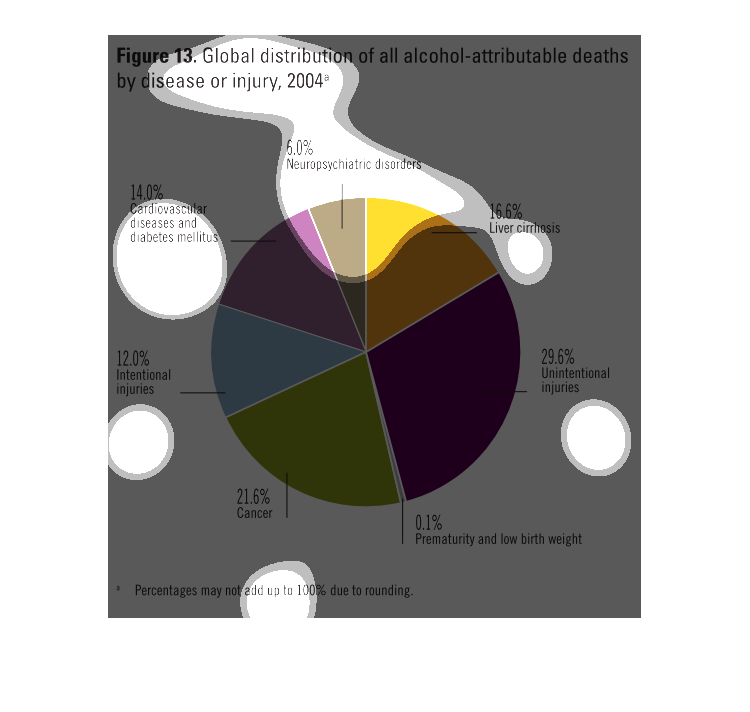
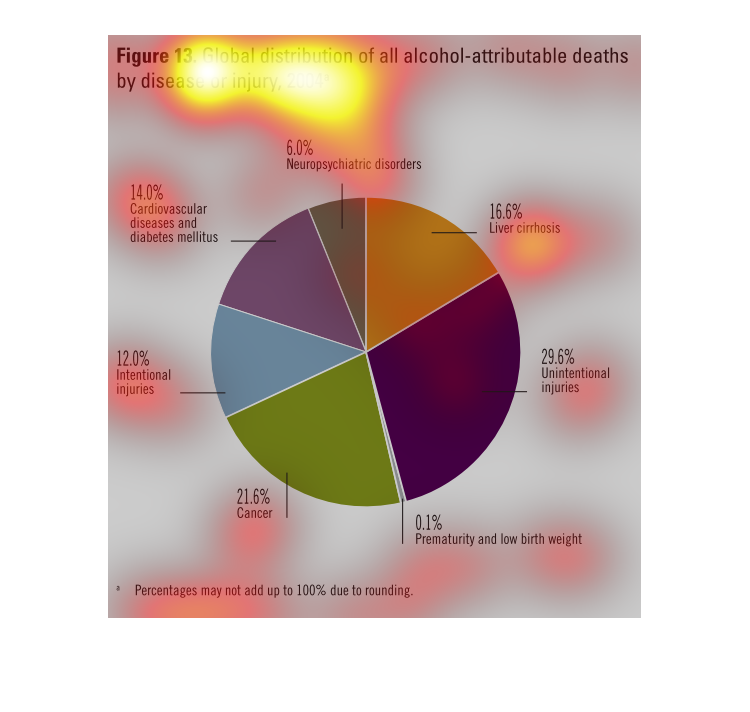
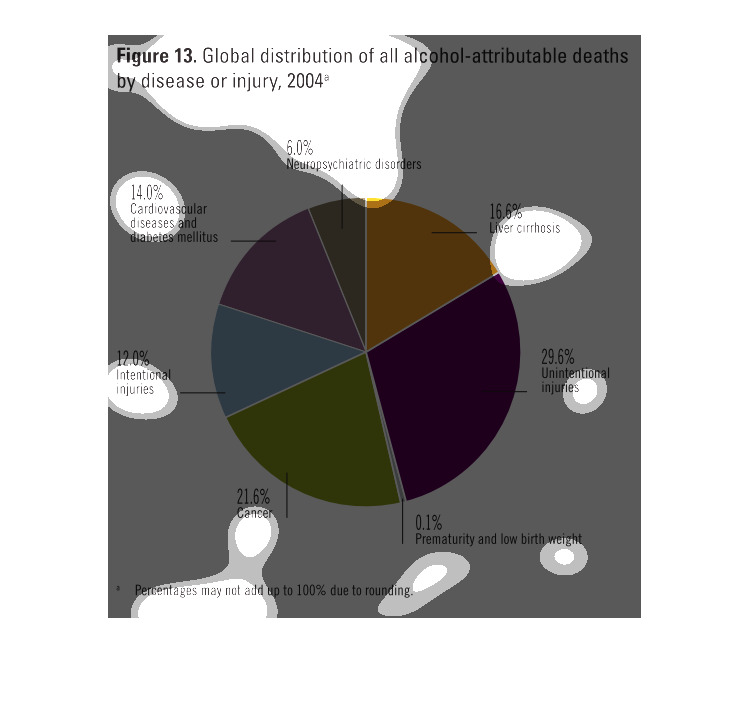
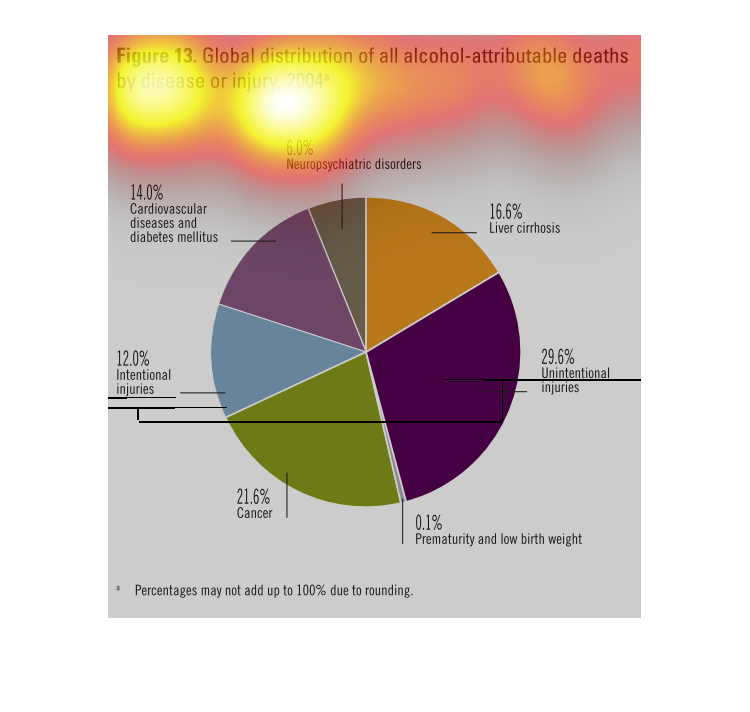
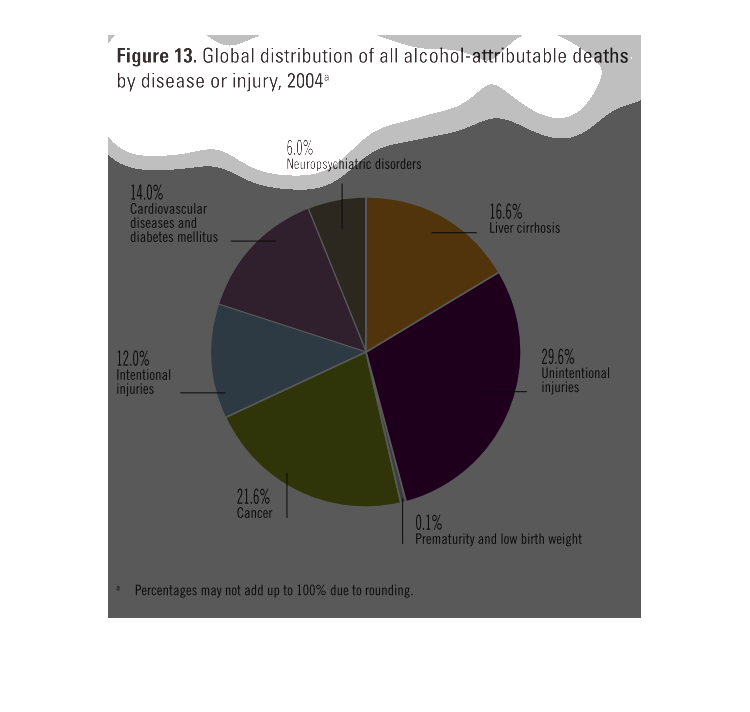
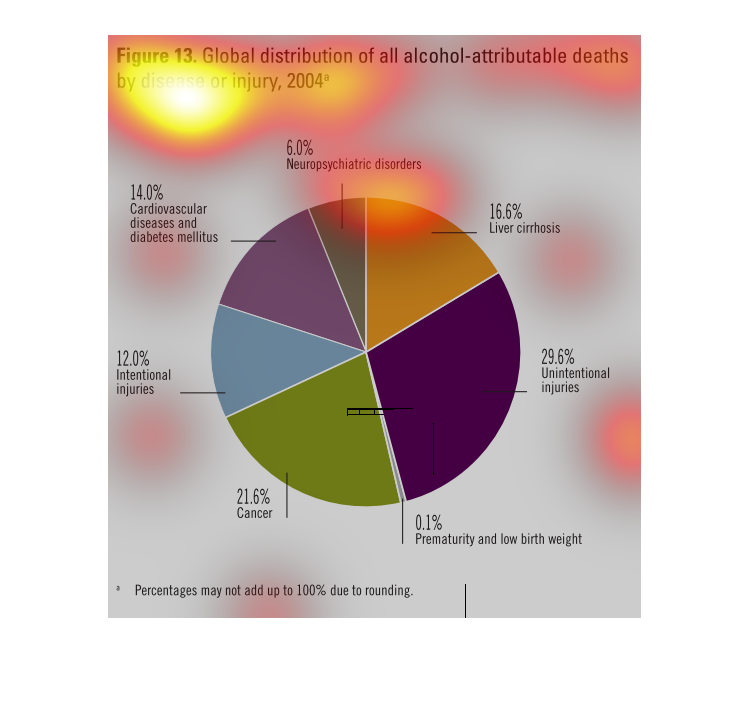
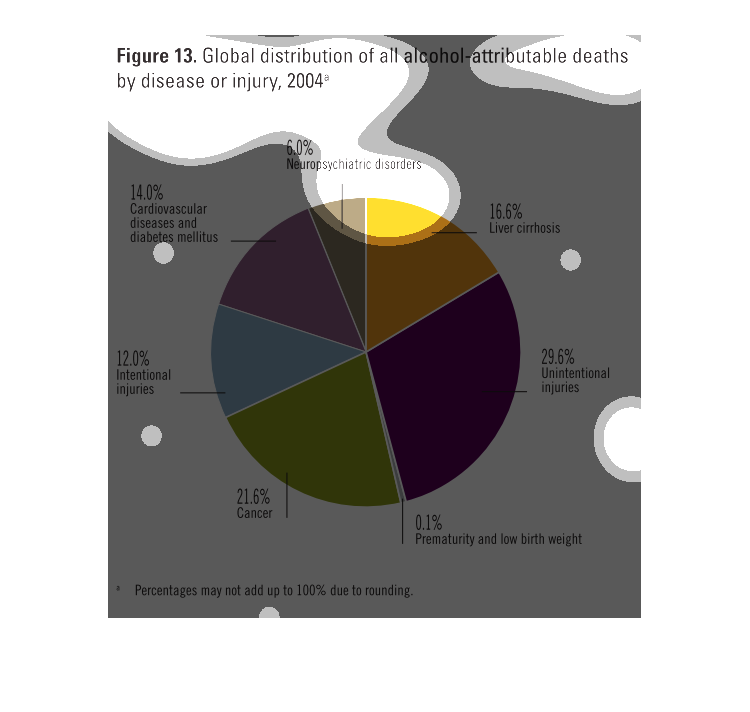
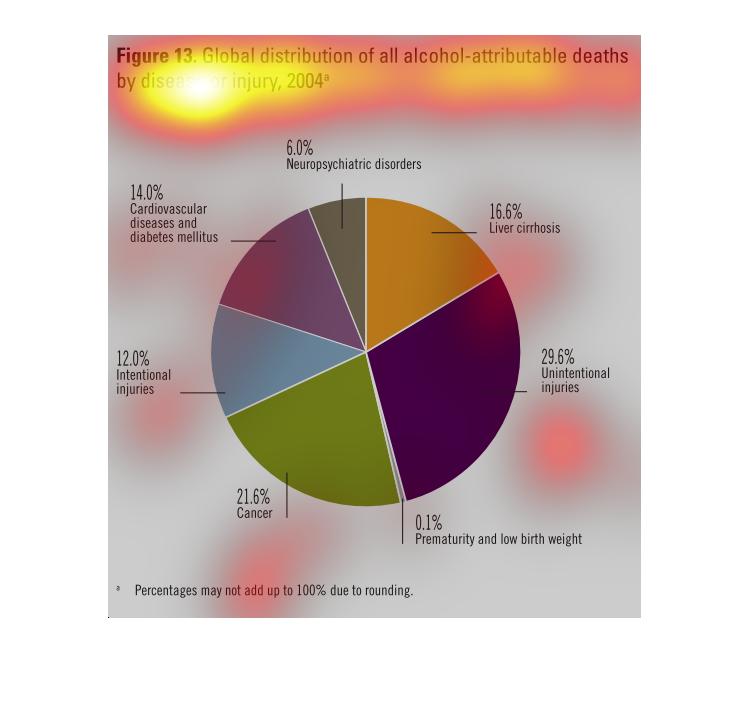
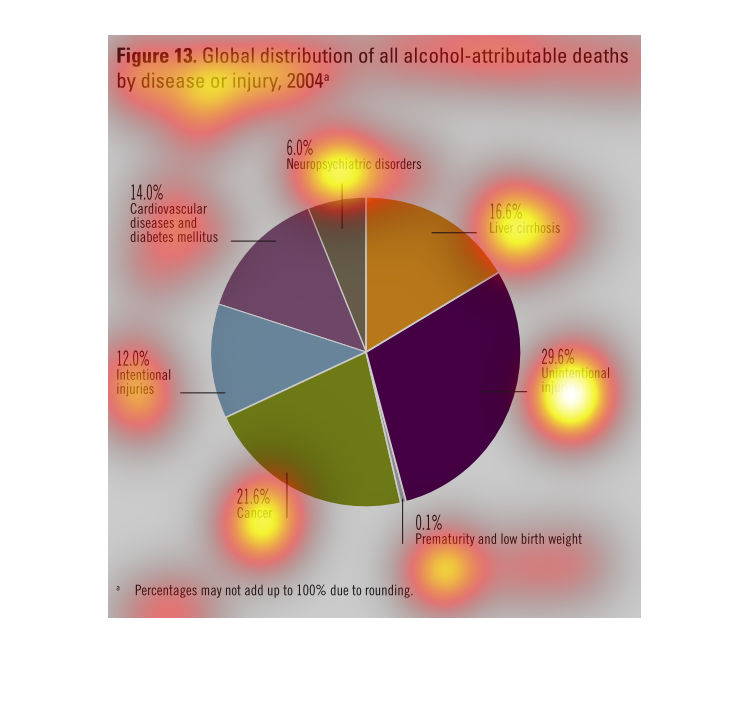
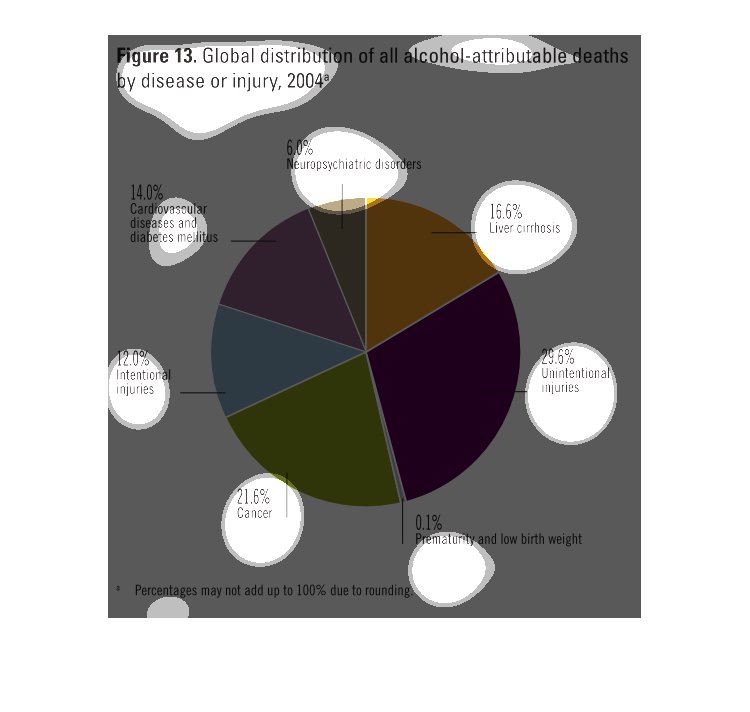
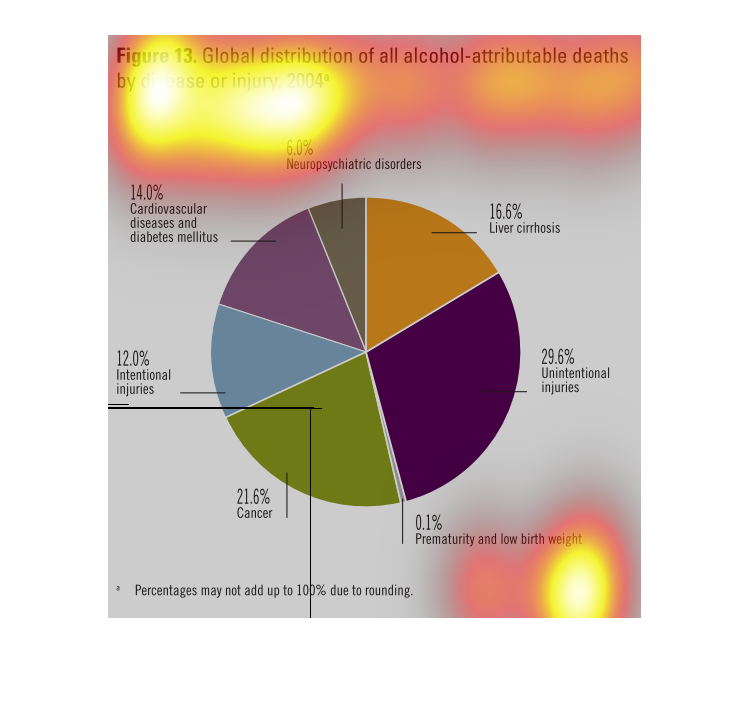
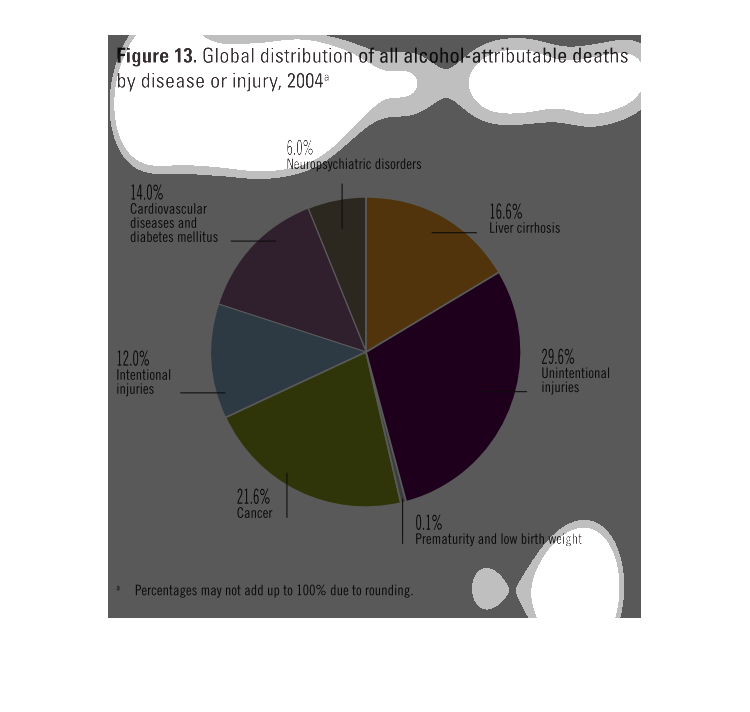
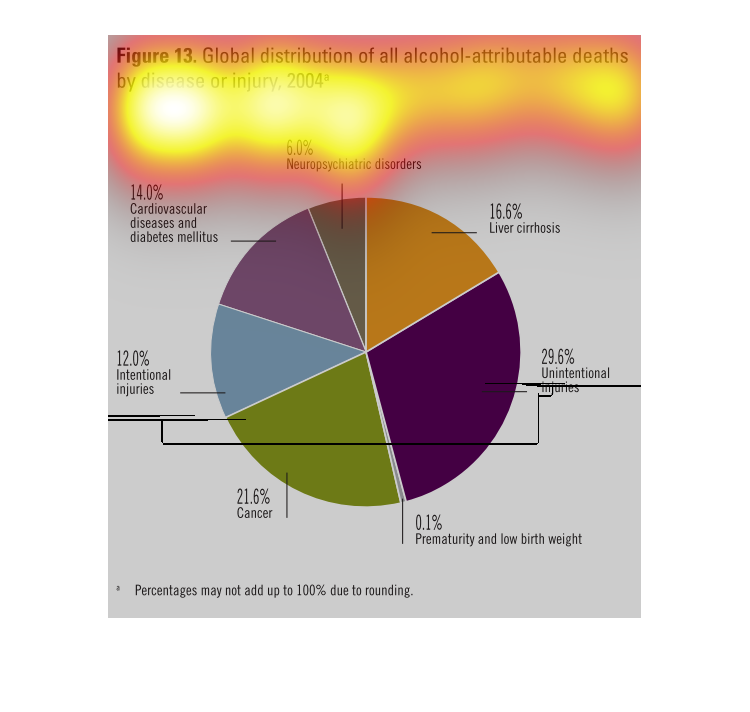
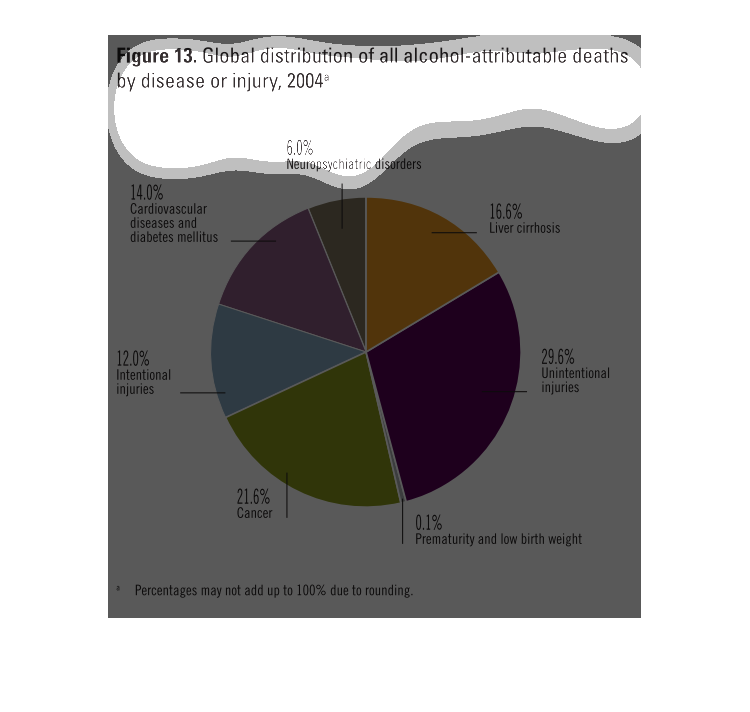
The image depicts a pie chart of global distribution of all alcohol-attributed deaths by disease
or injury, 2004*. Unintentional injures account for the plurality with 29.6%, followed by:
cancer 21.6%, liver cancer 16.6%, cardiovascular disease and diabetes mellitus 14%, intentional
injuries 12.0%, and neurophychiatric disease 6.0%.
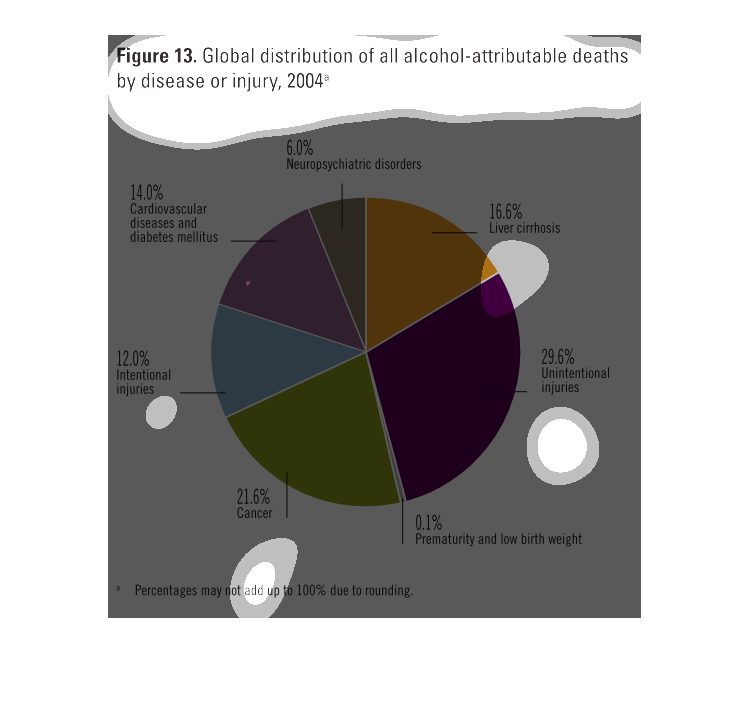
Global distribution of causes of alcohol-related deaths (disease or injury) in 2004.  Highest
percentage is unintentional injury (close to 30%).  Second-highest is cancer, at 22%.  Third-highest
is cirrhosis, at 17%.
This chart describes global distribution of all alcohol-attributable deaths by disease or
injury, for the year 2004. Different categories on the chart are represented by different
colors.
This handmade chart shows the overall causes of death related to alcohol consumption and shows
how heart disease and liver disease are some of the more common sources of death
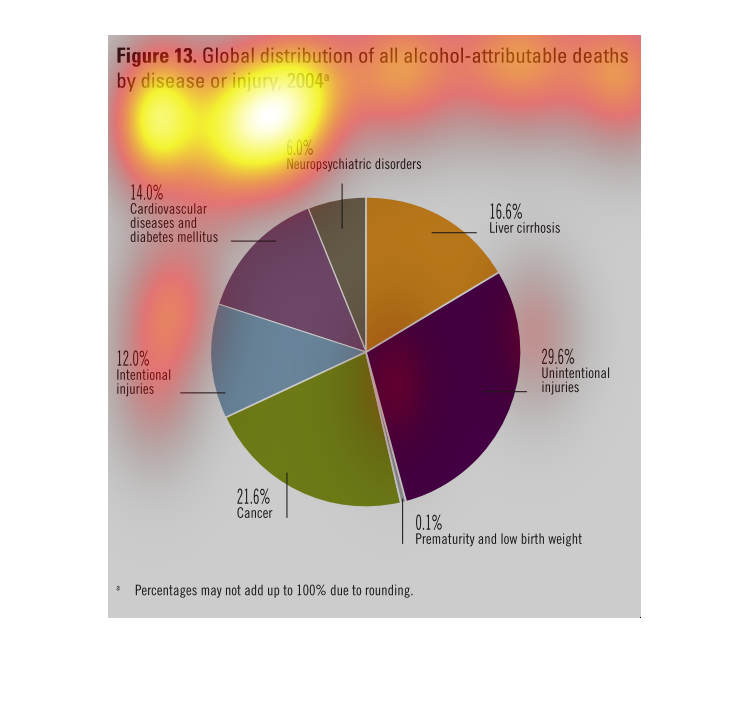
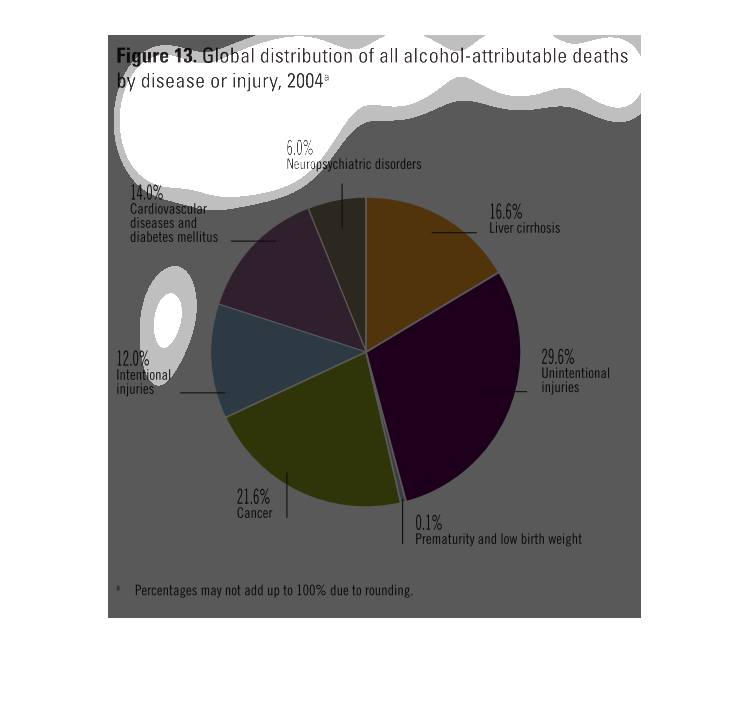
figure 13, global distribution of all alcohol-attributable deaths by disease or injury, 2004.
We see a pie graph; 29.6% are unintentional injuries, 21.6% cancer, 16.6% liver cirrhosis,
12% intentional injuries,14% is cardiovascular and diabetes (doesn't make sense), 6% is neuropsychiatric
On the pie chart is a graph showing the global distribution of all alcohol attributable deaths
by disease or injury in 2004. 29.6% were from unintentional injuries, 21.6% from cancer, 16.6
liver cirrhosis, 14% cardiovascular disease and 12% was from intentional injuries.
This chart talks about alcoholic deaths due to illness or injury for the year 2004. 29.6%
makes up unintentional deaths, while 16.6 % is from cirrhosis.
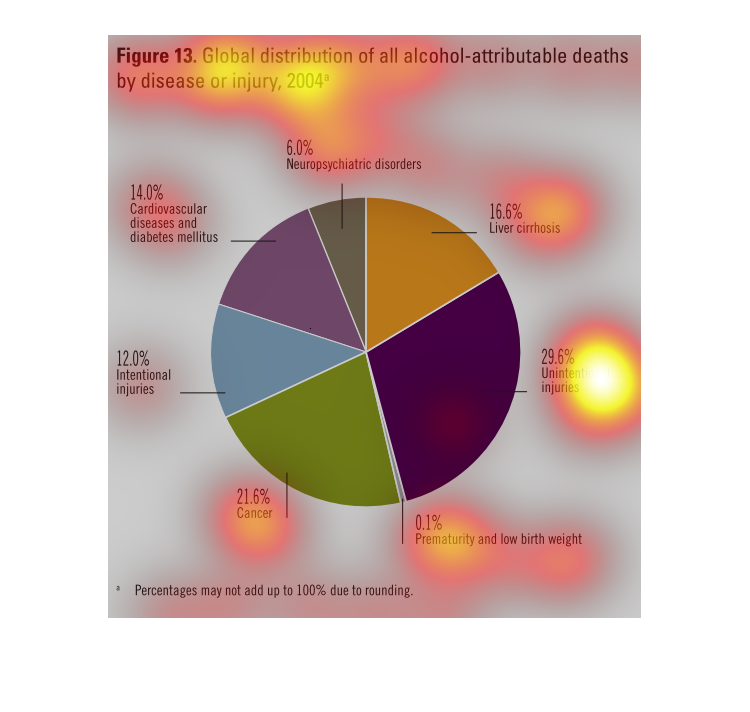
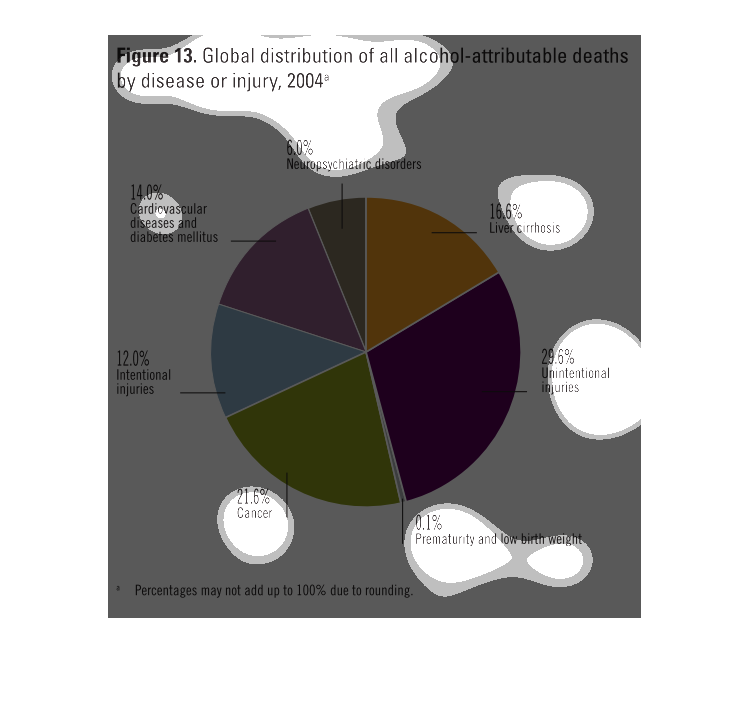
The pie graph shows the percentage of alcohol related injuries or death broken down by type
of injury. The highest number of alcohol related death is due to unintentional injuries at
29.6% of all injuries or death. This is closely followed by cancers related to alcoholism,
which accounts for 21.6%. The next results of alcohol consumption include liver cirrhosis
(16.6% of injuries or death), cardiovascular disease and diabetes mellitus (14%), intentional
injuries (12%), neuropsychiatric disorders related to alcoholism (6%), and prematurity or
low birth weight (0.1%).
This is a color coded pie chart depicting global distribution of all alcohol-attributable
deaths by disease or injury in the year 2004. The majority are shown to be unintentional injuries.
This chart describes global distribution of all alcohol attributable deaths by disease or
injury for the year 2004. Different categories on the chart are represented by different colors.
The figure is a pie chart representing data on global causes of alcohol related deaths from
injury and disease in 2004 as percentages of all alcohol related deaths (with the most prevalent
being unintentional injuries and cancer).