This chart describes global alcohol attributable, deaths, distribution of deaths and population-attributable.
Categories on the list include disorder or injury.
Alcohol will kill you. This study breaks down to minuteman detail the effects of consuming
the drink and how it is slowly killing you and millions of others.
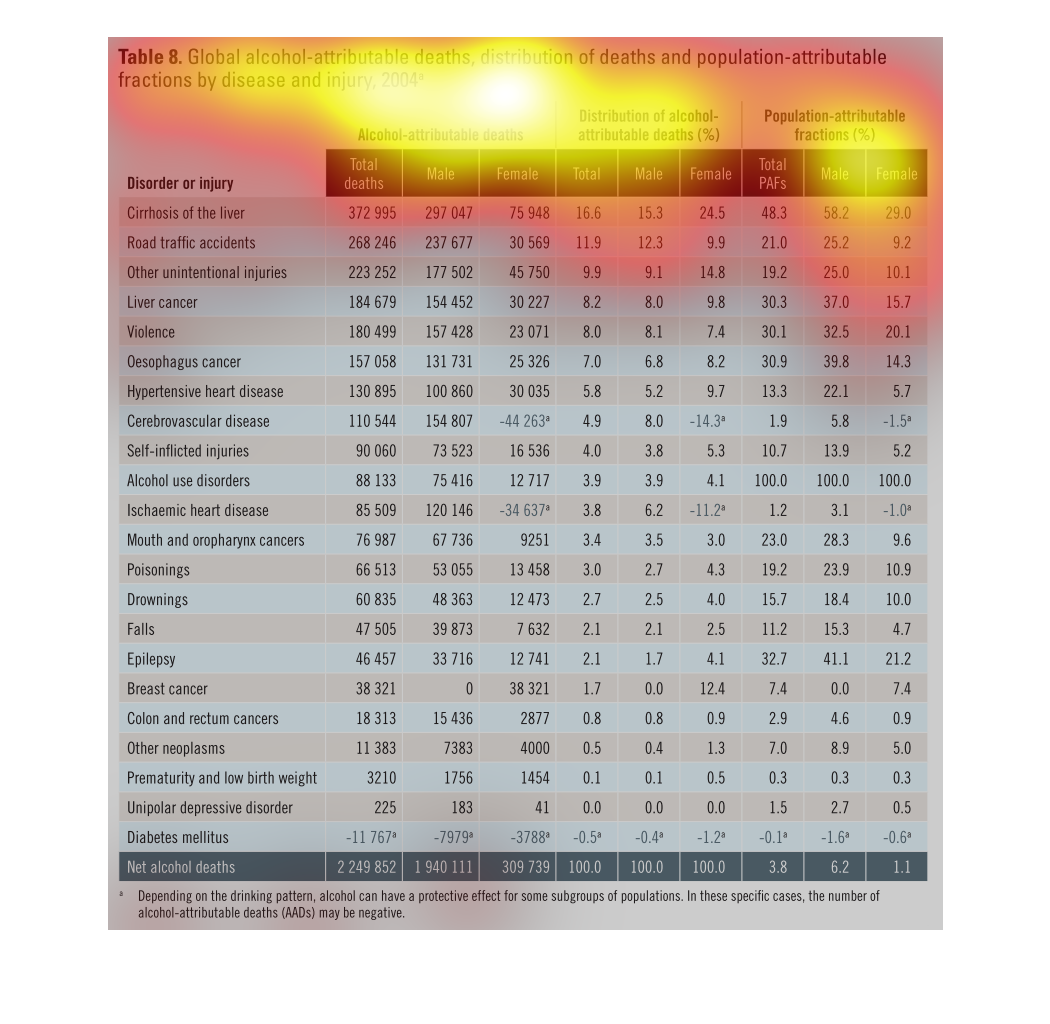
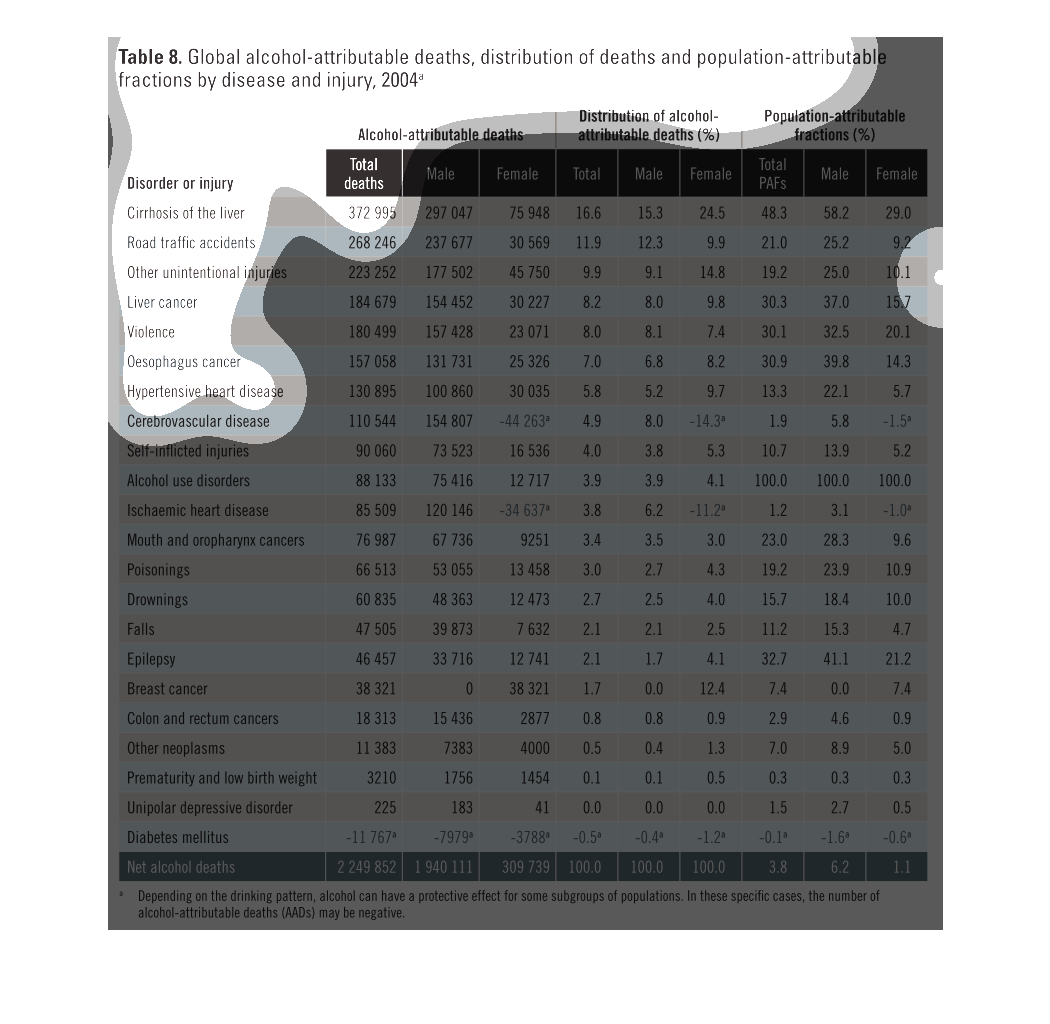
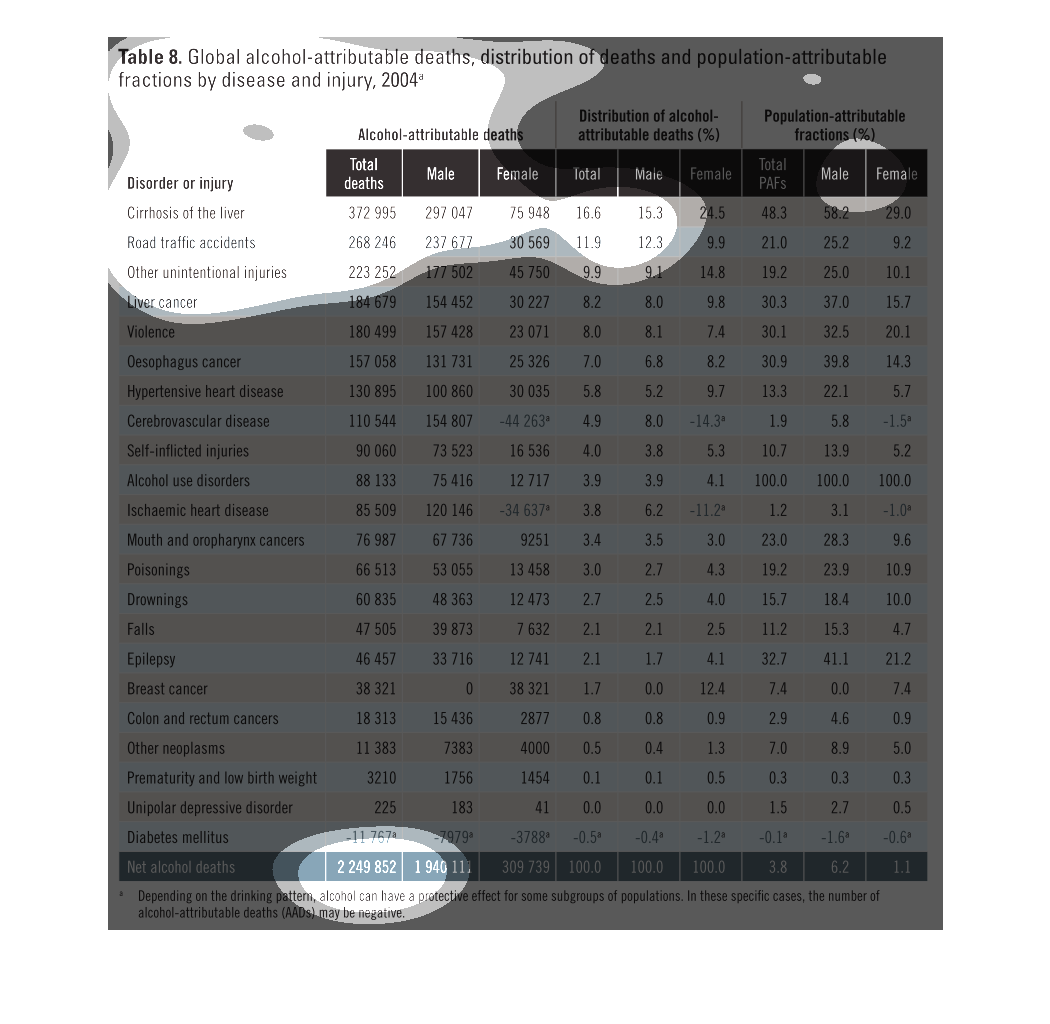
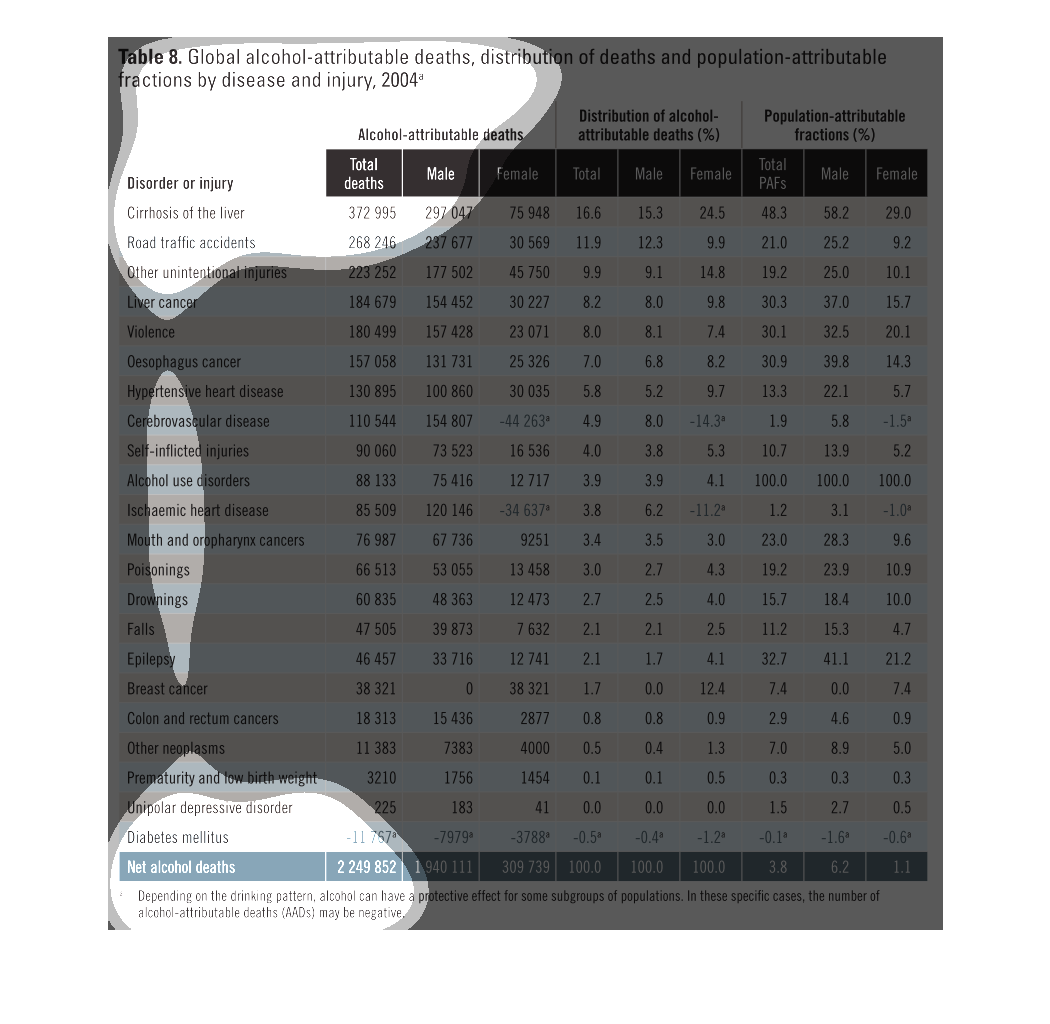
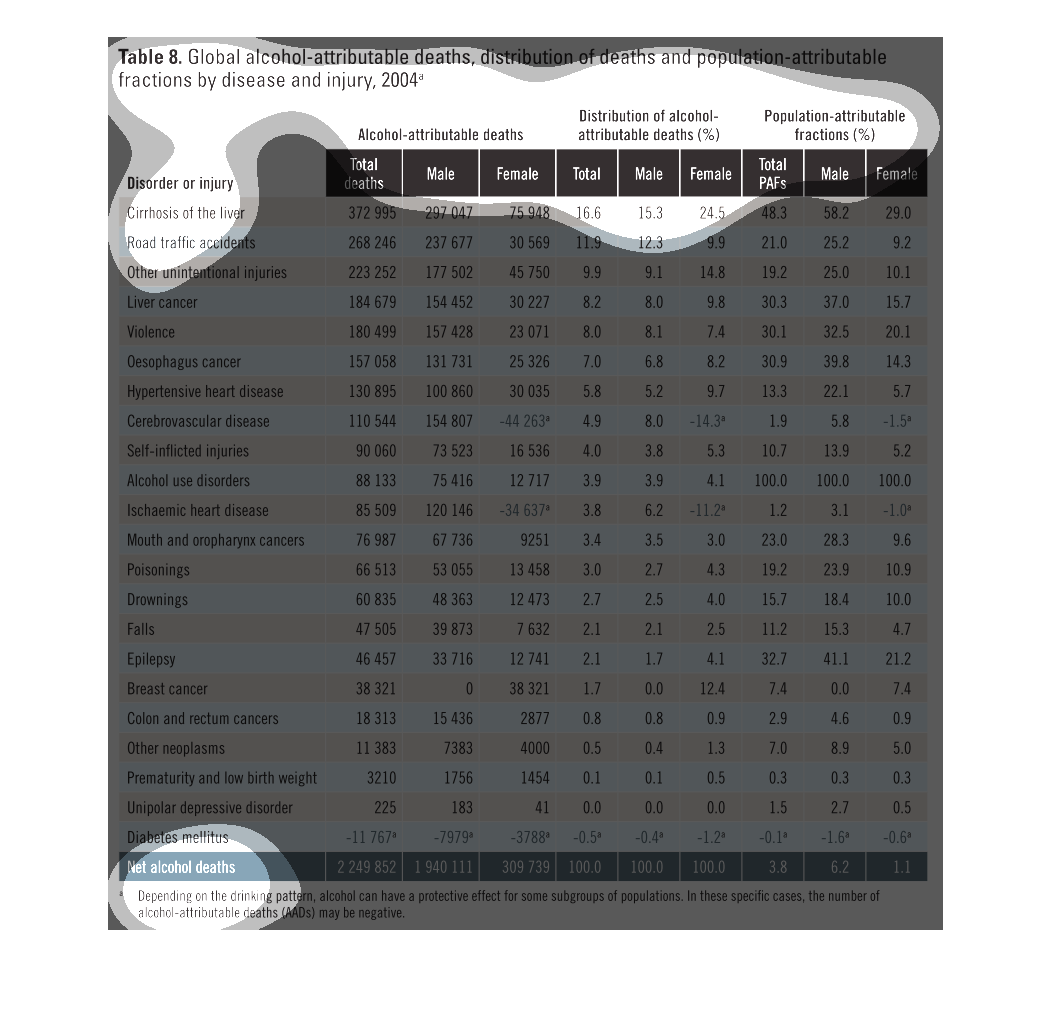
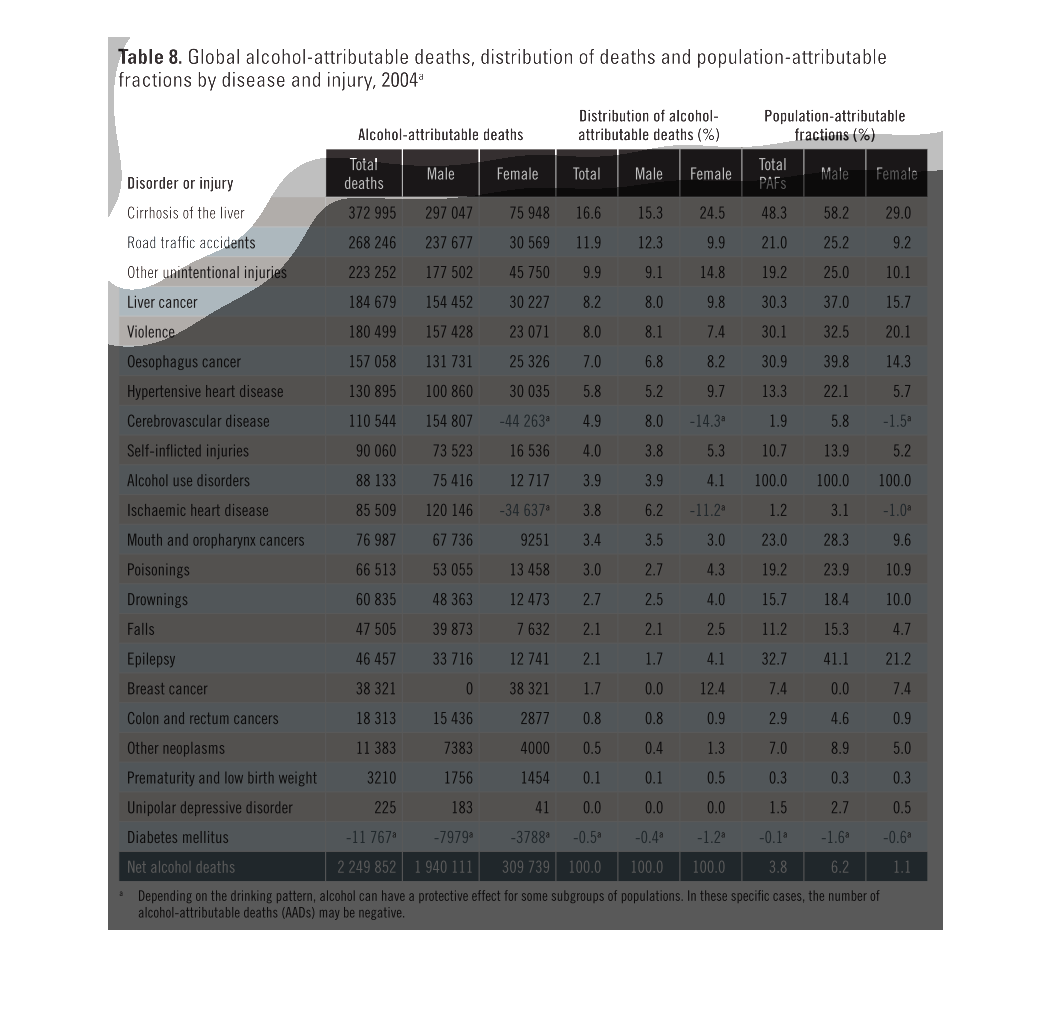
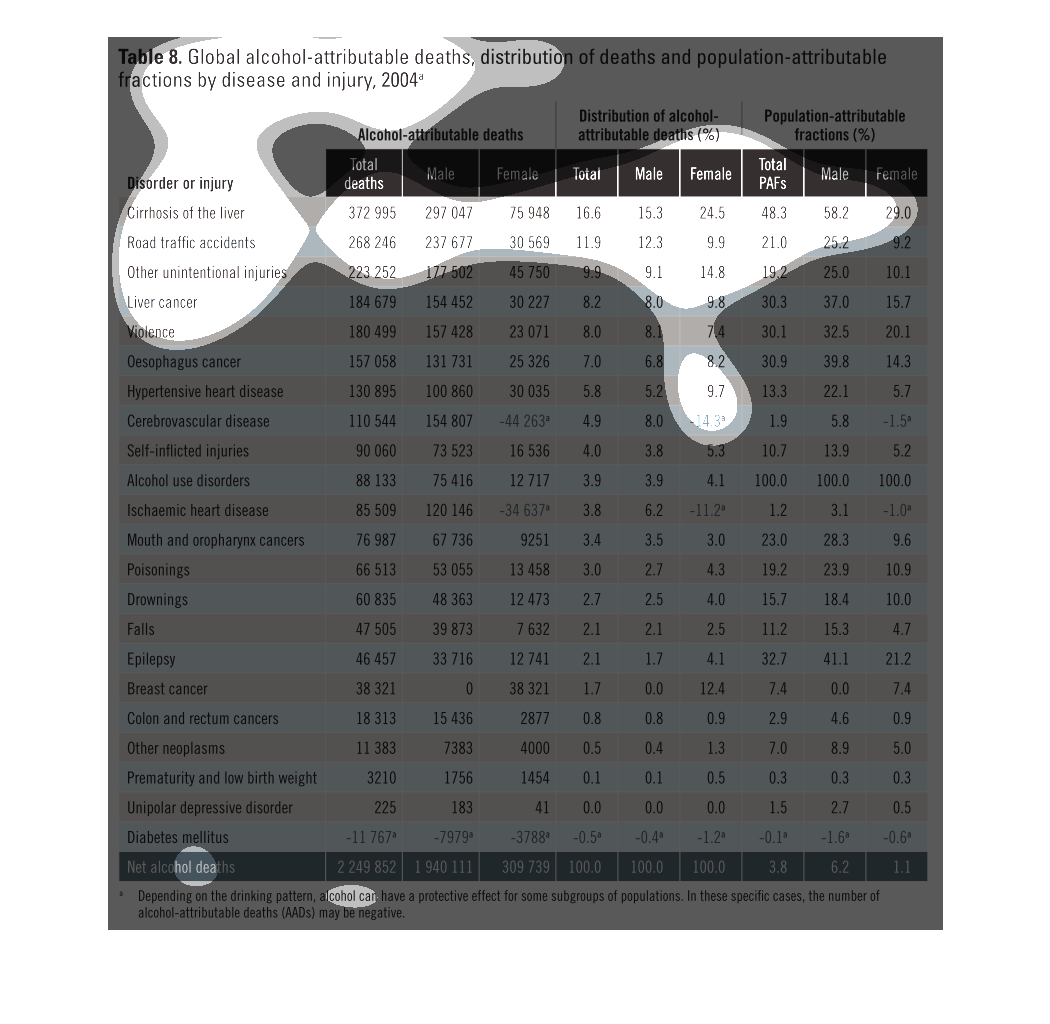
This a chart of alcohol-attributed deaths globally in 2004. The total number of deaths related
to alcohol in 2004 were 2,249,852 people. Of that number 1,940,111 were males and 309,739
were females. The largest causes of death were cirrhosis of the liver, road accidents, and
unintentional injuries.
The image is a table of global alcohol attributed deaths, distribution of deaths and population
attributed fractions. A liver disease is on top of the list for deaths and is most prominent
in men.
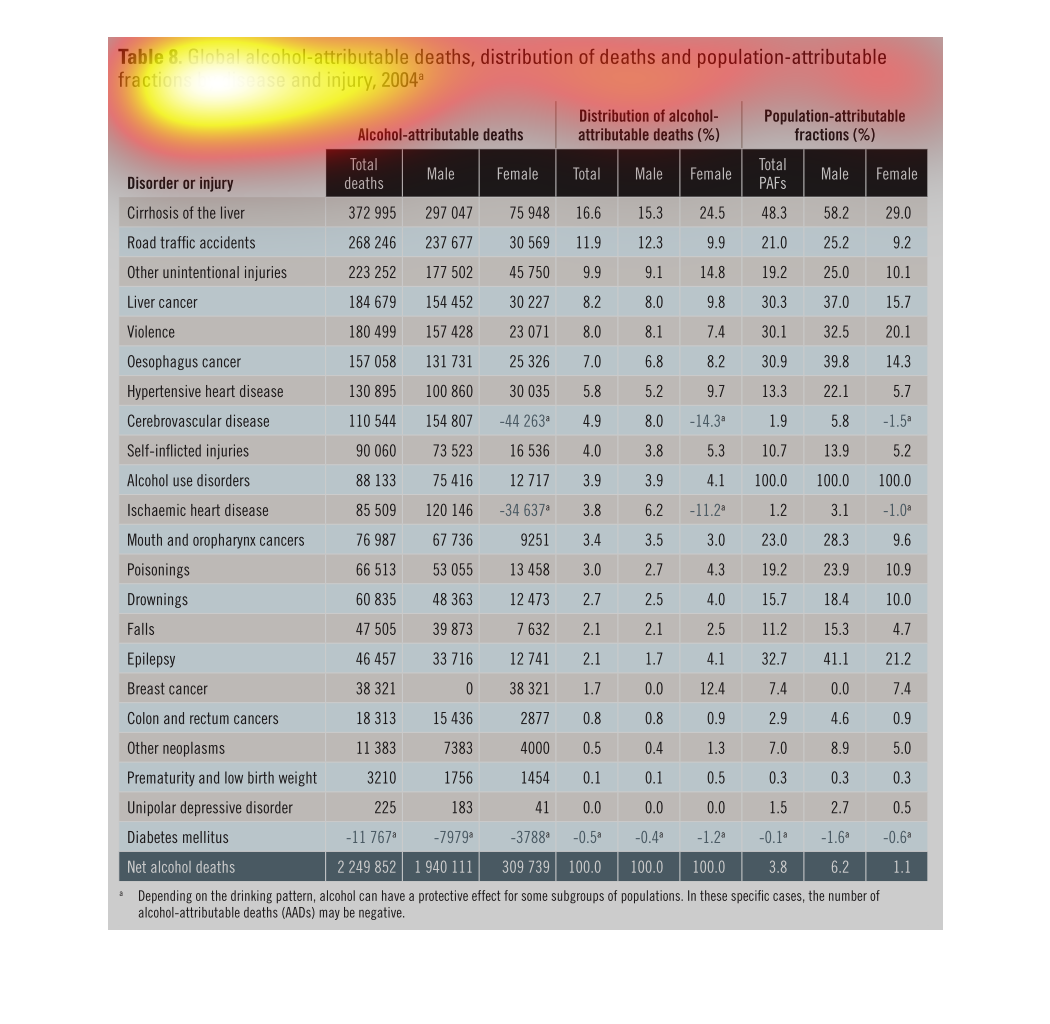
The chart displays the harmful effects of alcohol consumption and most notably accounts for
their effects on death in 2004. The most widespread effect was cirrhosis of the liver, as
it accounted for 372,995 deaths. Total deaths due to alcohol consumption were 2,249,852.
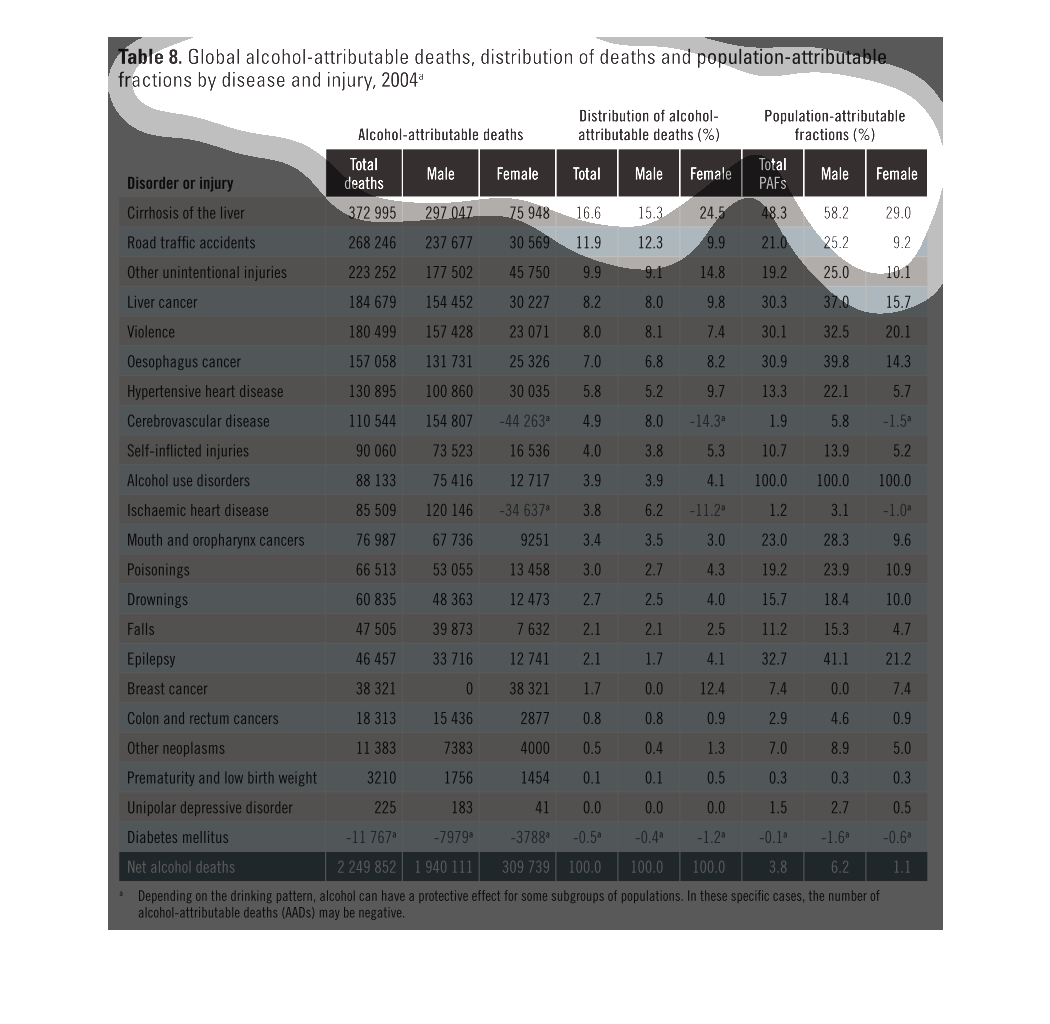
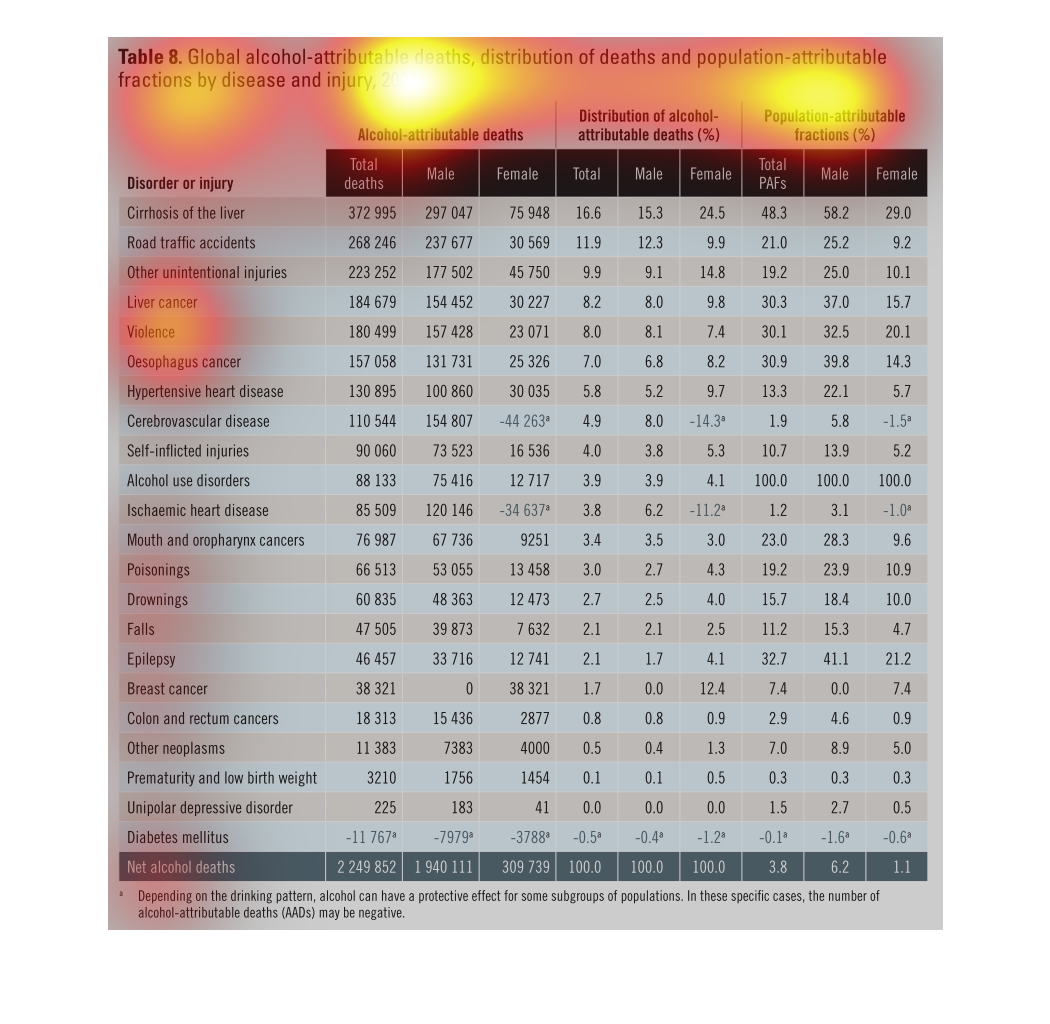
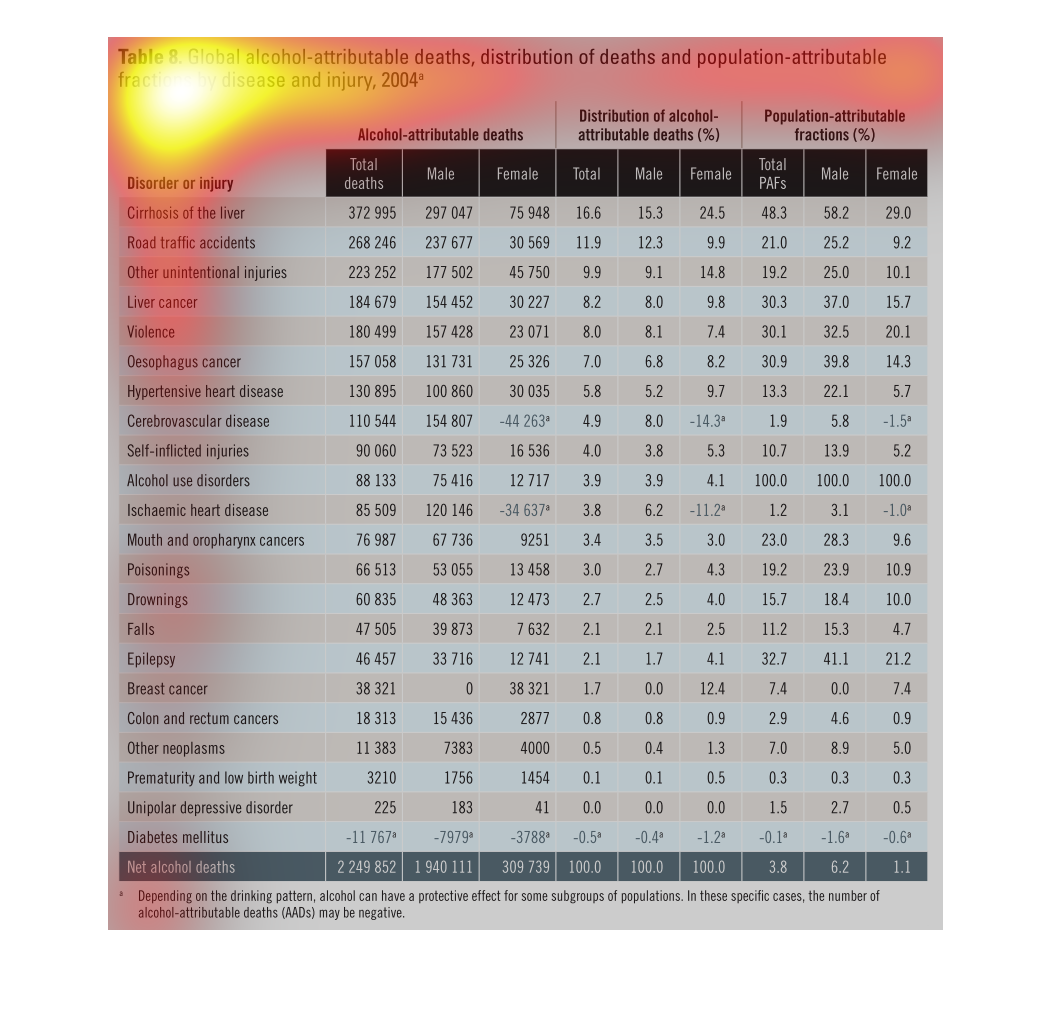
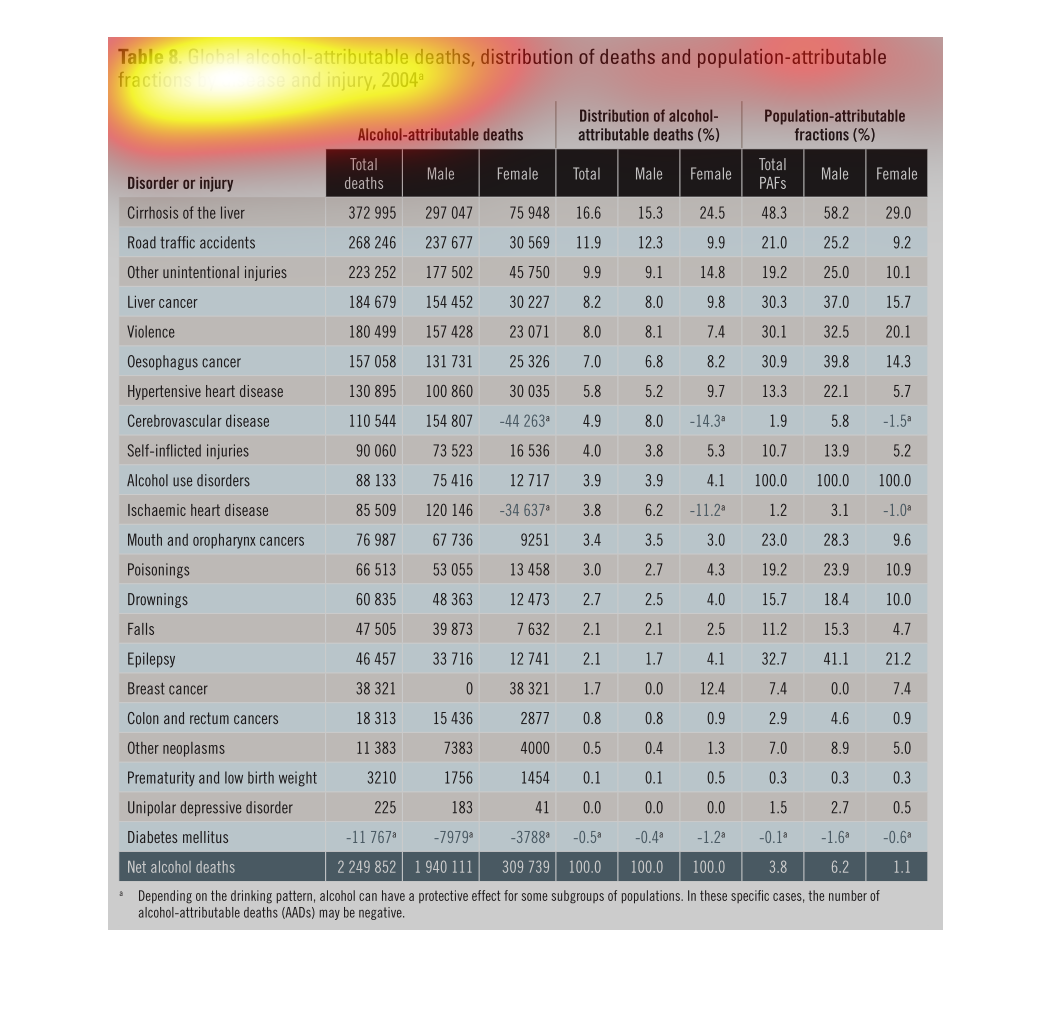
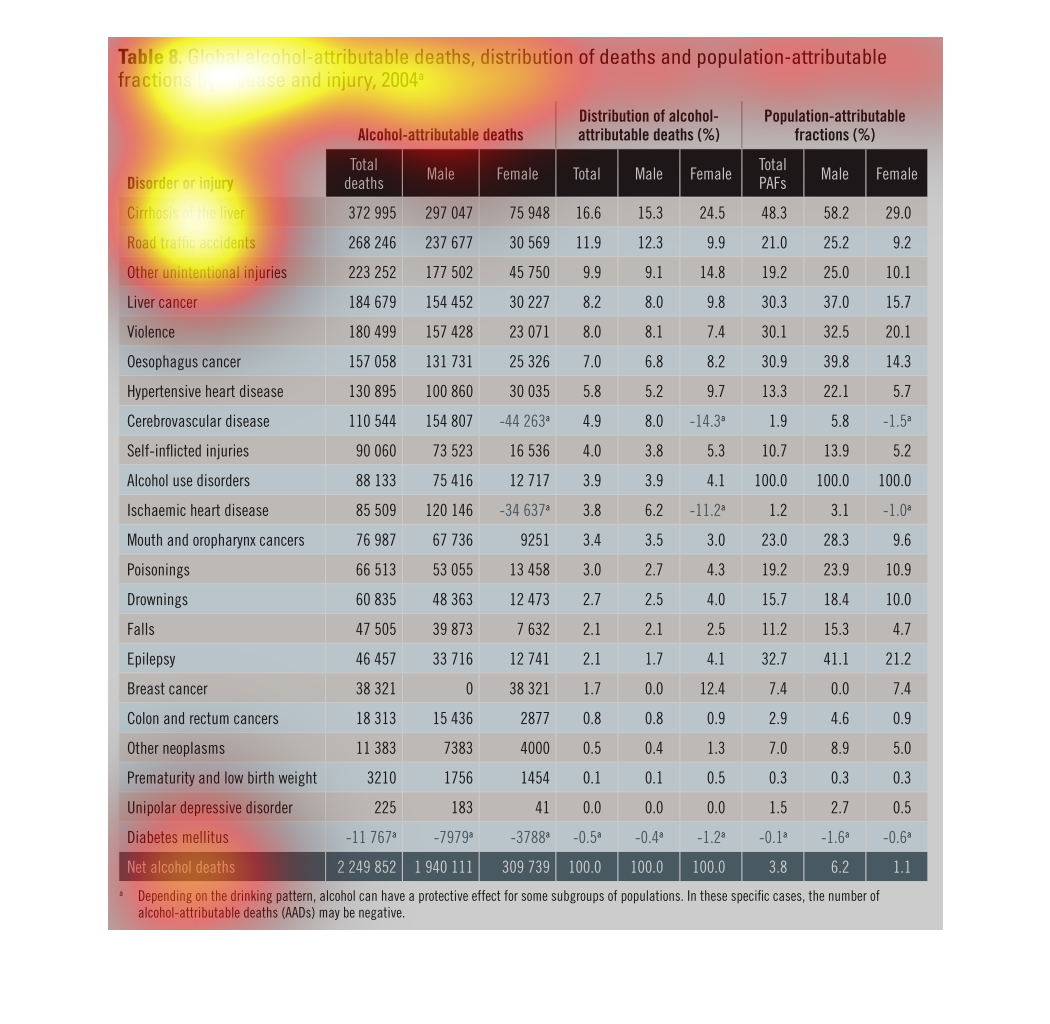
This chart describes global alcohol attributable deaths, distribution of deaths and population
attributable fractions by disease and injury for the year 2004.
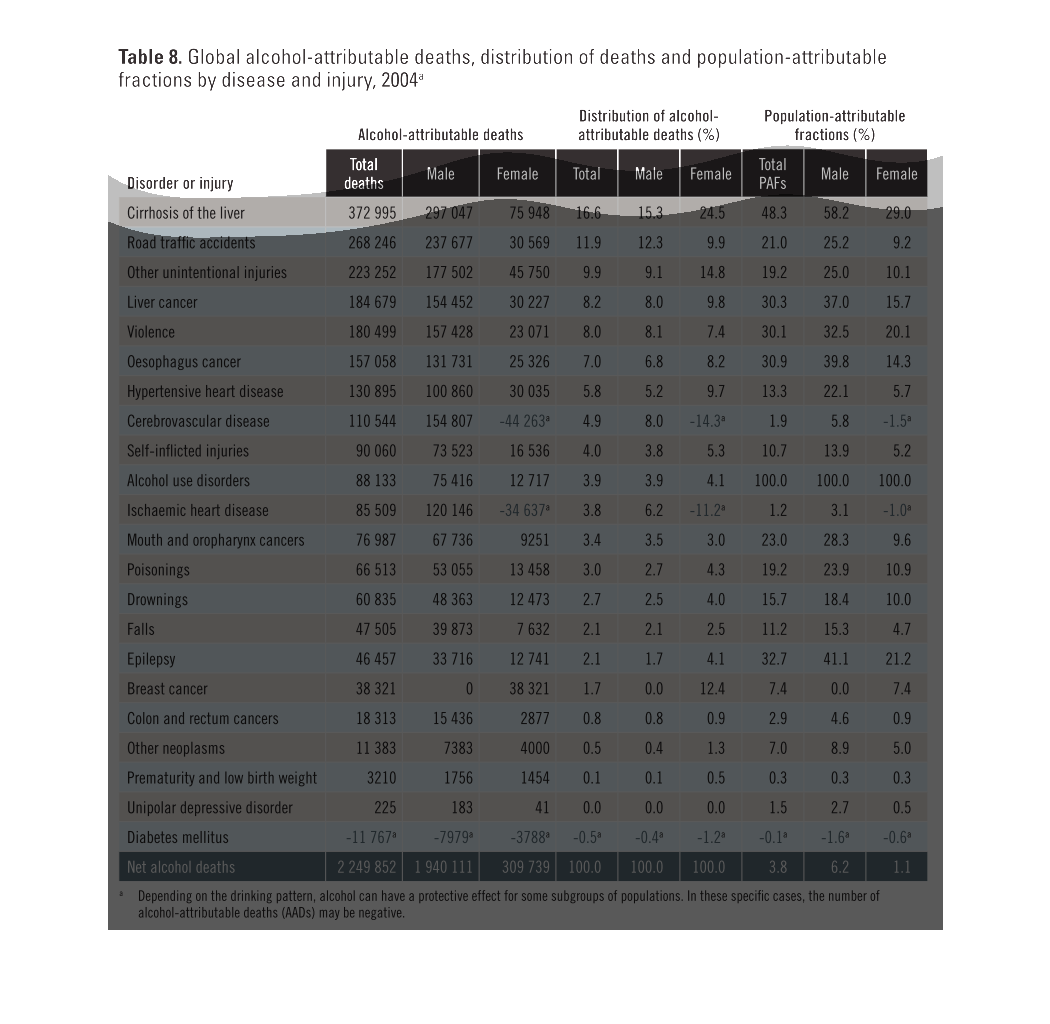
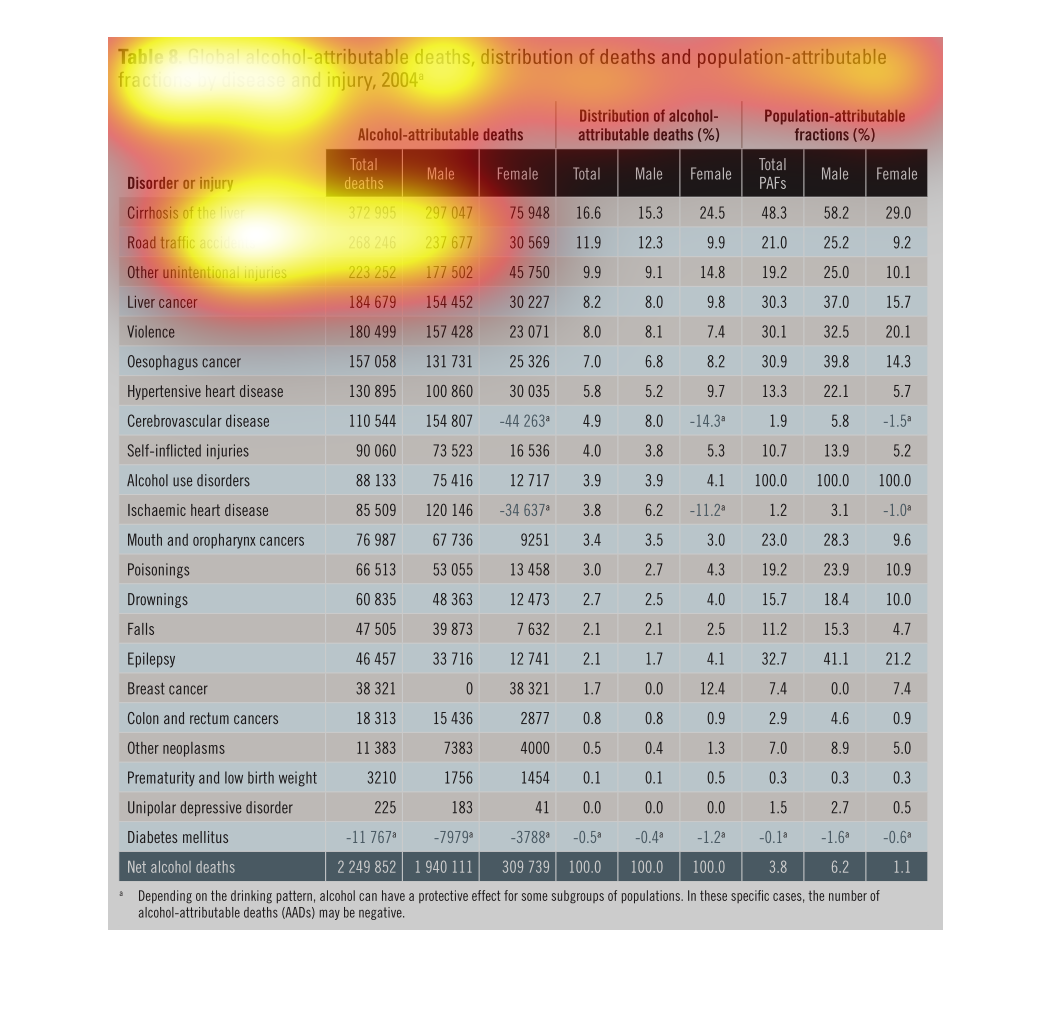
This chart gives an overview of Global alcohol attributable deaths in 2004.  It shows a breakdown
by the specific cause of death, such as auto accidents, liver cancer, heart disease, etc and
then shows a breakdown of total deaths by male and female, percentages by distribution of
alcohol attributable deaths by male and female, and population attributable percentages by
male and female.  The bottom of the chart shows the net results.
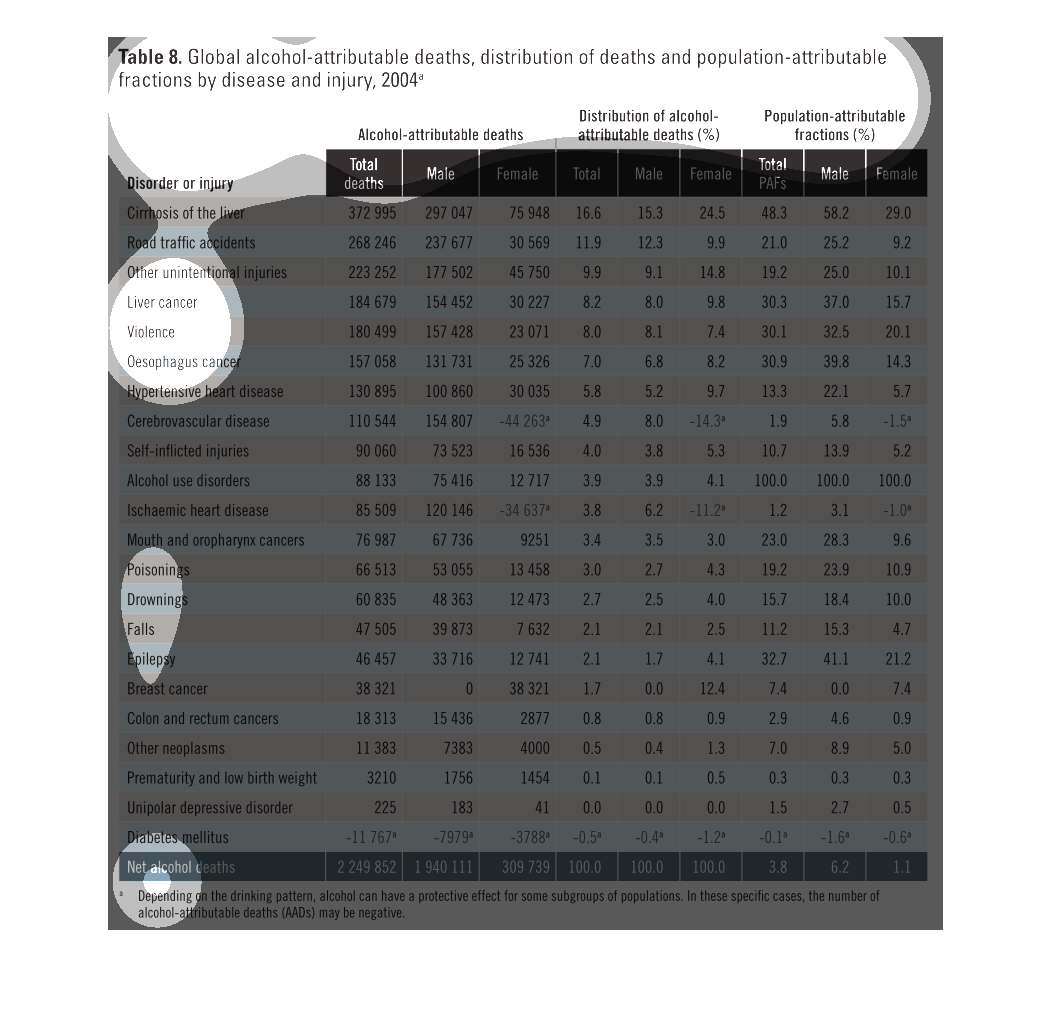
This chart goes into great detail- based on age, gender, demographic- the various illnesses
and deaths that can be attributed to the high consumption of alcohol.
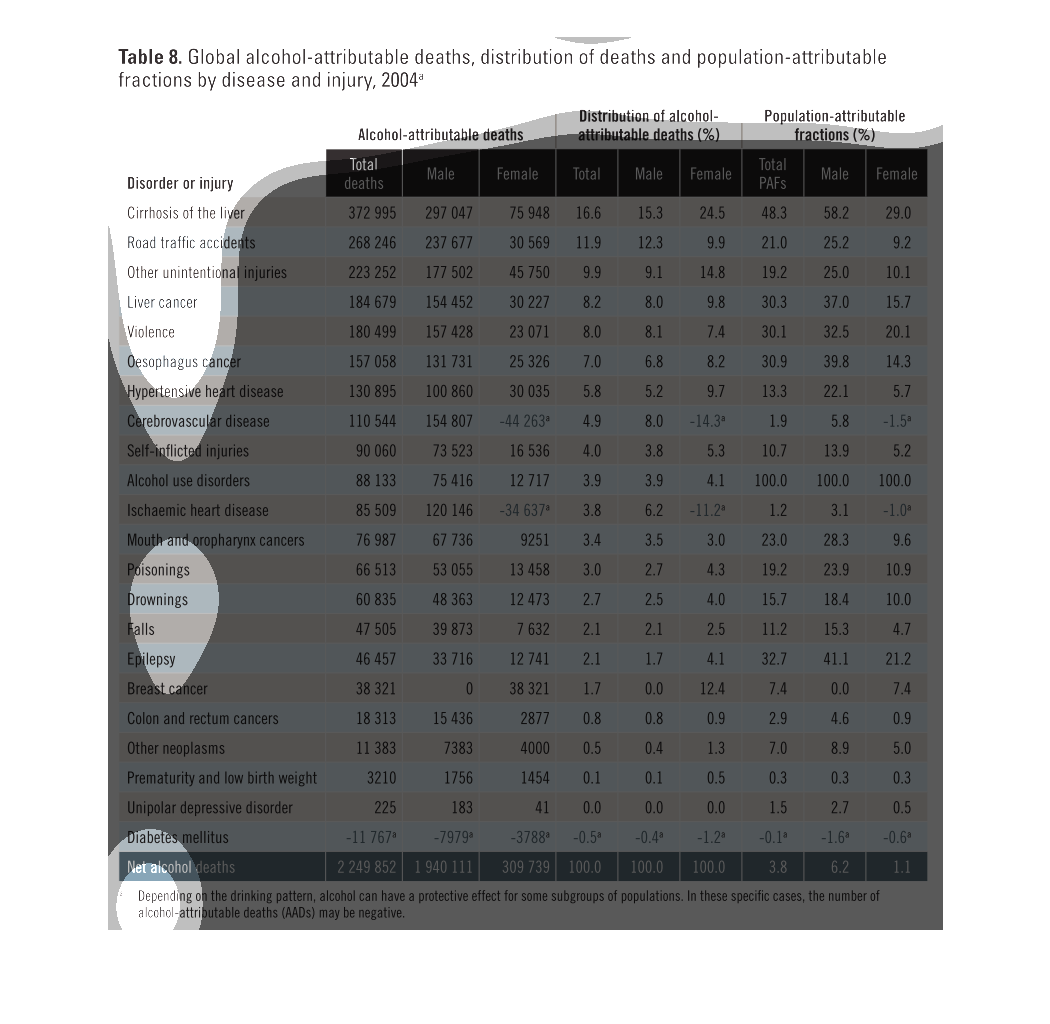
This is a chart that shows the global alcohol attributable deaths. It shows the general distribution
of these deaths within the general population in the year 2004.
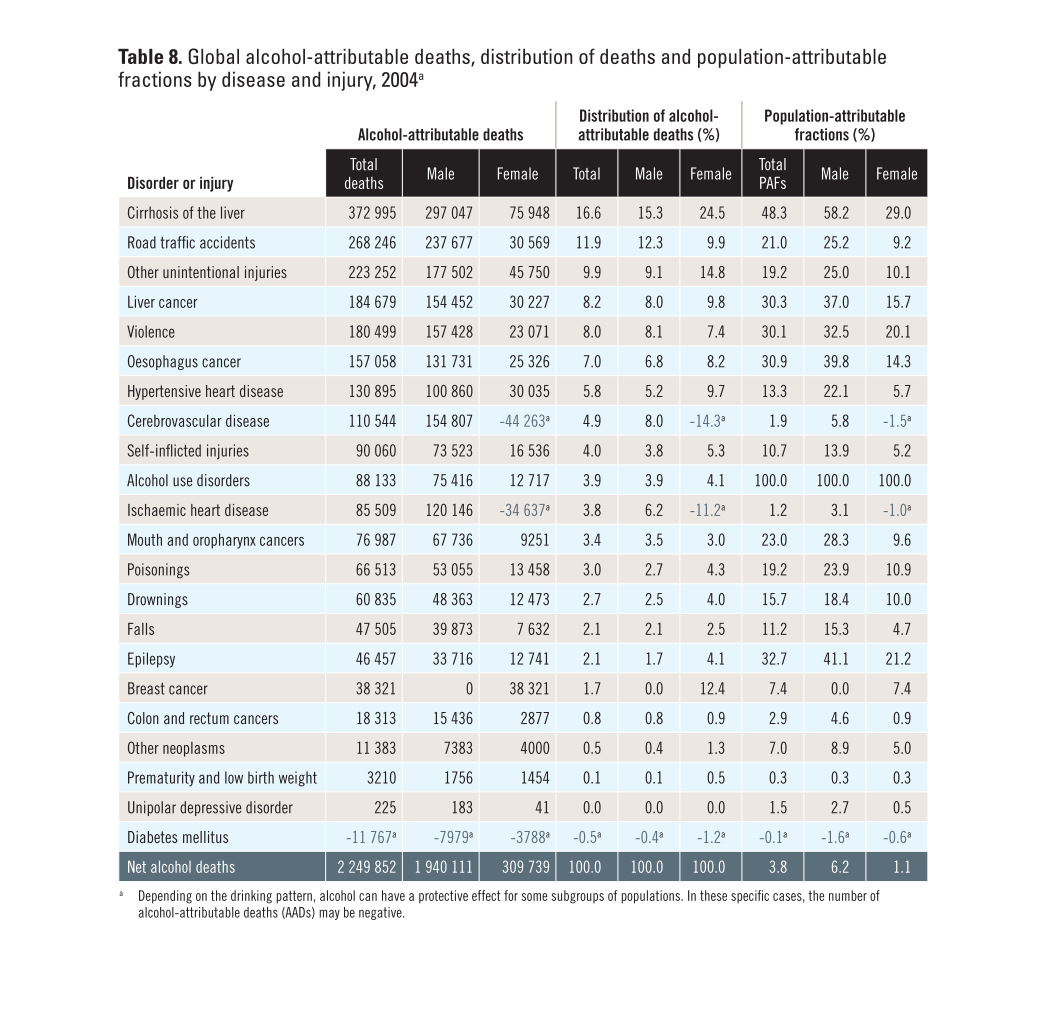
The figure presented is titled table 8: Global alcohol attributable deaths, distribution of
deaths  and population attributable fraction by disease and injury.
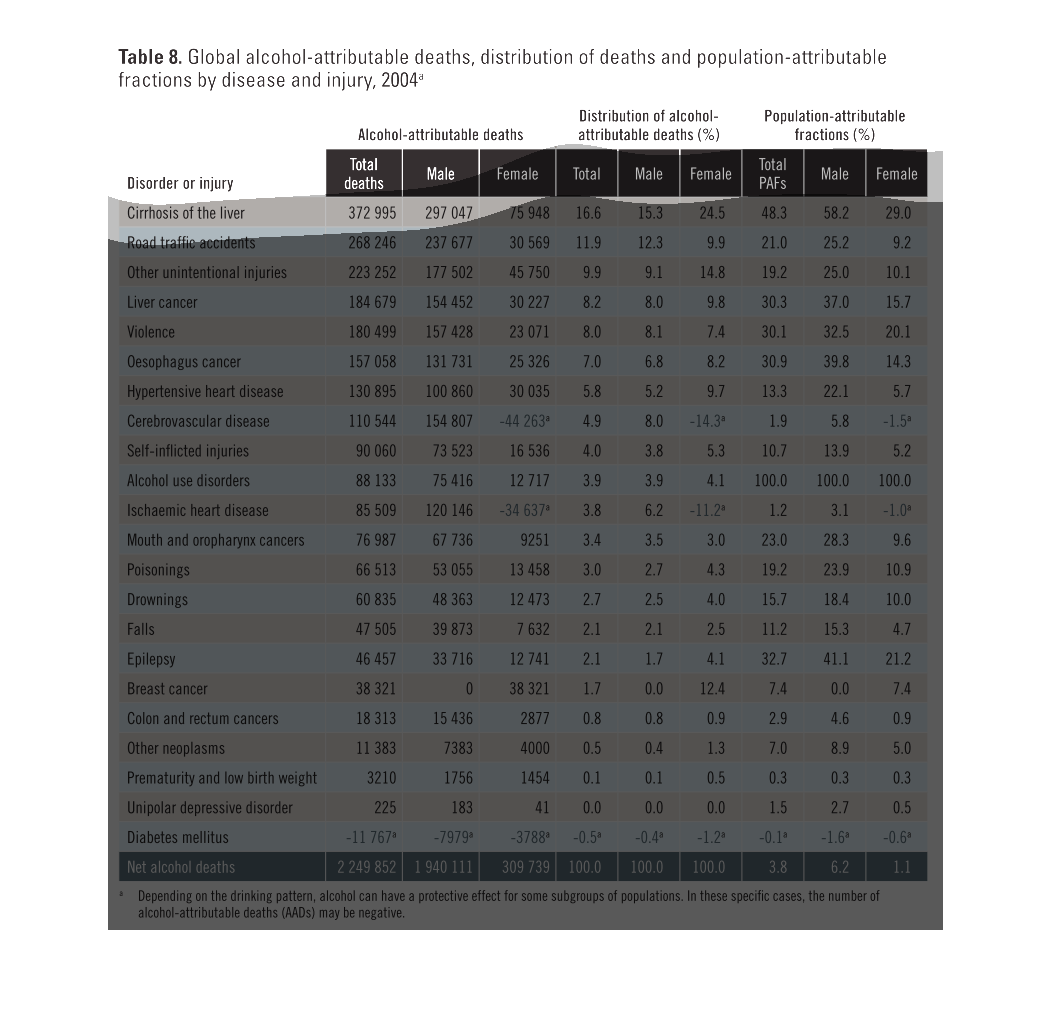
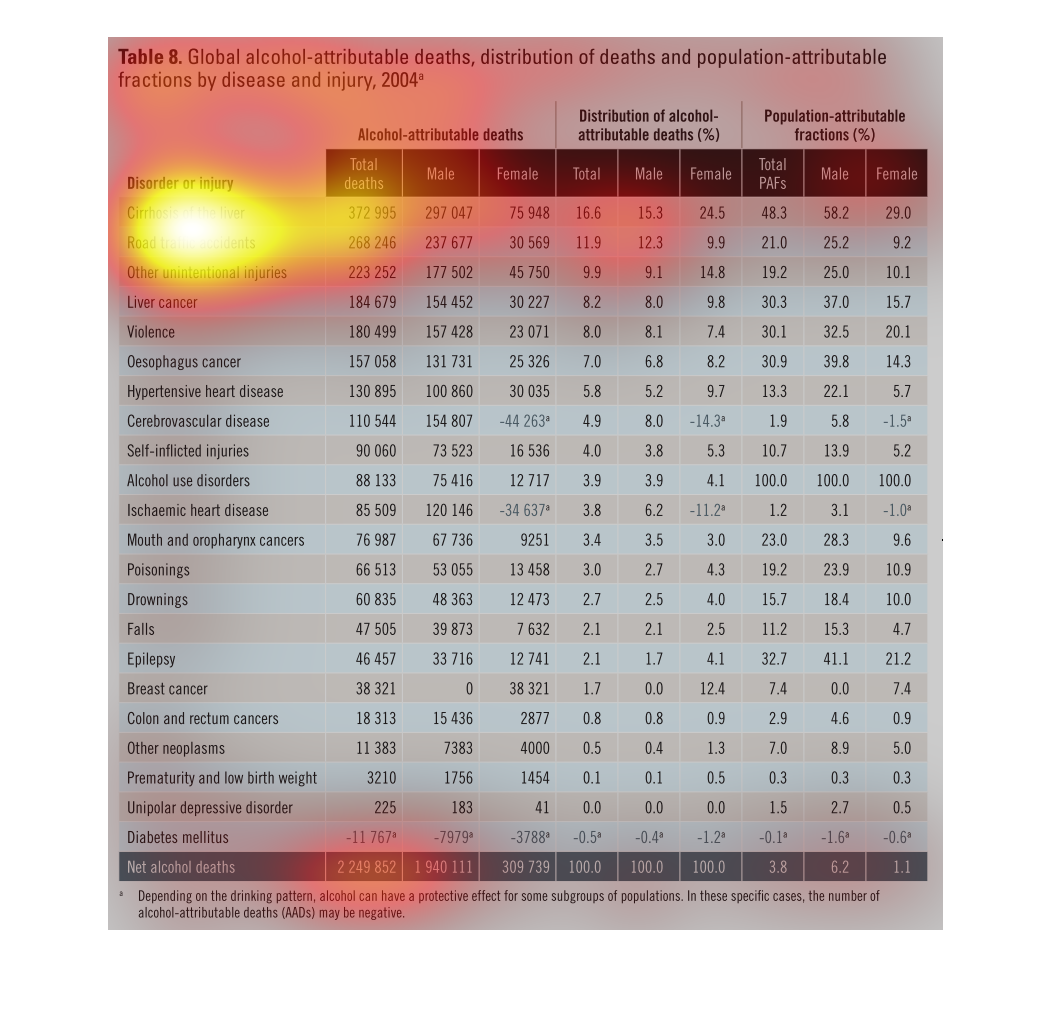
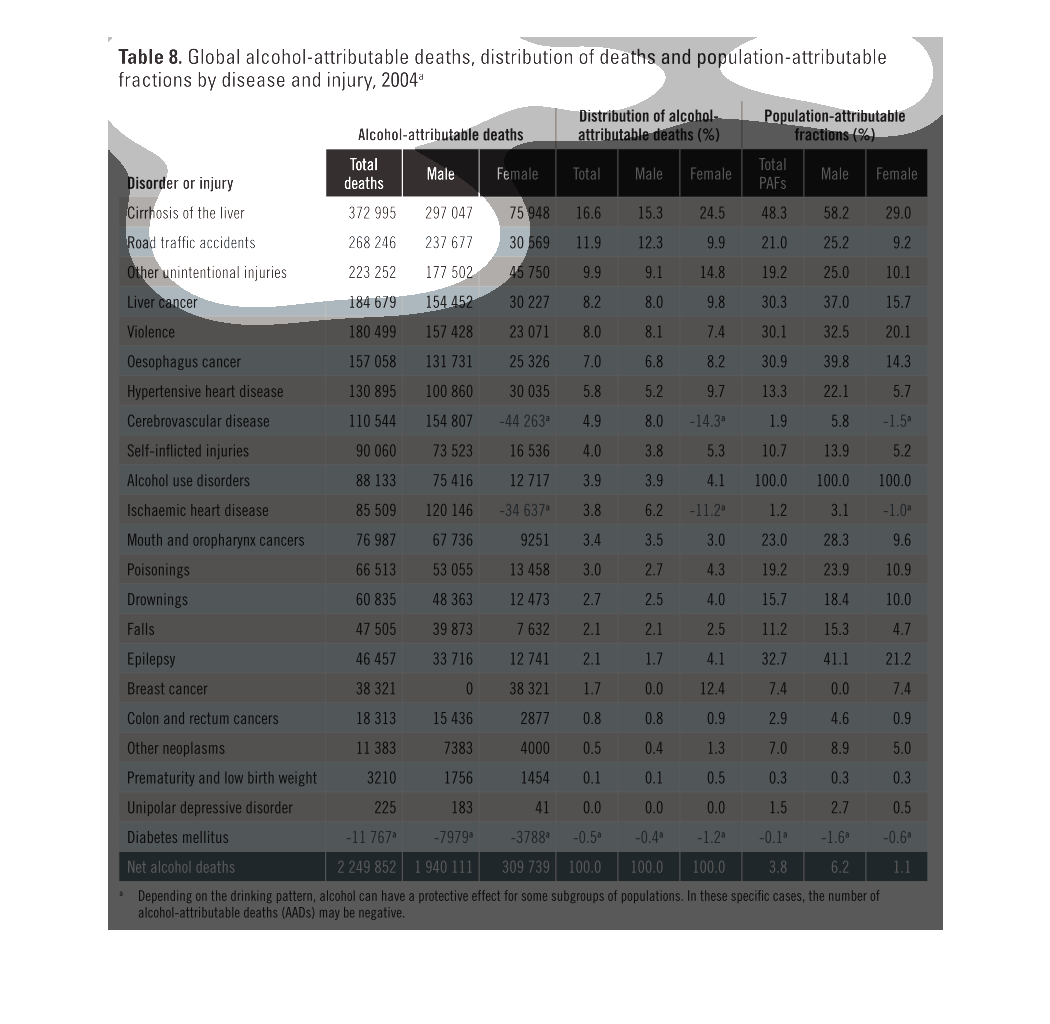
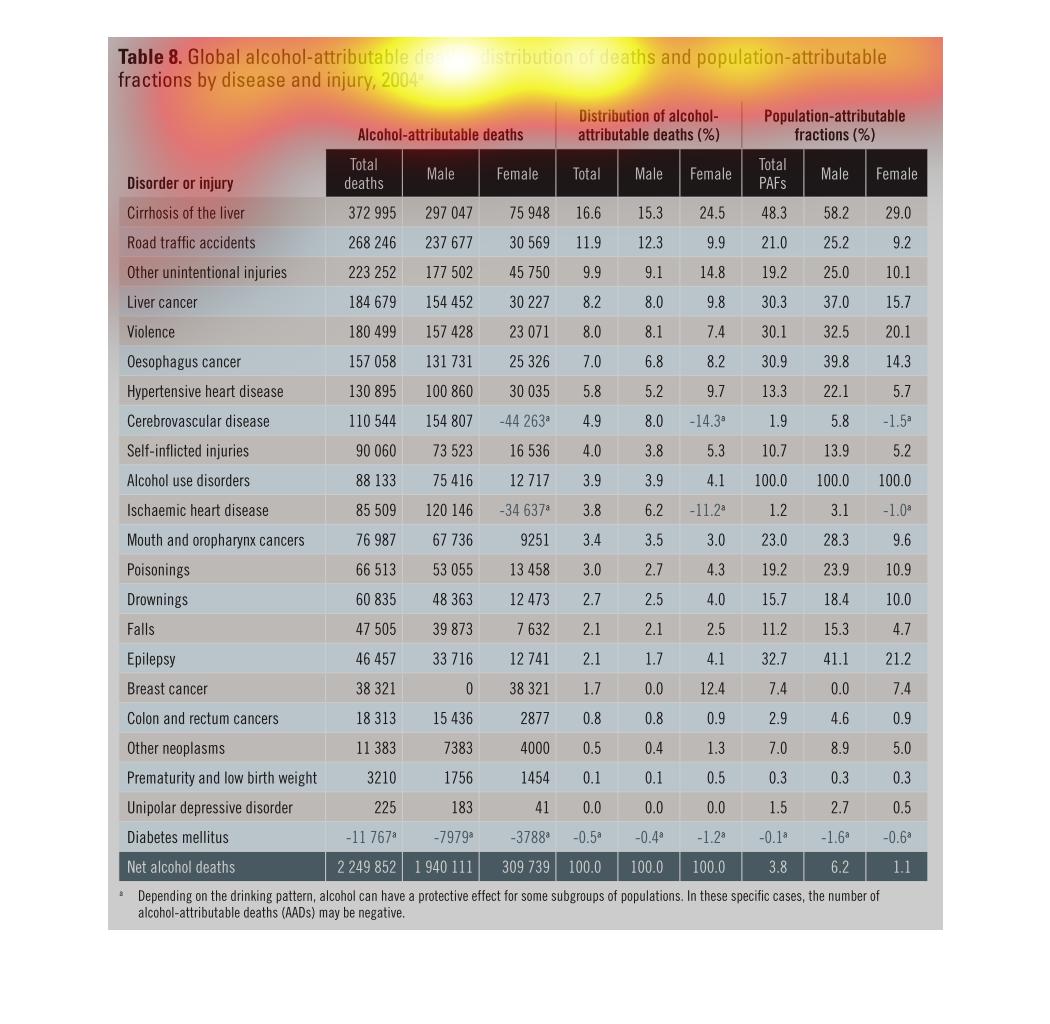
This table shows global alcohol-attributable deaths in 2004. The largest proportion of deaths
is a result of cirrhosis of the liver followed by road traffic accidents. Other intestinal
injuries, liver cancer, and violence also cause a significant amount of deaths. In 2004 there
was a total of 2,249,852 alcohol related deaths with slightly more males affected compared
to females.
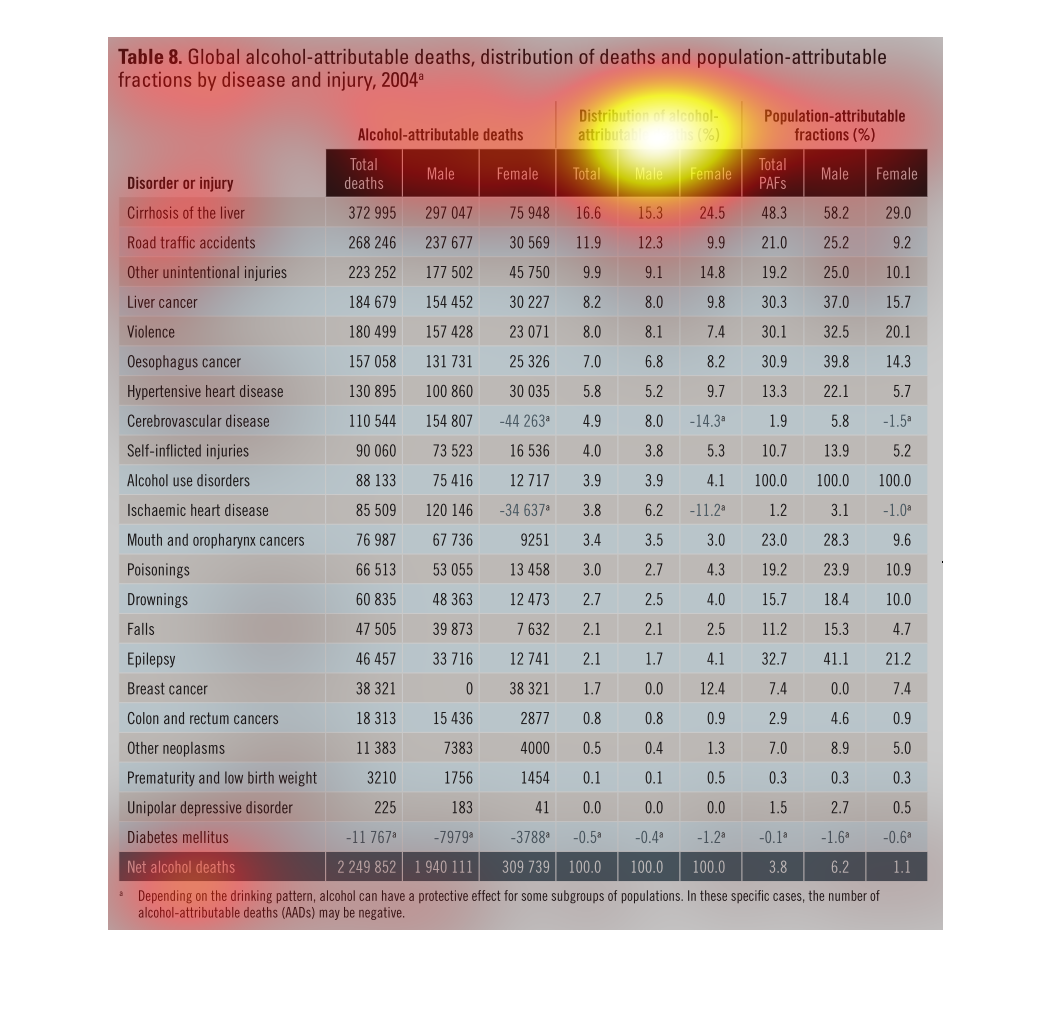
This chart is based on information from the year 2004 and correlates alcohol-attributable
deaths by population and disease. It further breaks it down into various alcohol related diseases
and causes of death and male and female victims, cirrhosis of the liver being the leading
caused of alcohol related death.
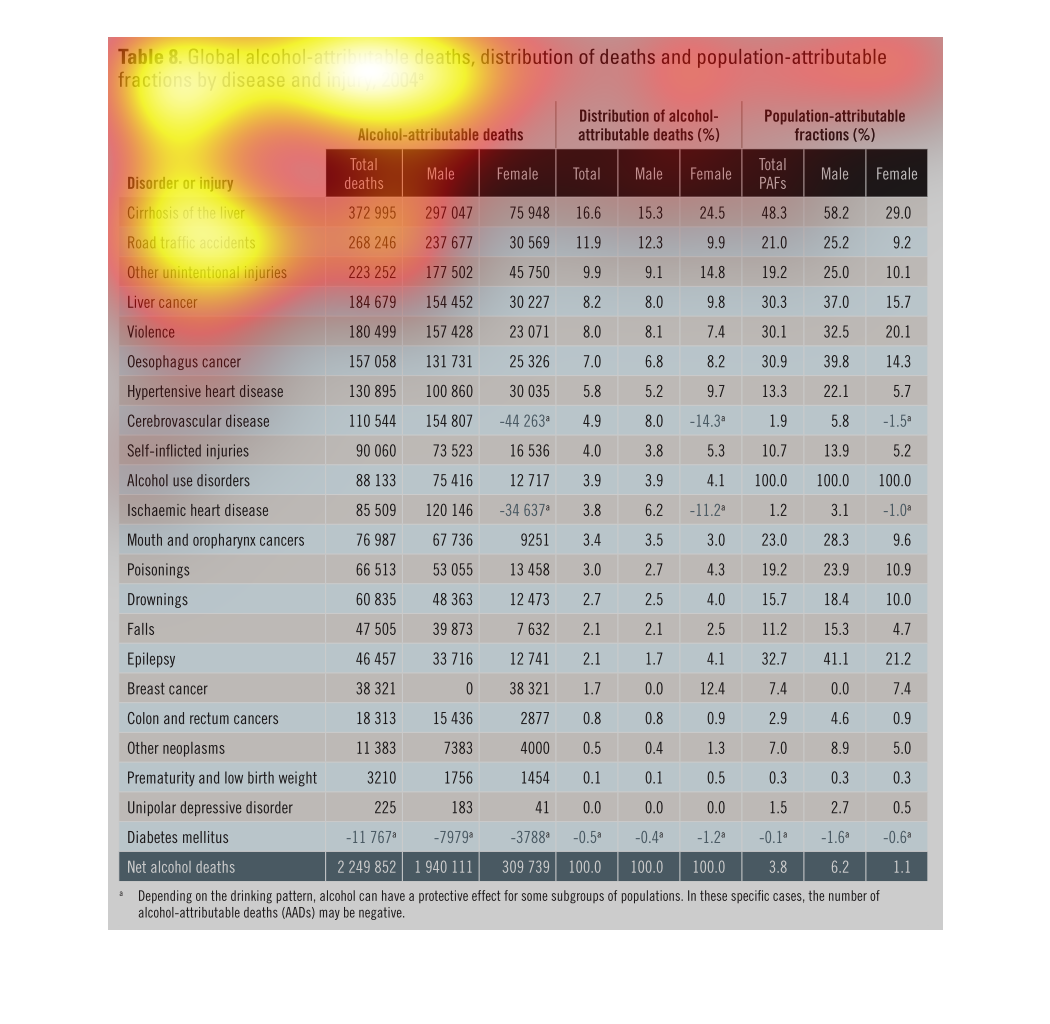
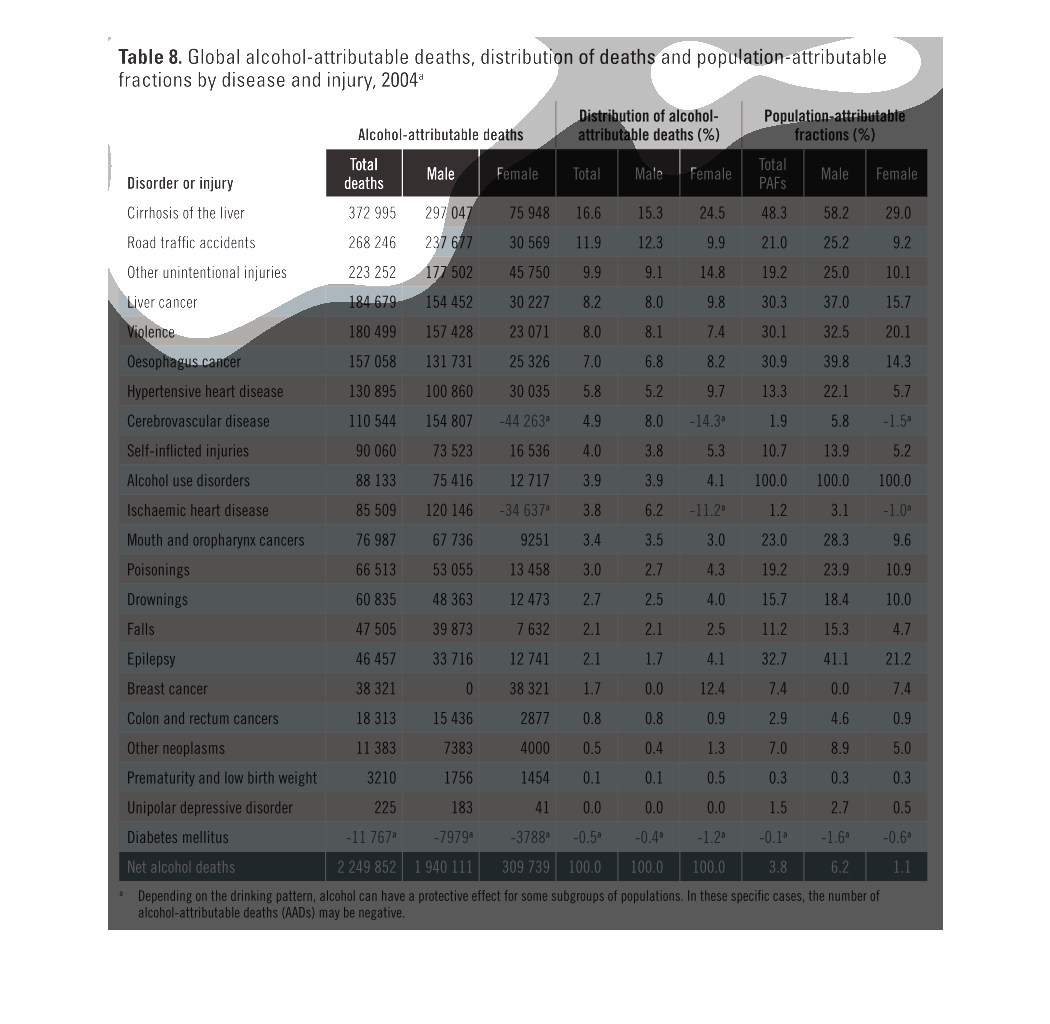
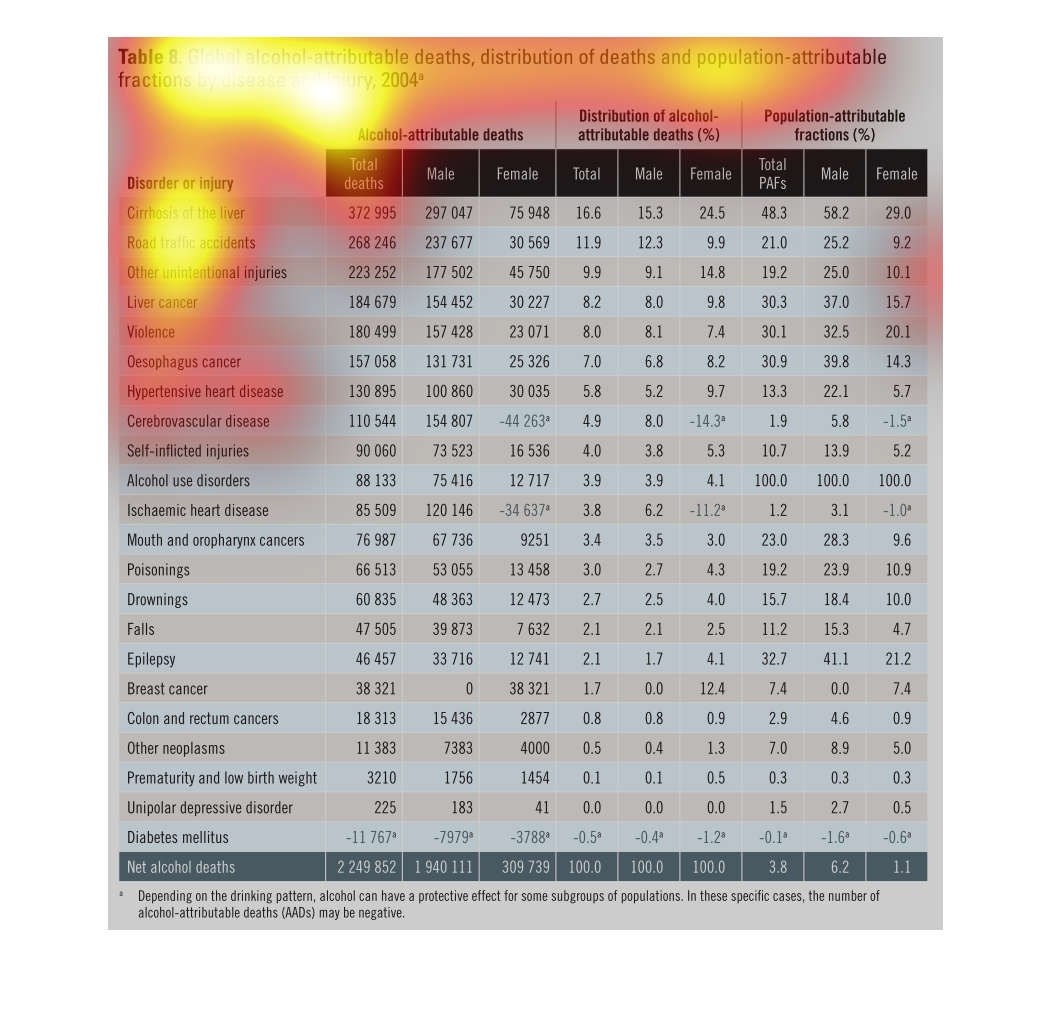
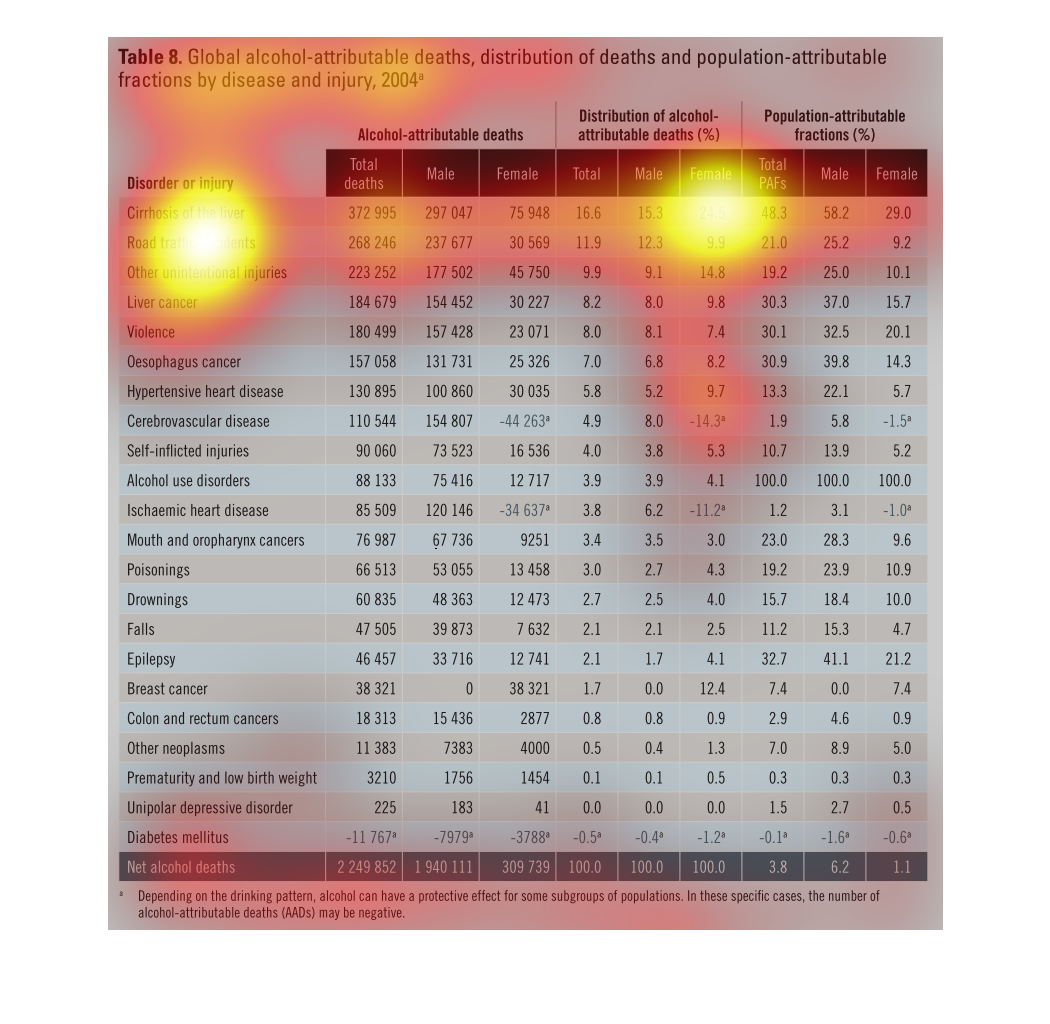
table 8 global alcohol attributable deaths, distribution of deaths and population attributable
factions by disease and injury, 2004. Basically there are listed columns, the first columns
is relatable disease and death with cirrhosis of the liver topping the list, followed by road
traffic incidents
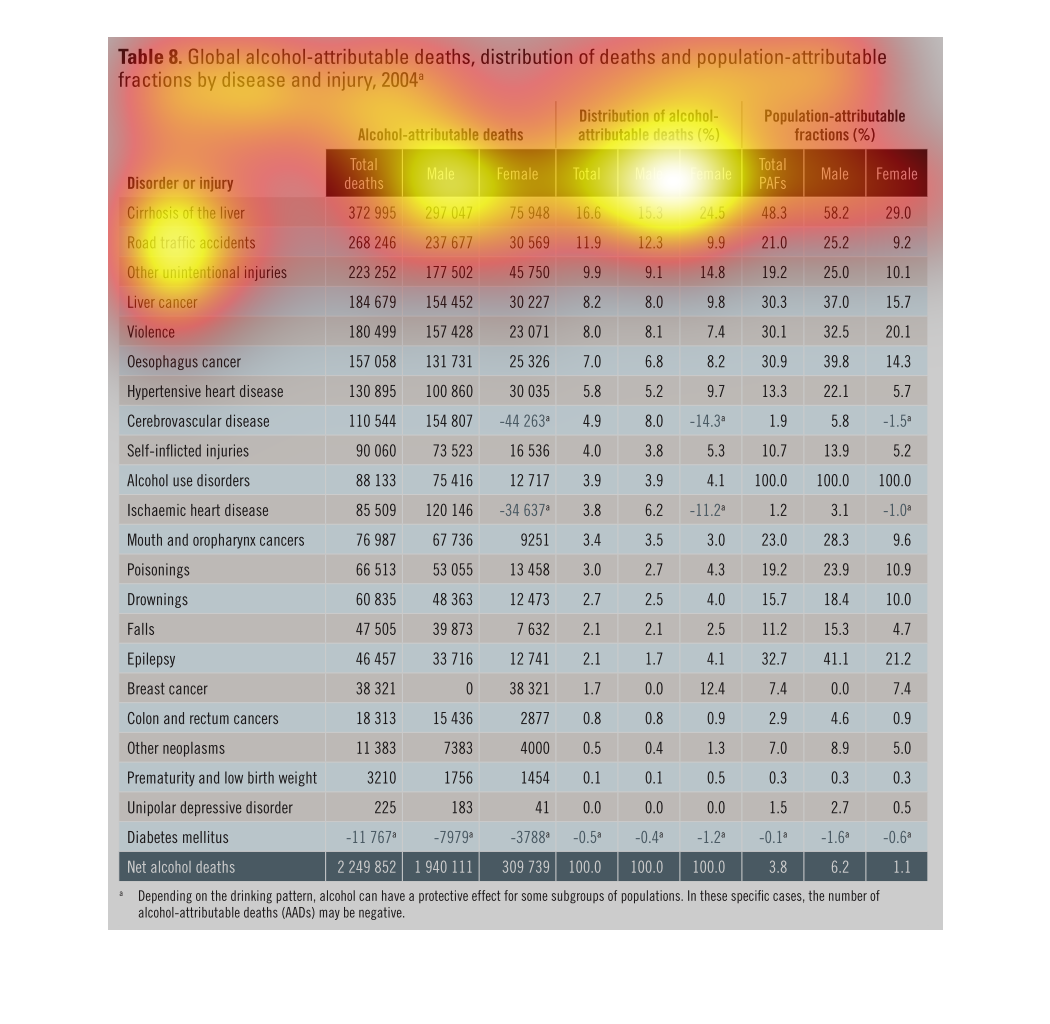
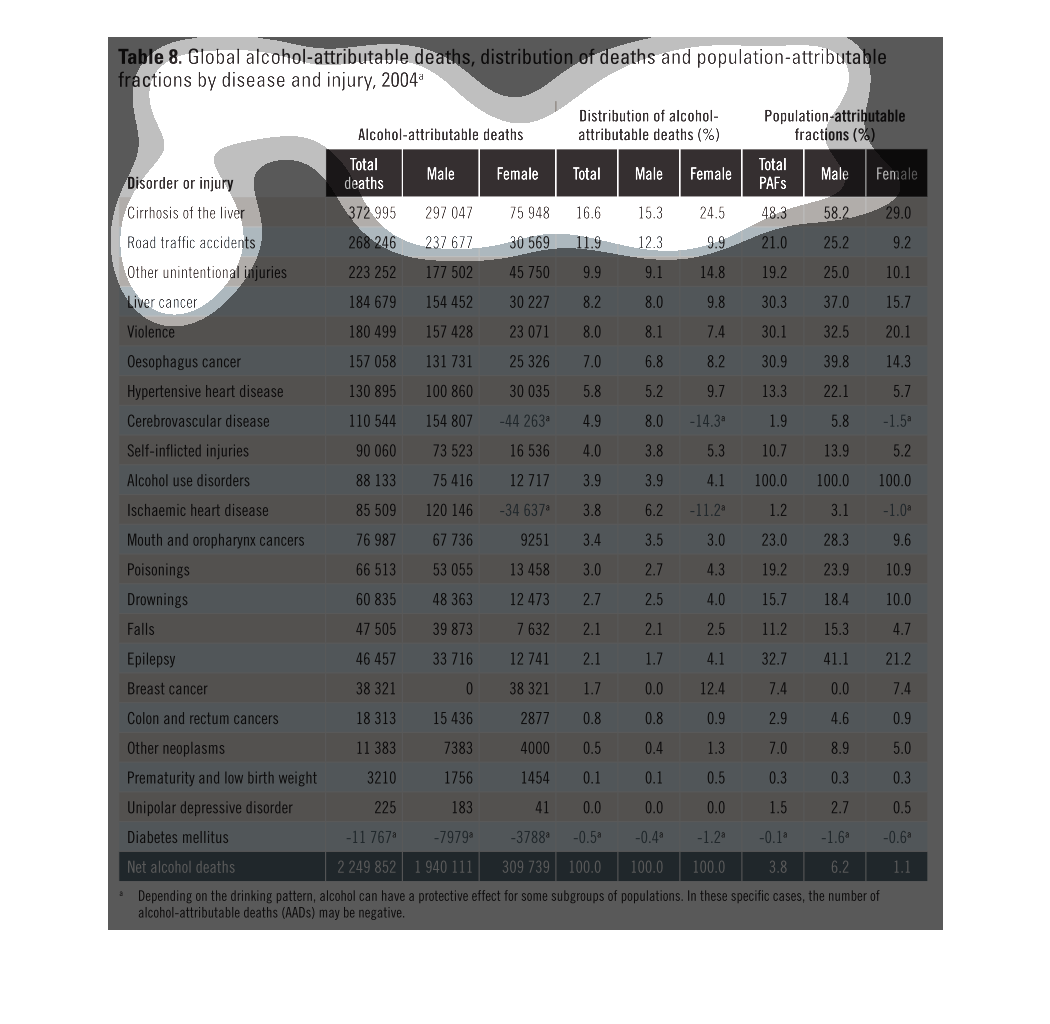
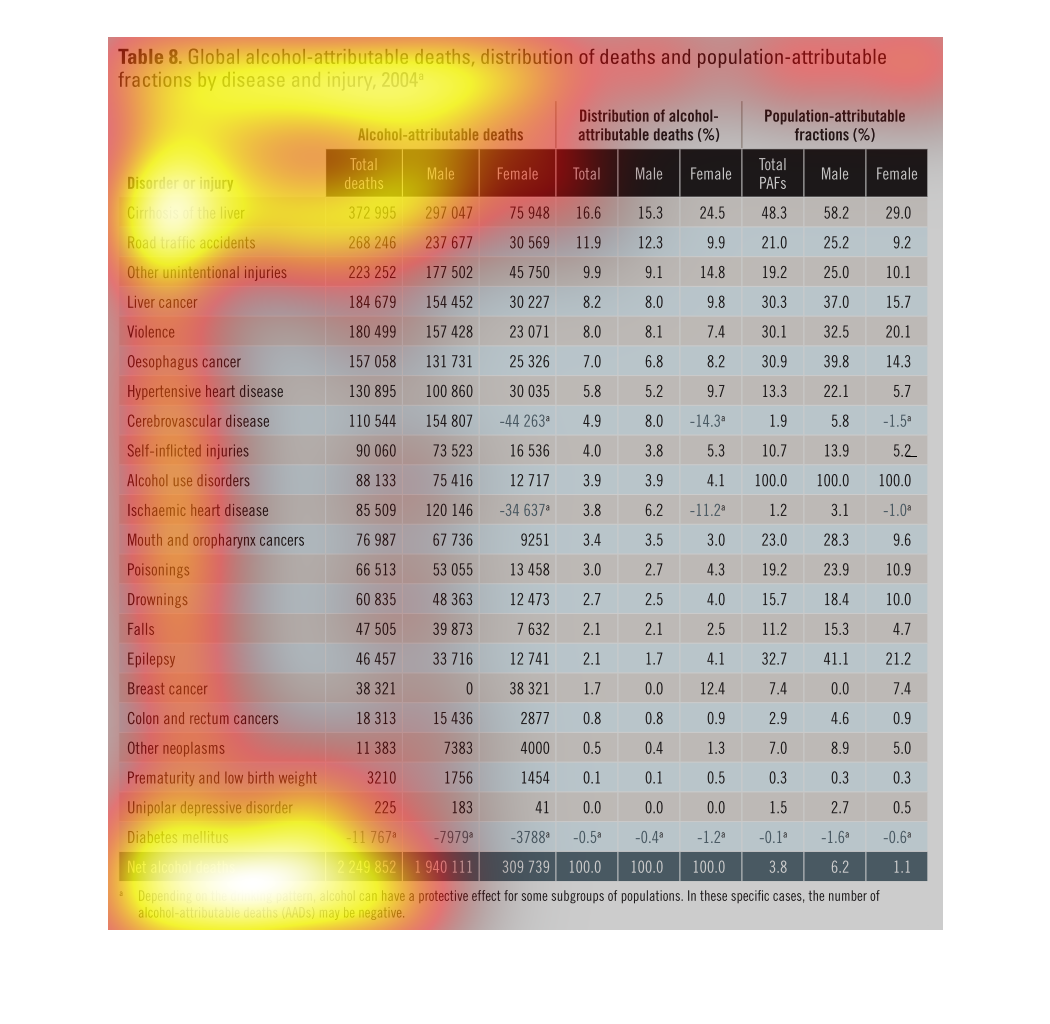
Chart shows alcohol-related deaths from both disease and injury in 2004. The leading cause
of death that is related to alcohol cirrhosis of the liver and traffic accidents. While the
type of alcohol related death that was the least common was diabetes mellitus.
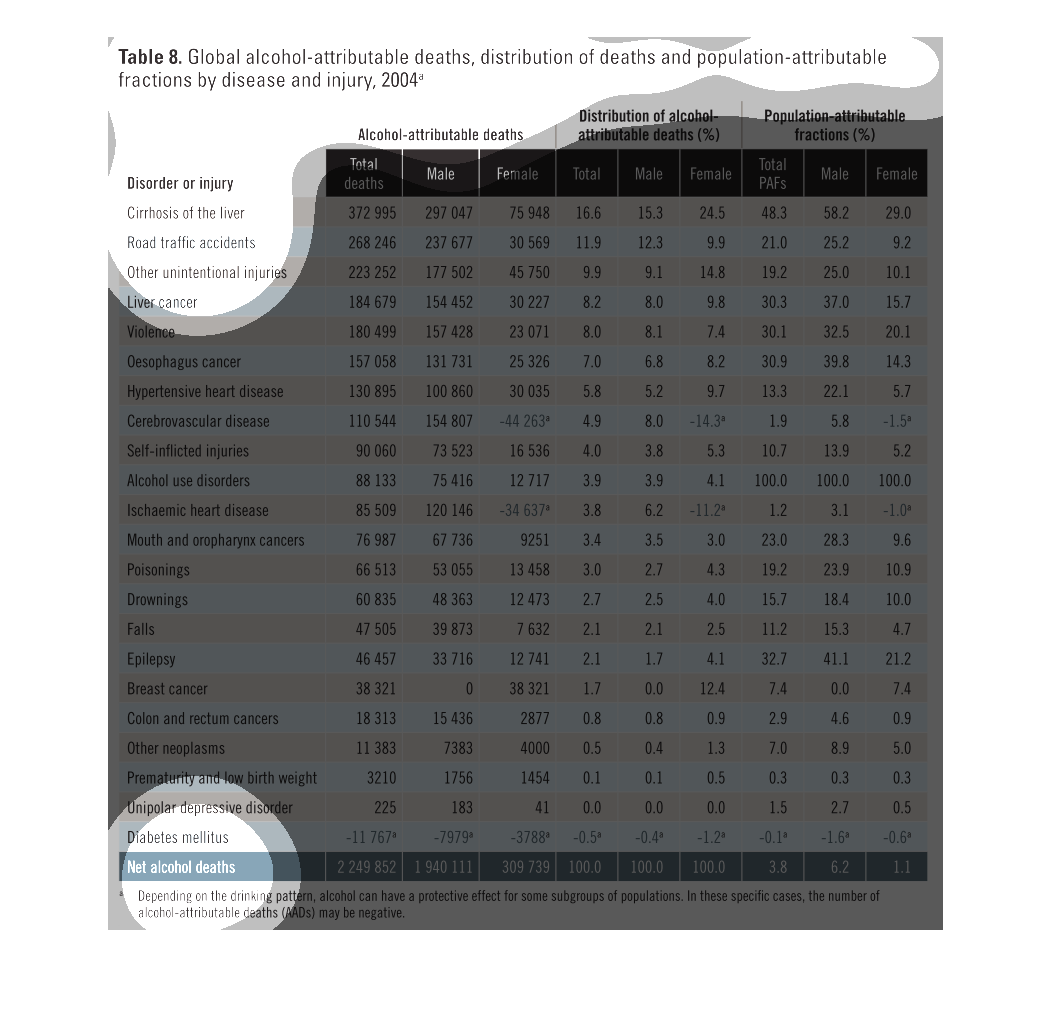
This graph depicts the distribution of death attributable to alcohol related diseases.  The
data are divided into the direct cause of death, subdivided into male and female.