The chart shows the effects of alcohol on individuals in Australia in the year 2008. The left
side of the graph describes an event and the right side of the graph describes the number
of people that have been involved in such an event.

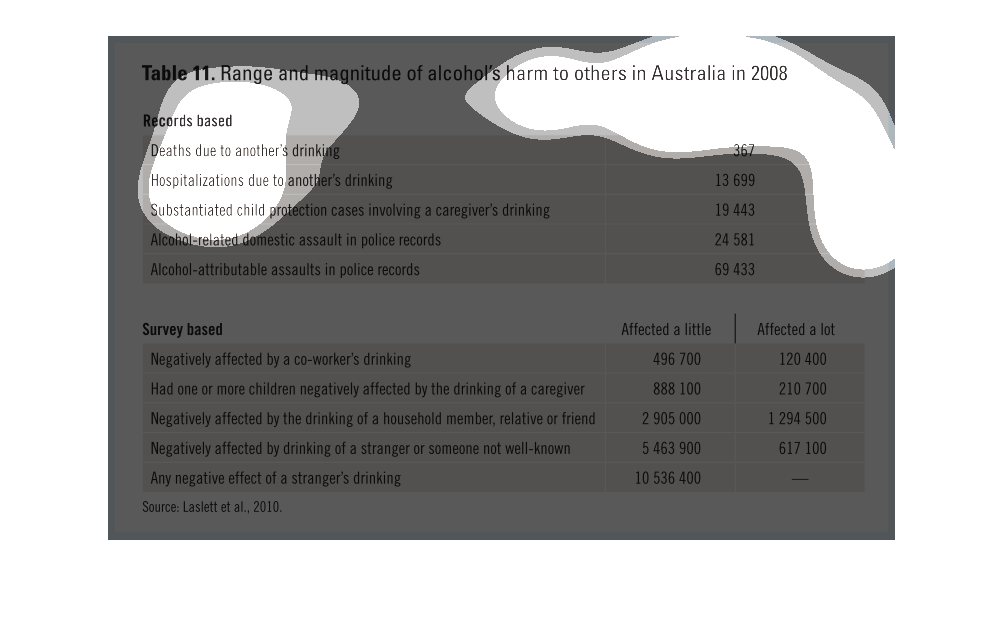
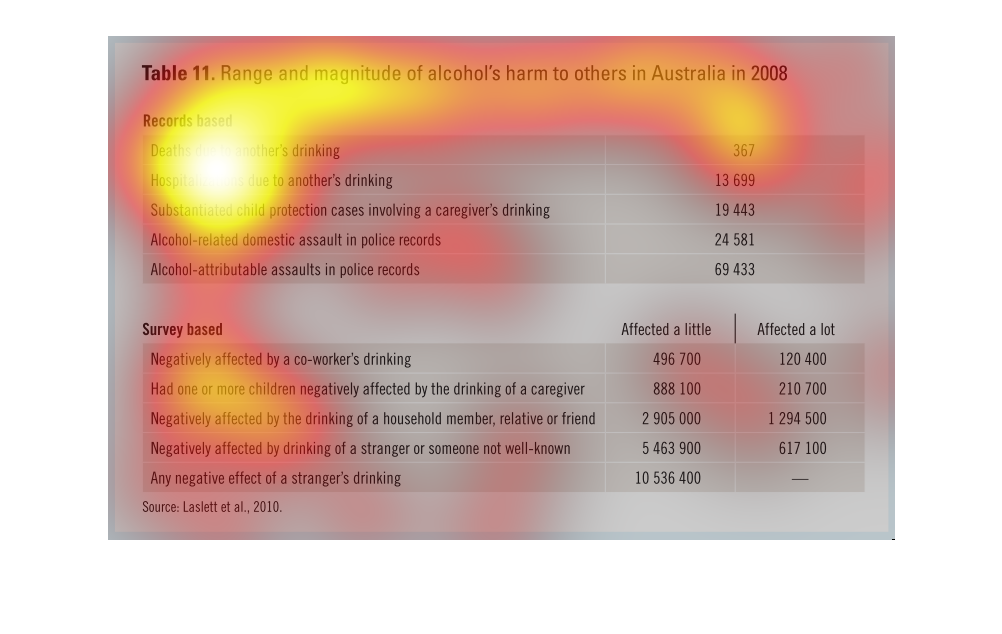
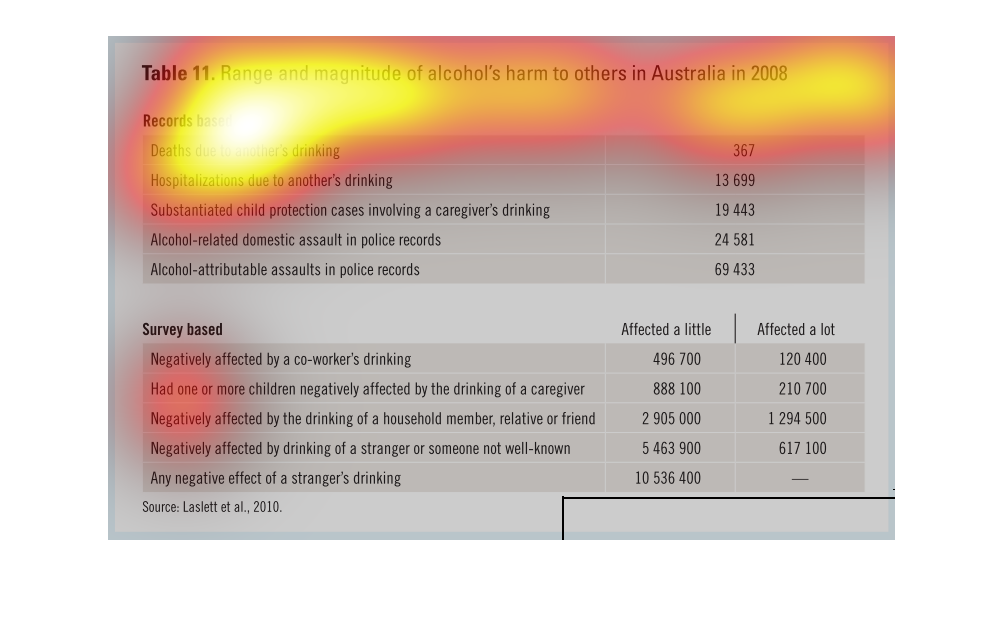
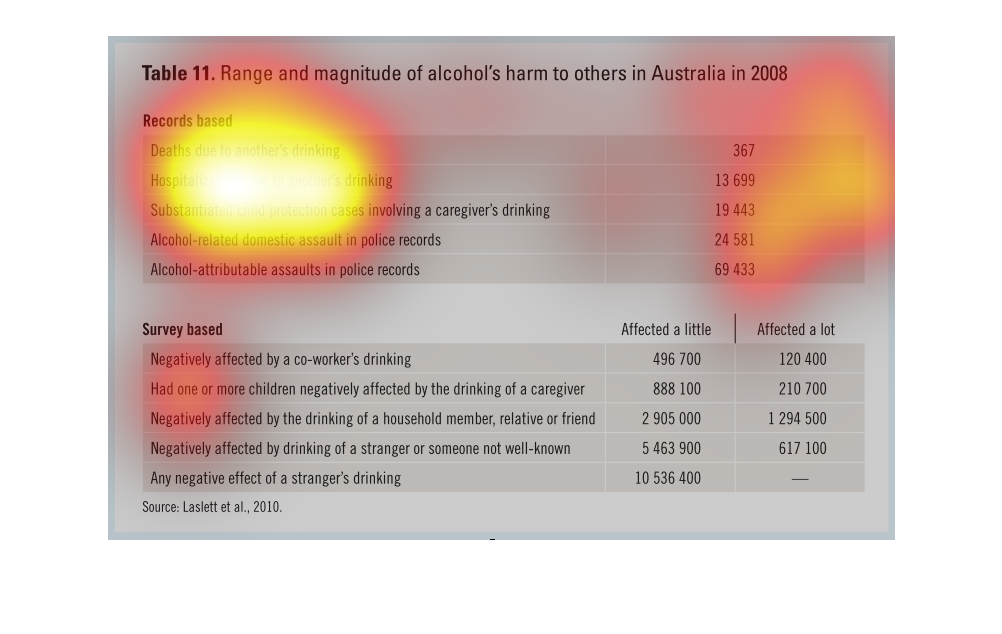
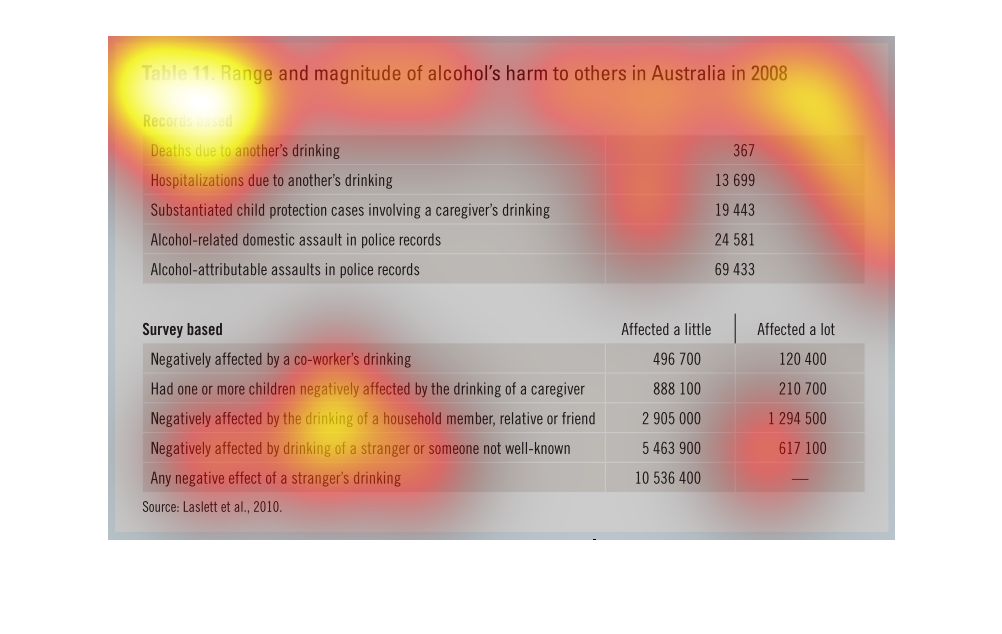
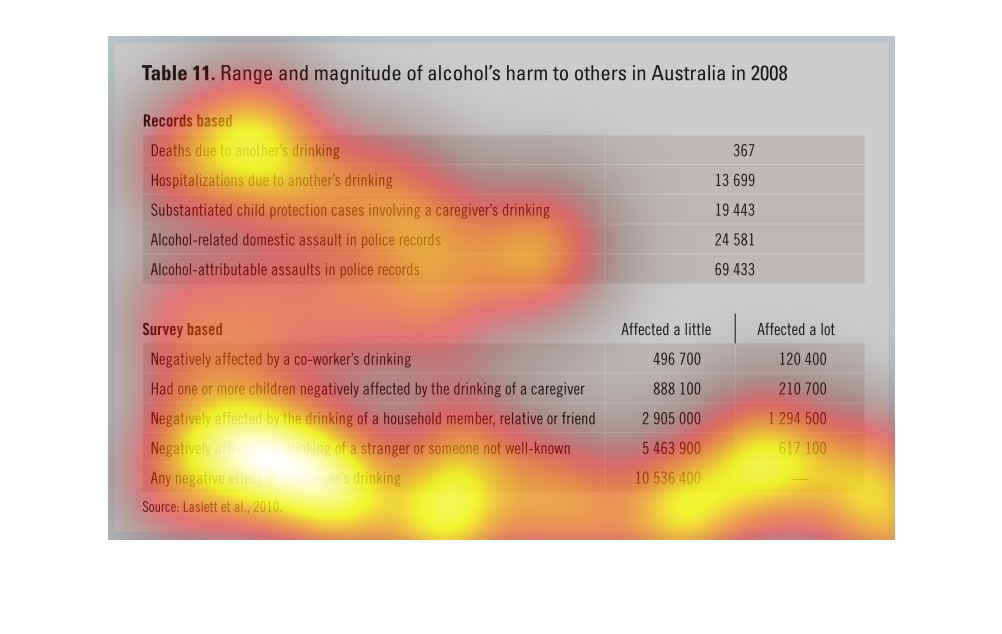
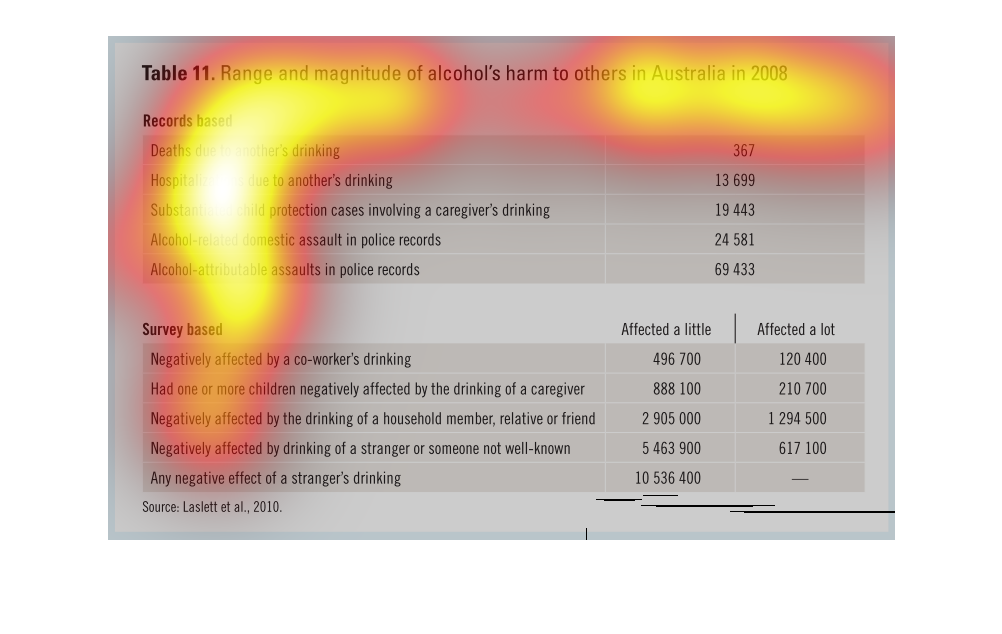
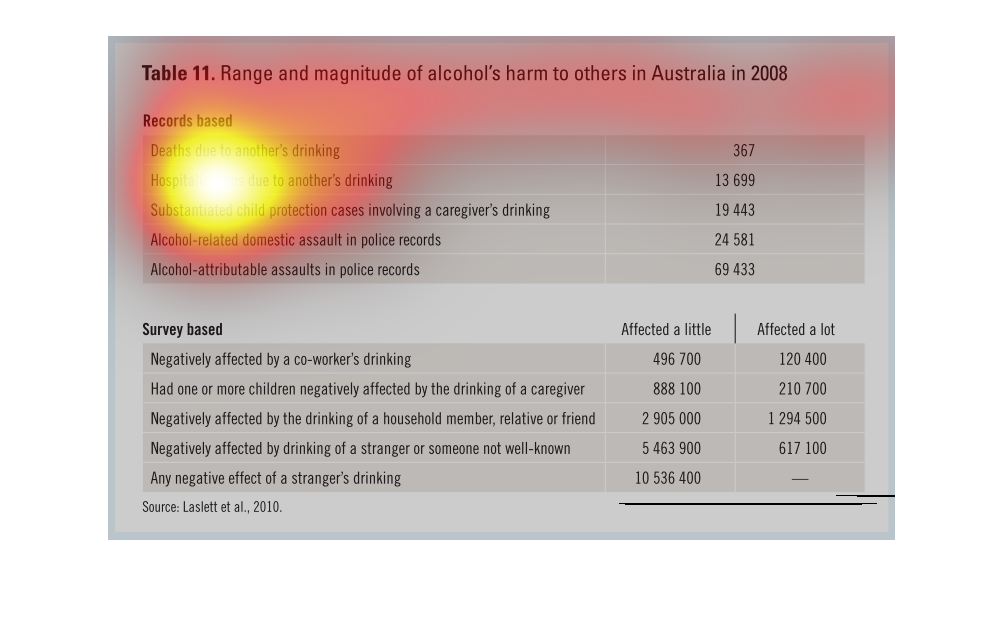
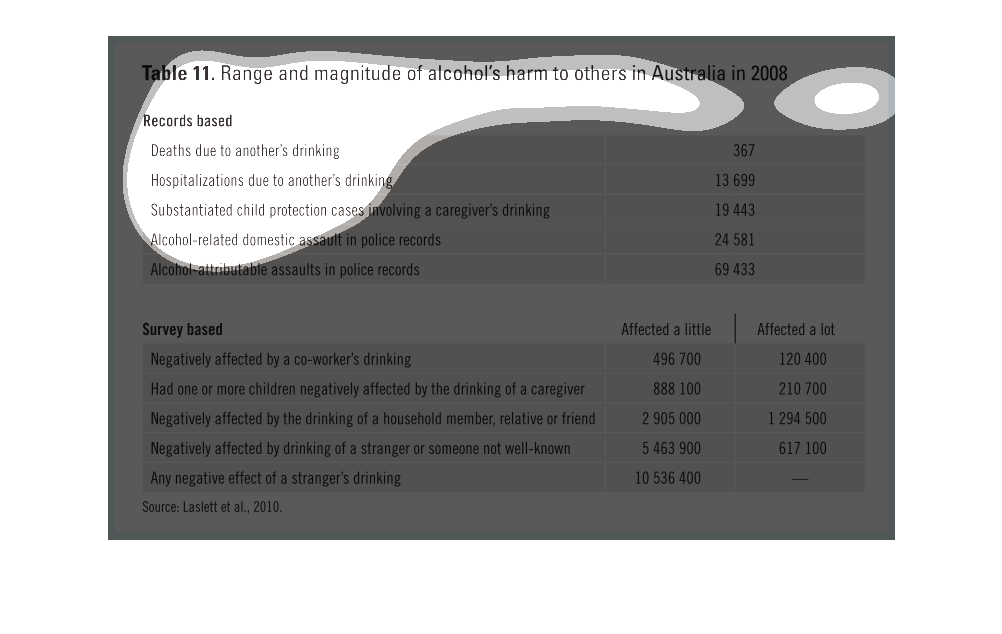
table 11 range and magnitude of alcohol's harm to others in Australia 2008. two charts, records
based and survey based, I'm not really sure how to interpret this, there's a lot of variables.
basically drinking excessively is bad for anyone and everyone.
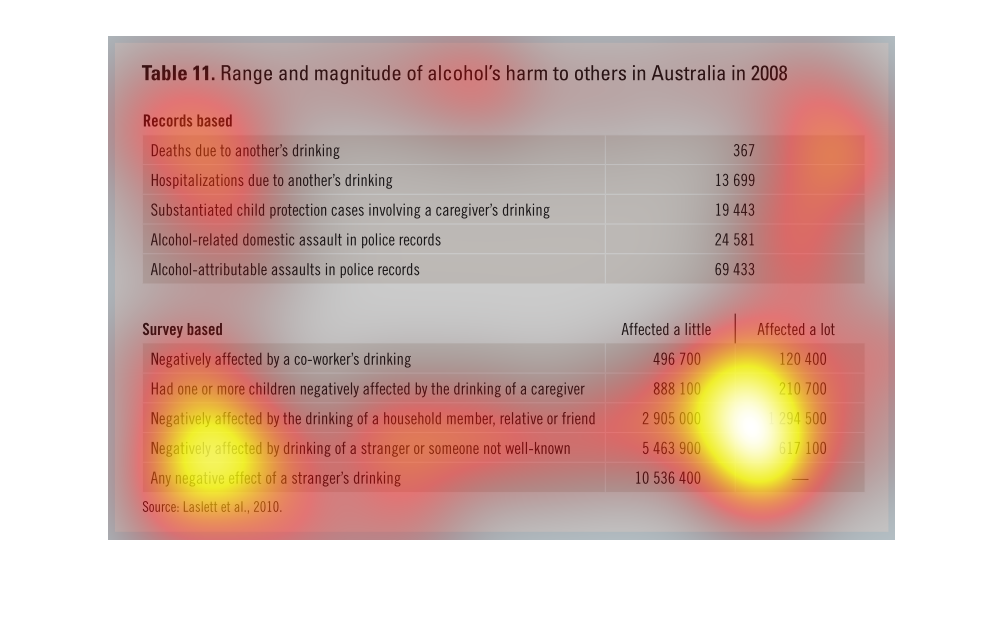
Range and magnitude of alcohols harm to others in Austria is what is being presented.  They
have listed Deaths, Assaults, Hospitalizations, domestic violence, child violence and the
statistics for each.
This chart describes range and magnitude of alcohol's harm to others in Australia in 2008.
The chart is divided into two part, Records based and survey based.
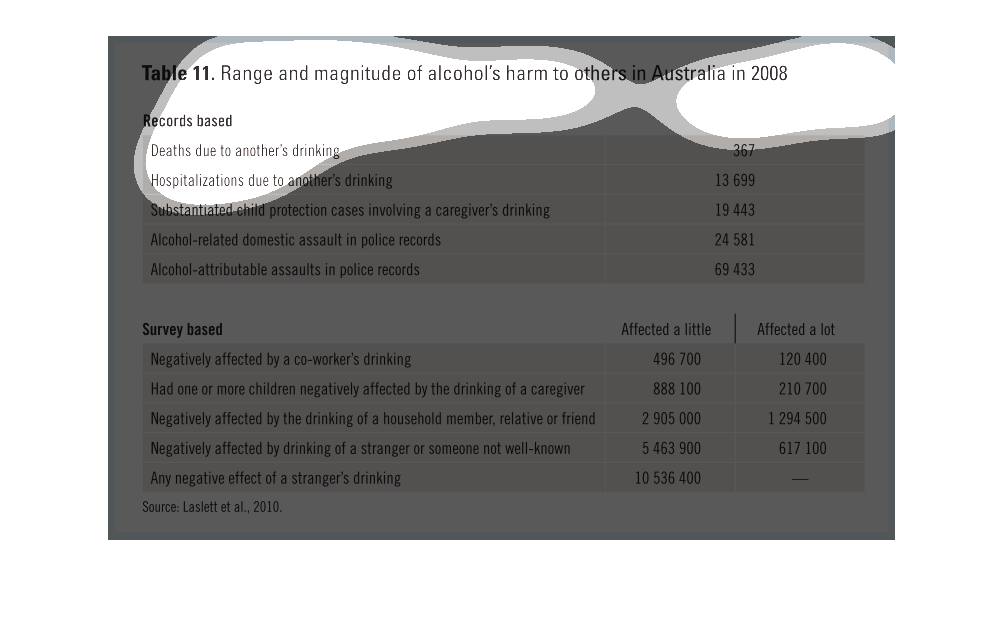
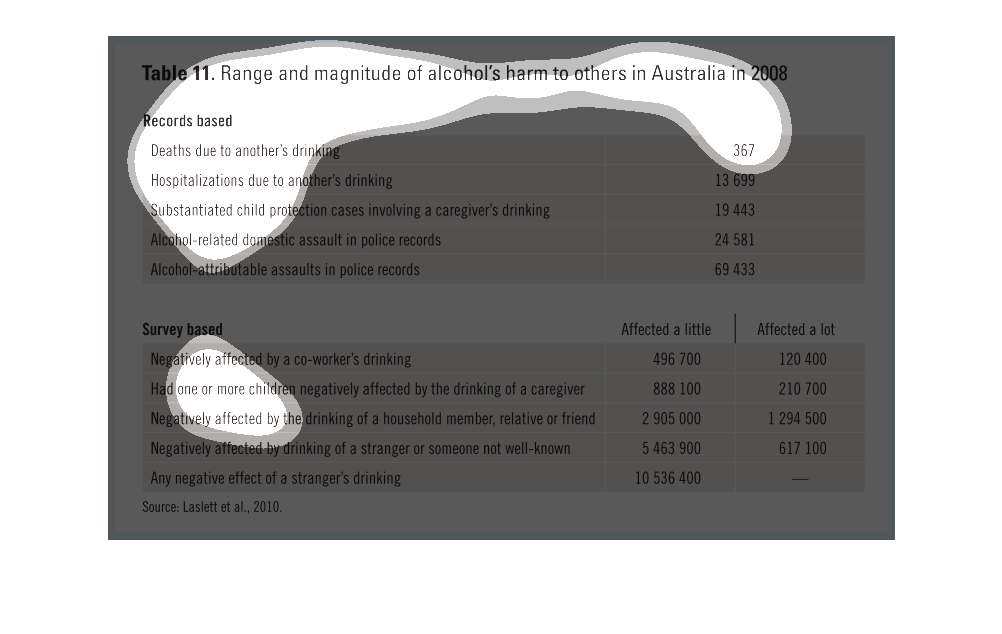
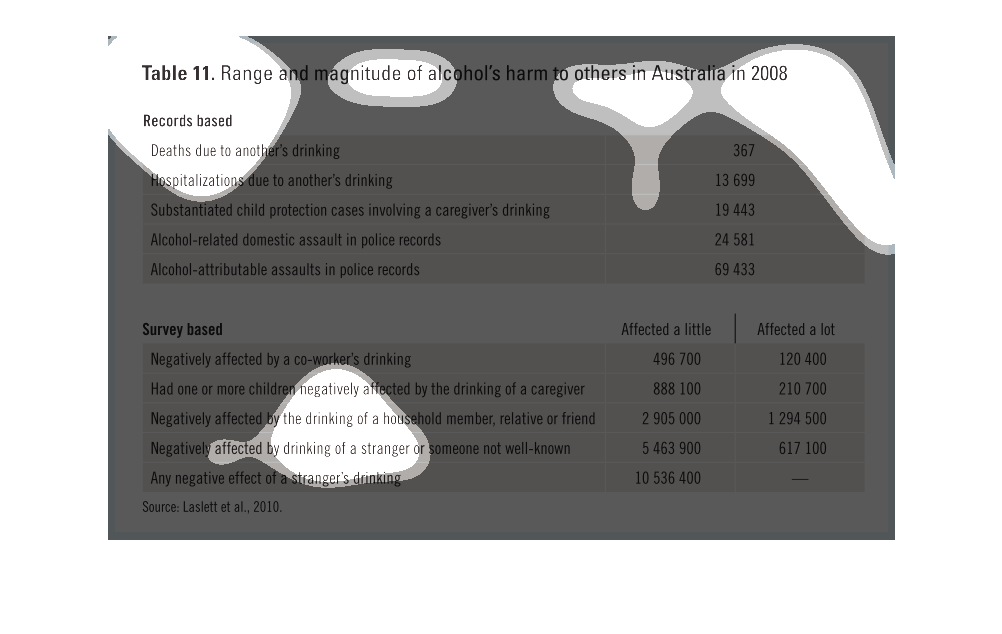
We are trying to determine the negative effects of alcohol in Australia by looking at records
and occurrences in situations involving alcoholic beverages
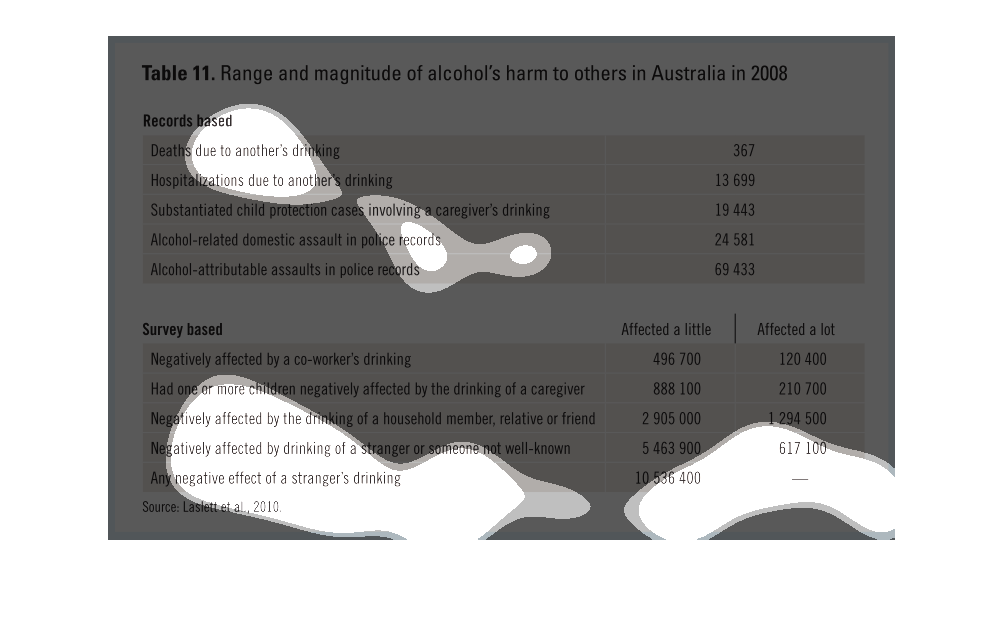
A statistical infographic relating to harm done by alcohol related diseases in Australia from
2008. Shows records based numbers of deaths, hospitalizations, etc are high
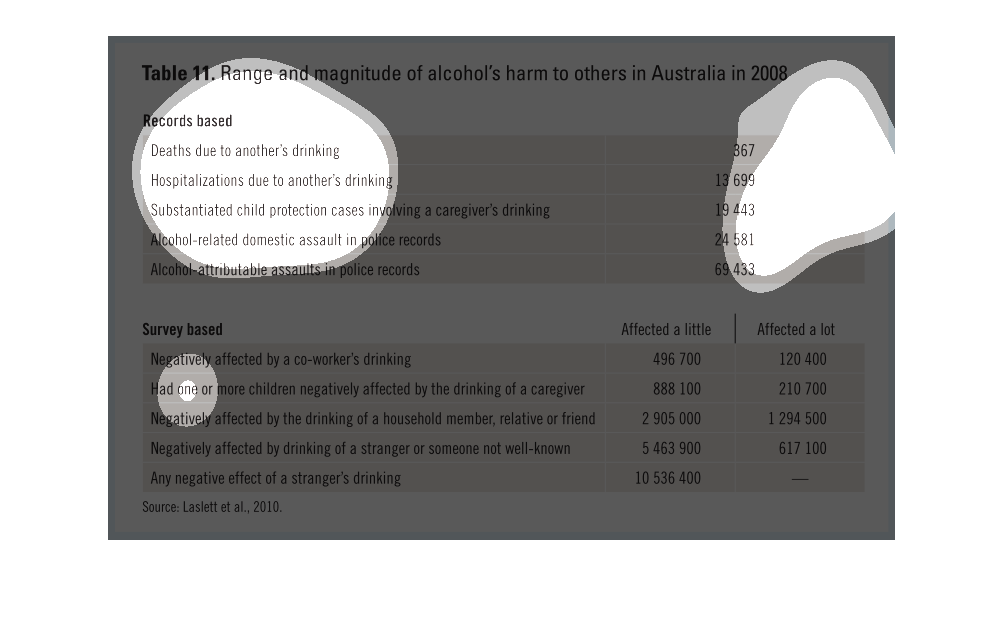
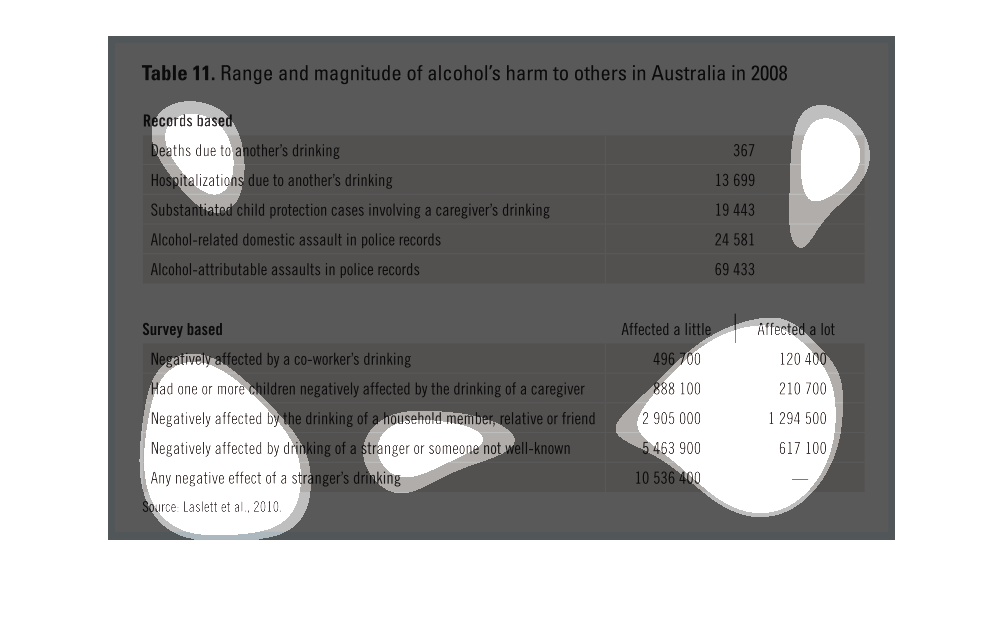
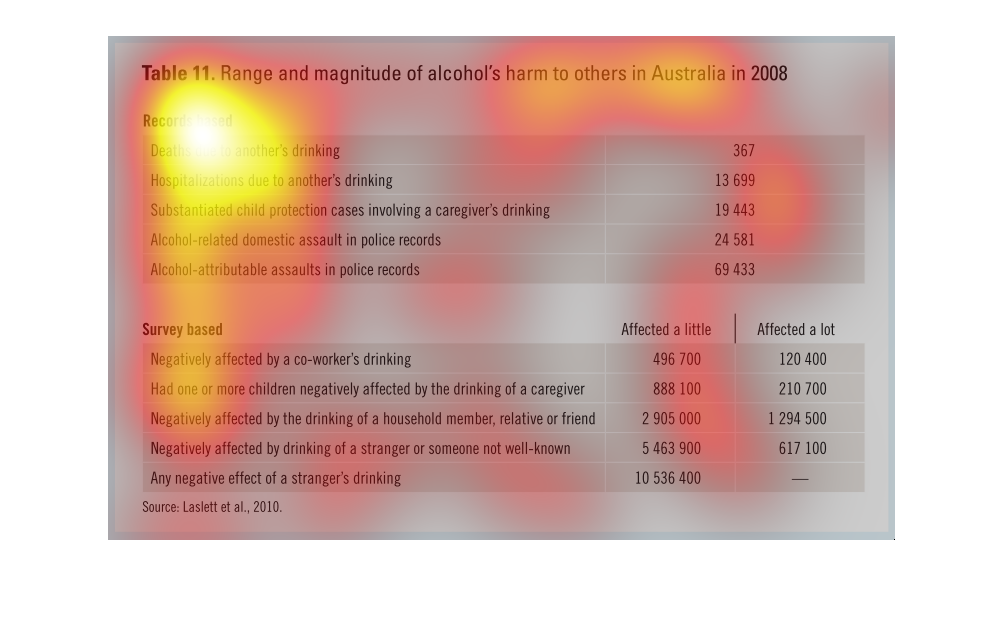
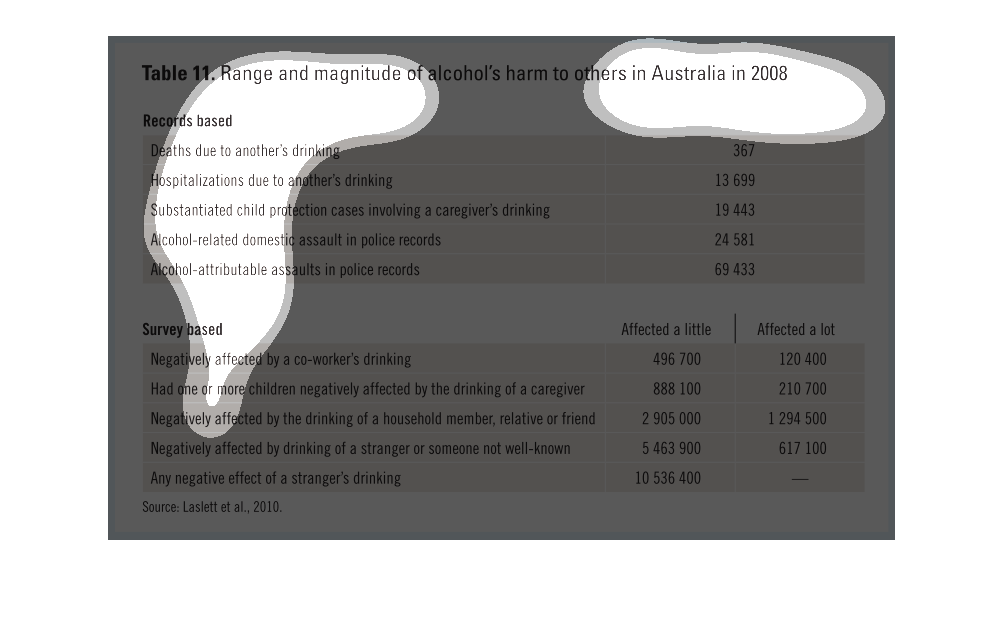
The table discusses the range and magnitude of alcohol's harm to others in Australia in 2008.
 It is further broken down down in to two sections:  records based and survey based.
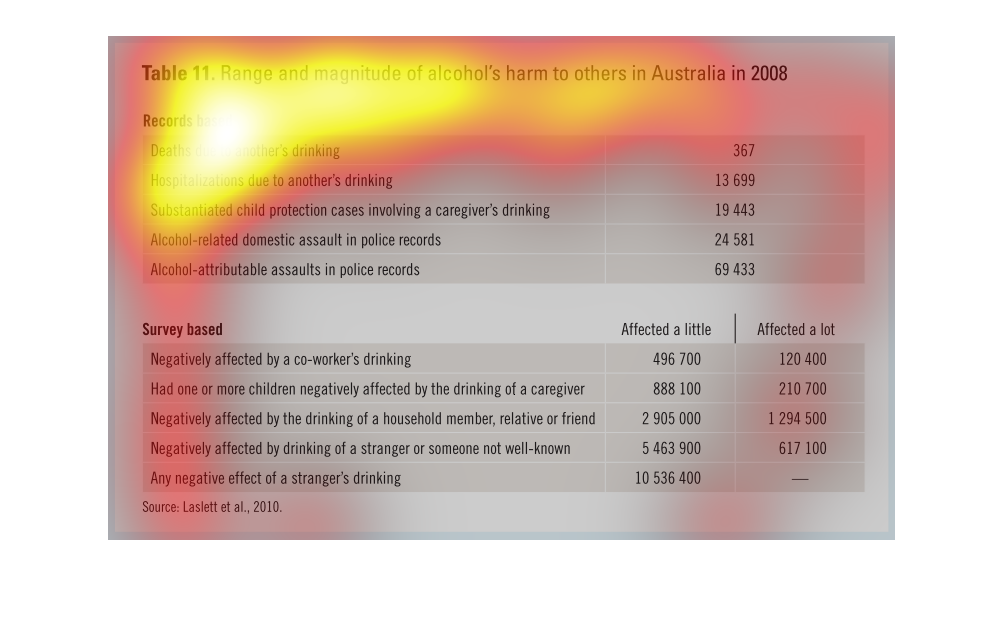
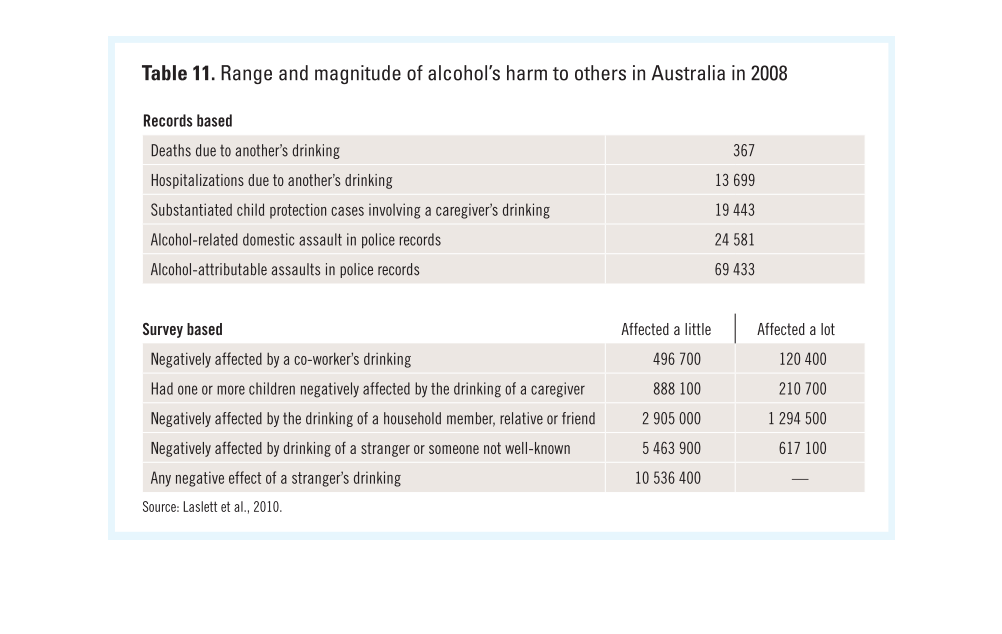
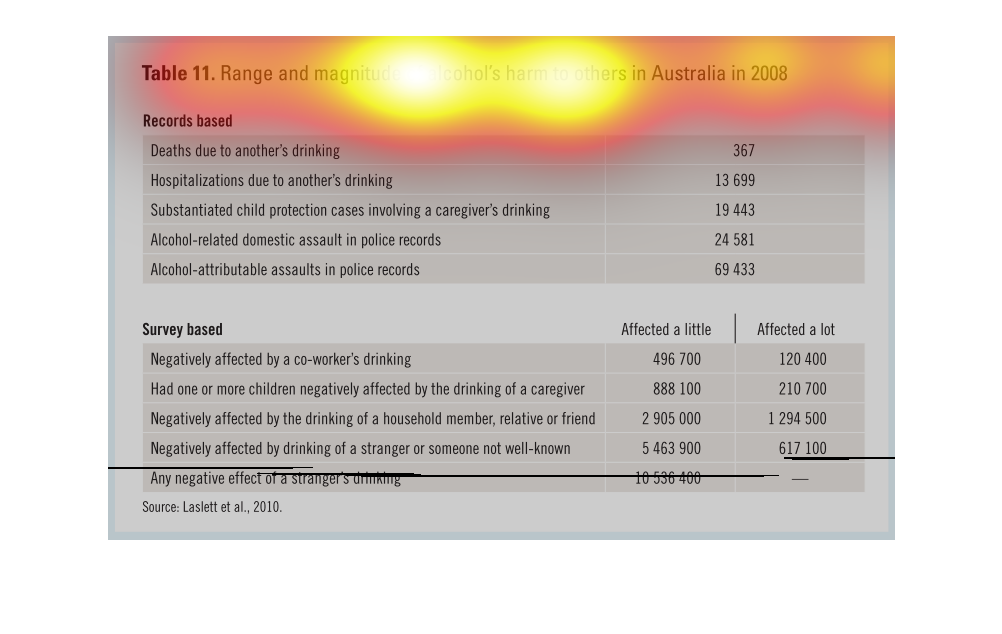
This is a chart that illustrates the actual range and magnitude of alcohol's harm to others
in Australia in the year 2008. It shows the different specific ways that alcoholics harm others
around them.
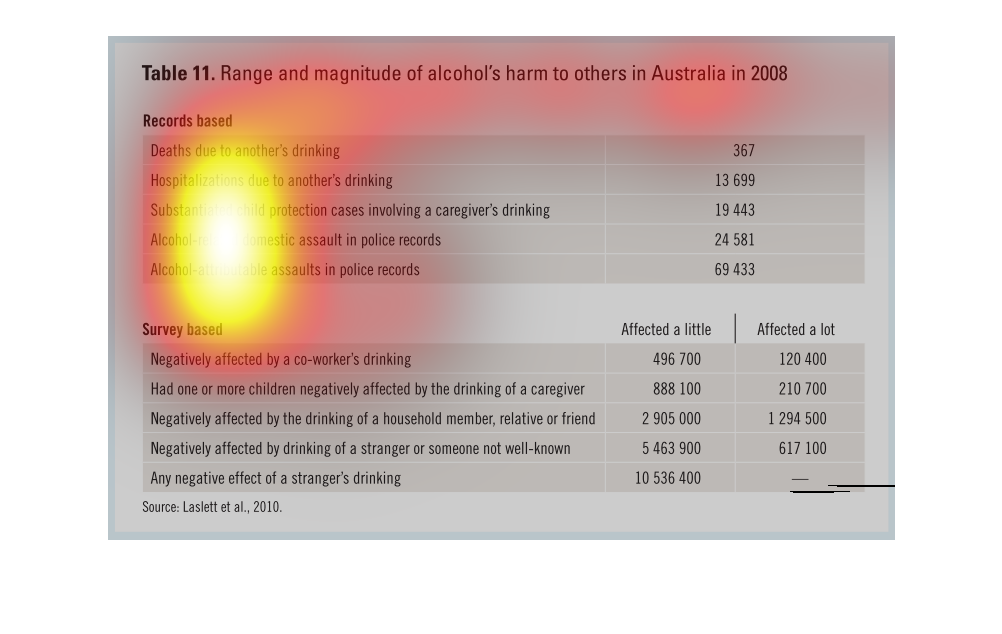
The figure presented is titled Range and magnitude of alcohol's harm to others in Australia
in 2008.  The figure presents data for the range and magnitude of harm.
The effects of drinking alcohol depending on  your status and your role in the home .there
are different various figures with the amount of the people in the home and or the adults
and the amount of the people in the home including sex,gender and or age including adult and
chidren and their geographical  era.
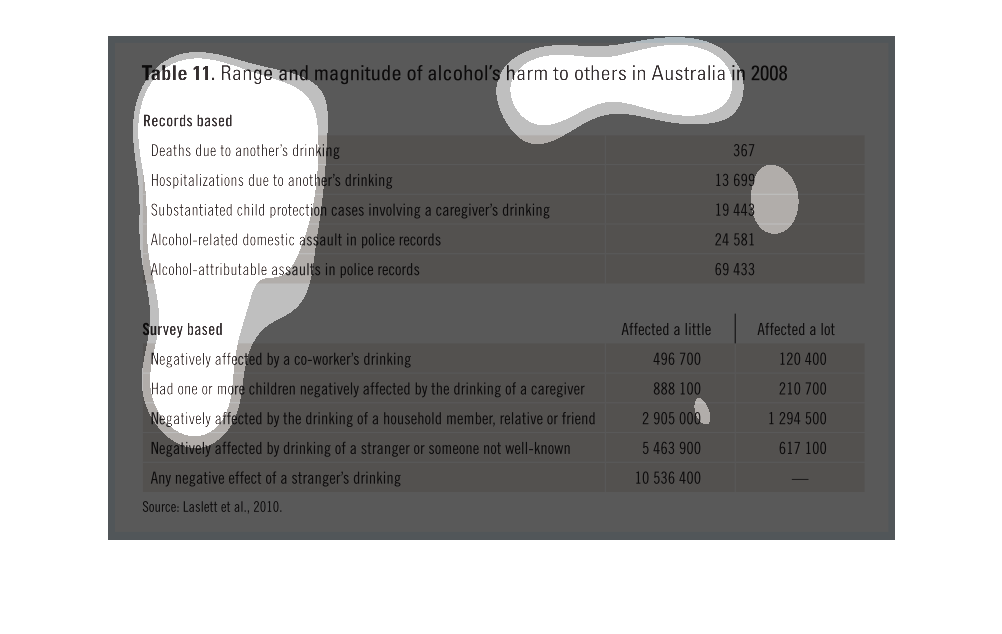
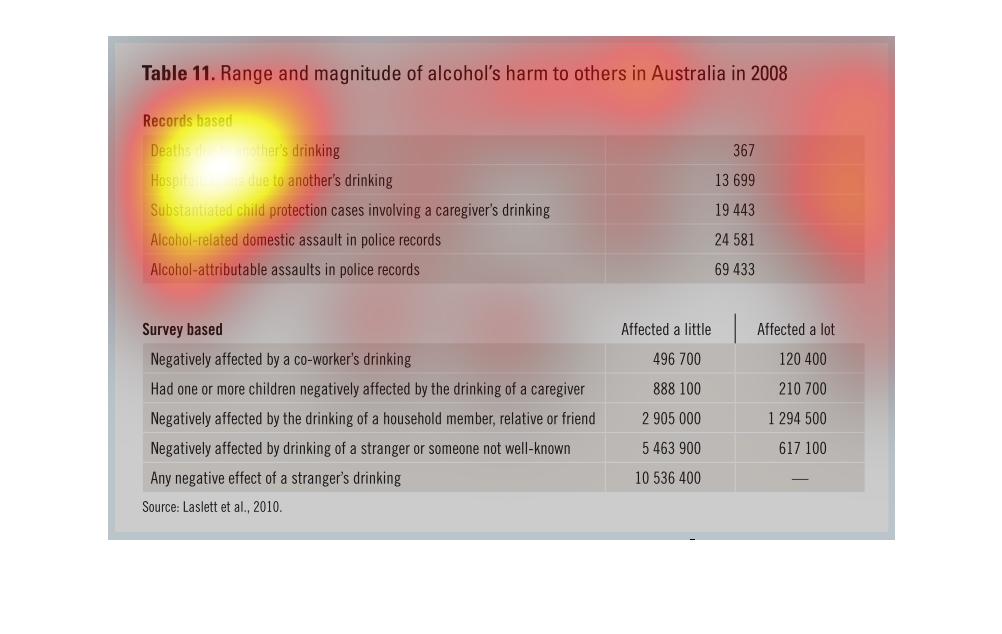
This image depicts the overall effect of alcohol on the consumers and those around them in
Australia in 2008; primarily the negative consequences. Deaths, assaults, hospitalizations
all occurred nationwide for both consumers and those affected by them.
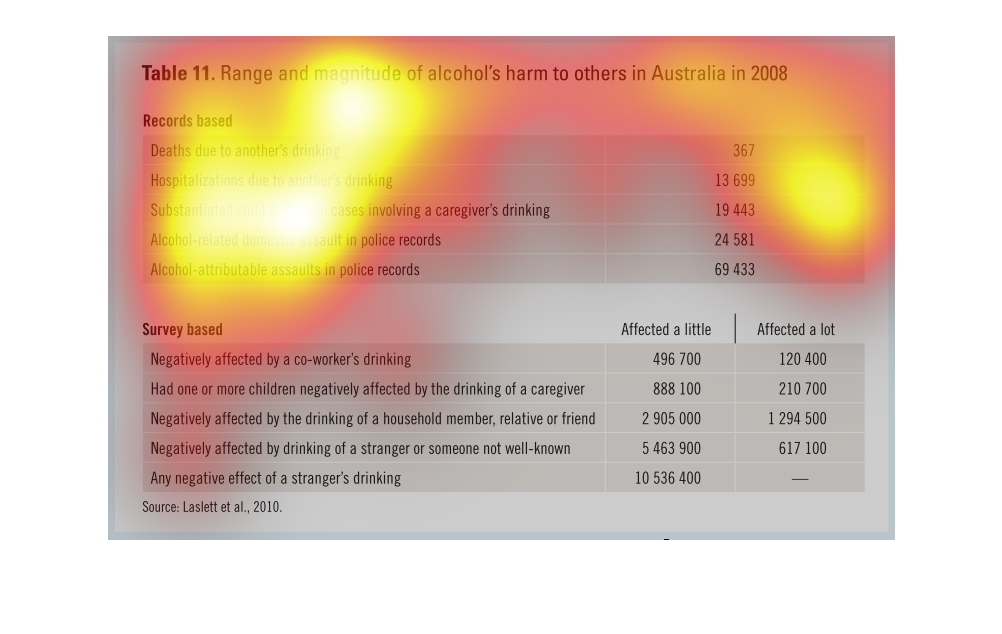
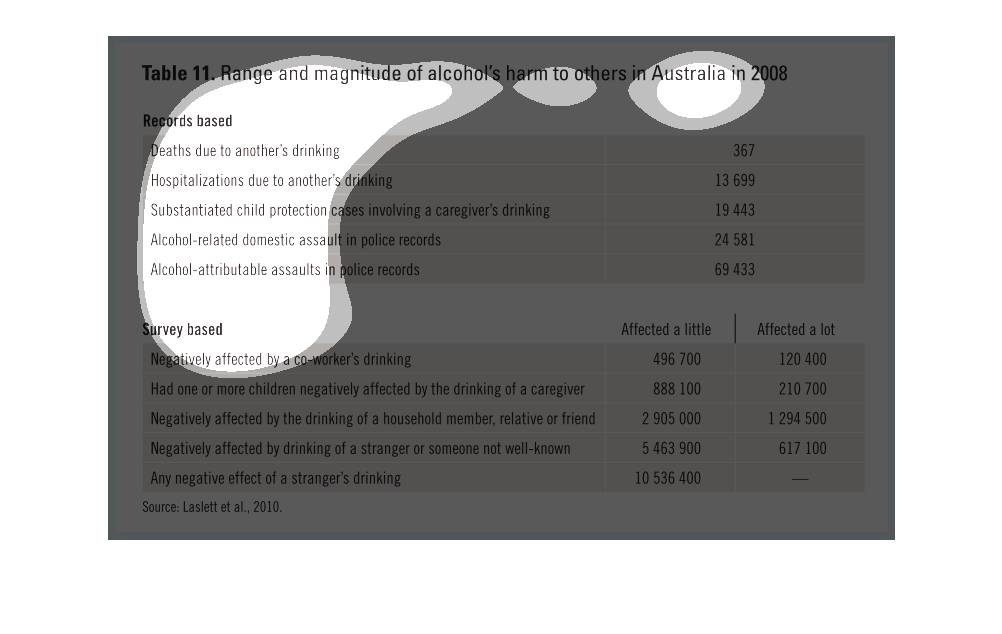
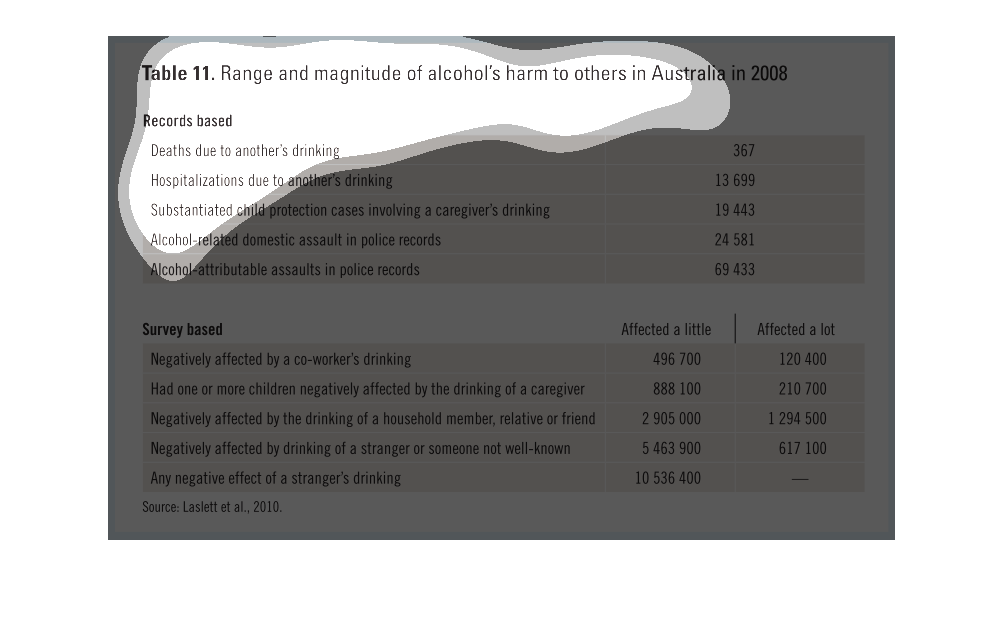
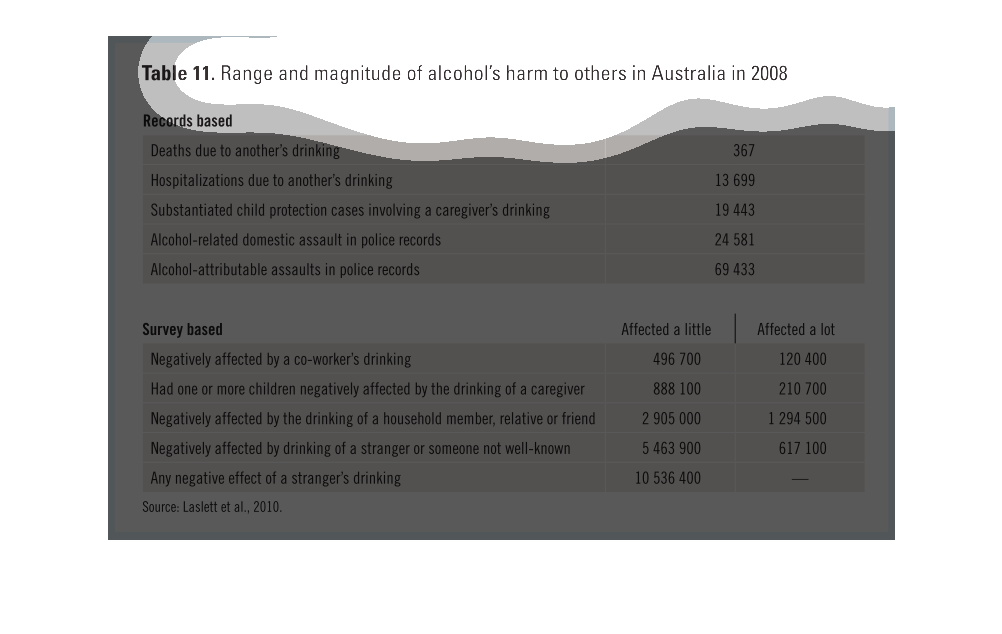
This is a series of statistics on the range and magnitude of harm caused  to others by alcohol
in Australia in the year 2008 across a range of metrics.
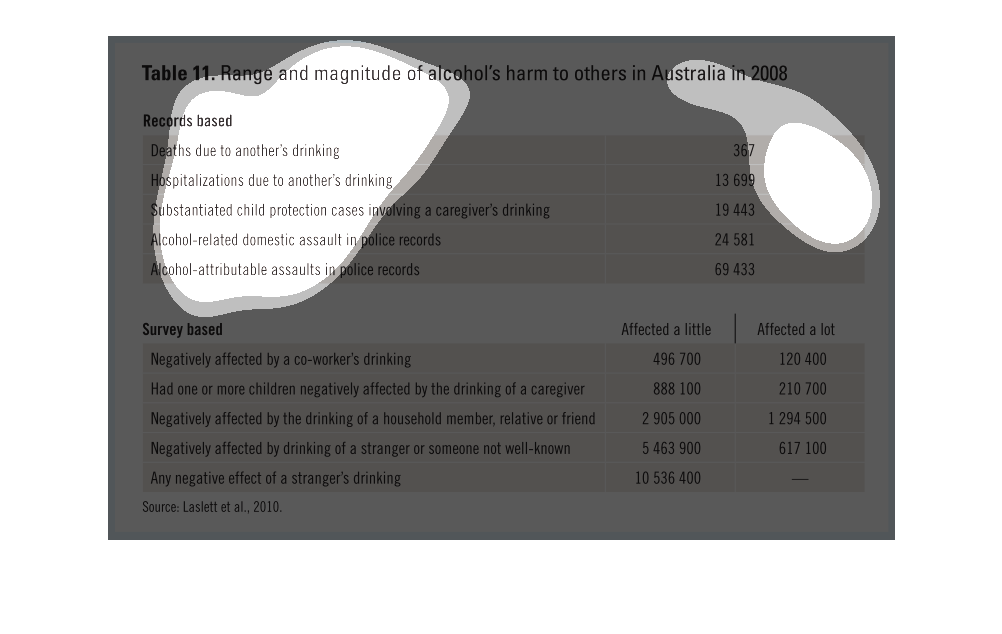
This is a list of: the range and magnitude of alcohol's harm to other's in Australia in 2008.
It goes on to list a variety of reasons and numbers for different scenarios that occurred
due to alcohol.
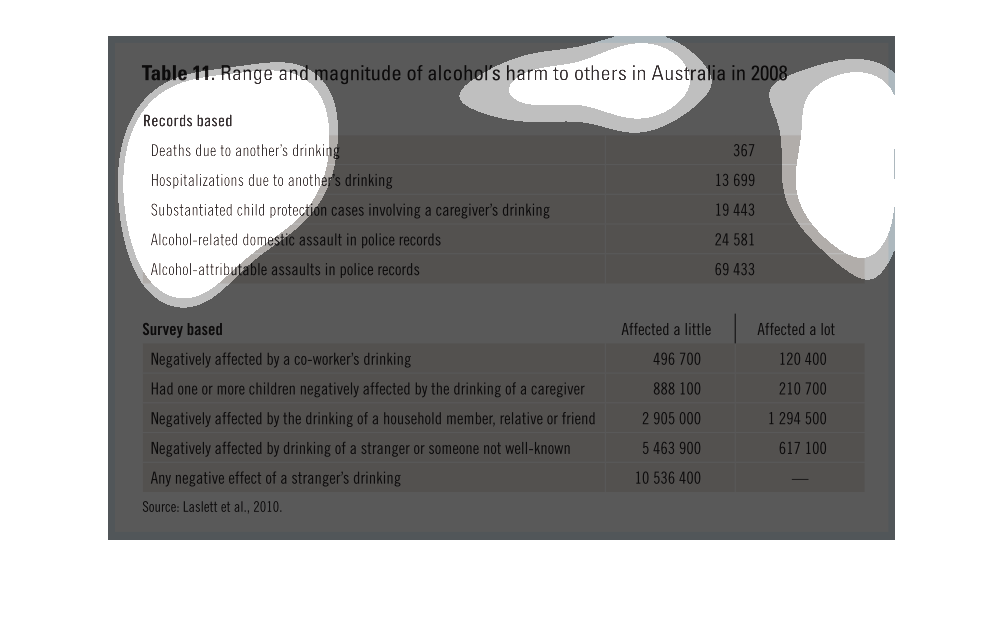
This chart describes range and magnitude of alcohol's harm to others in Australia in 2008.
Categories on the chart include deaths due to another person's drinking.
Range and magnitude of alcohol's harm in Australia in 2008. Records based and Survey based
information of deaths based on alcohol related deaths of persons