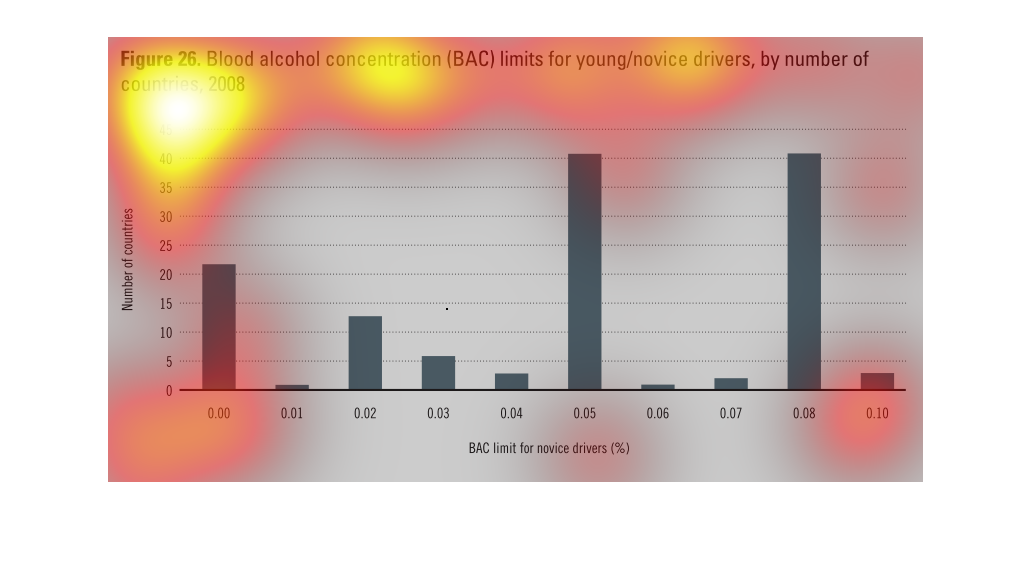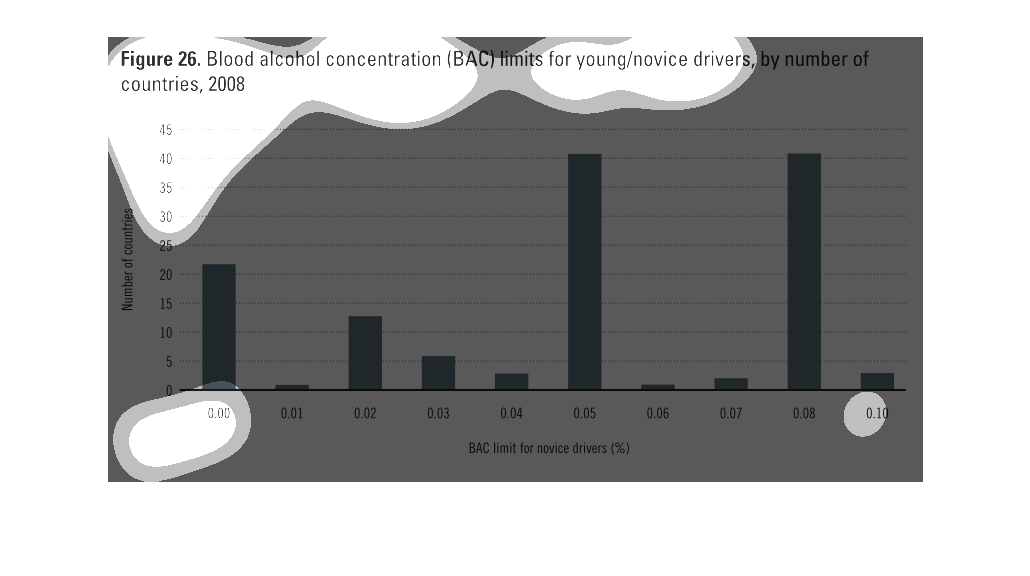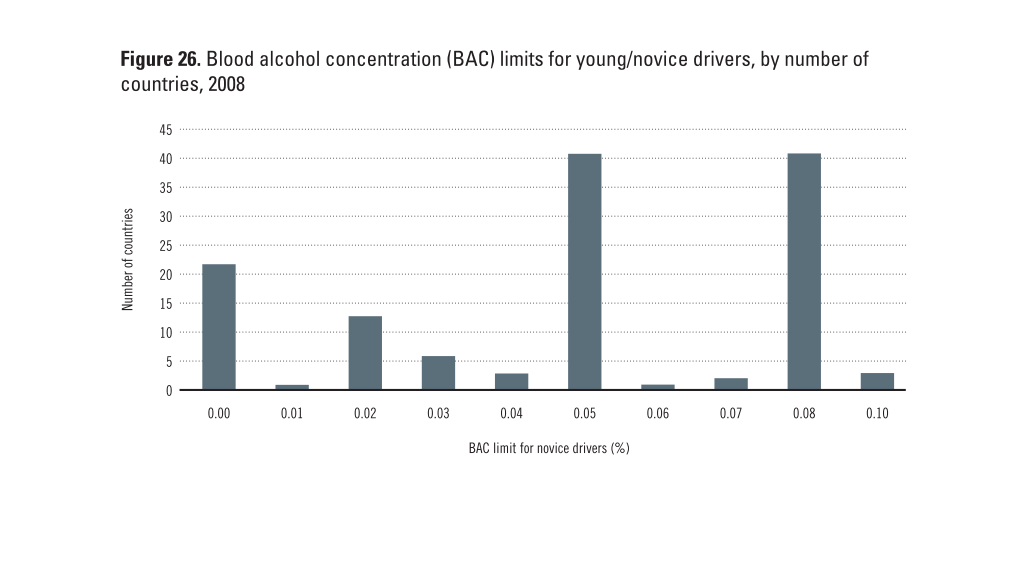
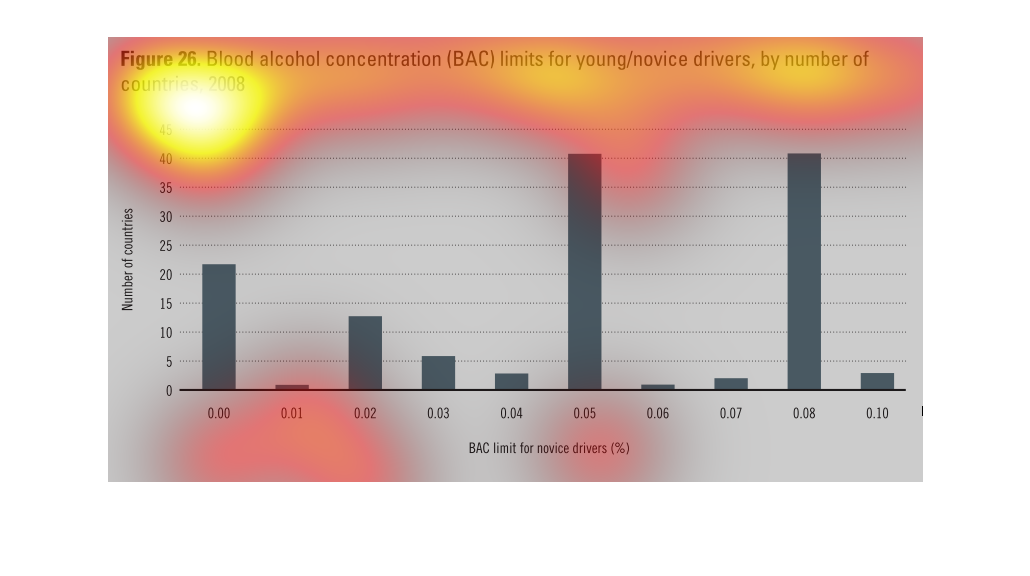
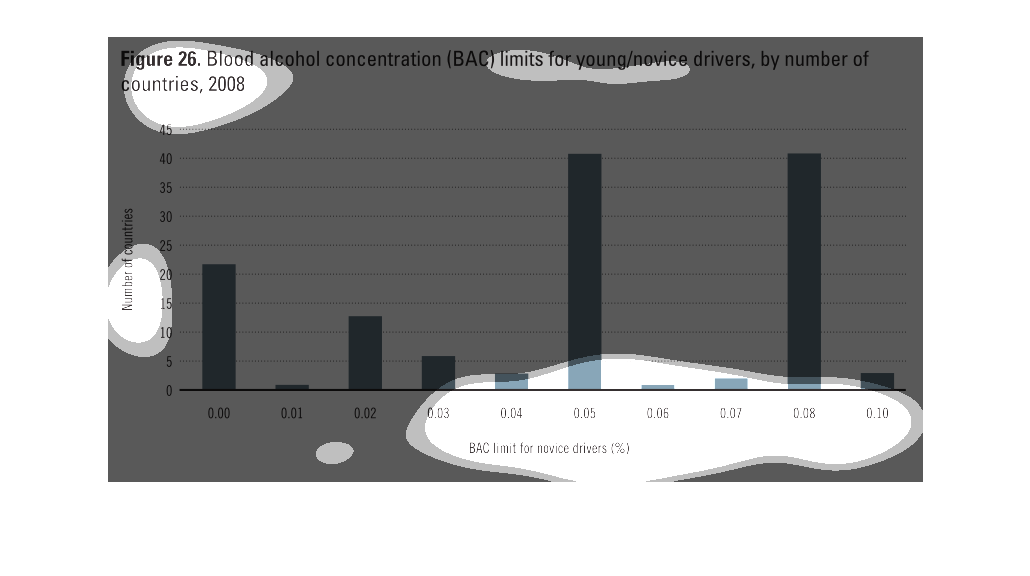
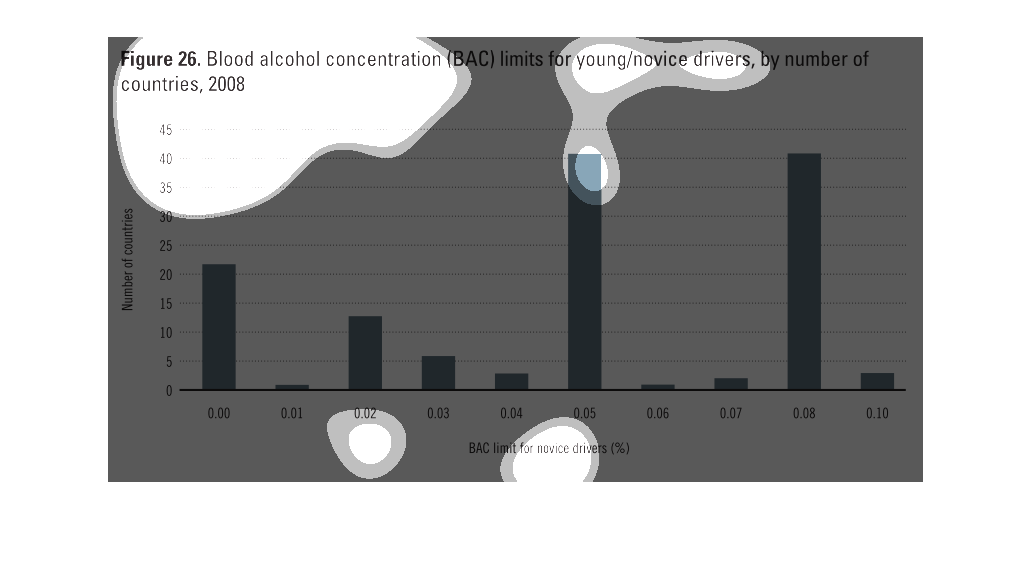
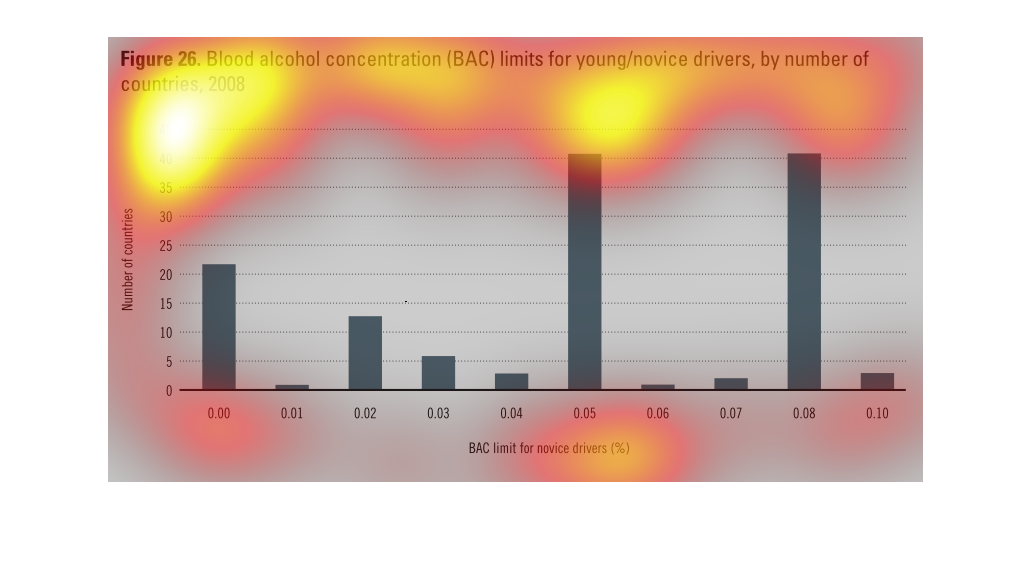
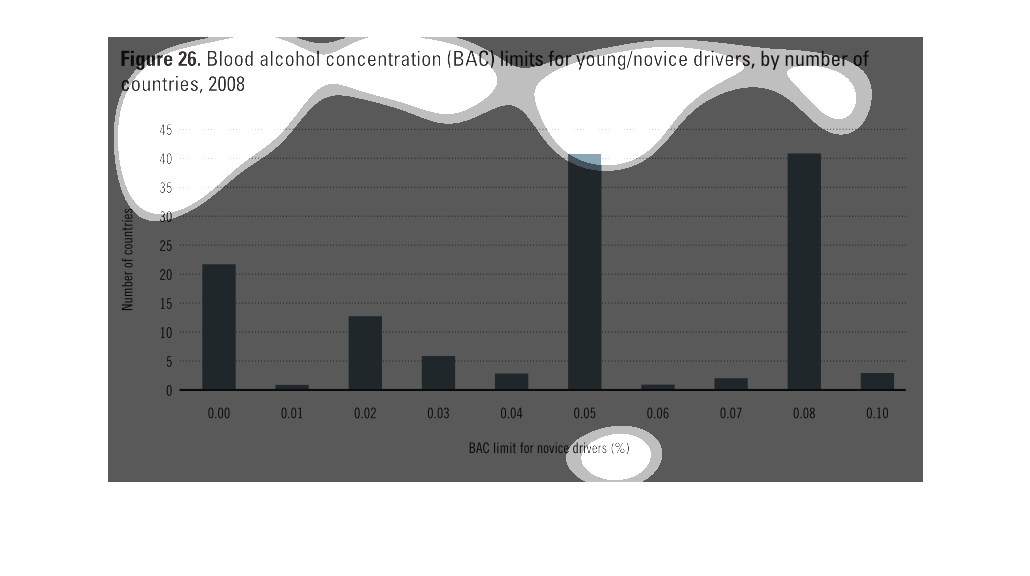
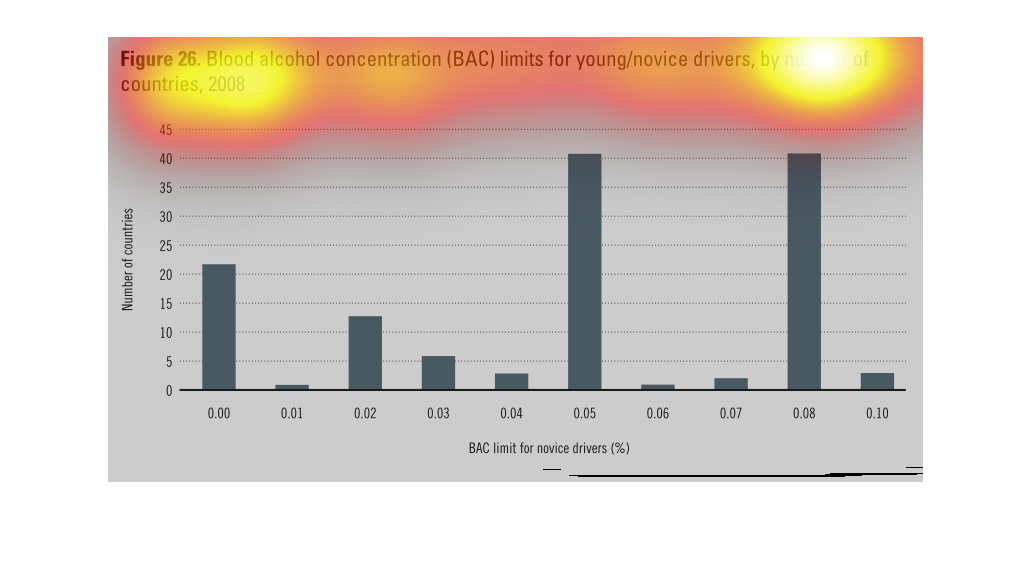
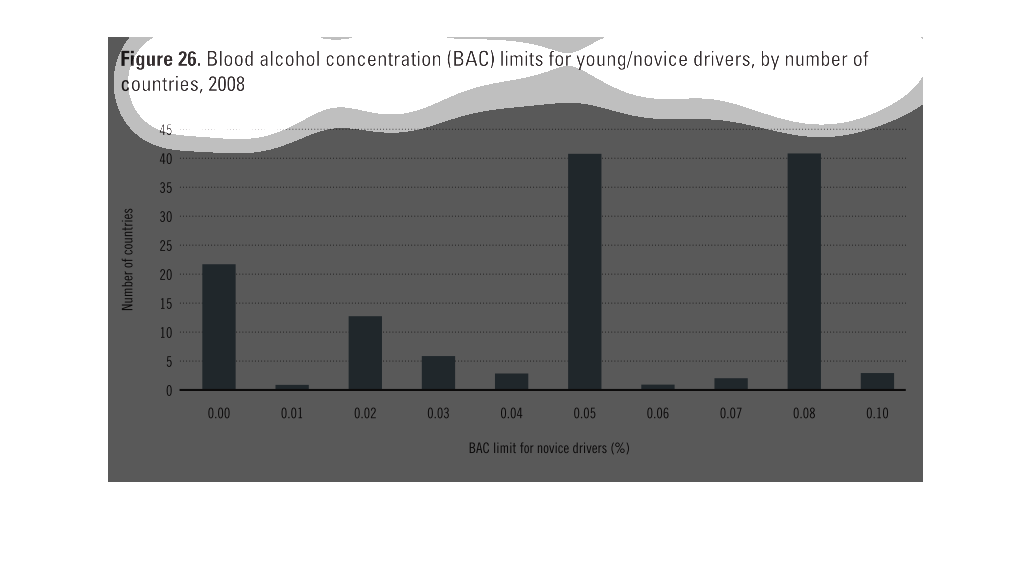
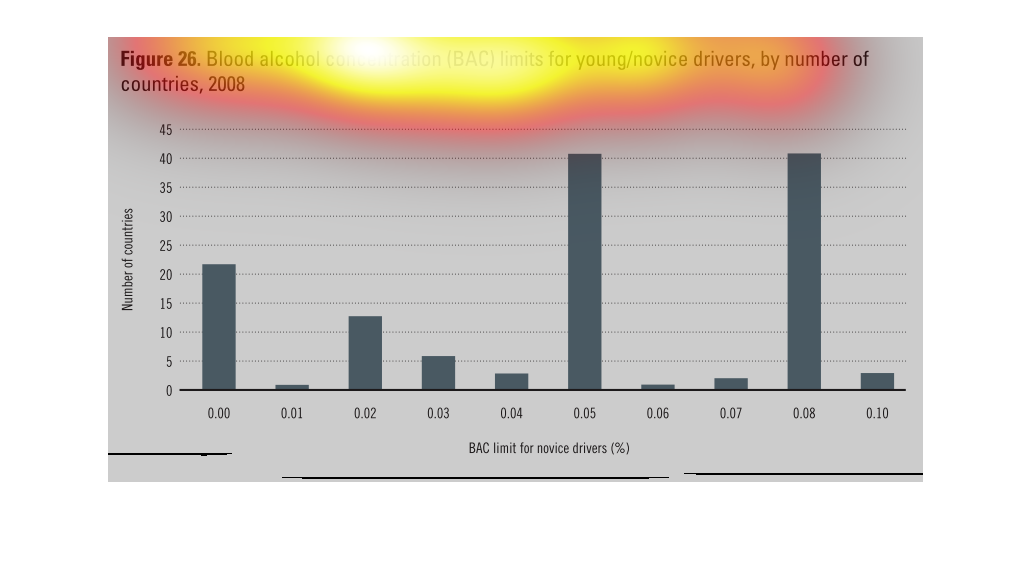
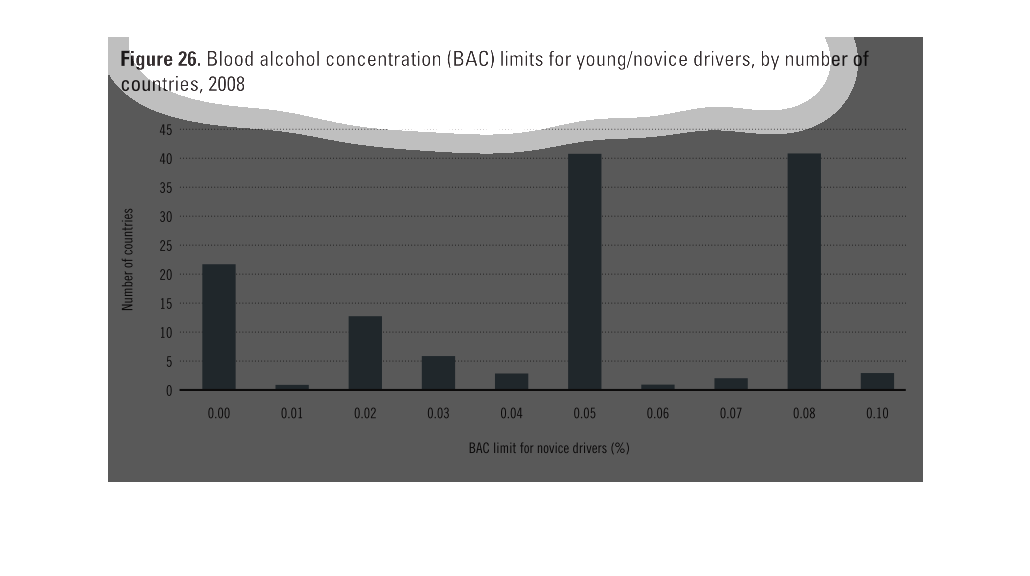
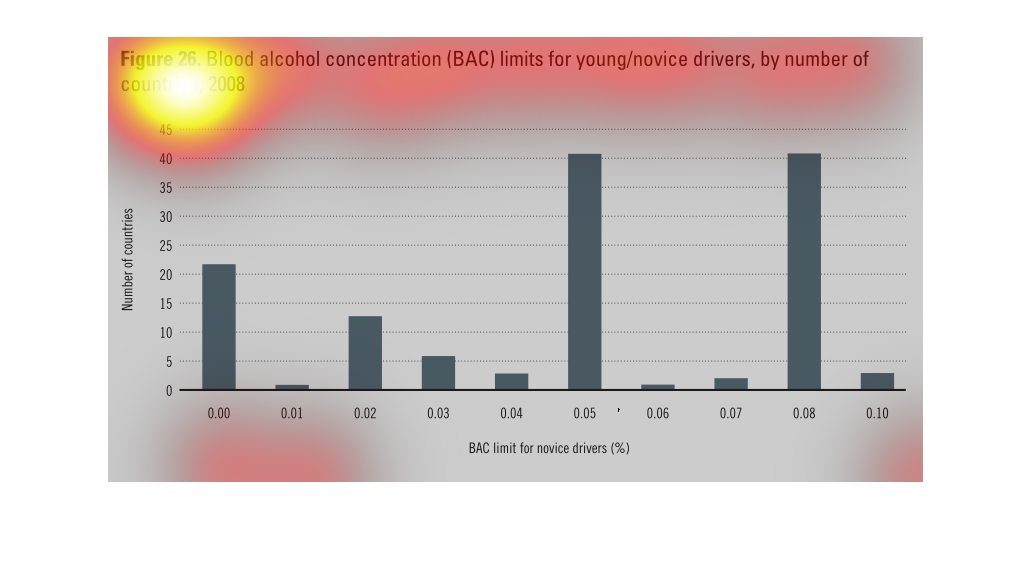
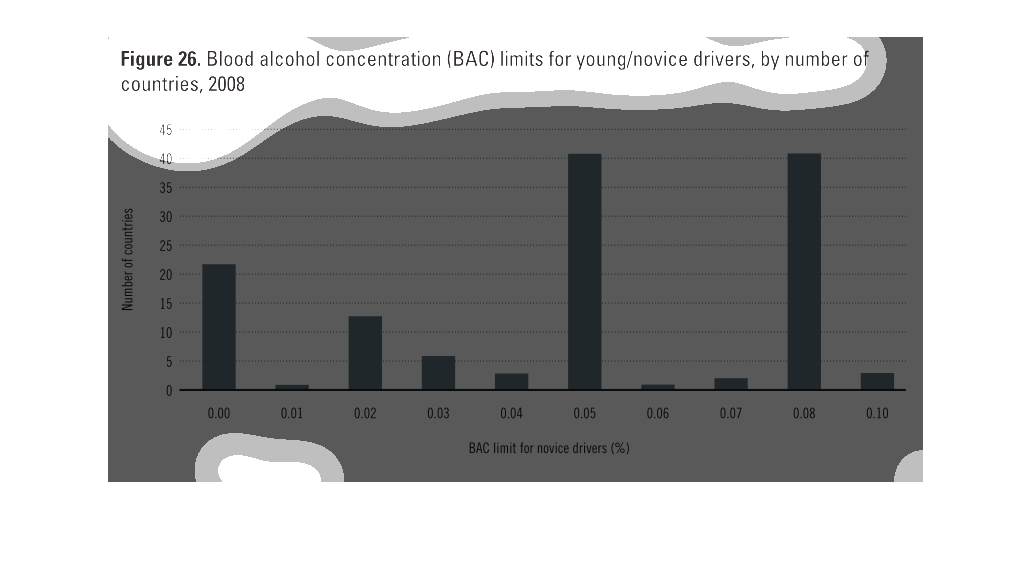
This chart displays the blood alcohol content allowed for novice drivers, organised by the
number of countries per BAC. The two largest acceptable BAC's are 0.05 and 0.08 for novice
drivers.

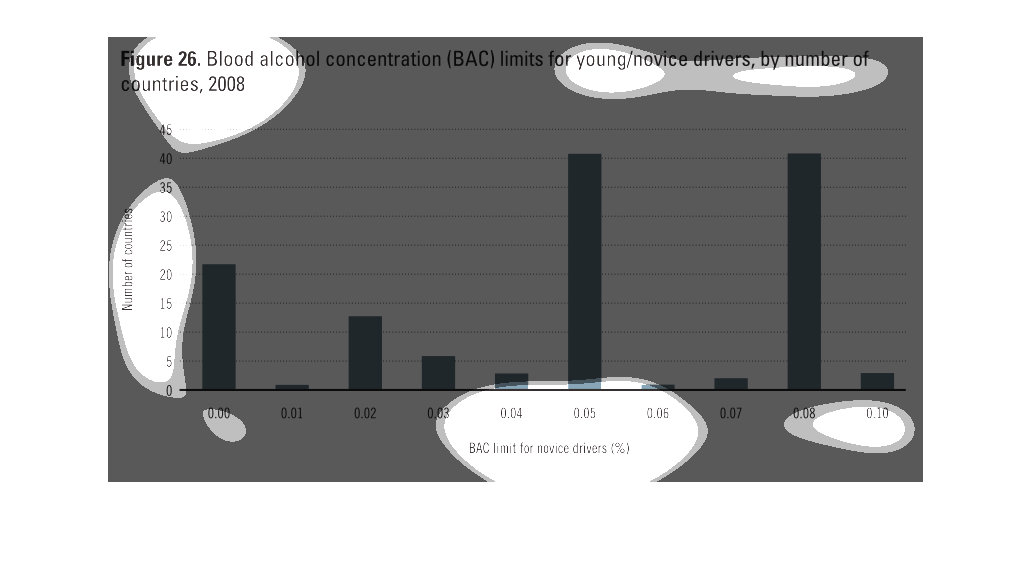
This chart describes blood alcohol concentration (BAC) limits for young/novice drivers, by
number countries, for the year 2008. The highest spike on the chart reaches the 40 mark.
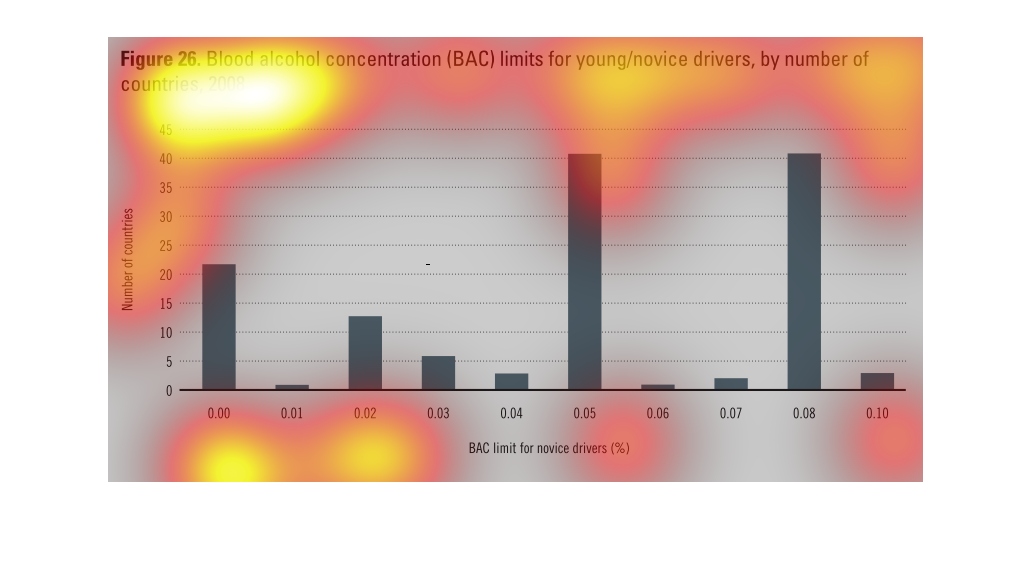
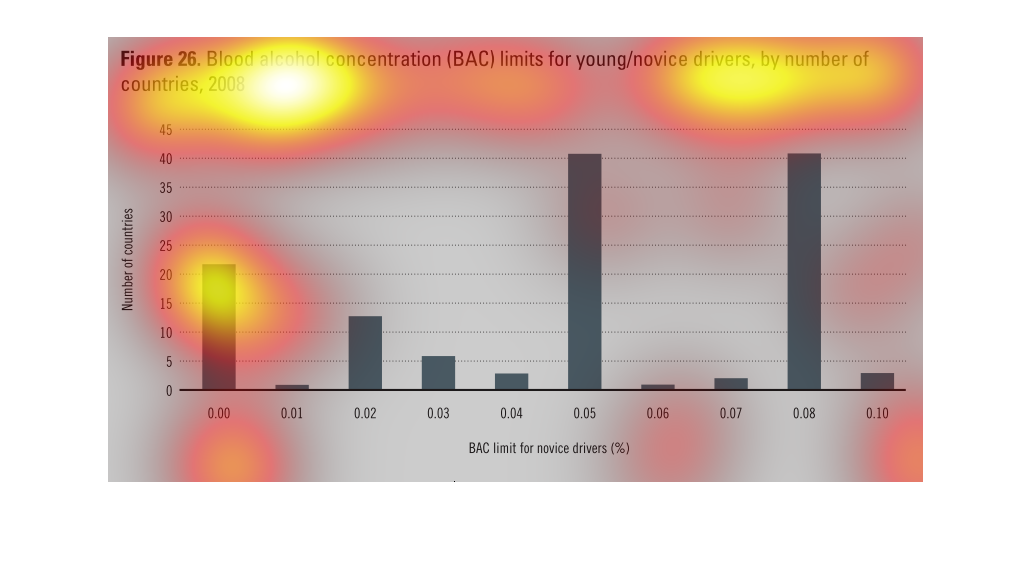
this is a bar graph and the name of this graph is called the blood and alcohol concentration
the bar graph   the bar graph is green and its cool. bye bye
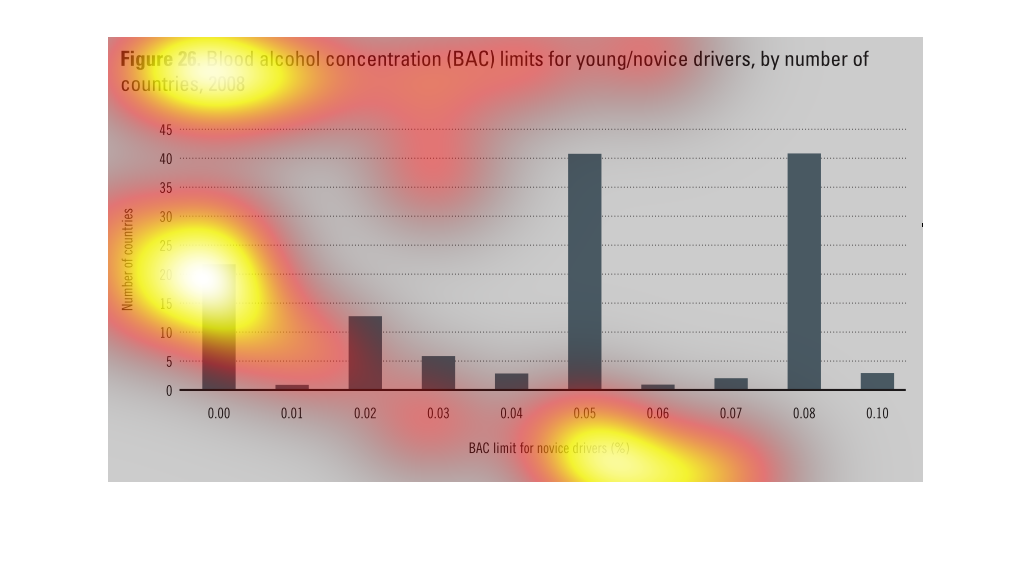
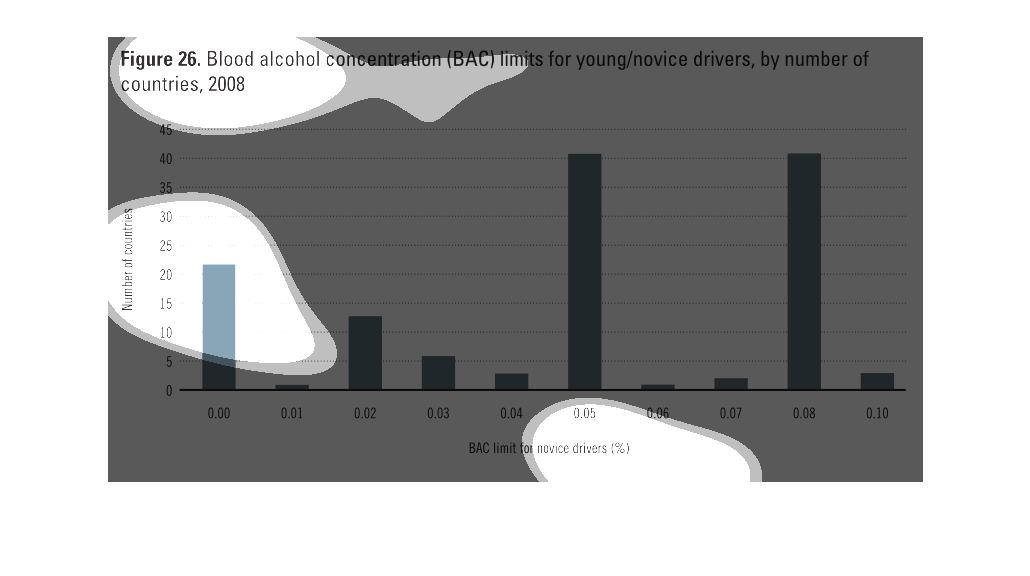
figure 26 blood alcohol concentration (BAC) limits for young/novice drivers by country 2008.
Y axis is number of countries, X axis is BAC percentage. 0.05 and 0.08 is most common, followed
by 00000 tolerance, and 0.02

The chart shows the blood alcohol content for young/novice drinkers in various countries.
 .08 and .05 are equally the most common.  The next most common is extremely low, at 0.00.
 There are only a few entries that fall between the values of 0.0, .05 and .08.
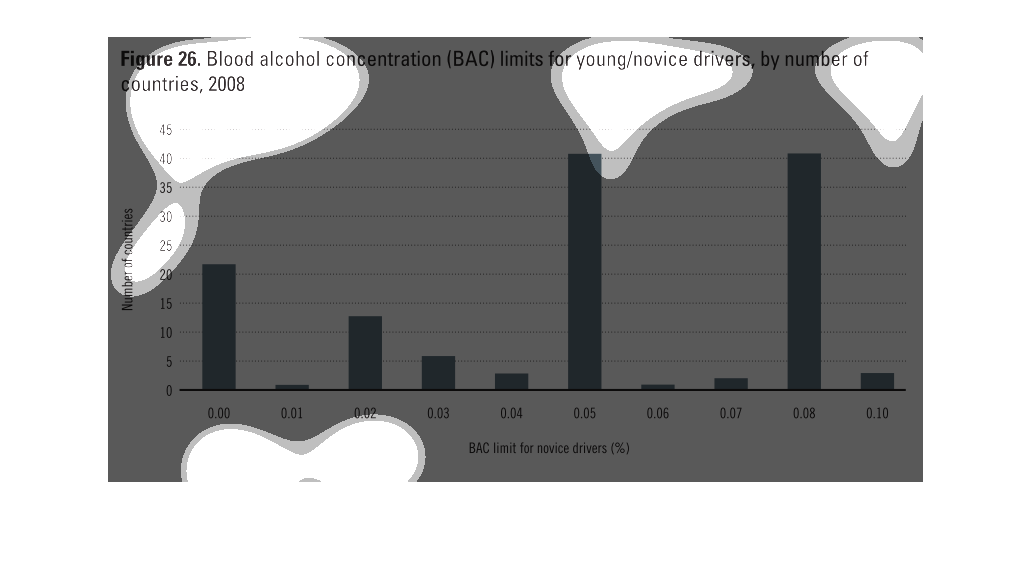
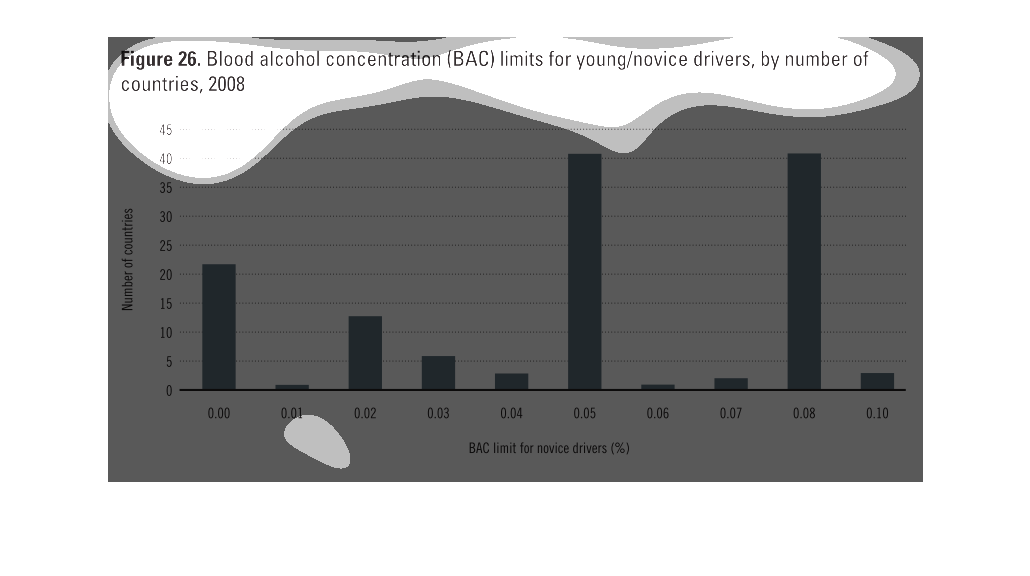
This chart describes blood alcohol concentration (BAC) limits for young/novice drivers, by
number of countries, for the year 2008. The highest spike on the chart come is around 40.
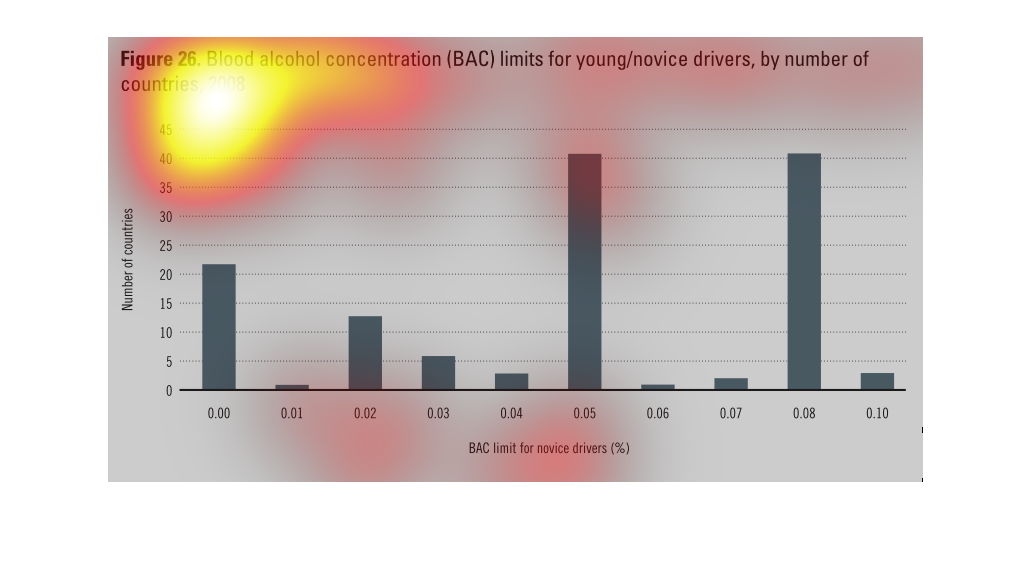
A bar chart infographic showing the blood alcohol limited for various countries from 2008.
Shows .05 and 0.08 are the most common limited for intoxication
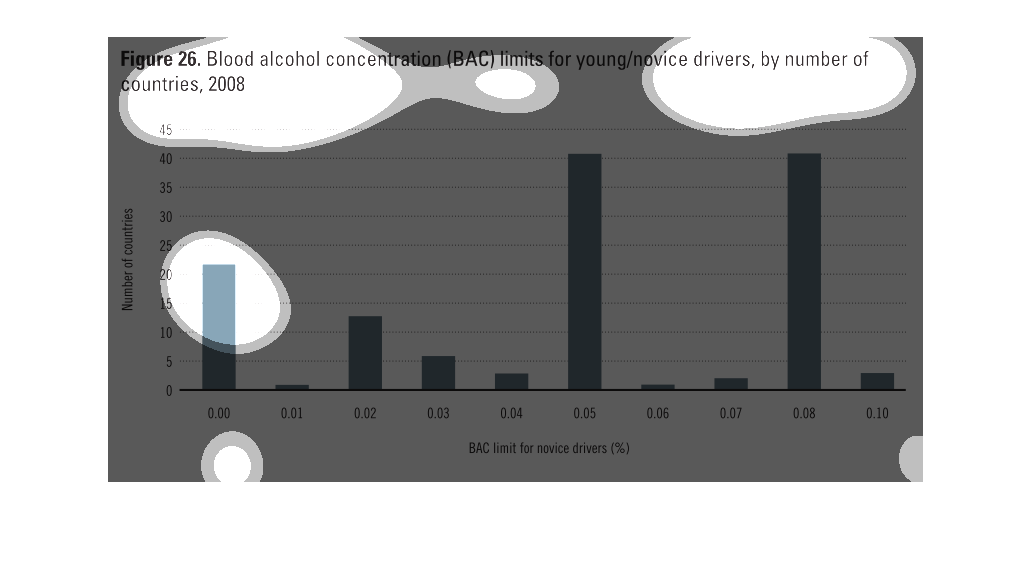
This graph was a little wonky with the clicks however it seems to separate new drivers in
order of their BAC. It seems to be rather random, the amounts of blood alcohol content in
their blood when pulled over.
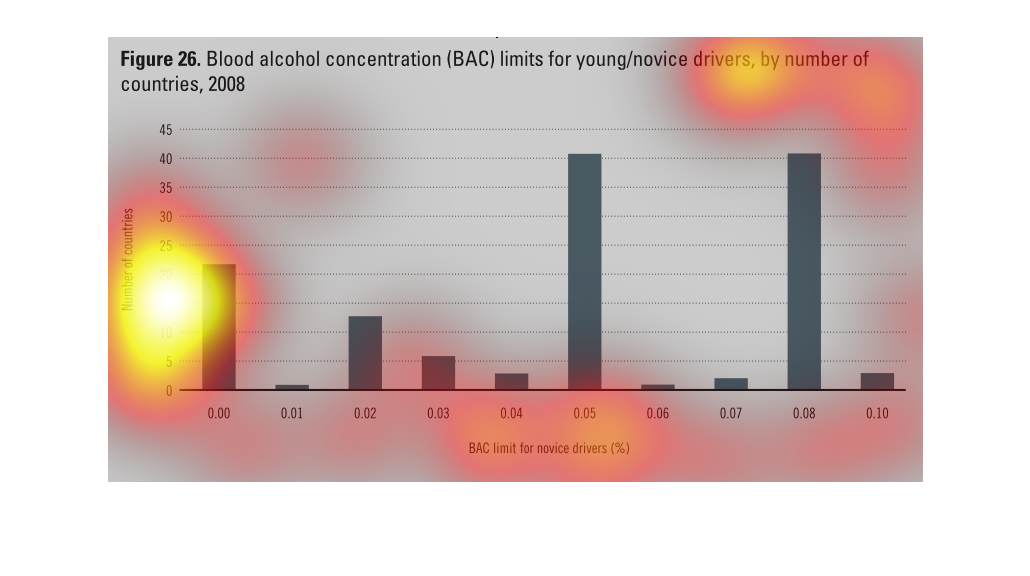
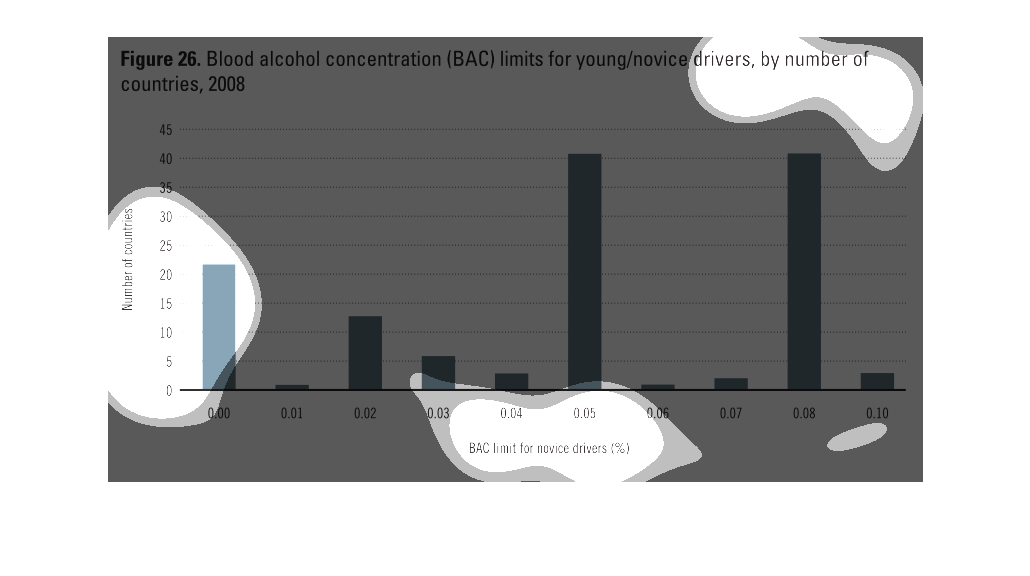
This chart described blood alcohol concentration limits for young/novice drivers by number
of countries, 2008.  Around 40 countries are at 0.05 and another 40 at 0.08.  The lowest is
0.00, and the highest is 0.10.
This is a graph that illustrates blood alcohol concentration (BAC) limits for those who are
young in age or novice drivers by number of countries in 2008.
The figure presented is titled Figure 26: Blood alcohol concentration (BAC) limits for young/novice
drivers.  The data for this information is a bar graph.
This is a series of bar graphs depicting blood alcohol concentration limits for young/novice
drivers by a number of countries for the year 2008 ranging from 0.0 to 0.10
Blood alcohol content limits for young/novice drivers by number of countries. The left scale
indicates the number of countries. The graph has bars that correspond with the BAC (Blood
alcohol content).
This graph depicts the blood alcohol concentration level (BAC) for young/novice drivers by
numbers and countries in 2008, 0.5 and 0.8 had the highest