This chart describes regulation and product placements on television, by type as a percentage
of all WHO member states for the year 2008. Categories are represented by different colors.
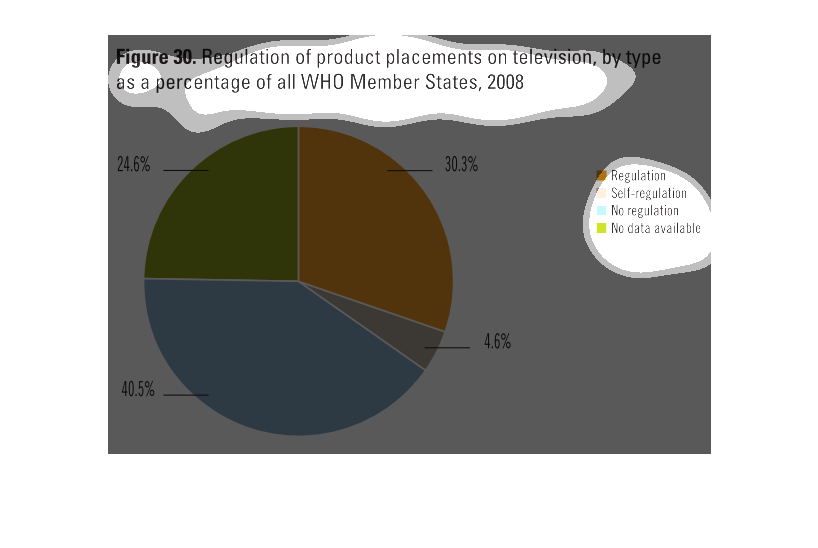
The graph shows the regulation of product placement by type on television in all WHO member
states. The majority of member states have legislative regulation, while the minority have
self regulation. Many states have no regulation, while roughly one quarter of member  states
have no data available.
This is a graph of regulation of regulation of product placement on the television,by type
as a percentage of all WHO member states in the year 2006.
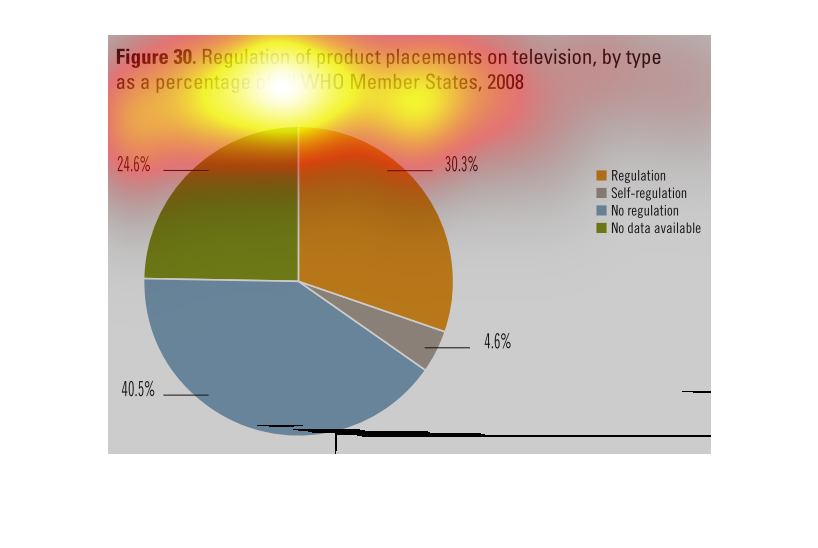
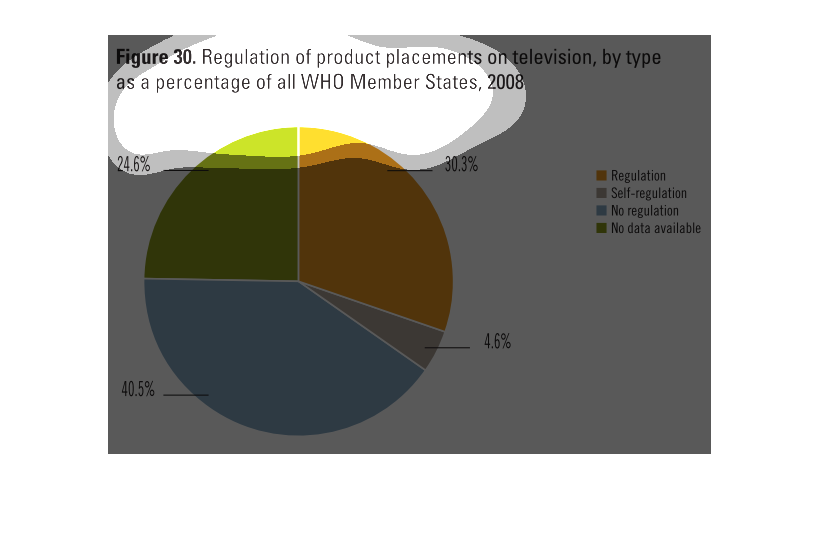
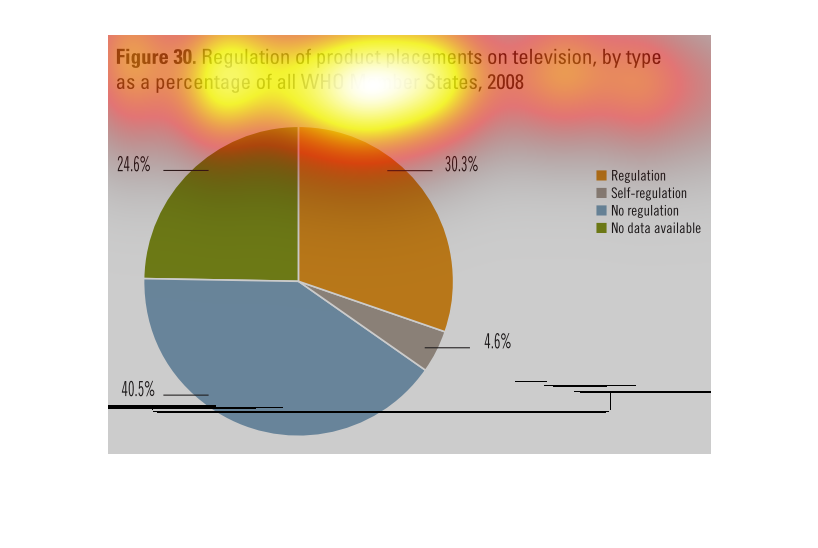
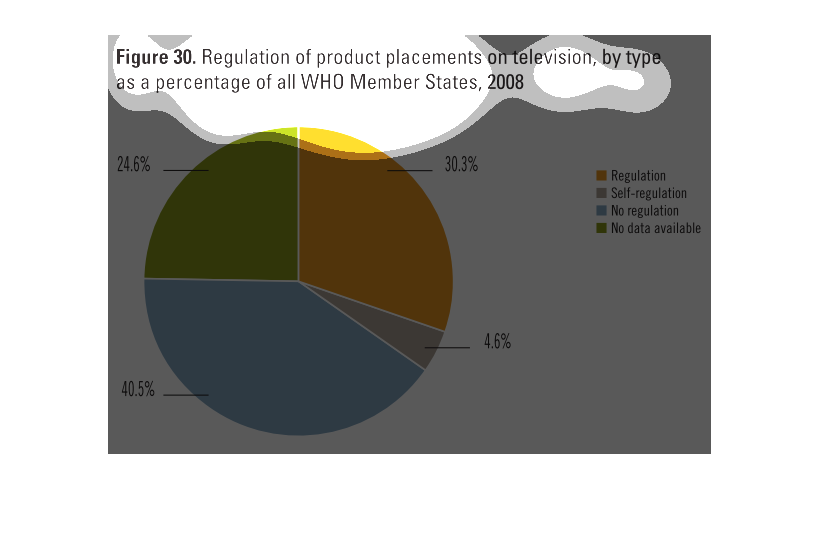
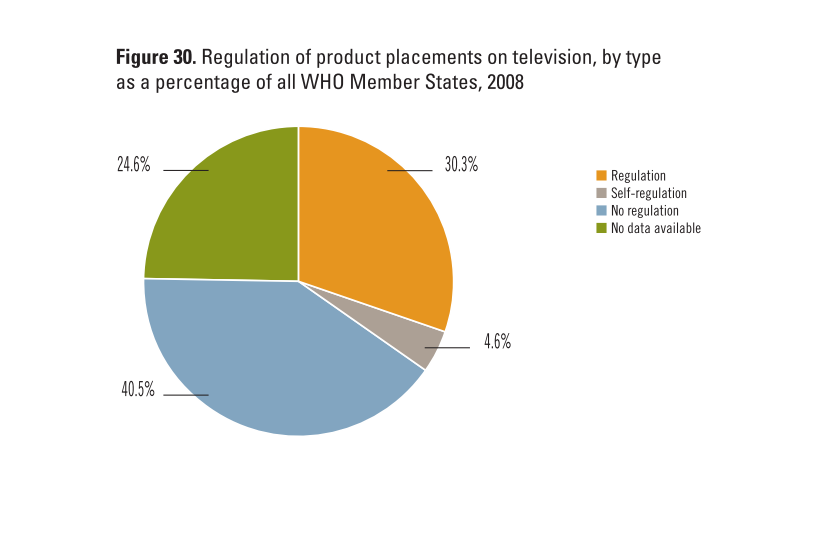
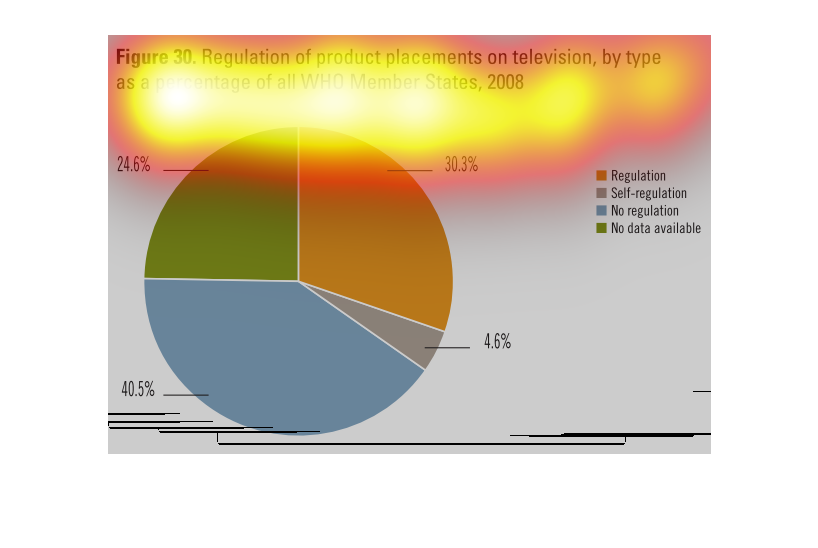
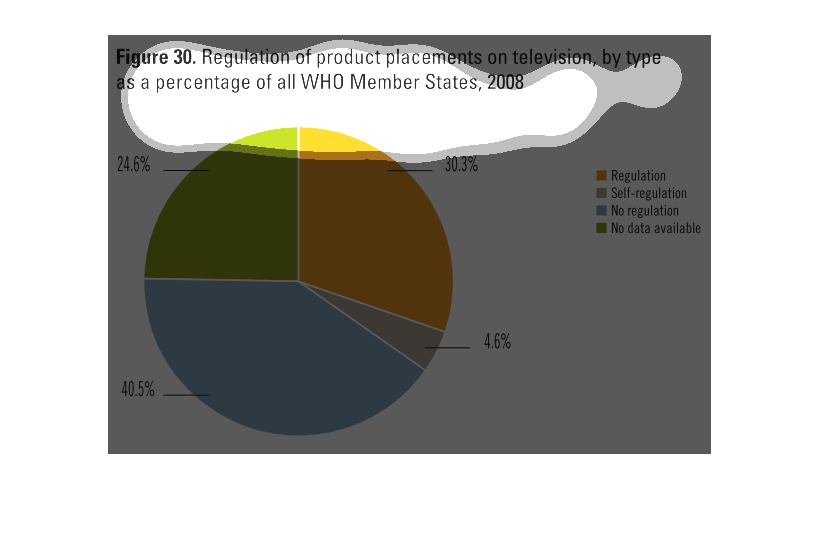
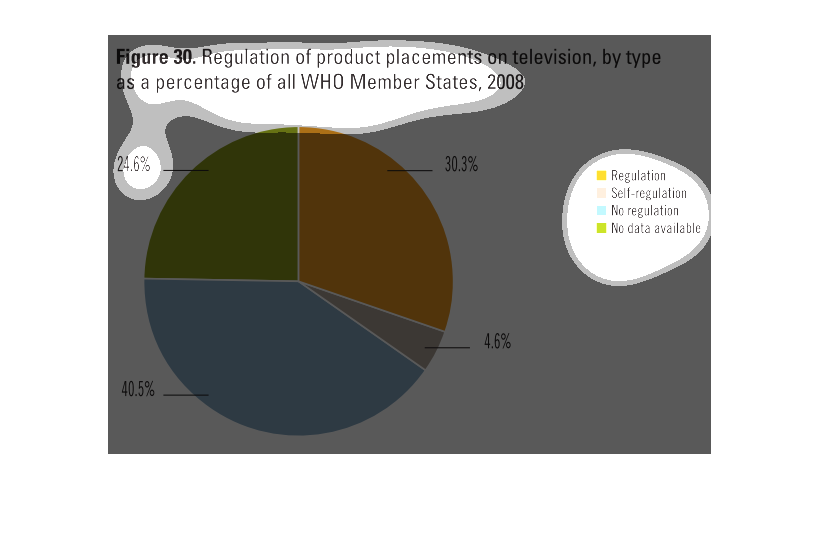
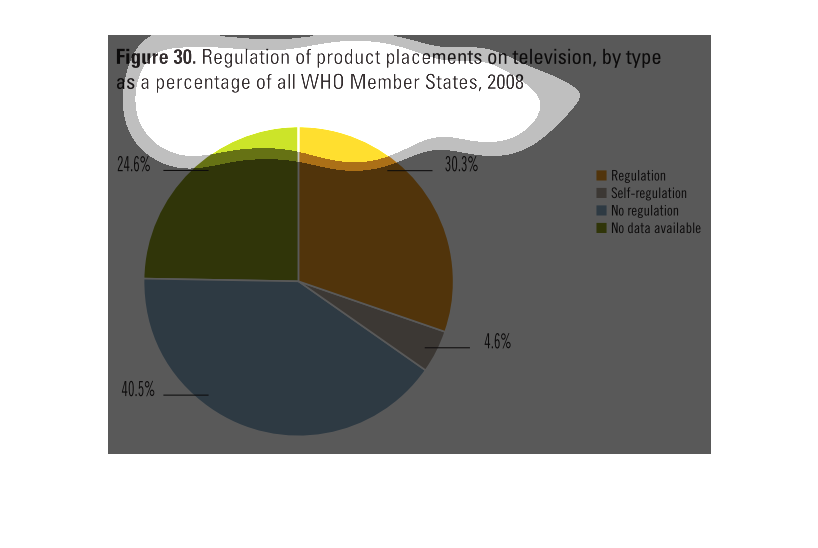
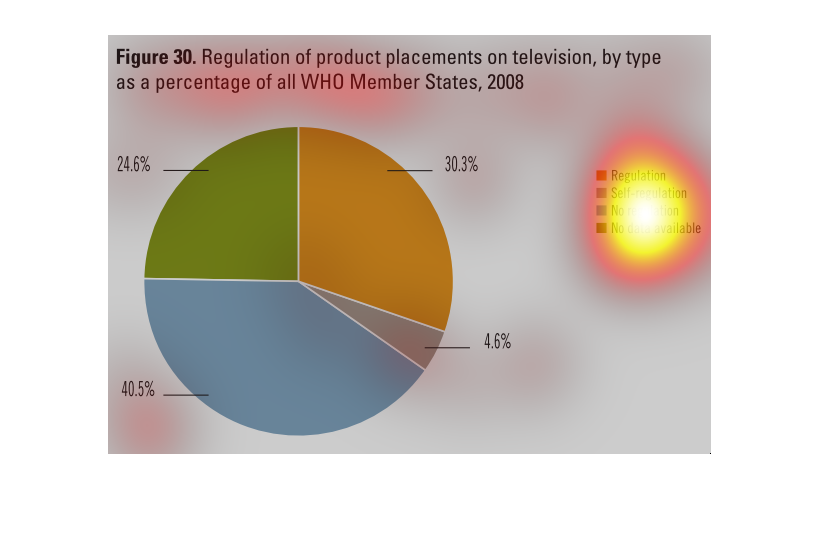
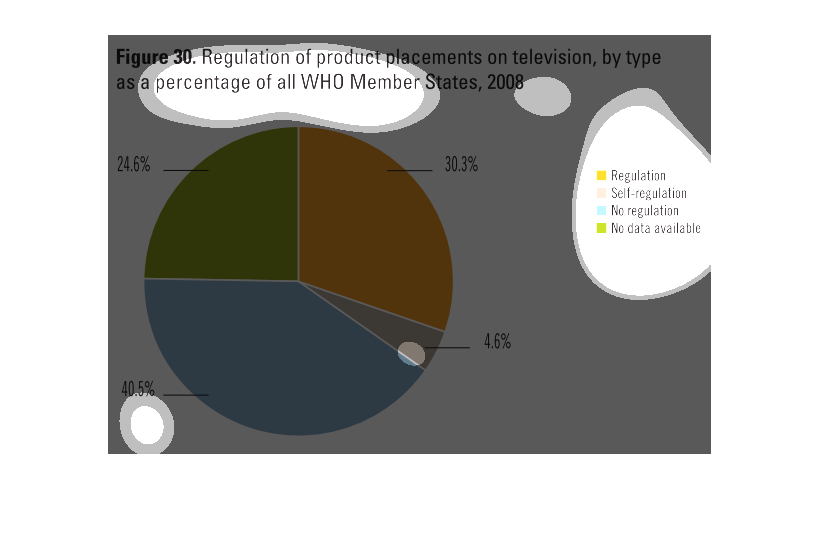
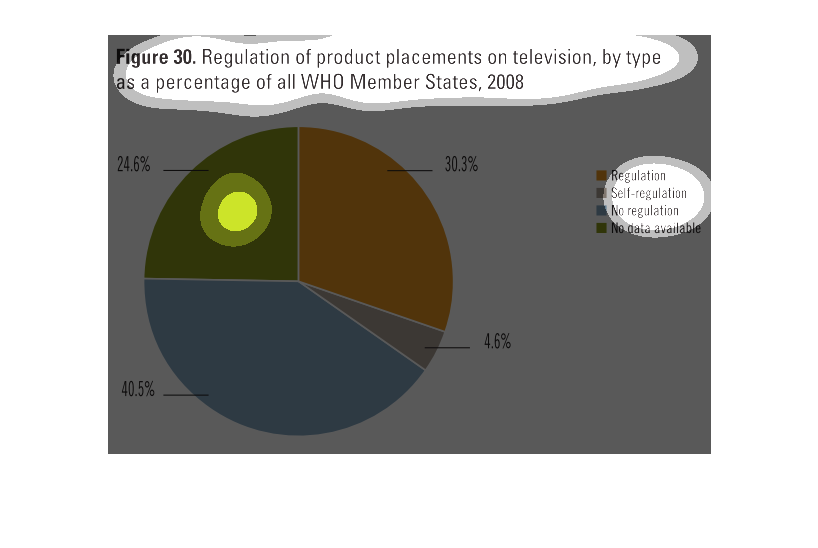
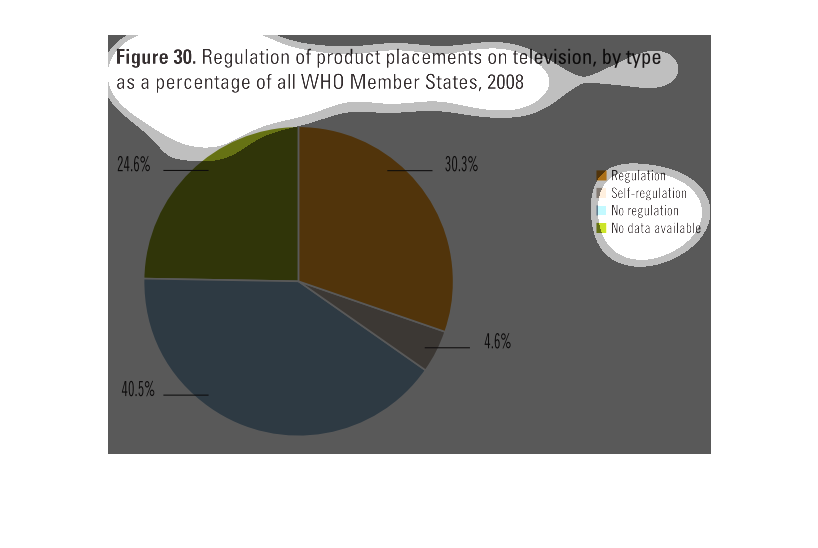
figure 30 regulation of product placements on television, by type as a percentage of all WHO
member staes, 2008. We see the information displayed in a pie chart
The image shows percentages in regards to product placement on television for WHO member states
in 2008. A whopping 40.5% had no regulations in place whatsoever, 30.3% had regulations, 24.6%
had no data available, and 4.6% were self-regulated when it comes to product placement on
TV.
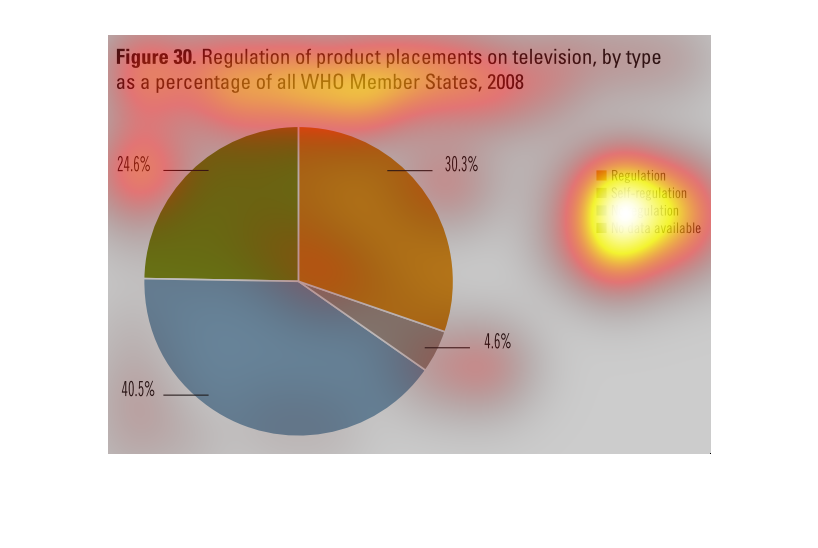
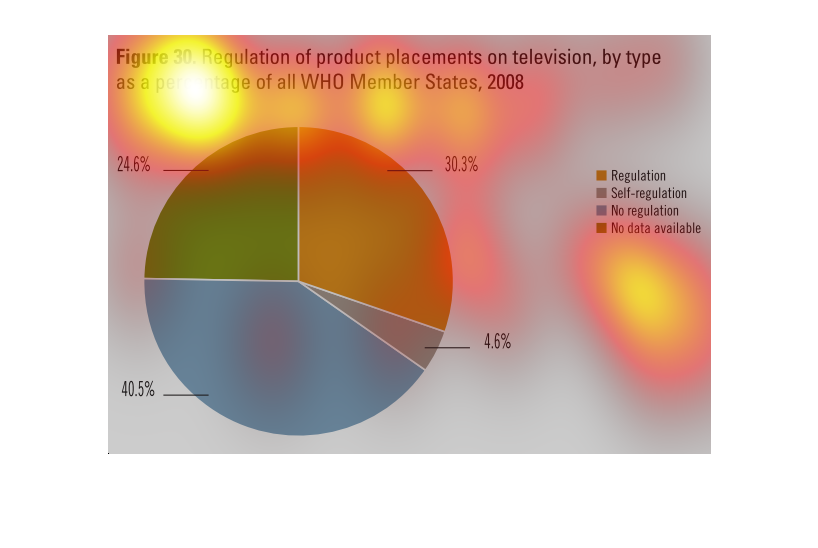
In the WHO there are states who regulate and do not regulate and have various forms of regulation
in terms of product placement on TV. A vast majority with 40% do not have regulations followed
by 30% who are regulated then 24.6% which don't have data available
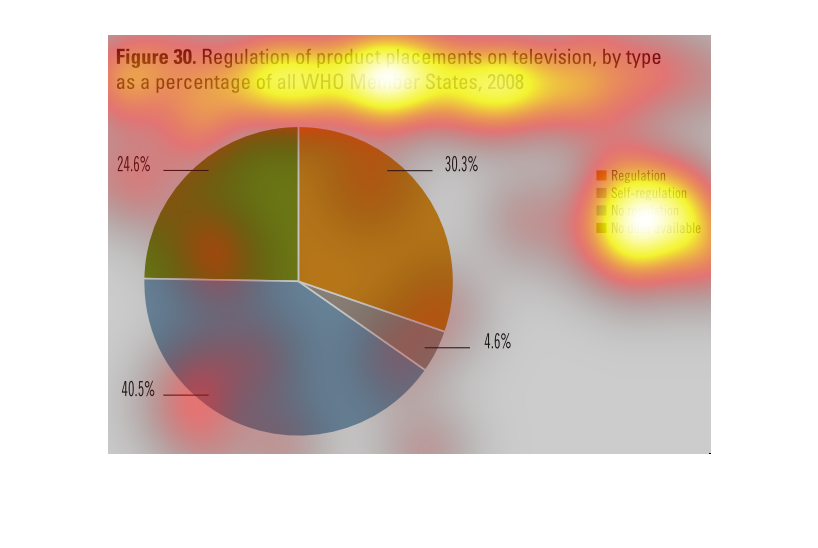
This chart describes regulation of product placements on television, by type as a percentage
of all WHO member states, for the year 2008. Different colors represent different categories.
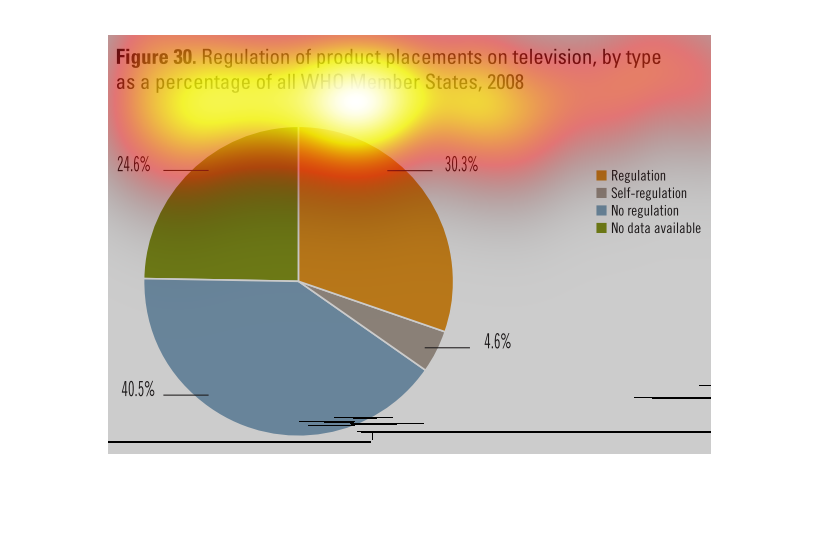
This is an image of a pie chart that depicts the percentages of ads placed on television.
The chart is divided into 4 categories with the category of non-regulation being the largest
percentage. The pie chart is blue, green, orange and gray.
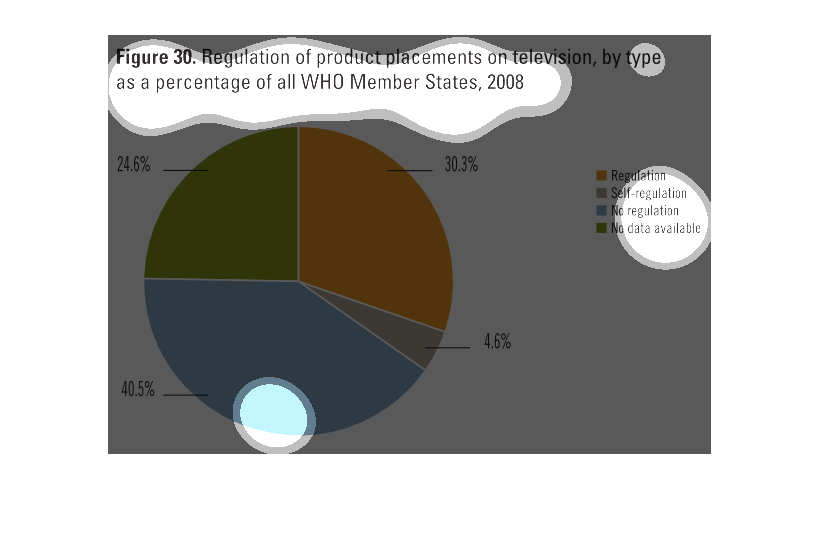
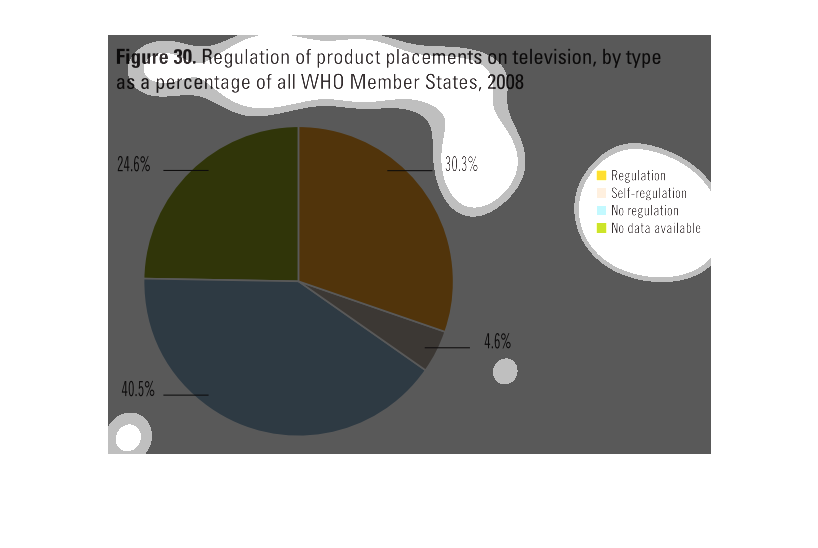
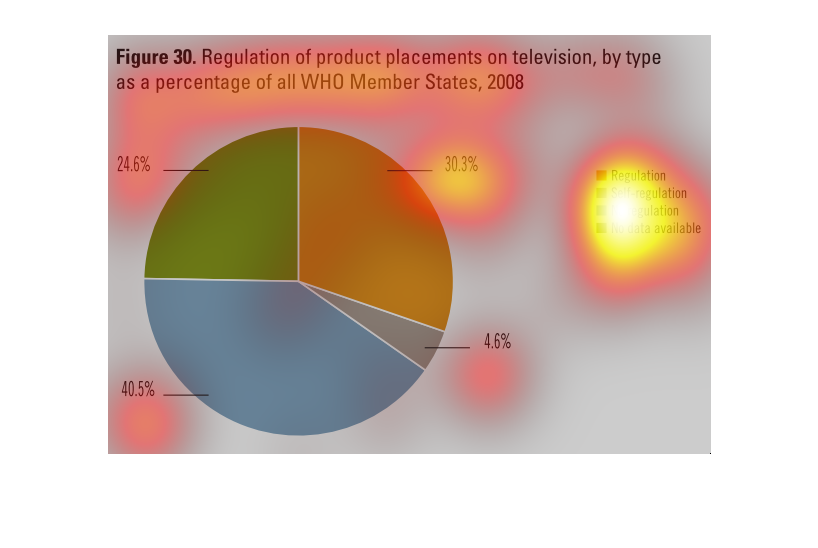
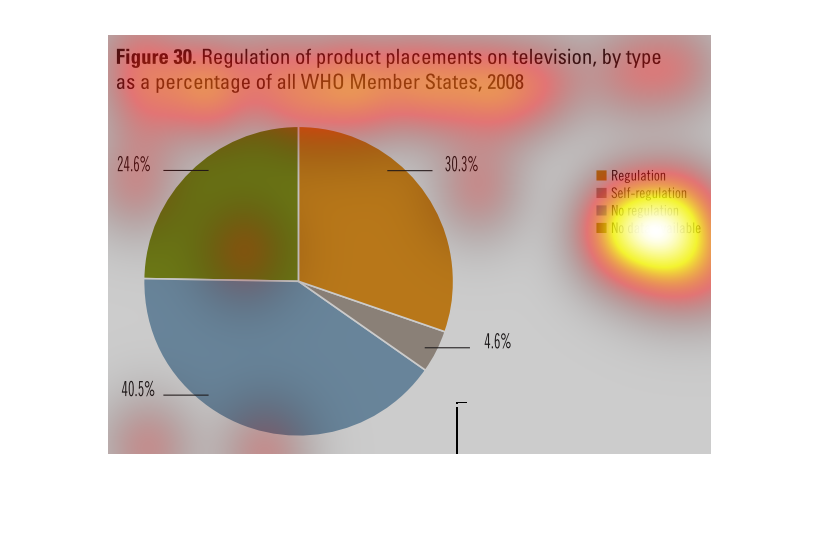
This chart shows the regulation of product placement on television by WHO member states. The
chart shows in pie form the different sections of regulation, self regulation, no regulation
and no data available.
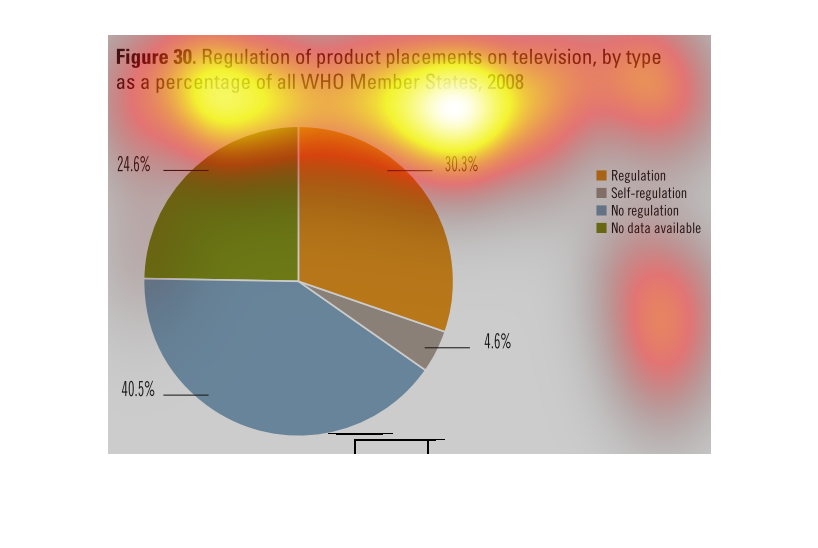
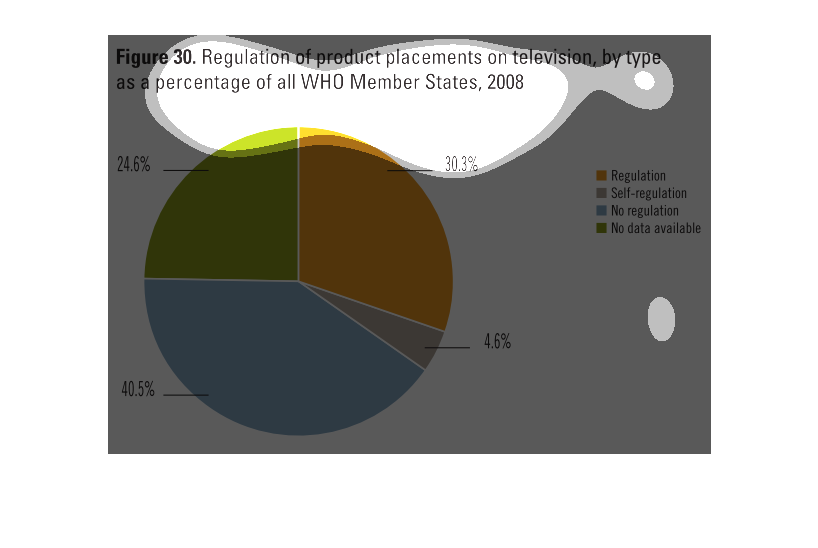
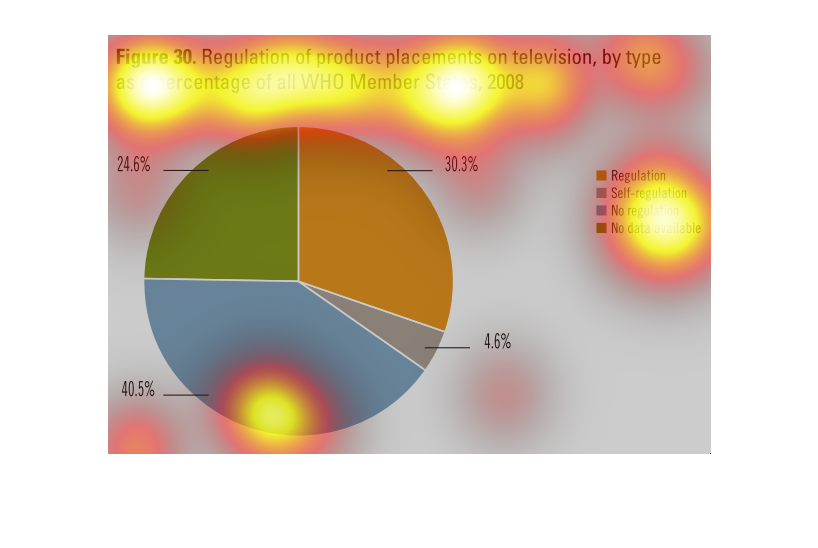
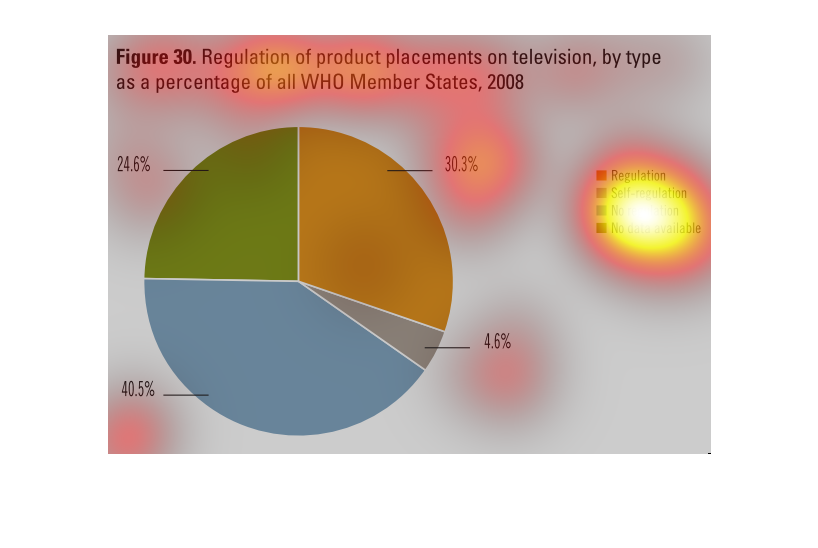
Figure 30 shows regulation of product placements on television by all WHO member states in
2008. 30.3% were regulated.  24.6% did not have data available.
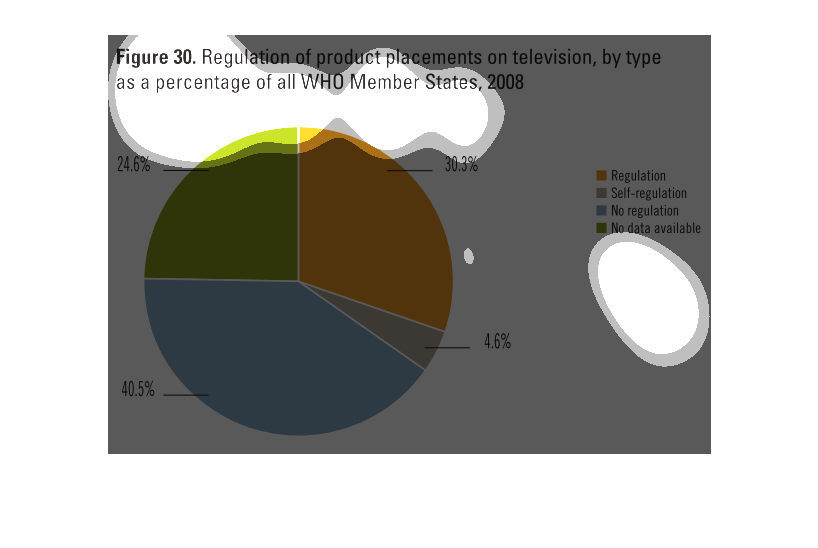
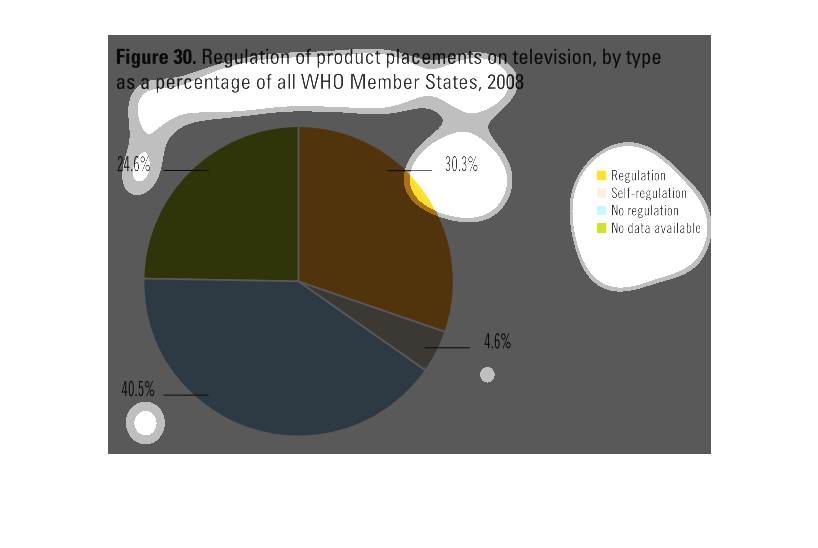
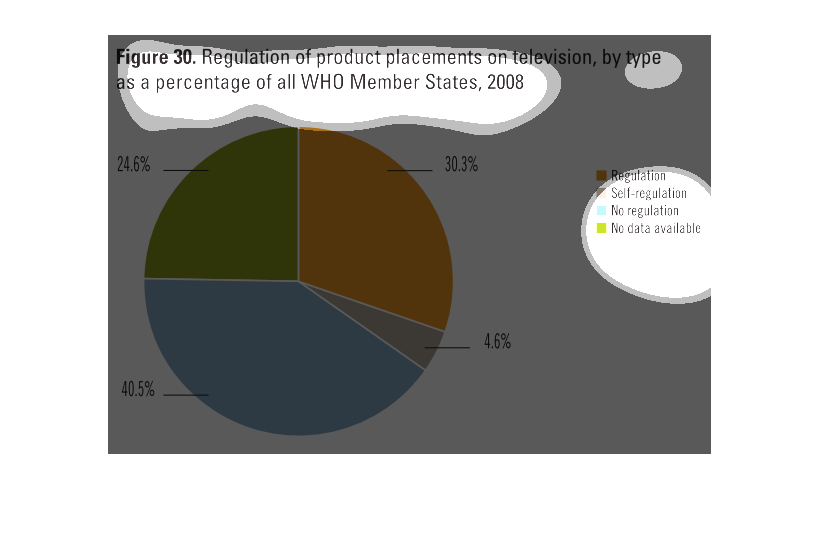
This chart shows the regulation of product placement on television by type as a percentage
of WHO member states in 2008.   40.5% product placements had no regulation and 30.3% had regulation.
The fact that there is a lot of product placement on television is a growing demographic that
needs to be monitored. As this graph points out, there seems to be a lot of regulation going
on that needs to be remedied.
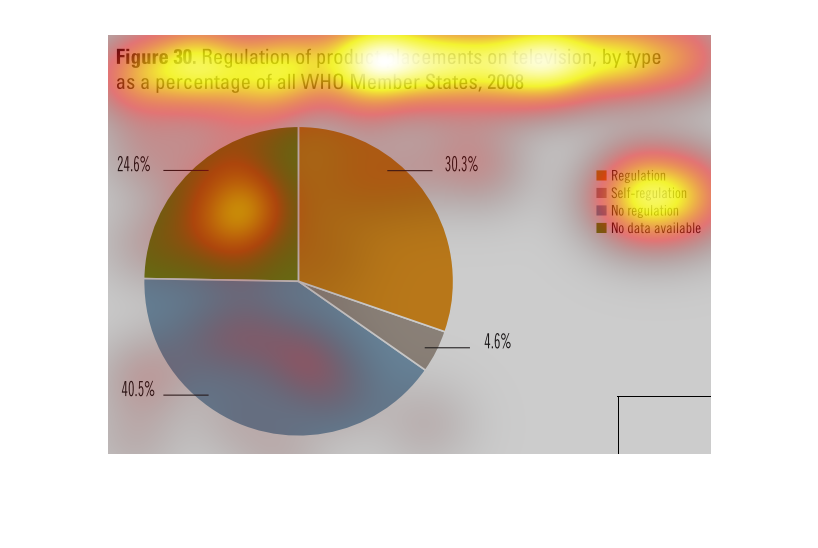
THIS PIE CHART SHOWS THE REGULATION OF PRODUCT PLACEMENTS ON TELEVISION SHOWS BY TYPE OF REGULATION
FOR WHO MEMBER COUNTRIES. THIS IS GIVEN IN PERCENT.
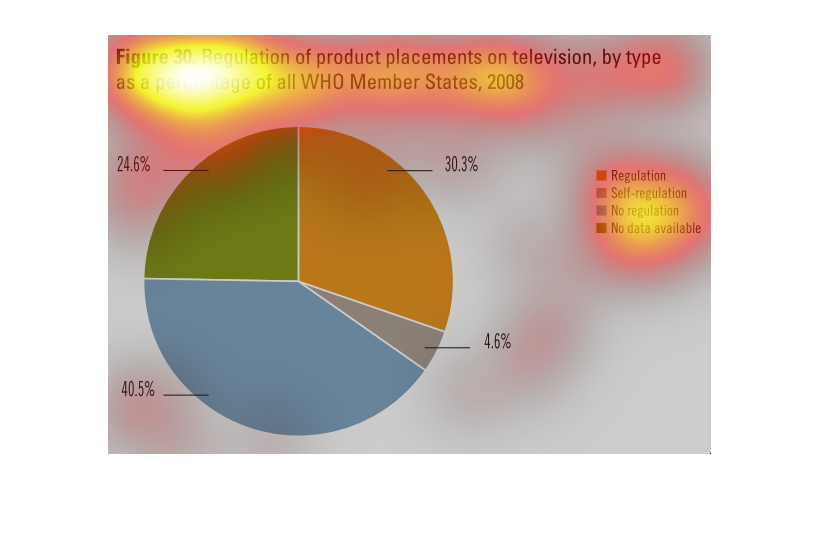
Regulation of product placement on television, by type as a percent of World Health Member
States, 2008.  24.6% goes to no data available 30.3% to regulation 40.5% no regulation
The figure presented is titled Figure 30: representation of product placement on television,
by type. The figure is a pie chart that represents product placement.