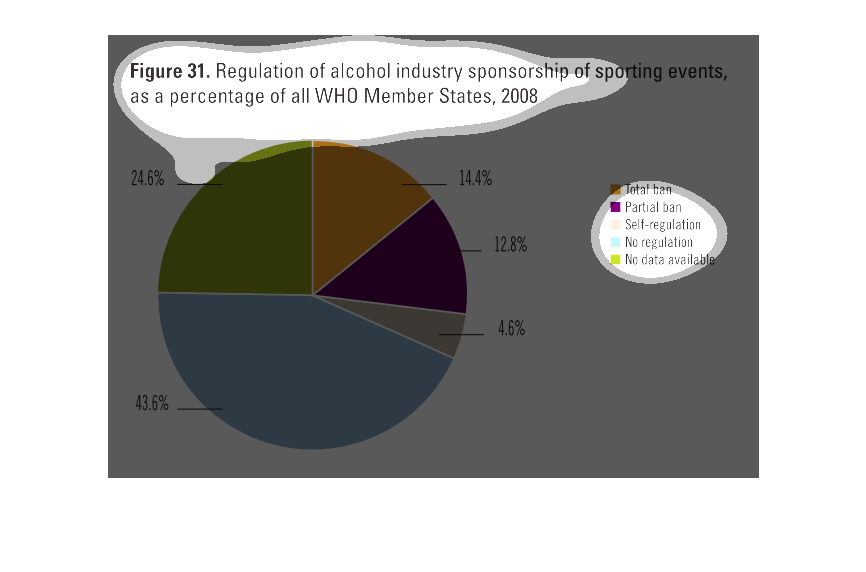
This pie chart shows the regulation of alcohol industries in sporting events as WHO Member
States. The largest percentage (43 percent) has no regulation.
THIS PIE CHART DESCRIBES THE REGULATION OF THE ALCOHOL INDUSTRY SPONSORING SPORTING EVENTS,
AND THE TYPE AND PERCENTAGE OF BAN ON ALCOHOL IN THE INDUSTRY IN 2008.
It is a pie chart for regulations of alcohol for sporting events as a percentage of who members.
 There is no regulation for the biggest percentage and self regulation having the smallest
percentage.
This is a chart that shows the distribution of the regulation of the alcoholic beverage sponsorship
of sporting events in the year 2008 as a percentage of WHO members.
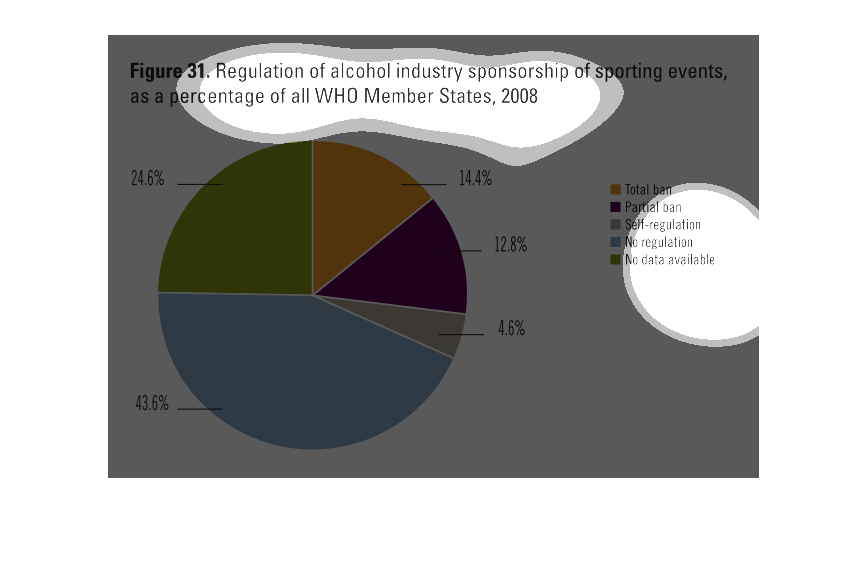
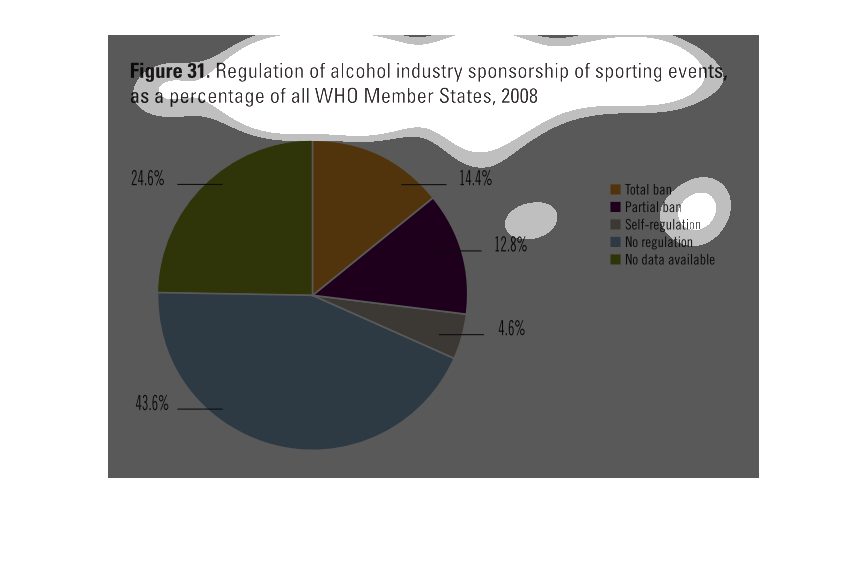
The chart shows the percentages of all WHO Member States and their different degrees of regulation
of alcohol sponsorship in sporting events. Almost half of the WHO Member States are either
self-regulated or not regulated at all. Only a quarter have bans, while the last quarter have
no data available.
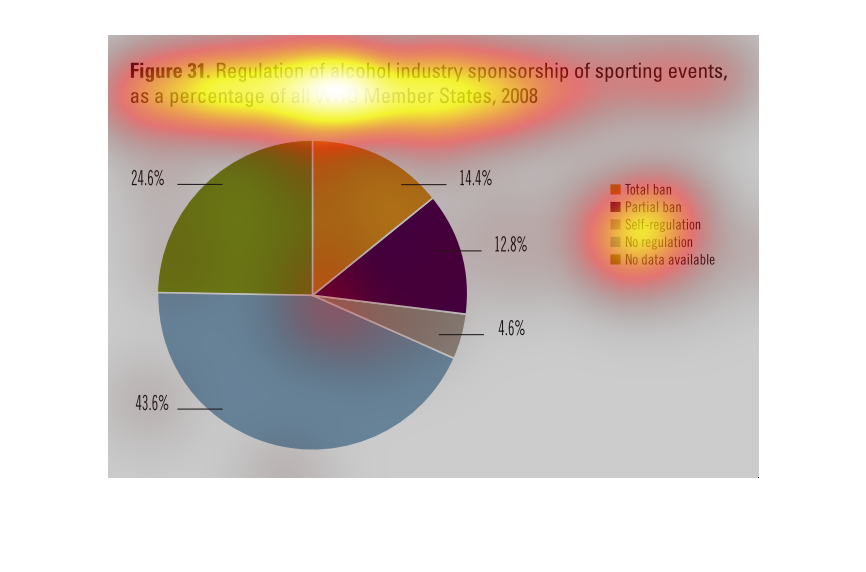
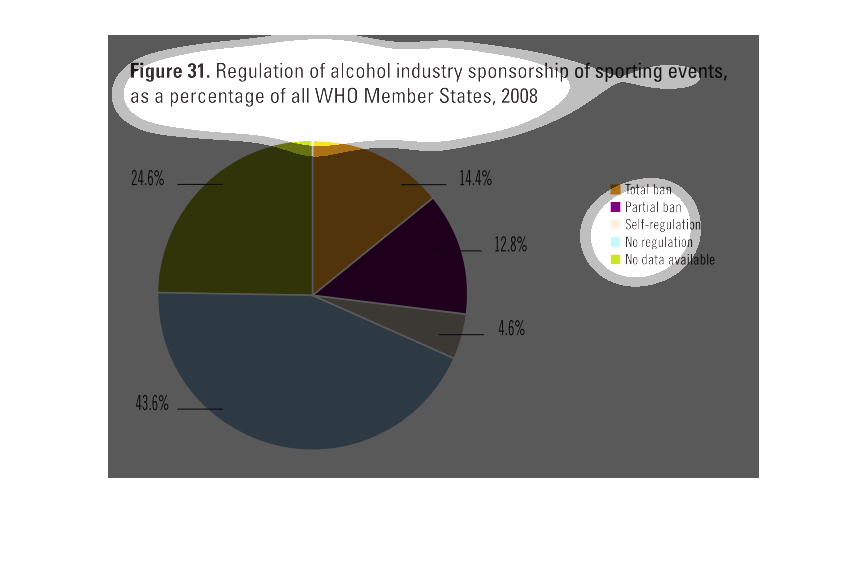
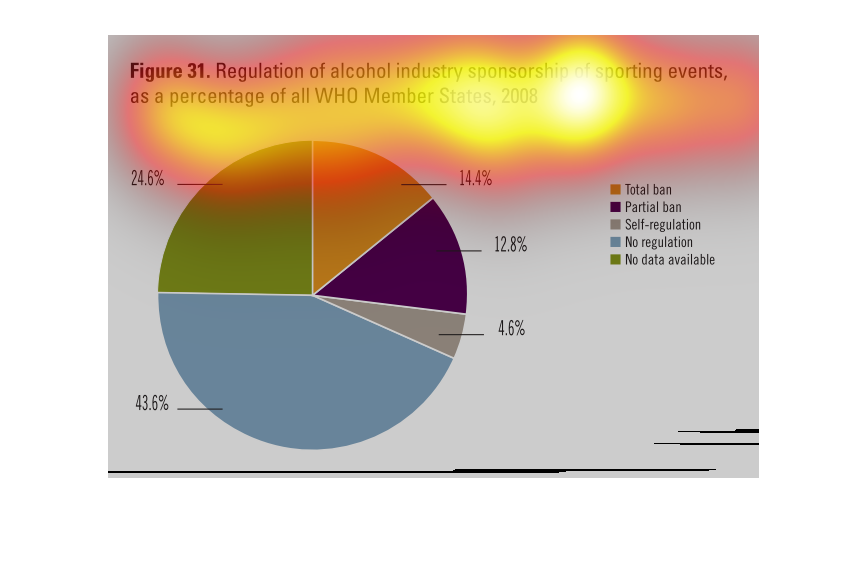
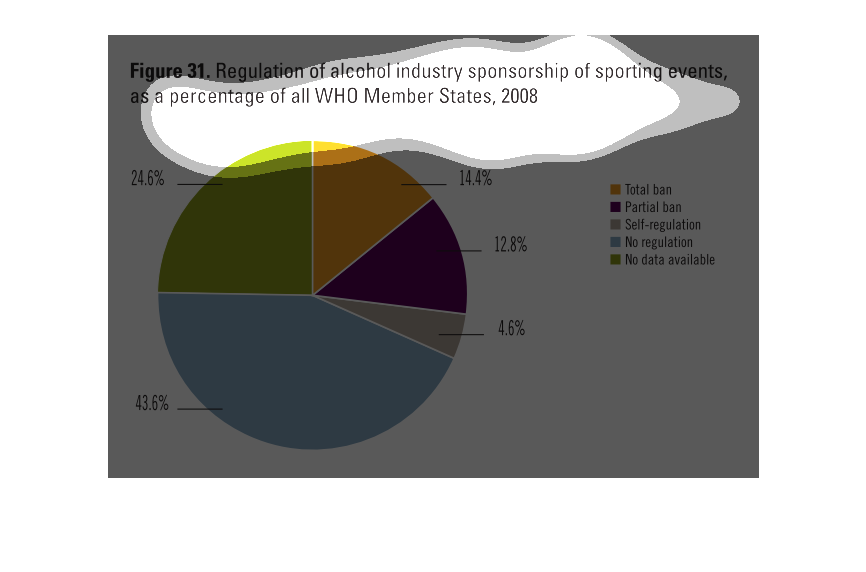
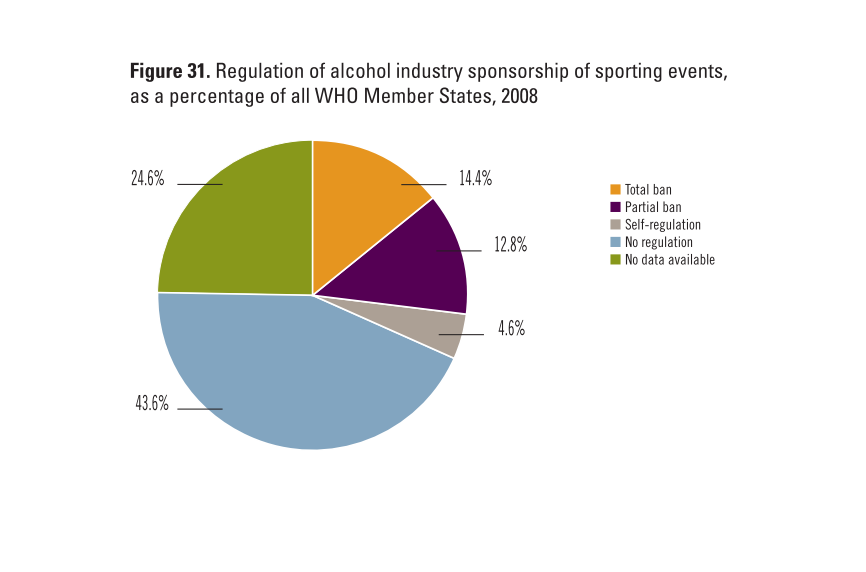
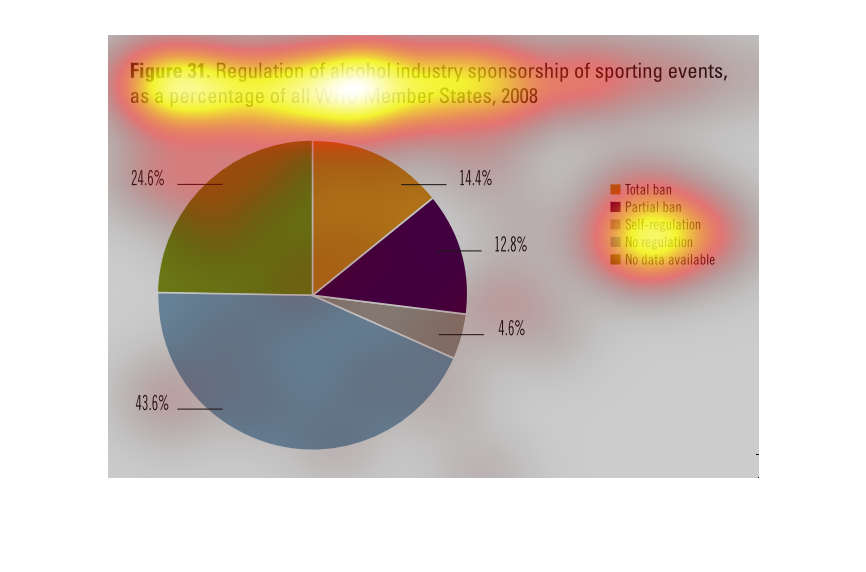
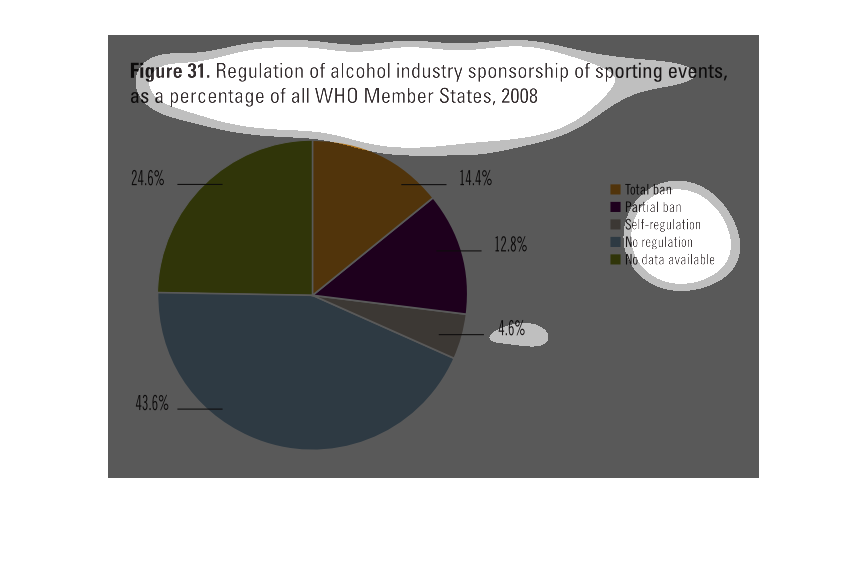
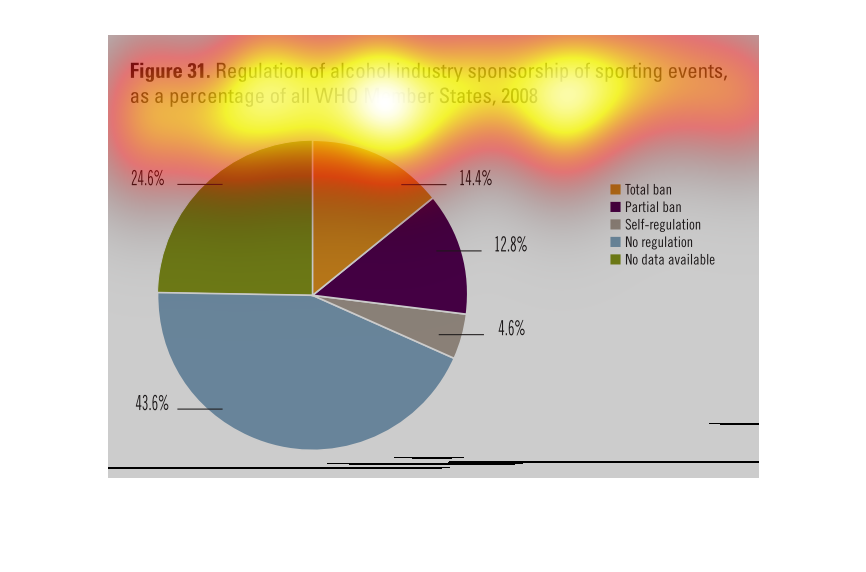
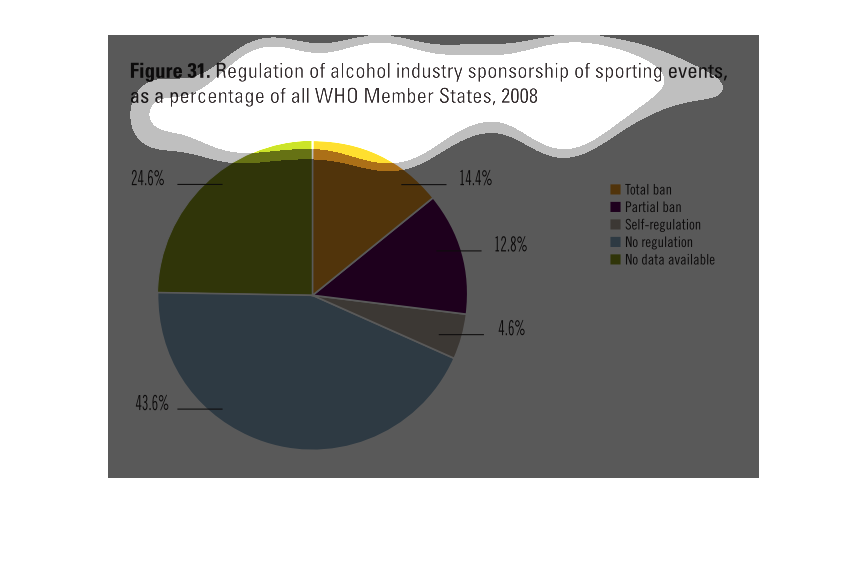
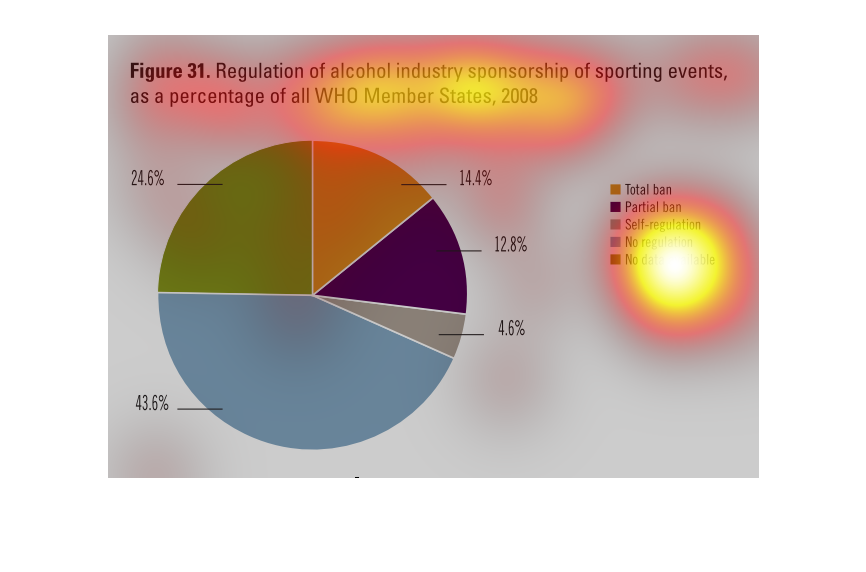
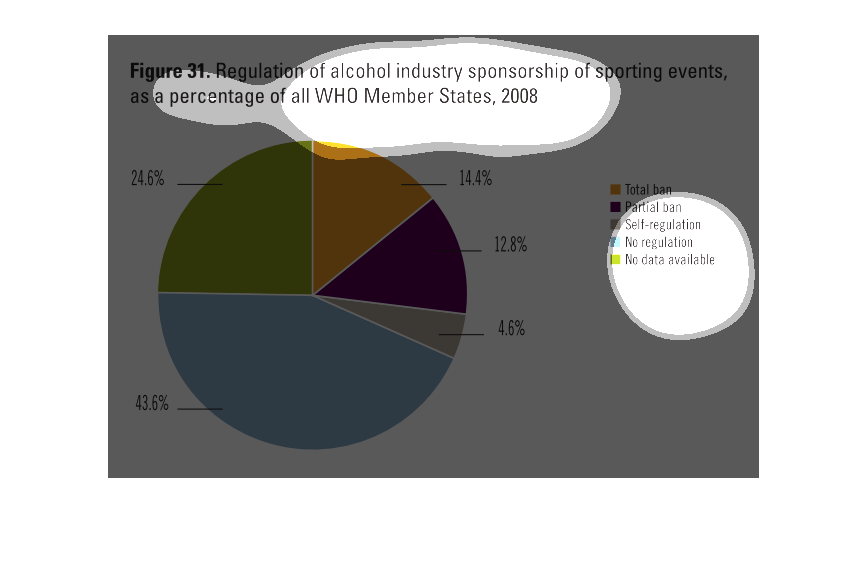
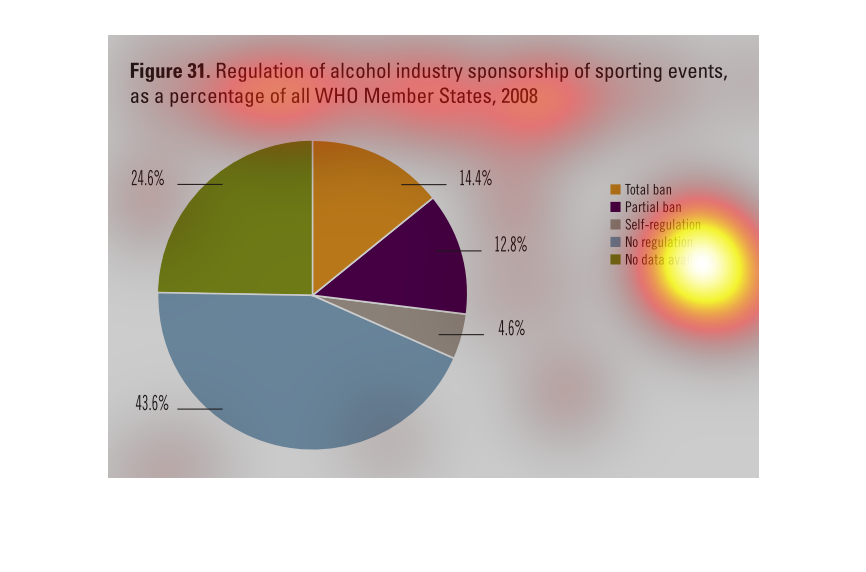
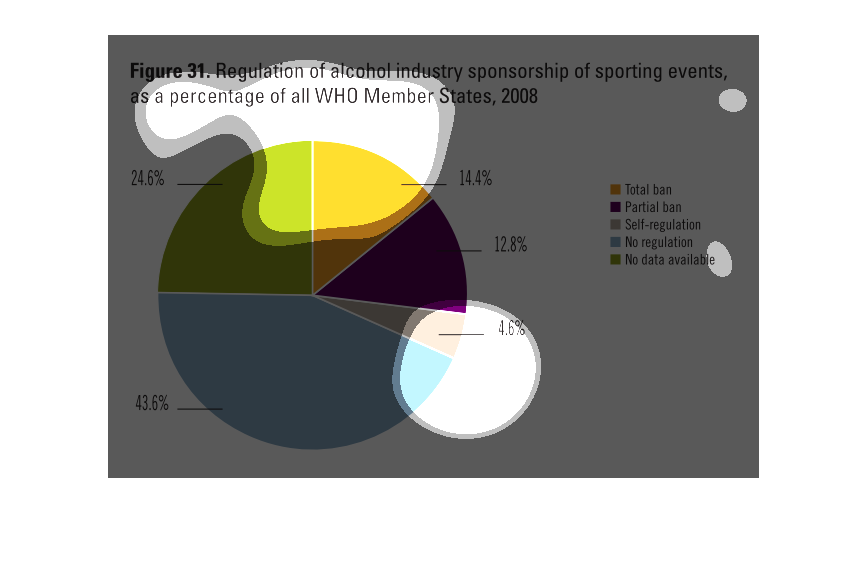
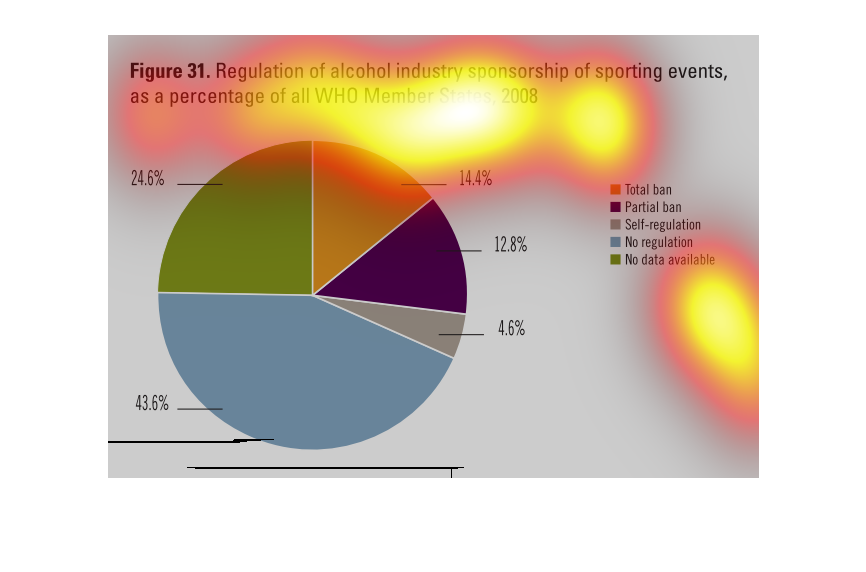
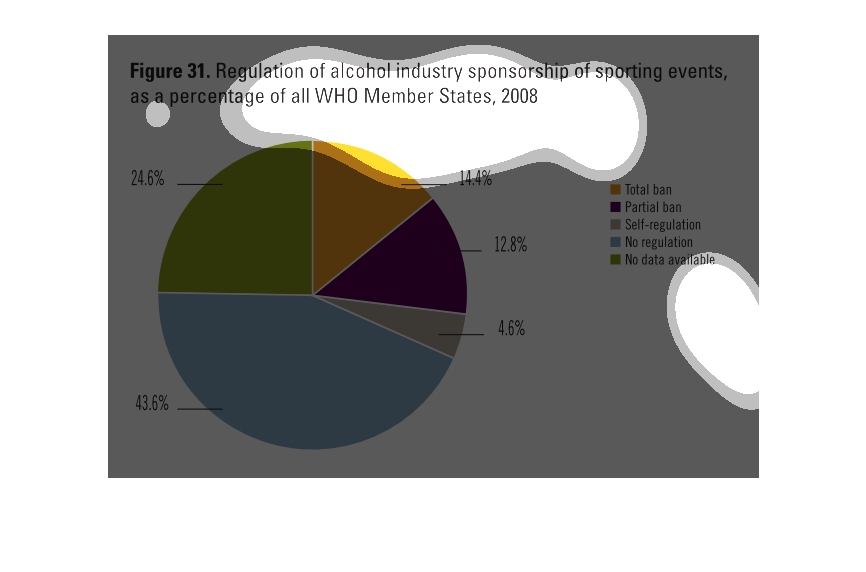
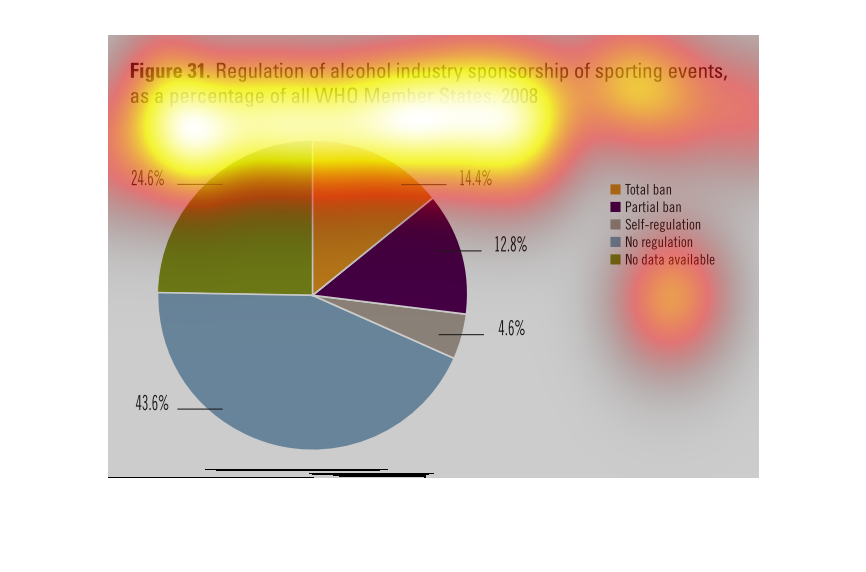
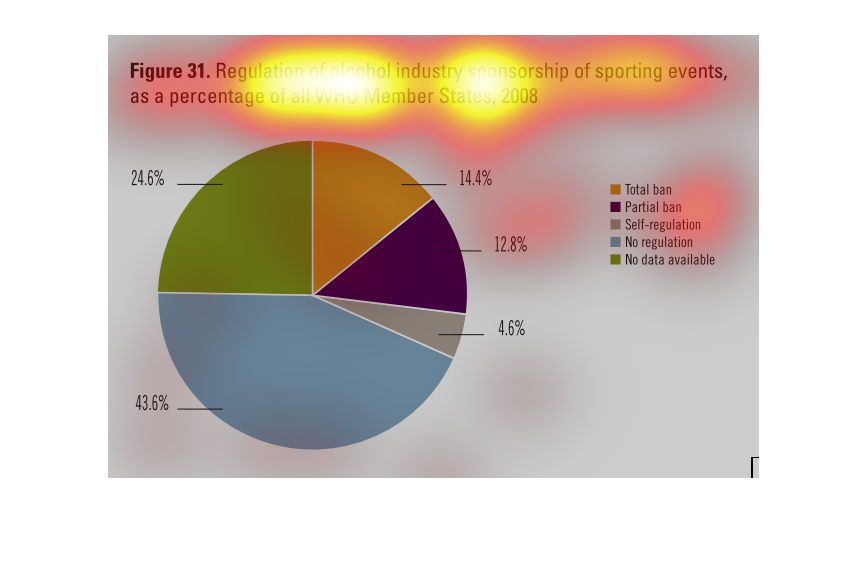
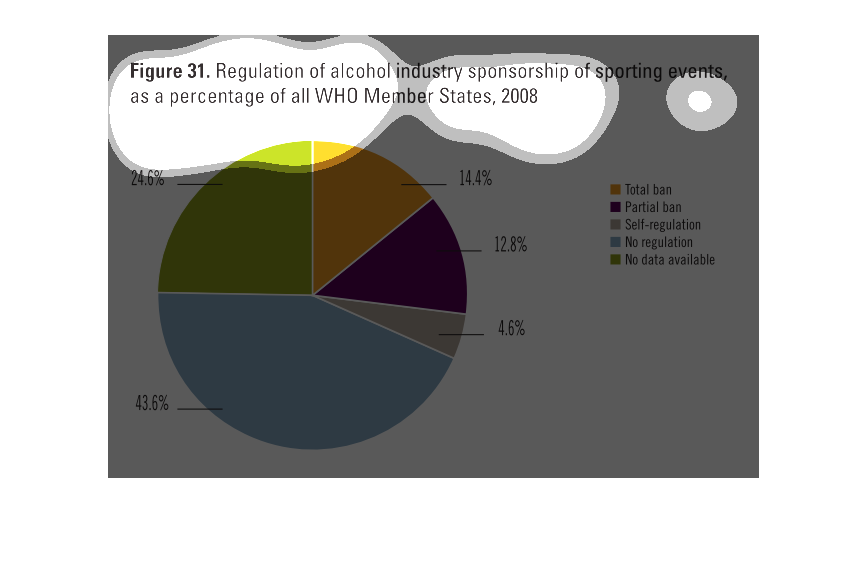
This pie chart shows regulation of the alcohol industry sponsorship of sporting events as
a percentage of all WHO member states.  A quarter of states have no data available, 43.6%
of states have no regulation, 12.8% of states have partial regulation, 14.4% of states have
a total ban, and about 5% of states have self-regulation.
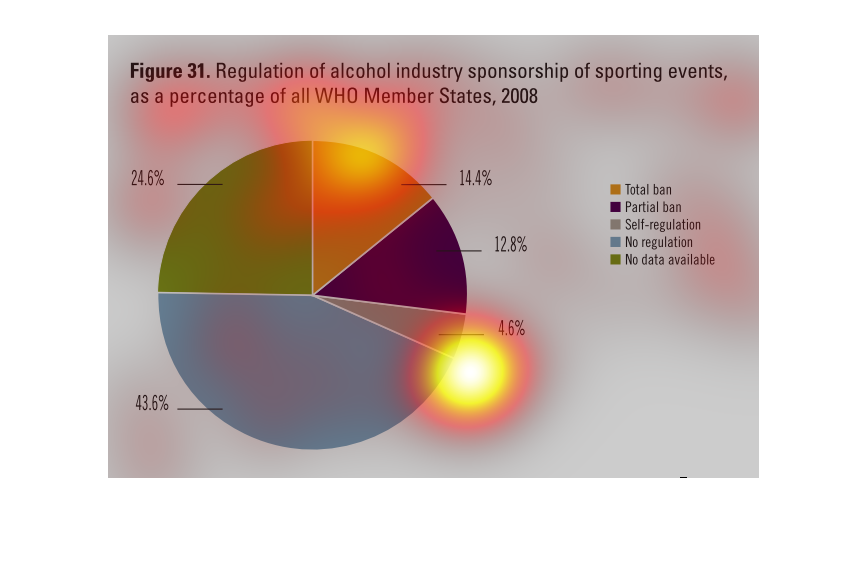
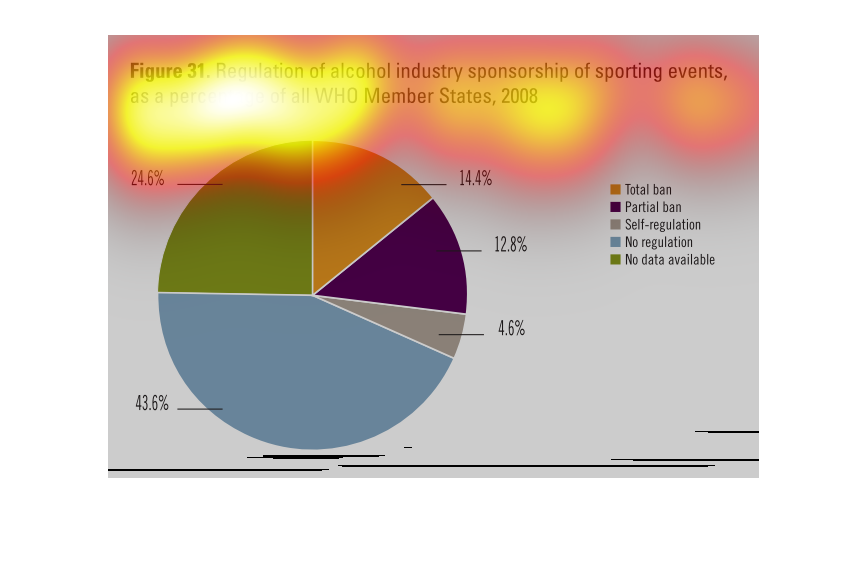
The pie chart shows the percentage of nation-states in the WHO that have regulations on alcohol
sponsorship at sporting events. The majority of states have no regulation with a little more
that one quarter having a partial ban or total ban.
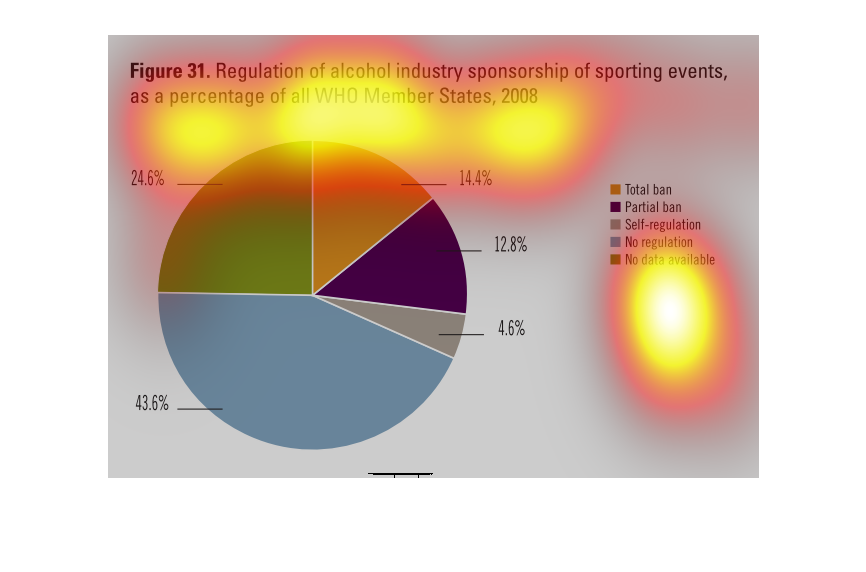
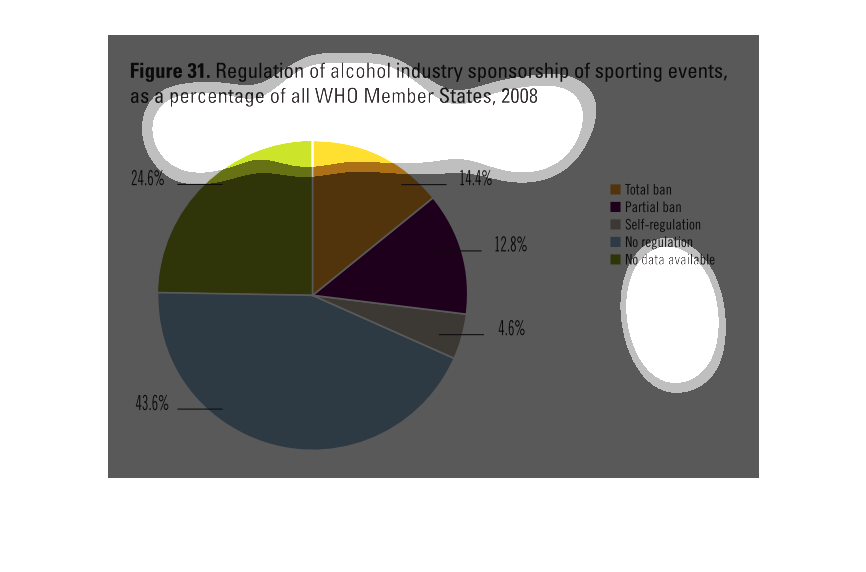
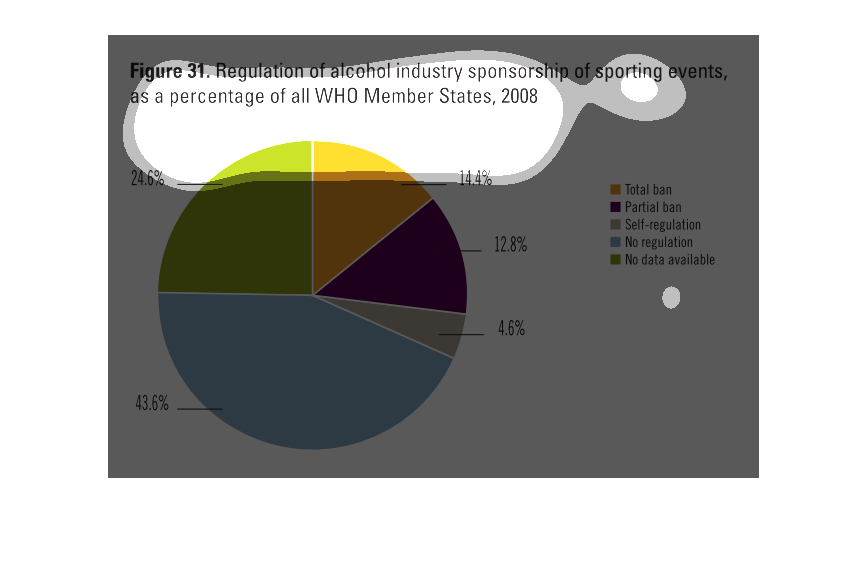
figure 31, a pie chart. Regulation of alcohol in industry sponsorship of sporting events,
as a percentage of all WHO member states, 2008. 14.4% total ban, 12.8% partial ban, 43.6%
no regulation, 4.6% self regulation. 24.6% no data.
Inebriated fans are exited fans who cheer their home team and make the atmosphere more electric;
but they are also dangerous. This illustrations shows the steps some sports leagues have taken
to curb alcohol in their arenas and stadiums.
This pie chart illustrates regulation of the alcohol industry for those countries with WHO
membership in 2008 with categories of total ban, partial ban, self-regulated, no regulation,
and no data available.
This chart describes regulation of alcohol industry sponsorship of sporting events, as a percentage
of all WHO member states, for the year 2008. Categories include partial ban.
This chart describes how many sporting events are sponsored by alcoholic beverages. The pie
chart describes the different levels, like total ban, across the different colors.
The figure presented is titled regulation of alcohol industry sponsorship of sporting events,
as a percentage of all WHO Member States, 2008.  It is a pie chart.
This chart describes that regulation of alcohol industry sponsorship of sporting events, as
a percentage of all the WHO member states, for the year 2008.