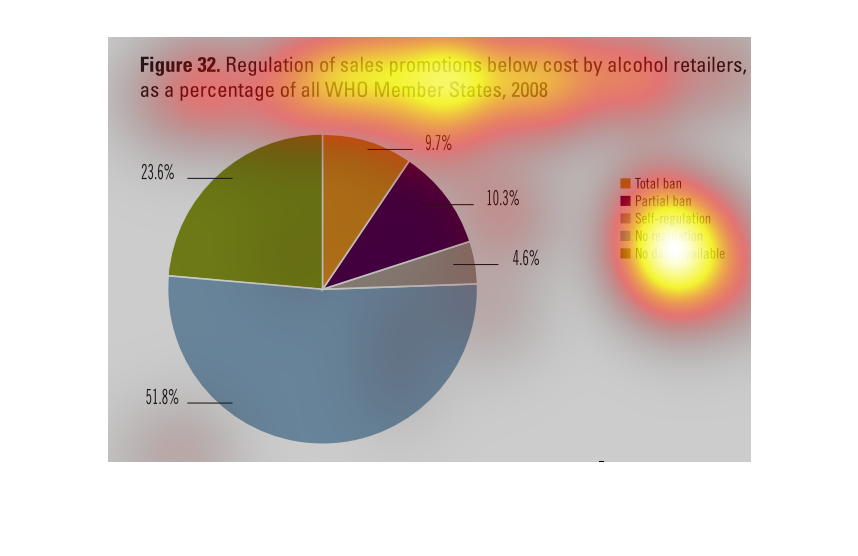
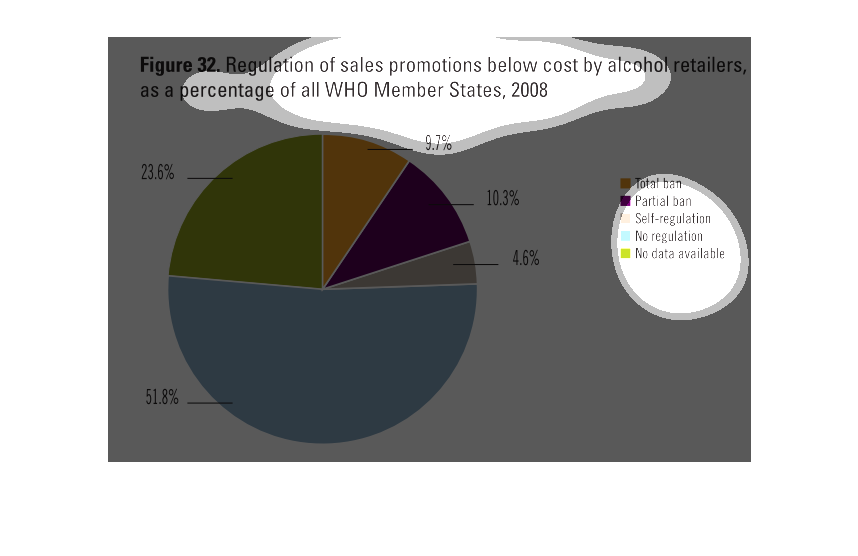
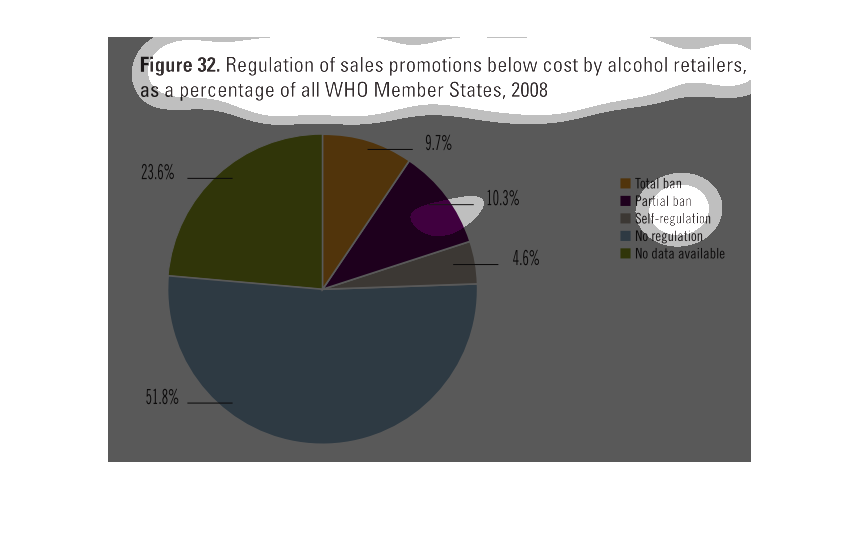
This is a pie chart depicting regulation of sales promotions below cost by alcohol retailers
as a percentage of all WHO member member states in the year 2008.
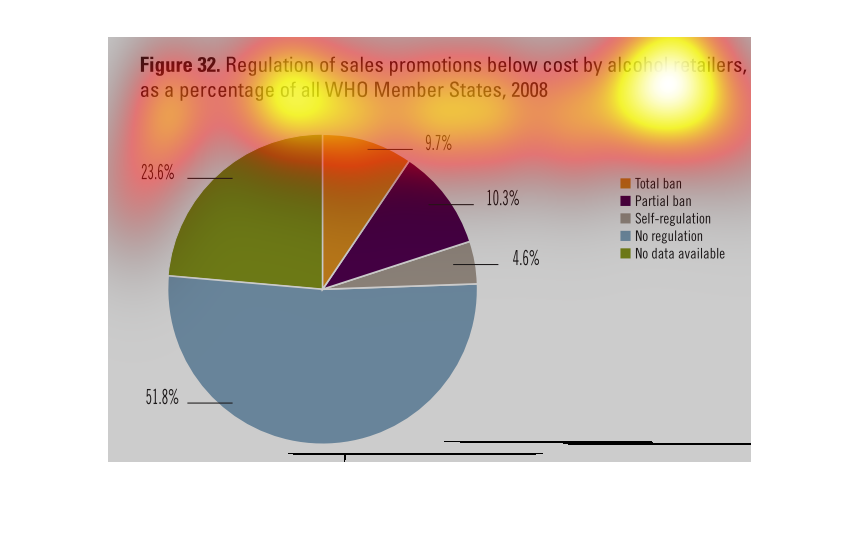

This image shows that a majority of retailers have no regulations on the promotion of alcohol.
 As the level of regulation rises there is a smaller and smaller percentage of retailers affected
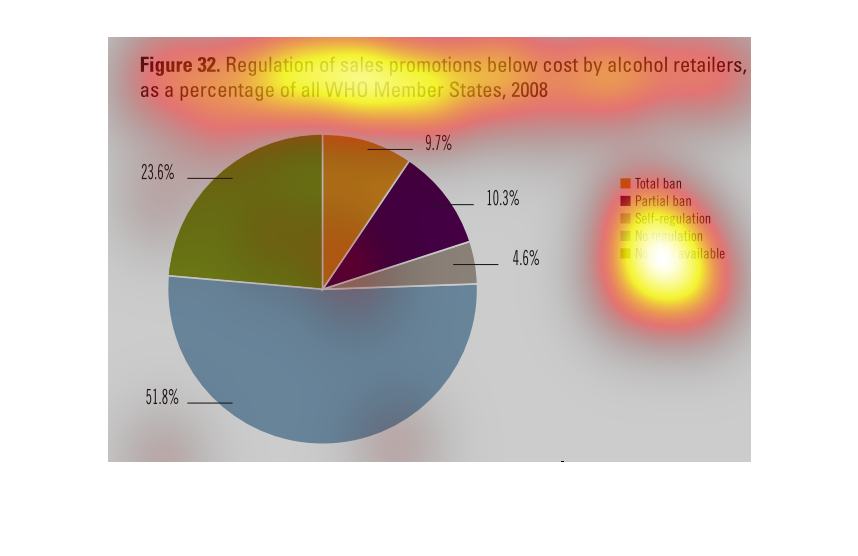
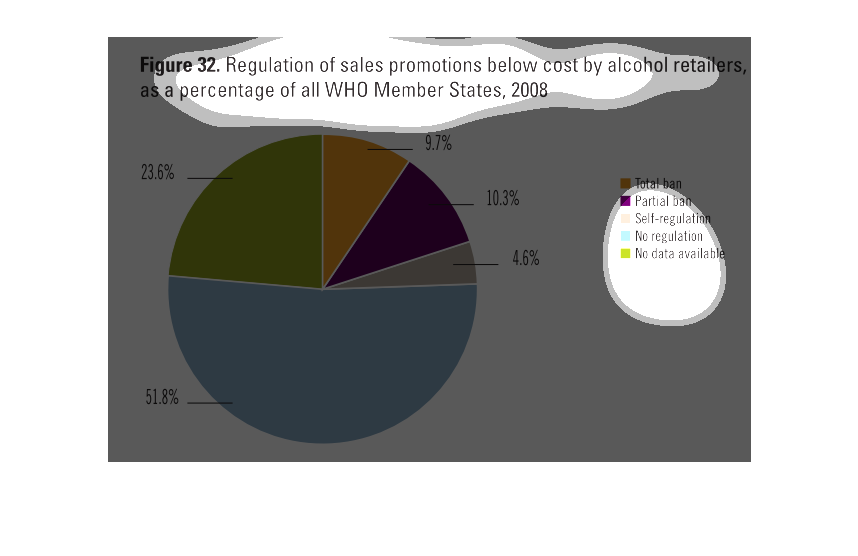
This chart/graph shows the regulation of sales promotions below average cost by alcohol retailers
of all WHO members. The biggest part of the pie graph is no regulation.

 This is the relationship  between retailers and how much ban they have  on products there
is a pie chart with  percentages  I can't click on the title or I would get more information
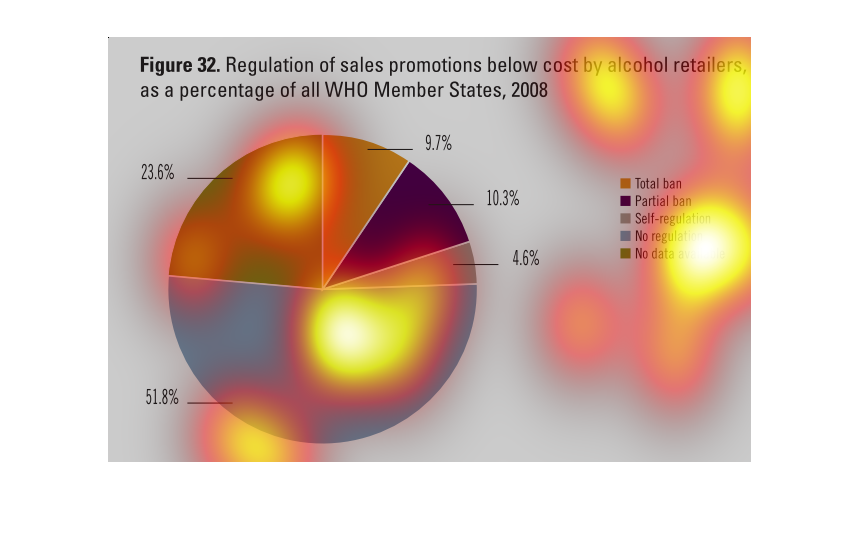
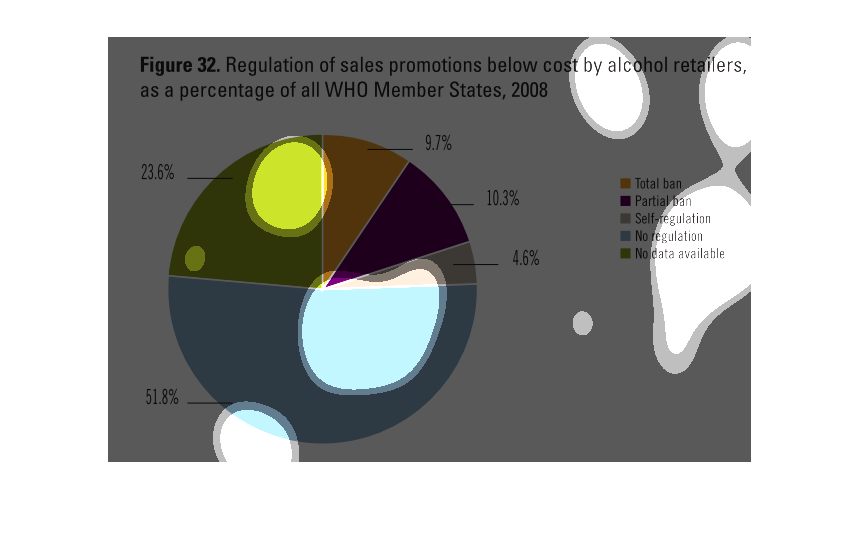
This pie chart shows the regulation of sales promotions below cost by alcohol retailers, as
a percentage of all WHO member states in 2008. The highest percentage accounts for no regulation,
which is 51%. The lowest is self regulation at only 4.6%.
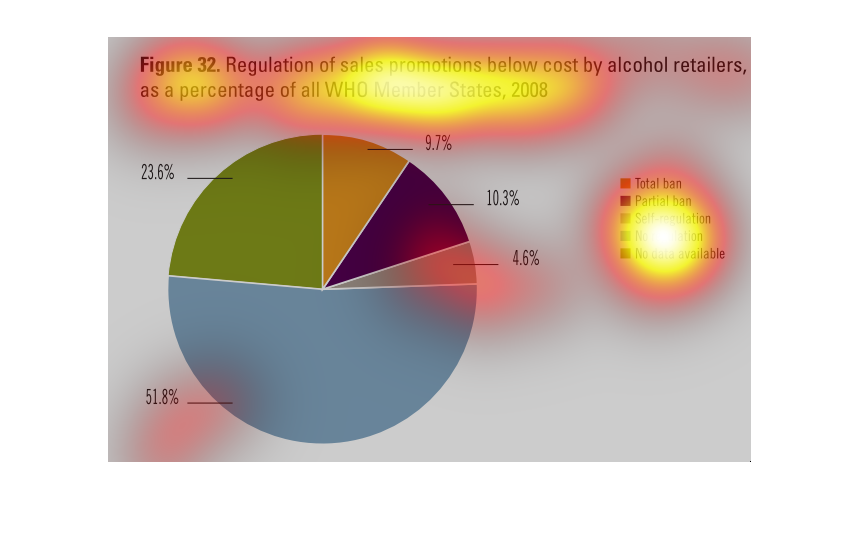
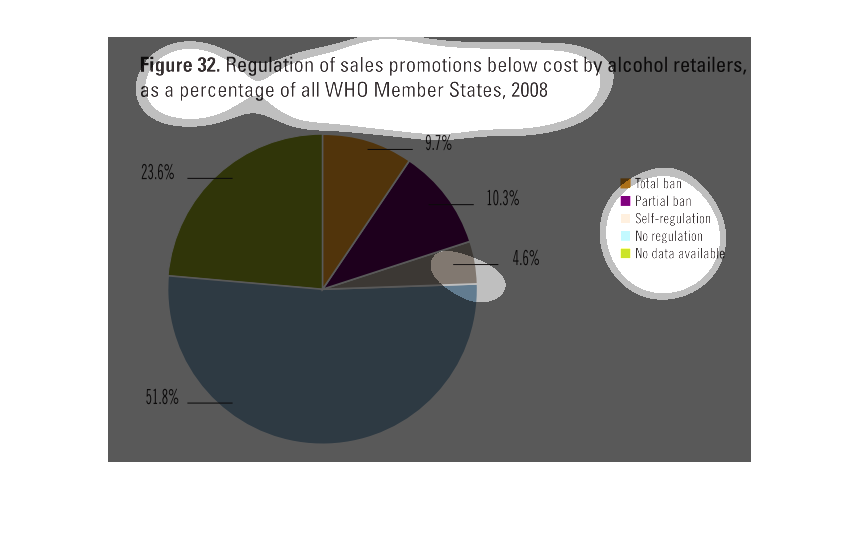
This is a pie chart of the regulation of sales promotion of alcohol in WHO countries in 2008.
Over 50% of the countries have no regulations put in place. About 10% of countries have a
partial ban, and another 10% have a total ban on selling alcohol below cost.
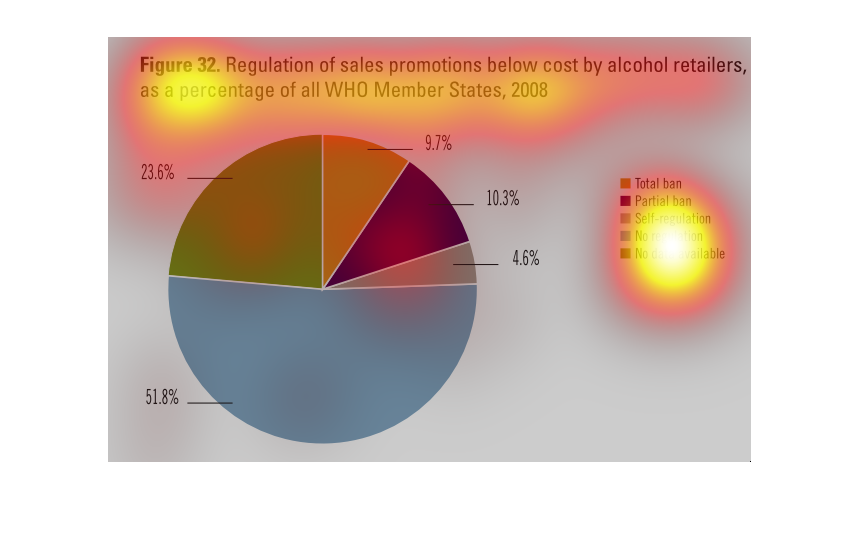
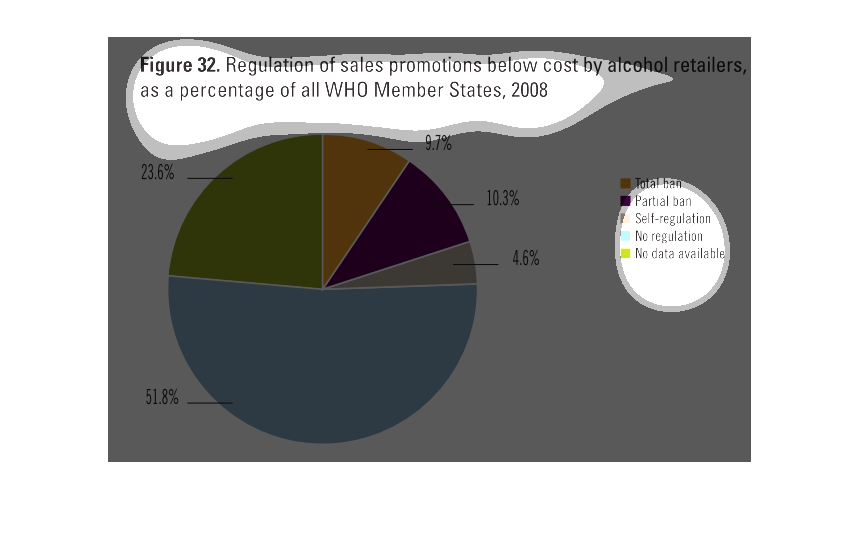
This chart describes regulation of sales promotions below cost by alcohol retailers, as a
percentage of all WHO member states, for the year 2008. Categories re represented by different
colors.
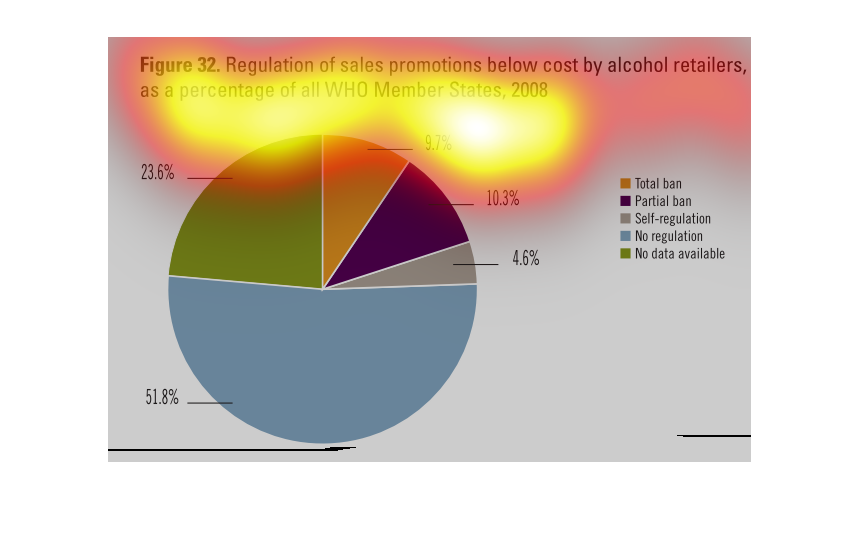
Regulation sales promotions below cost by alcohol of retailer as a percentage of all WHO member
states, 2008. 9.7%=total ban,  10.3%=partial ban, 4.6%=self regulation, 51.8%=no regulation,
23.6%= no data
This chart shows the regulation of sales promotions below cost by alcohol retailers as a percentage
of all WHO Member States, 2008. 9.7% have a total ban on alcohol, 10.3% have a partial ban,
4.6% have self-regulation, and 51.8% have no regulation. There is no data for 23.6%.
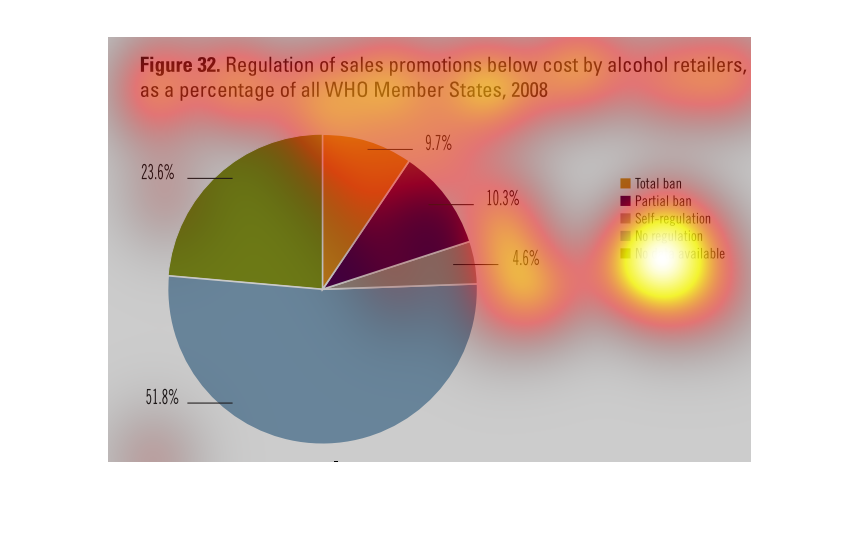
this circle graph deals with sale promotions below cost by alchohol retailers  as a percentage
of all WHO member States, 2008  Colors represent partial ban, self regulated, no regulation
, no data, and total ban
The figure presented is titled: Figure 32: regulation of sales promotions below cost by alcohol
retailers, as a percentage of all WHO member states, 2008.
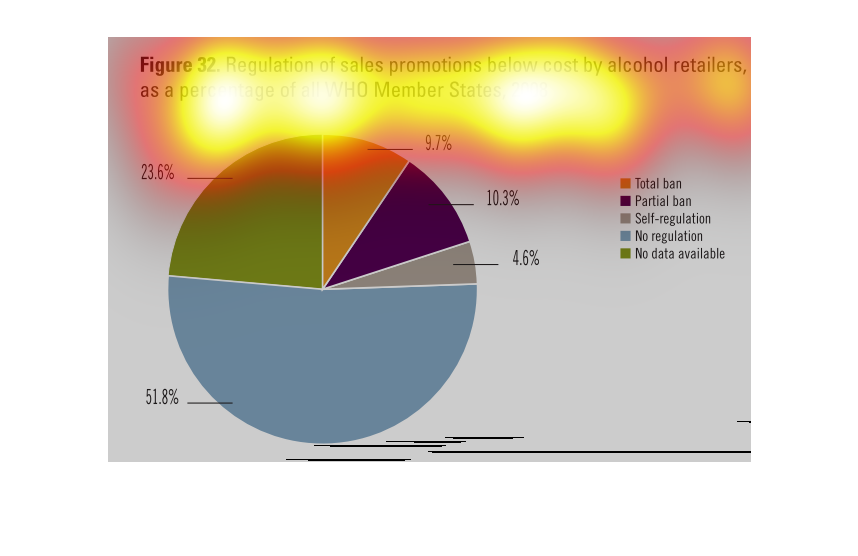
Figure 32 shows regulations of sales promotions below cost by alcohol retailers as a percentage
of all WHO member states, 2008. The largest percentage have no regulation. The smallest have
self regulation.
The image depicts a pie chart of regulation of sales promotions below cost by alcohol retailers,
as a percentage of all WHO member states, 2008. No regulation encompasses over 50% of the
pie chart, with no data available consumption almost 25%, with total ban at 9.7%, partial
ban at 10.3%, with self regulation at 4.6%.
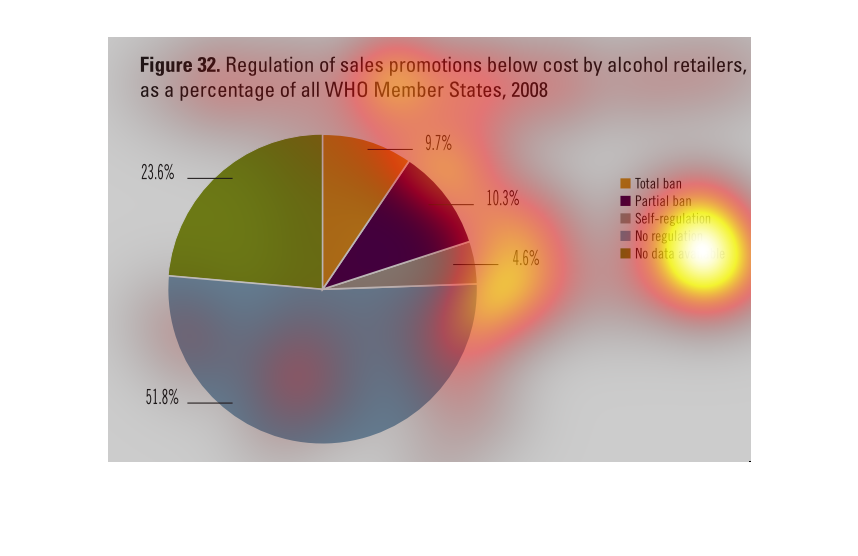
This chart describes regulation of sales promotions below cost by alcohol retailers, as a
percentage of all WHO member states for the year 2008. Categories are represented by different
colors.
The majority of WHO member states (51%) have no regulation of sales promotions below cost
by alcohol retailers.  Only 20% of these states have in place a full- or partial-ban on such
practices.