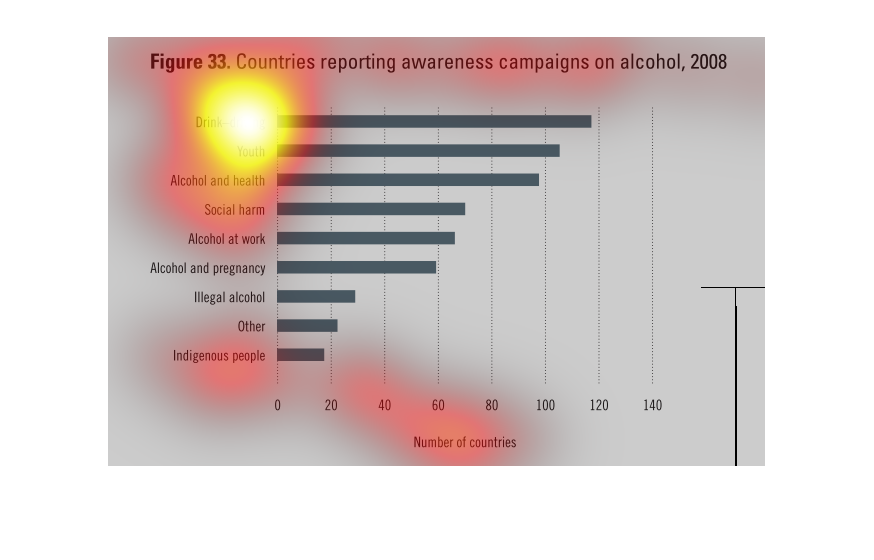
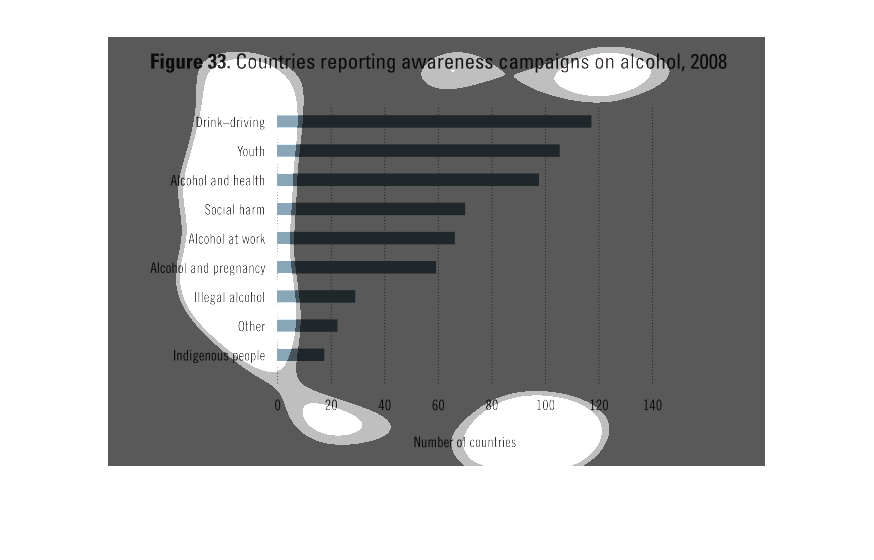
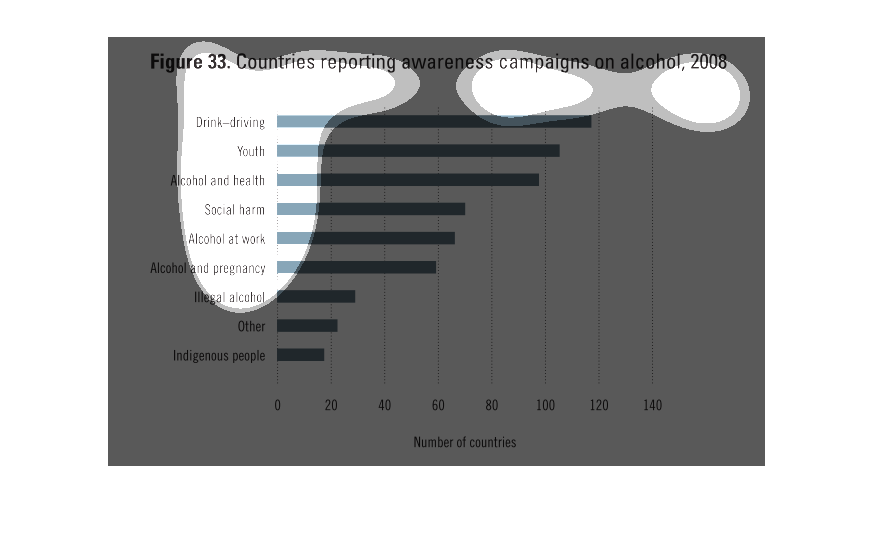
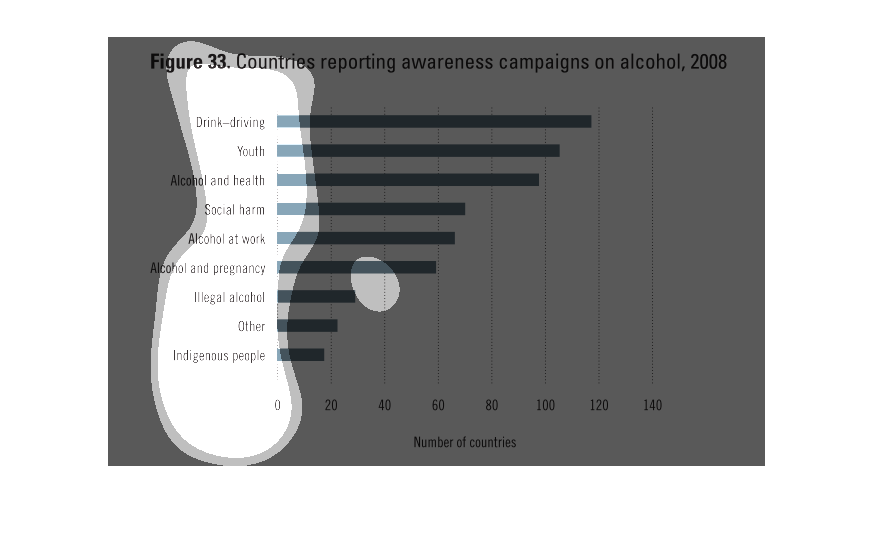
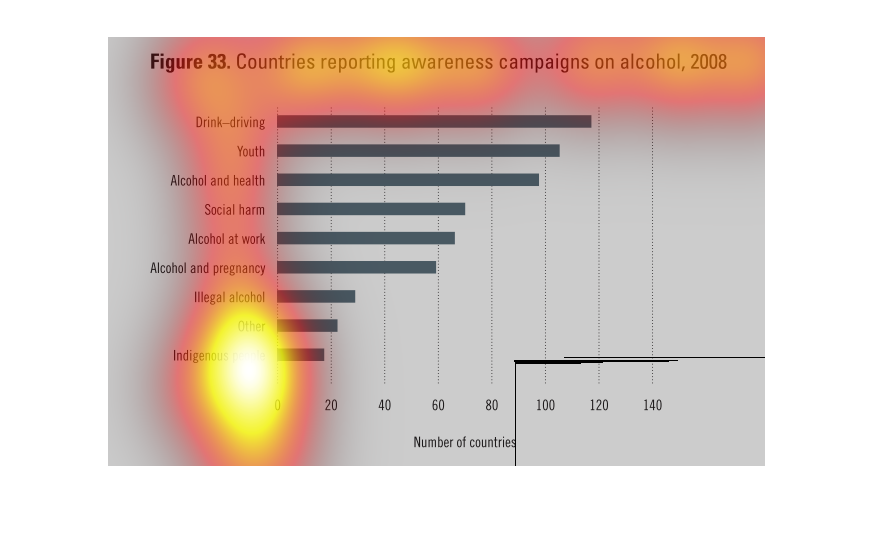
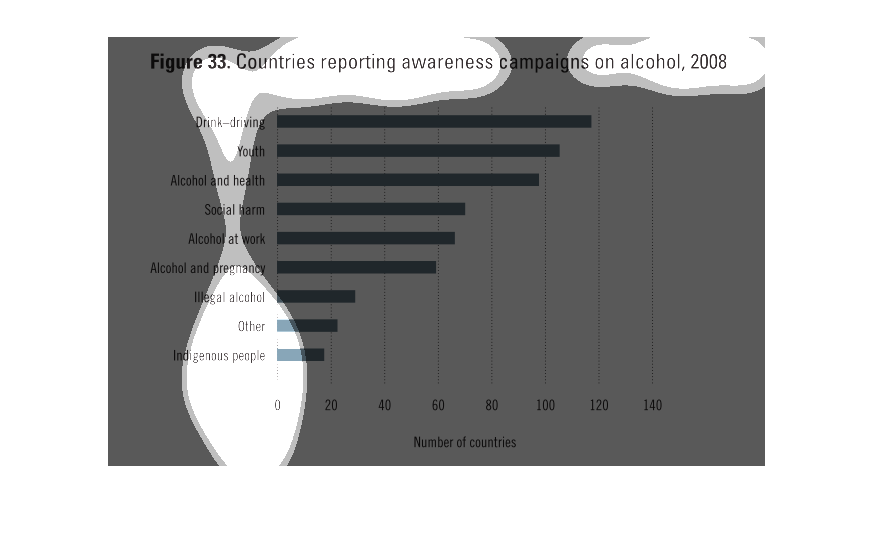
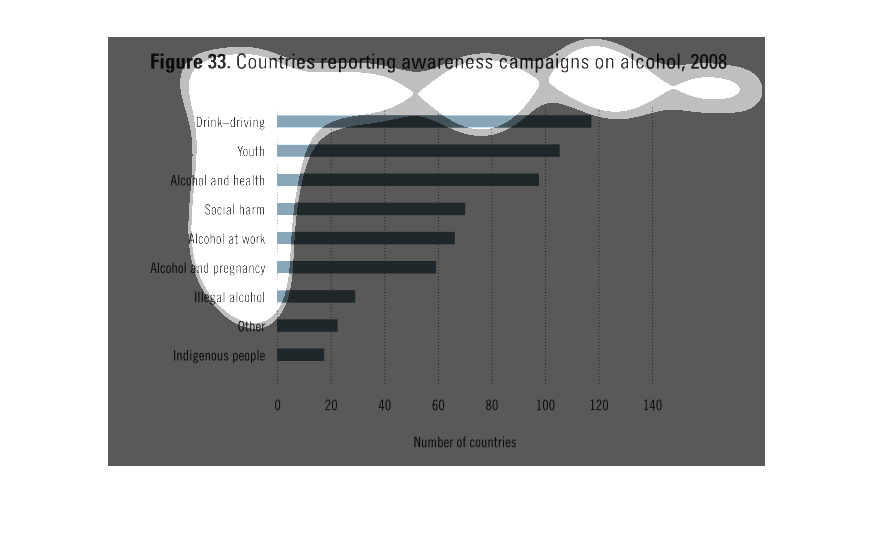
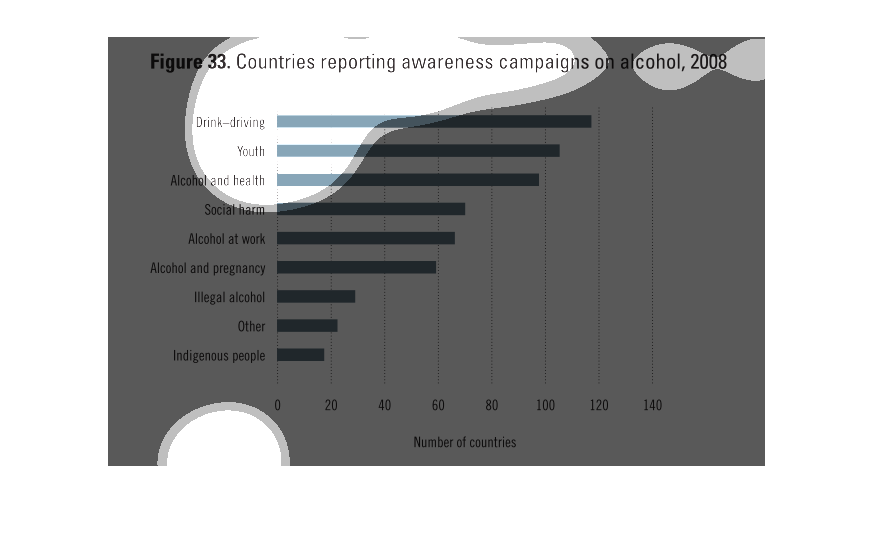
The figure presented is titled figure 33 Countries reporting awareness campaigns on alcohol,
2008.  The figure is a representation of alcohol campaigns.
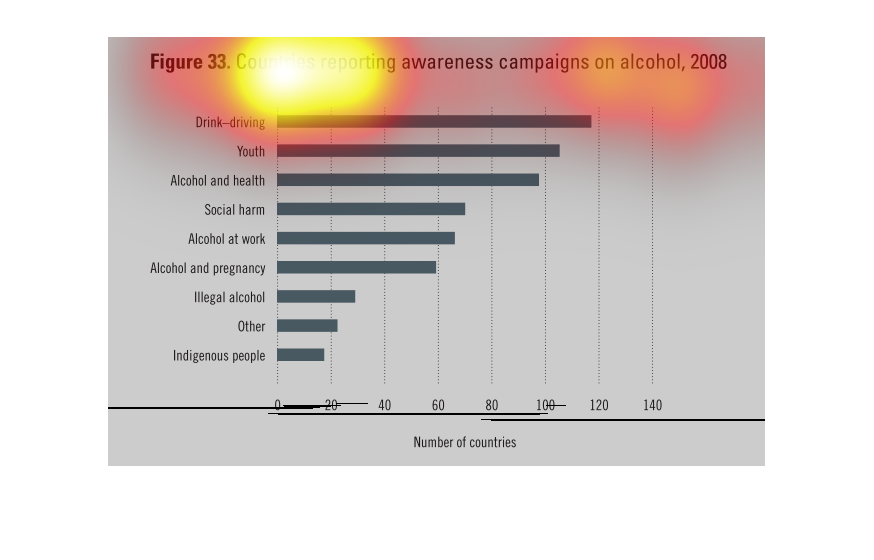
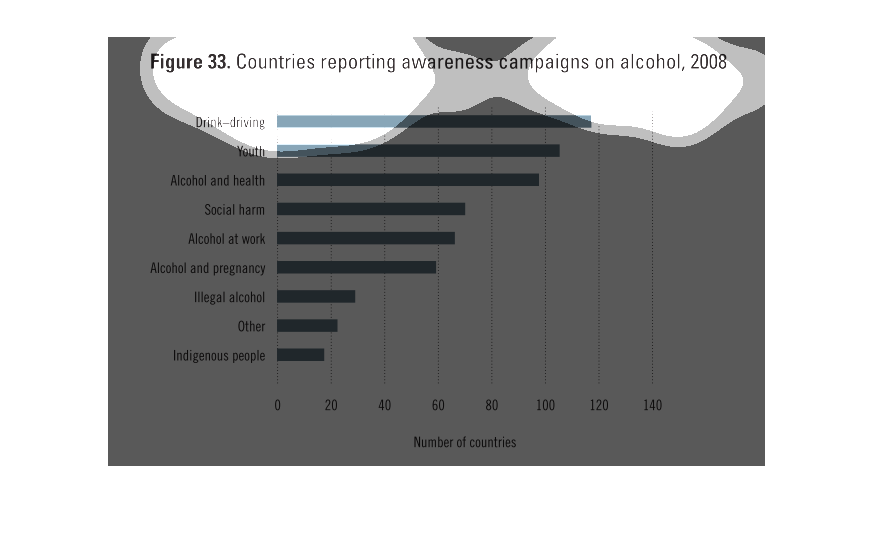
figure 33 countries reporting awareness campaigns on alcohol, 2008. Y axis is different types
of campaigns such as drunk driving, youth, health, social harm, pregnancy, work, etc. X axis
is the number of countries
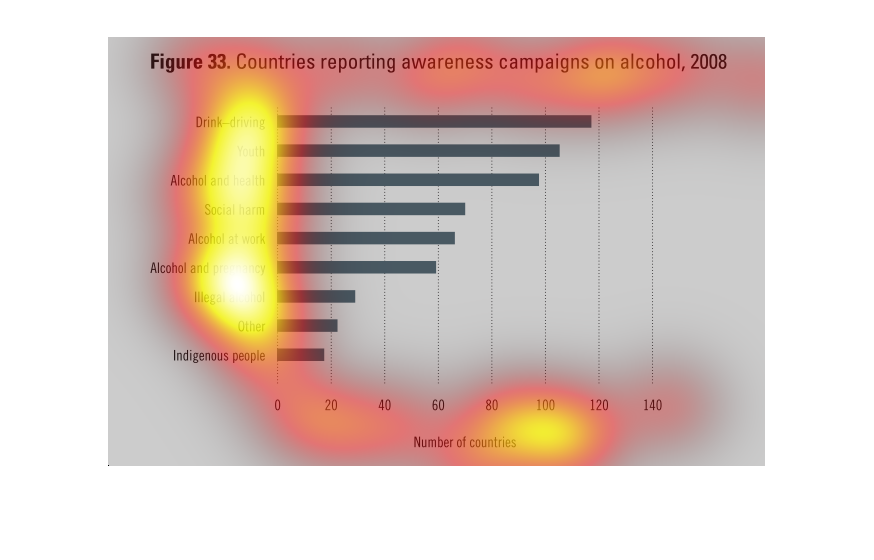
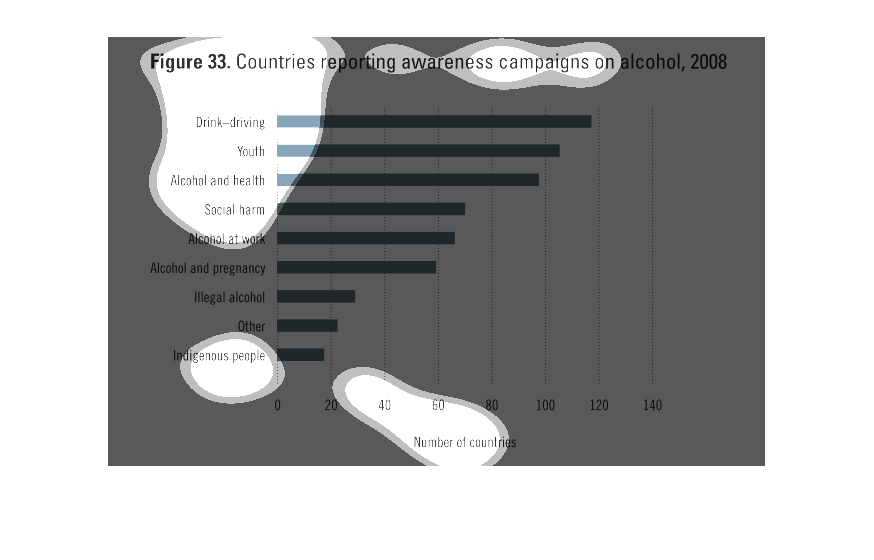
These horizontal bar charts from 2008 show the countries promoting awareness of alcohol and
related issues. The categories are different avenues and targets, and the horizontal axis
is number of countries.
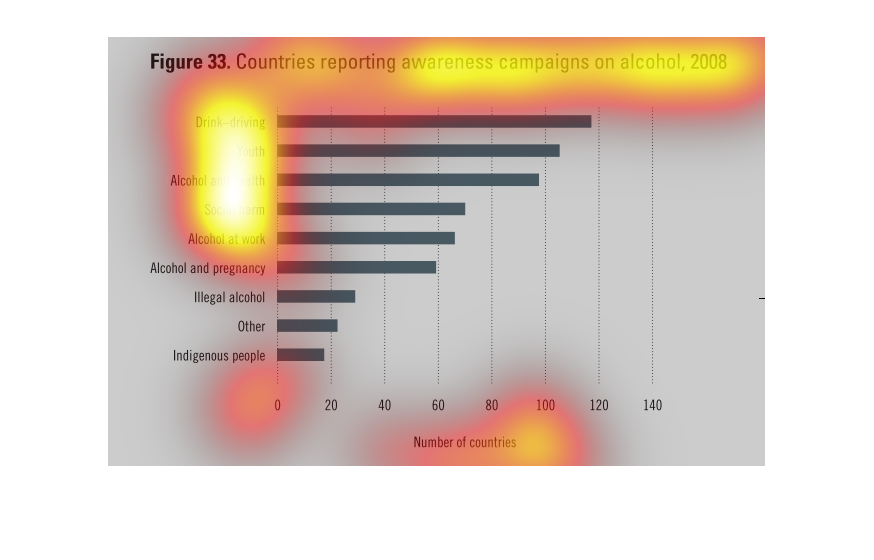
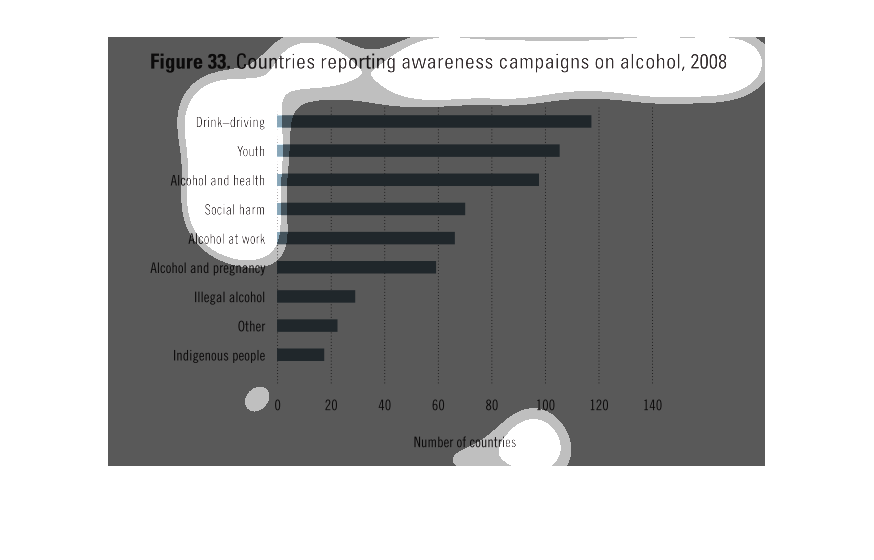
This chart describes countries reporting awareness campaigns on alcohol, for the year 2008.
Different categories on the chart include youth and drink-driving.
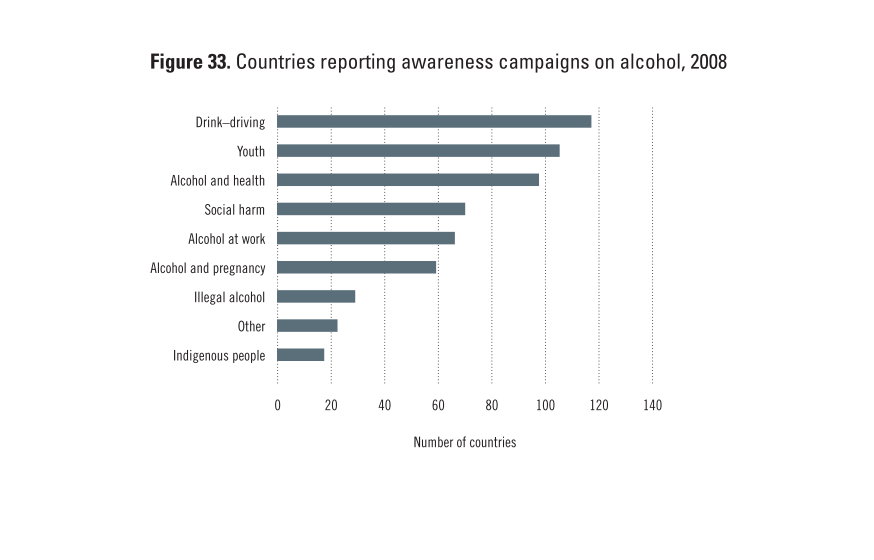
An infographic showing countries that have an awareness campaign on dangers of alcohol abuse
from 2008. Shows highest amount goes to drinking and driving
This graph illustrates the efforts of some countries to really educate their populace on the
effects of Alcohol, and how they view the damages it causes to society.
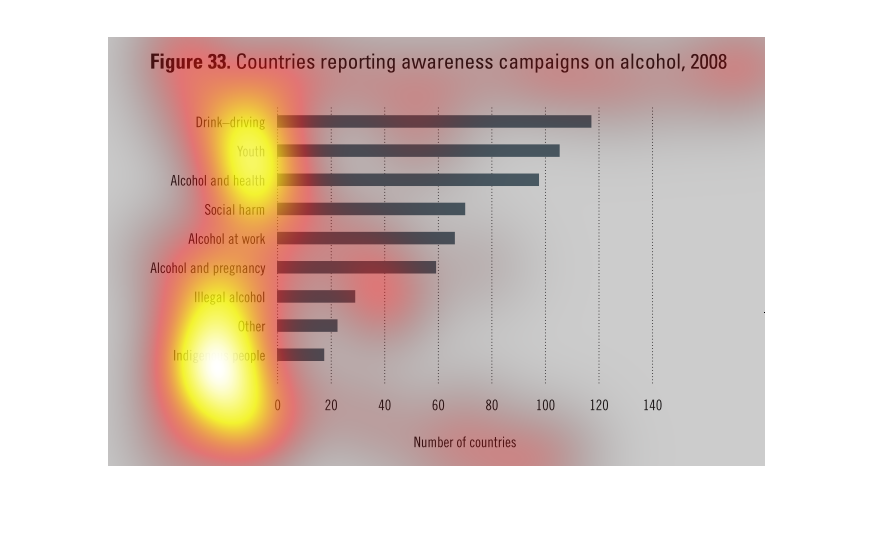
This is a graph that shows countries reporting an awareness campaign with respect to alcohol
consumption for the year 2008. it shows the various alcohol related problems faced by these
countries.
This is a graph of countries who reported their awareness of campaigns on alcohol in 2008.
The x-axis is the number of countries and the y-axis is the campaign type.
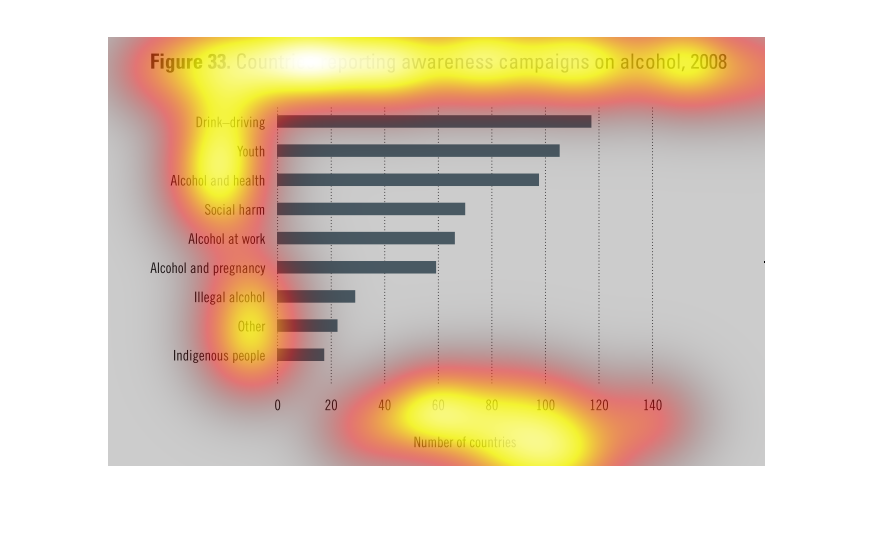
This chart describes countries reporting awareness campaigns on alcohol, for the year 2008.
Categories on the chart include drink-driving, youth, and social harm.
the name of this graph is called countries reporting awareness and campaigns. on alcohol.
the most votes went to drunck driving abd the one with less votes is indigenius people.
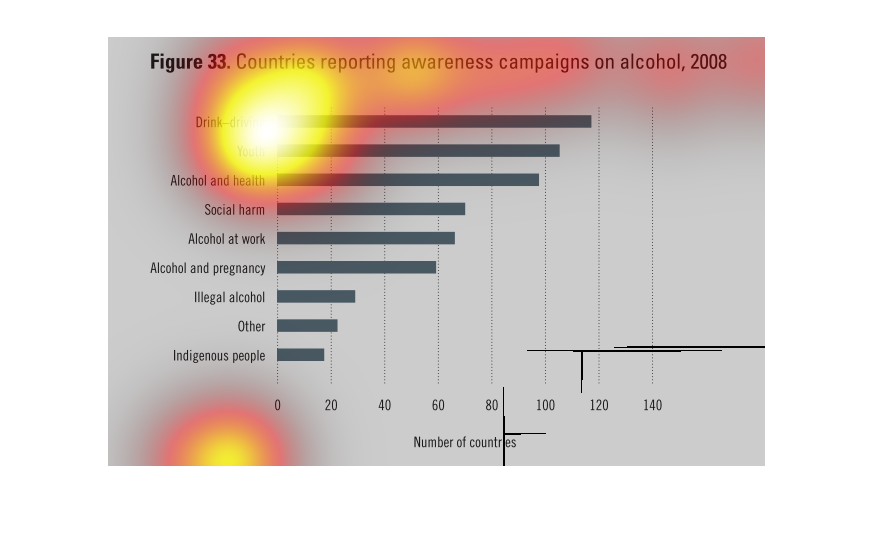
This handmade chart refers to countries that have alcohol awareness programs as of 2008. It
does not specify which countries but does specify which programs
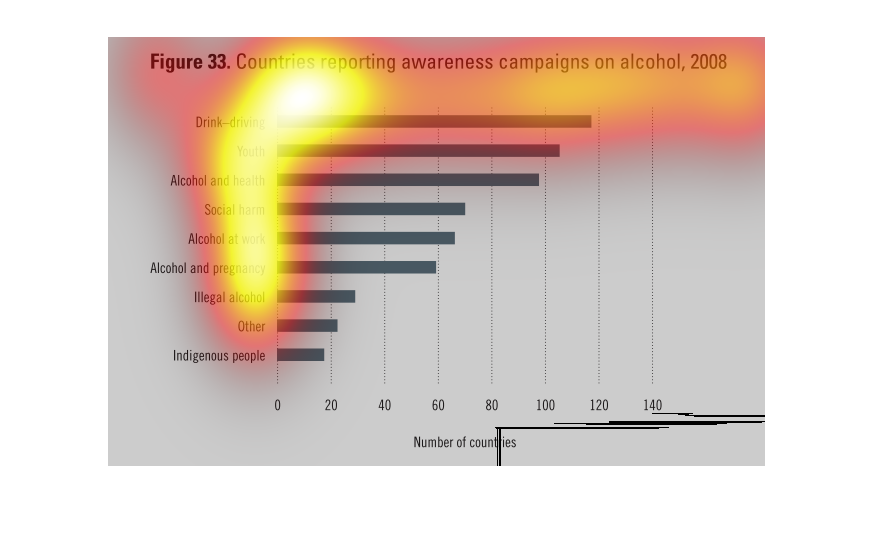
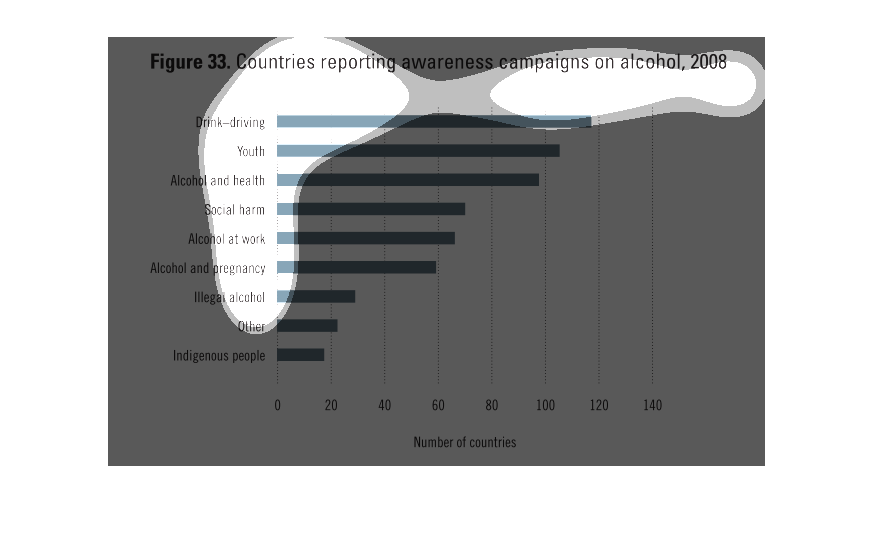
Having a couple of drinks out with the boys might seem like a harmless activity, but what
about when you get behind the well inebriated and cause a collision that killed a family of
four? This graph charts the efforts of countries to make their populace aware of the hidden
pitfalls of consuming alcohol.
The following is a of factors associated with alcohol awareness reported by a designated number
of countries. Drinking and driving is known by the most amount of countries while the indigenous
people seem to be the least knowledgeable of alcohol awareness. This study suggests that these
are the audience that need the most education on alcohol awareness.