This graph illustrates major health risk shifts due to changes in sanitation and drinking
water supply.  It has factors such as overweightness and lack of physical activity to urban
air quality and traffic safety.
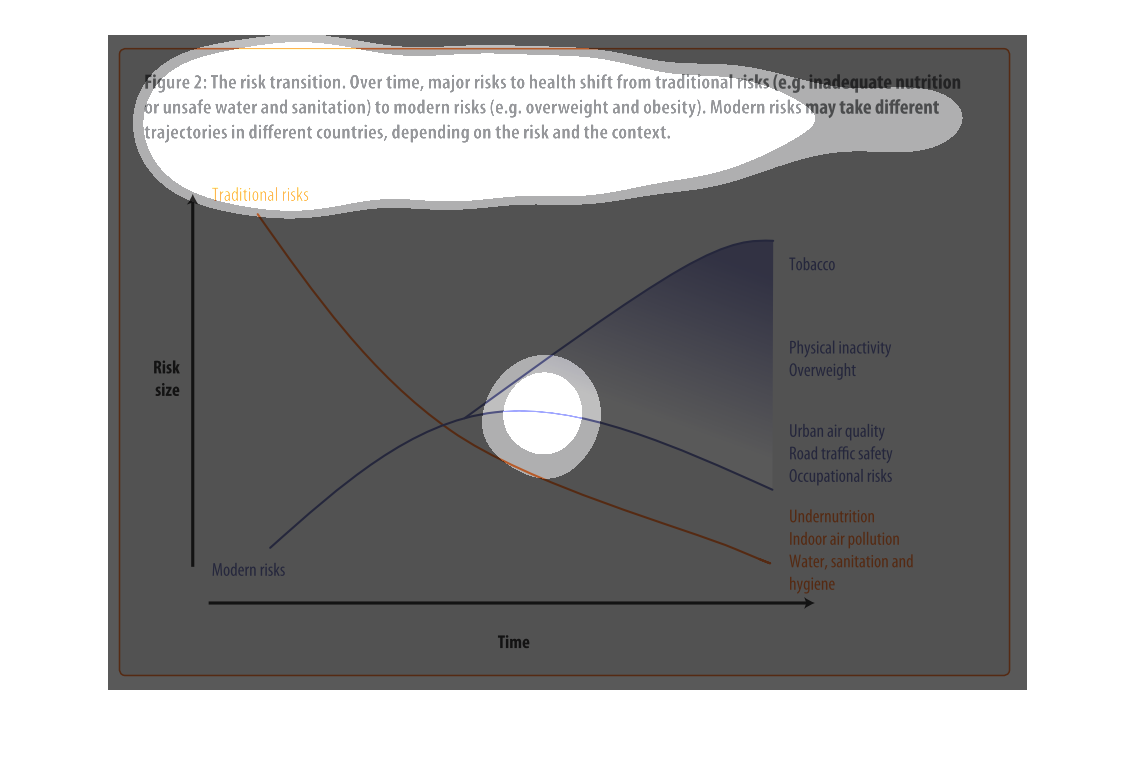
This is a graph with two curves that show the risk transition form drinking contaminated water
to more modern risks such as obesity. This shows the trad-off where this transition begins
to take place.
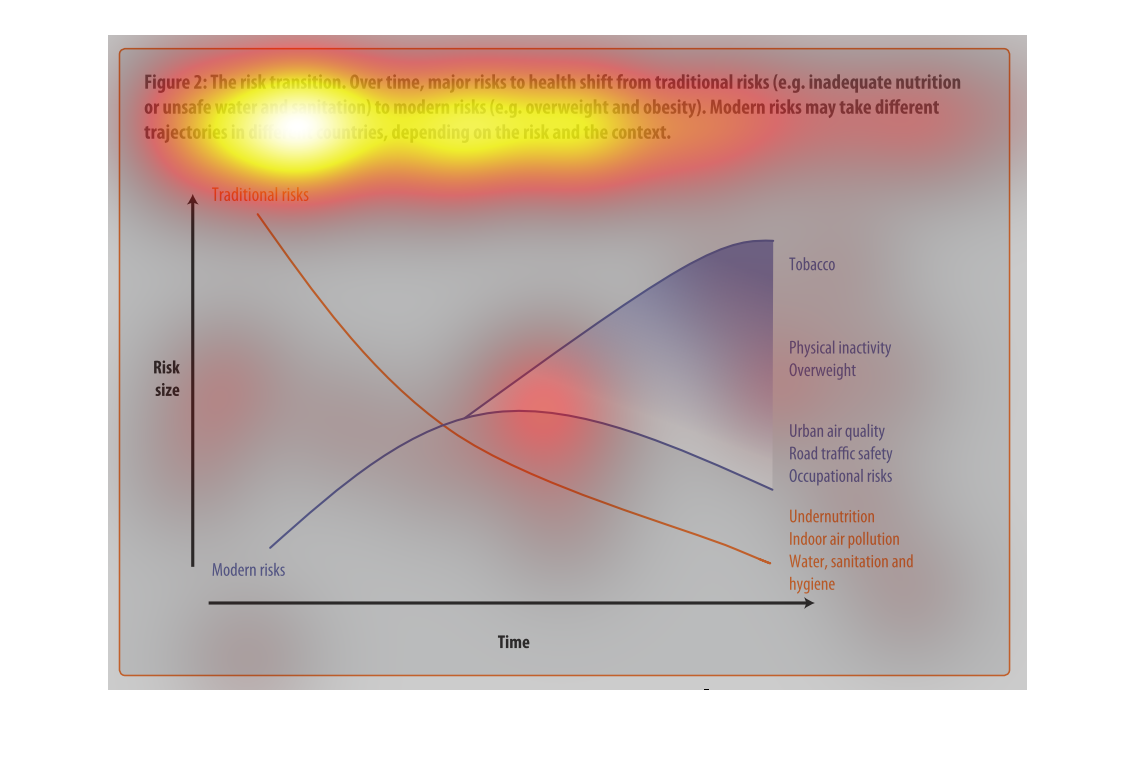
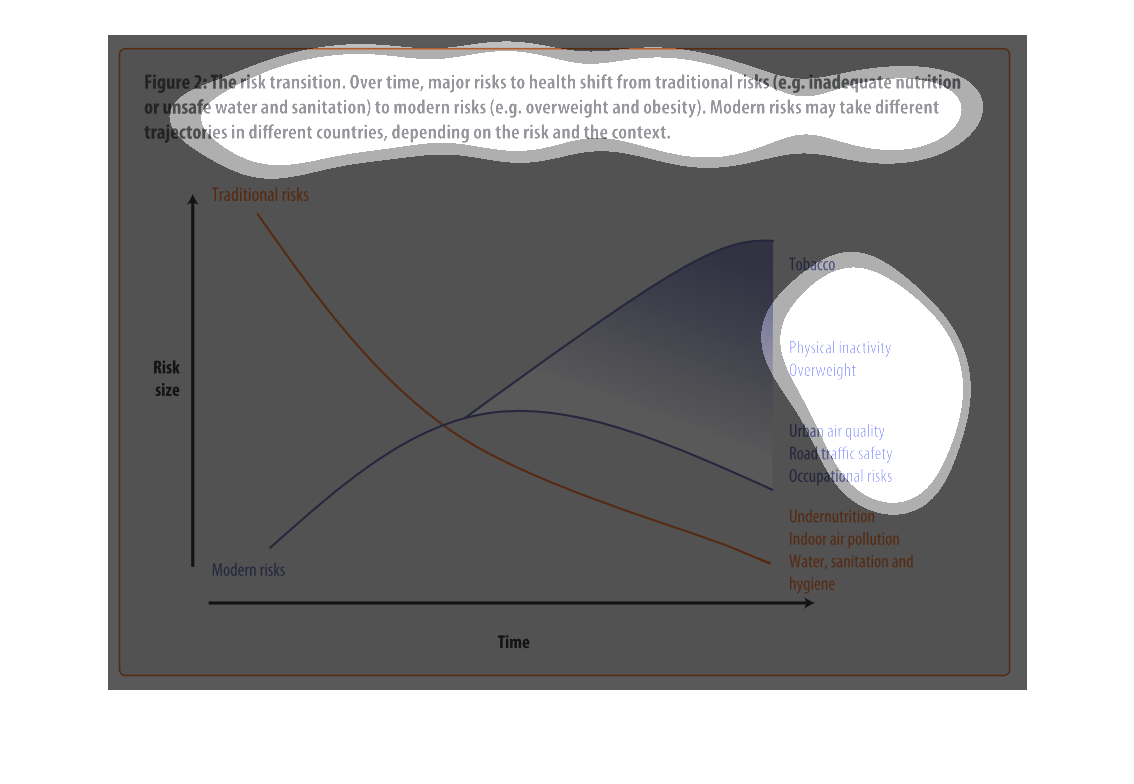
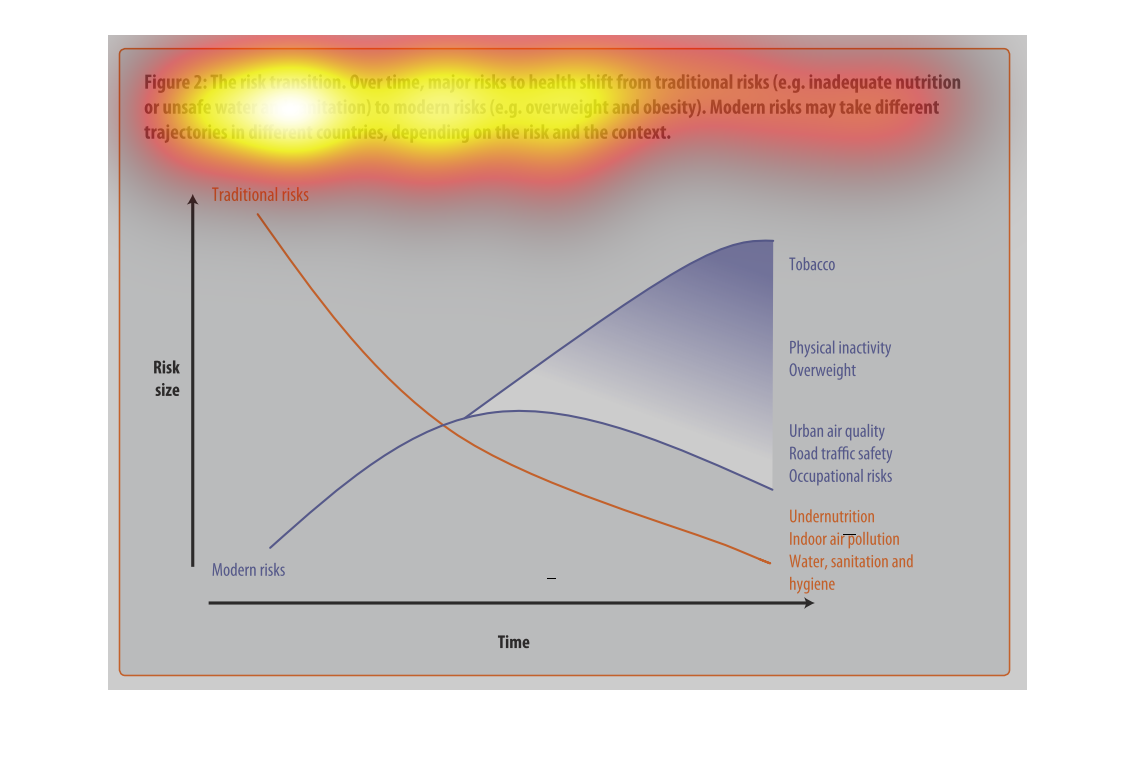
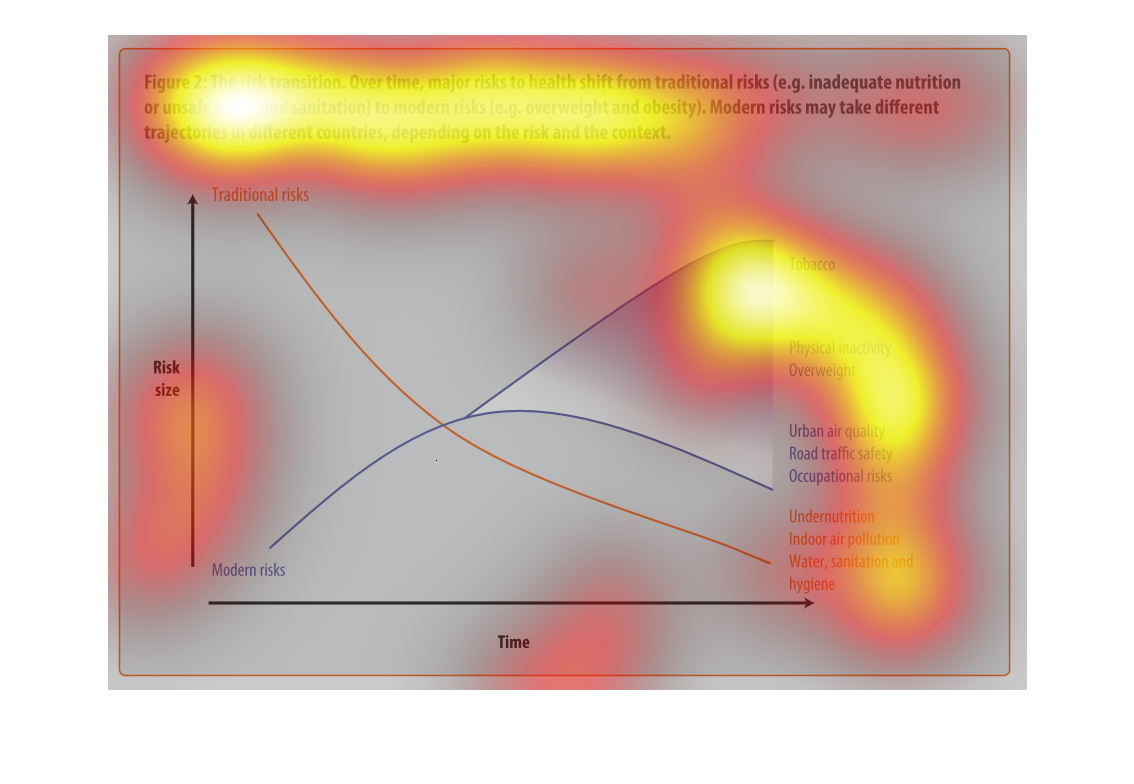
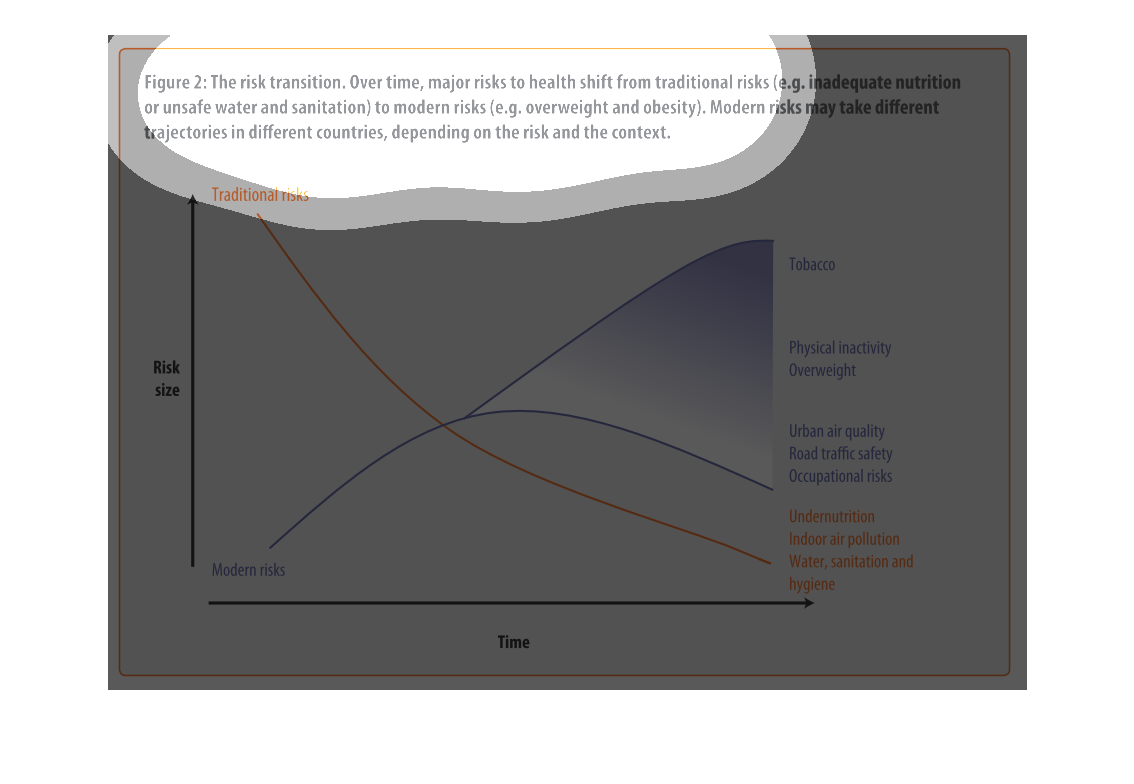
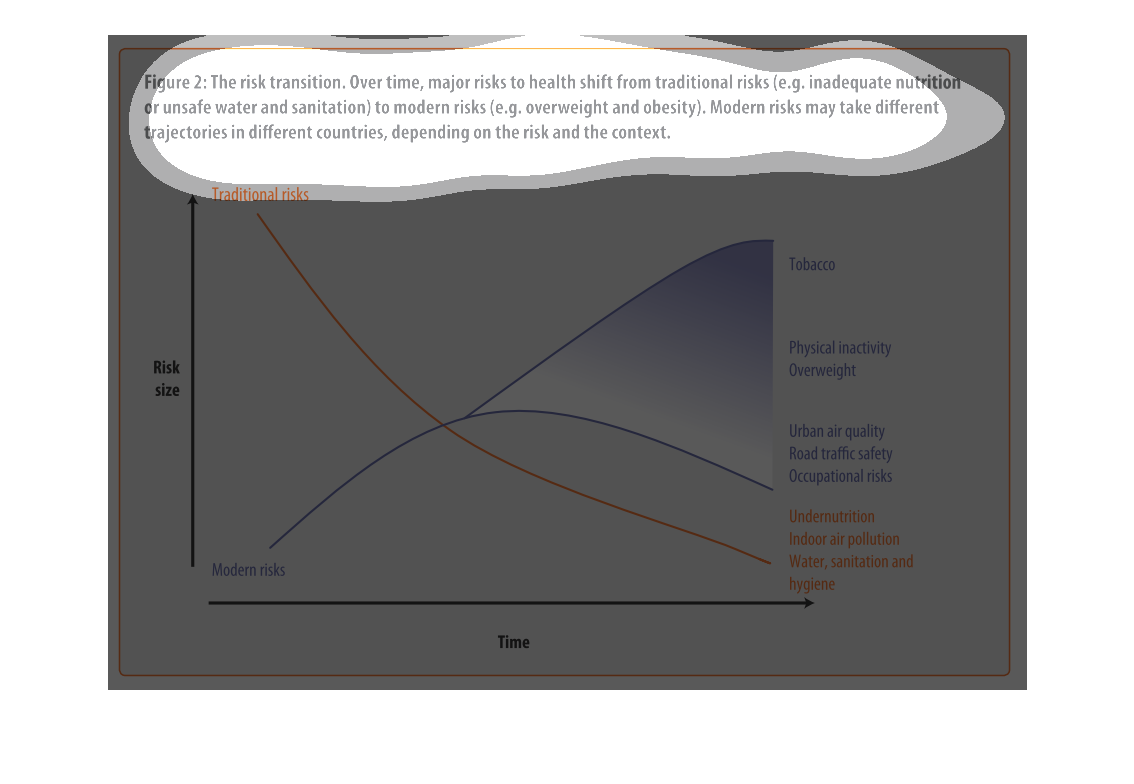
This image depicts the risk transition. From unmet needs such as inadequate nutrition or unsafe
water to eventual modern risks such as obesity. Traditional risks take place often in less
modern areas, where food is not in overabundance.
This chart describes  the risk transition, over time, major risks to health shift from traditional
risks to modern risks. Different categories are represented by different colors.
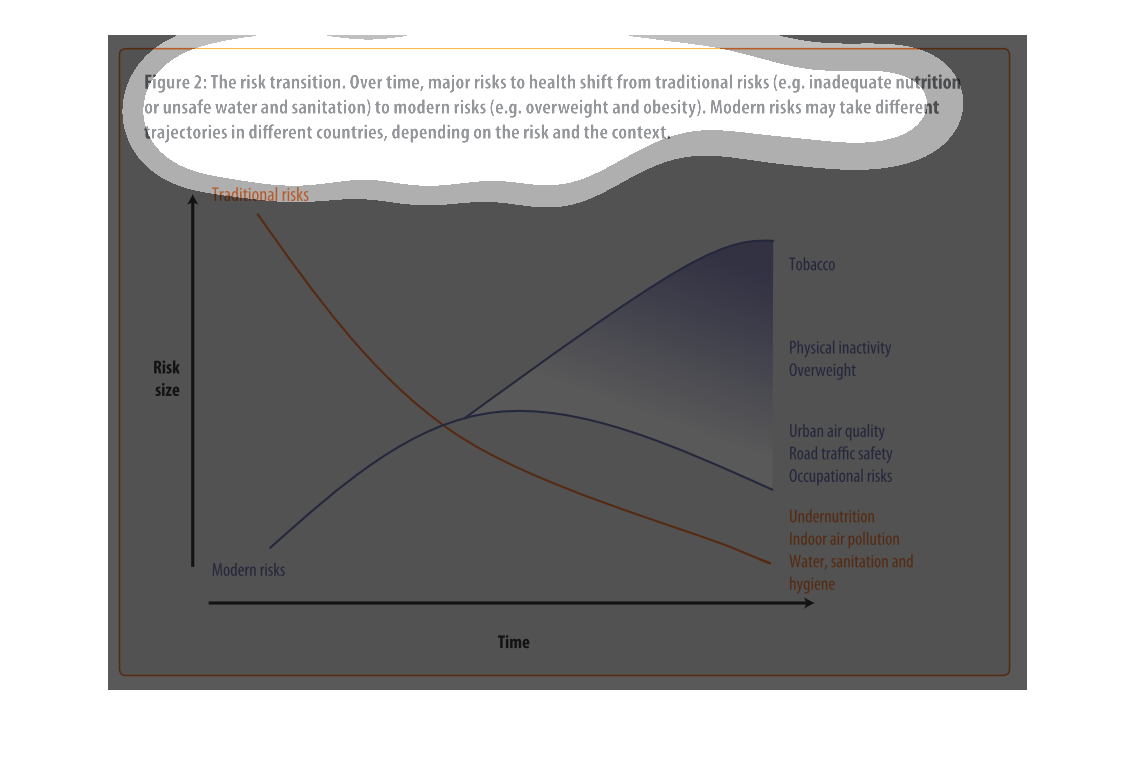
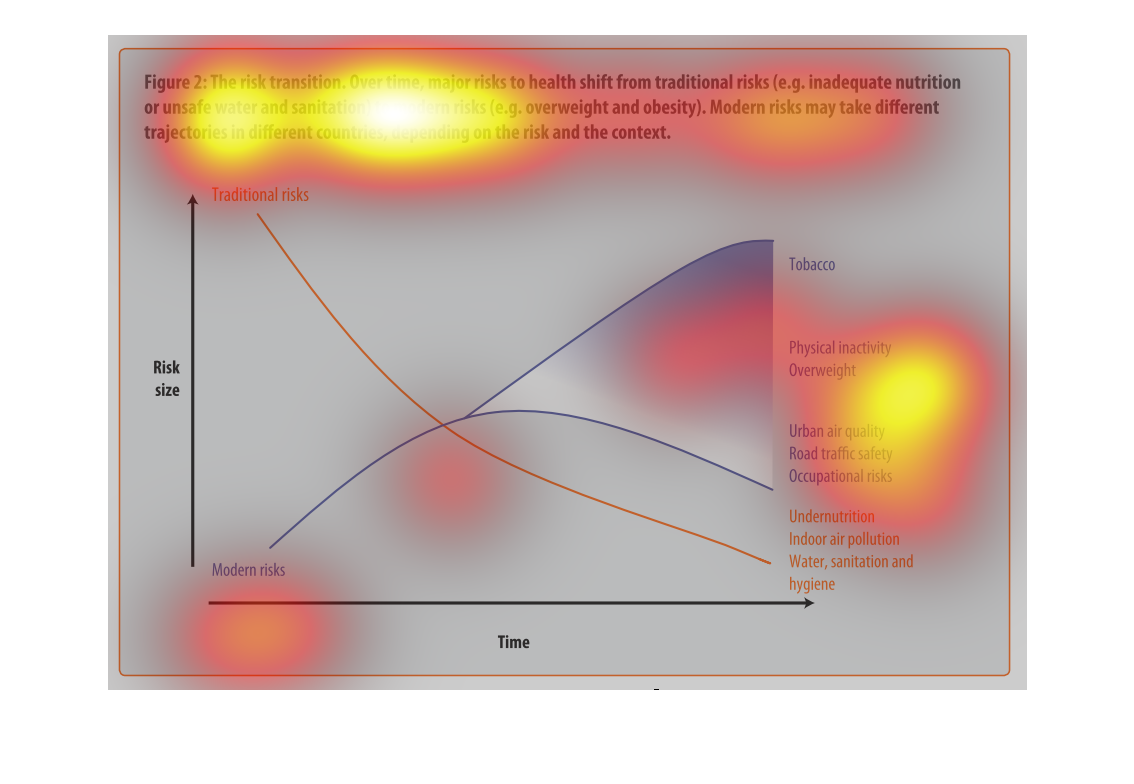
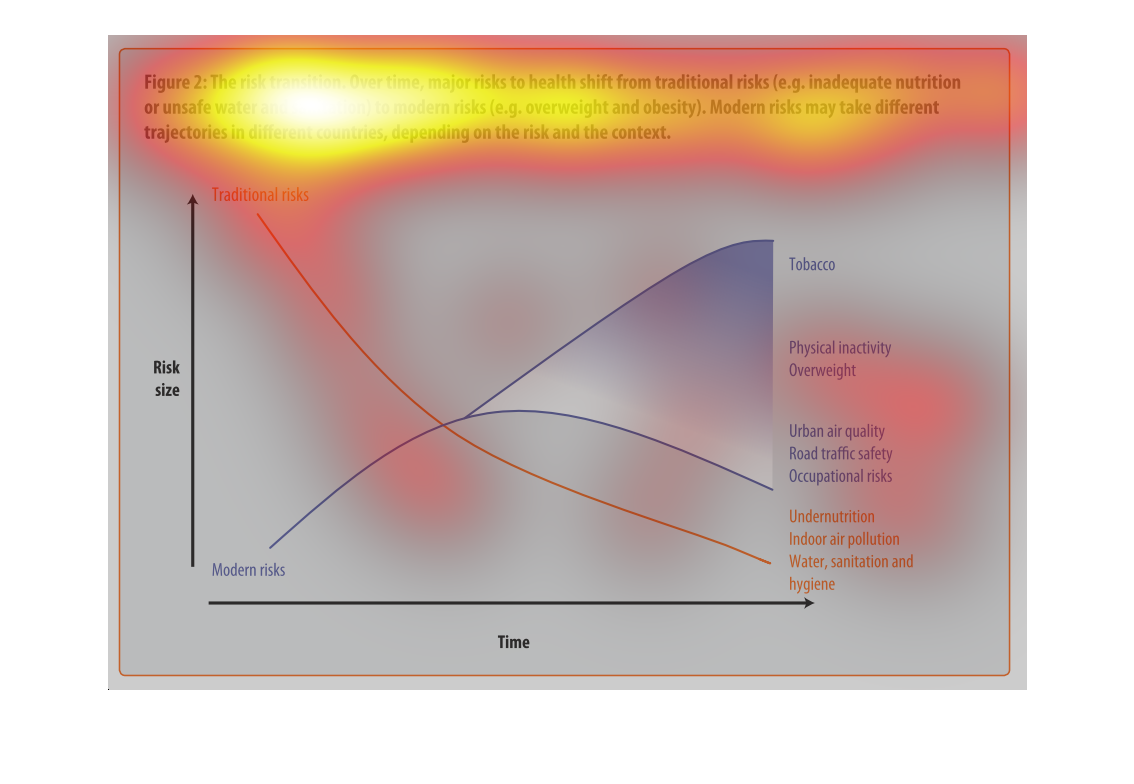
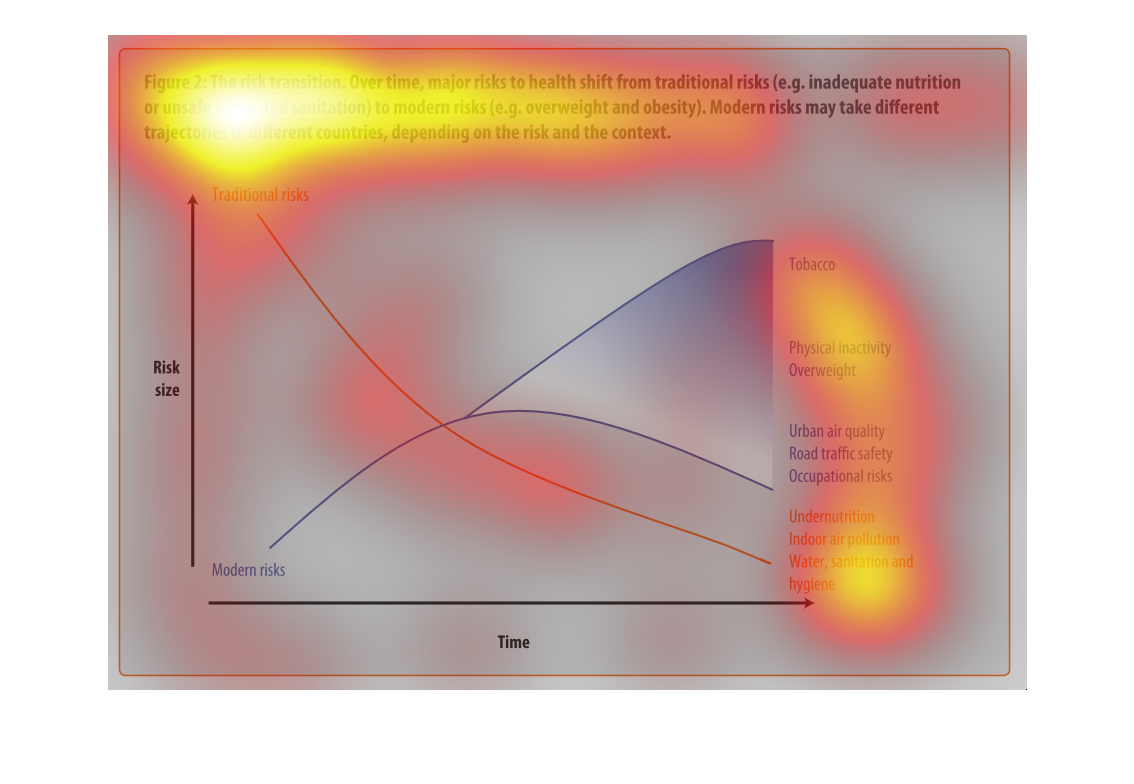
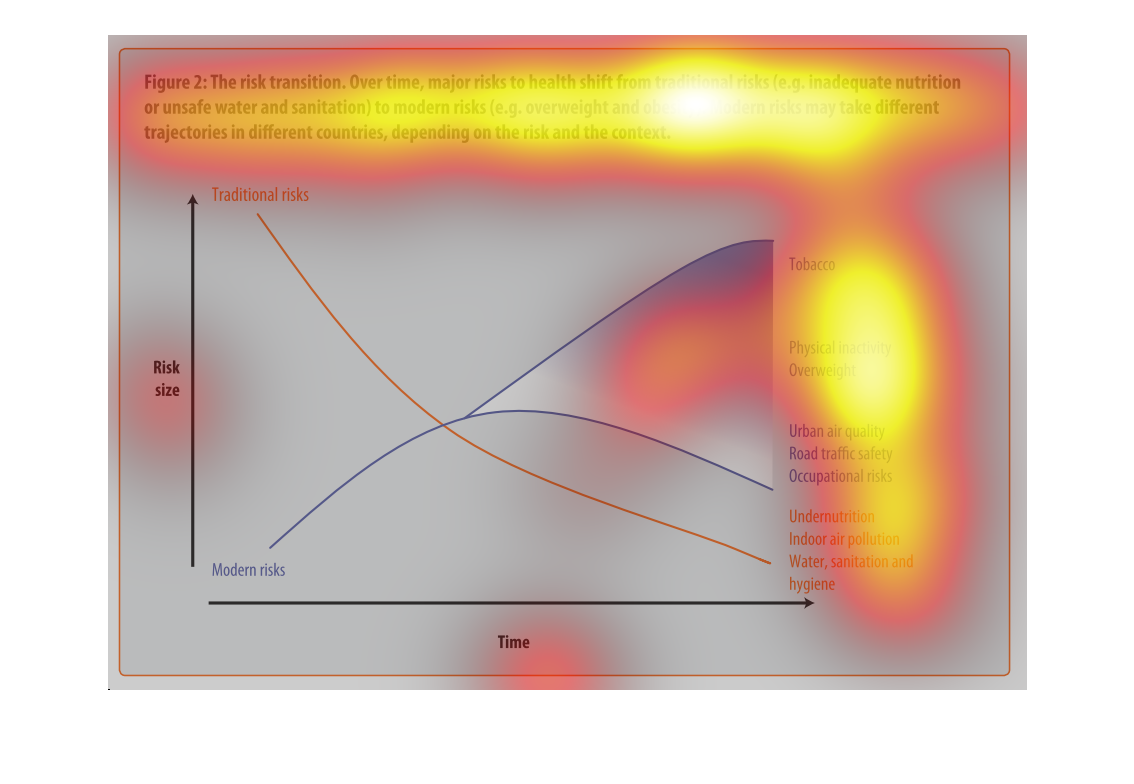
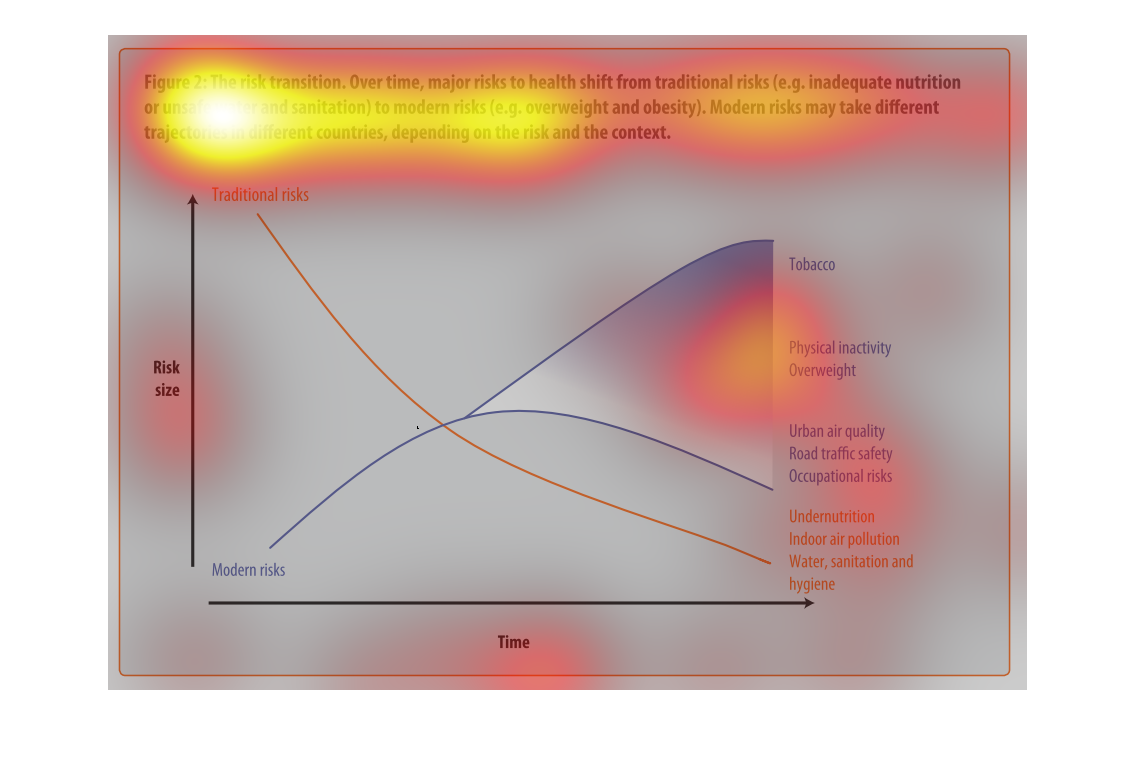
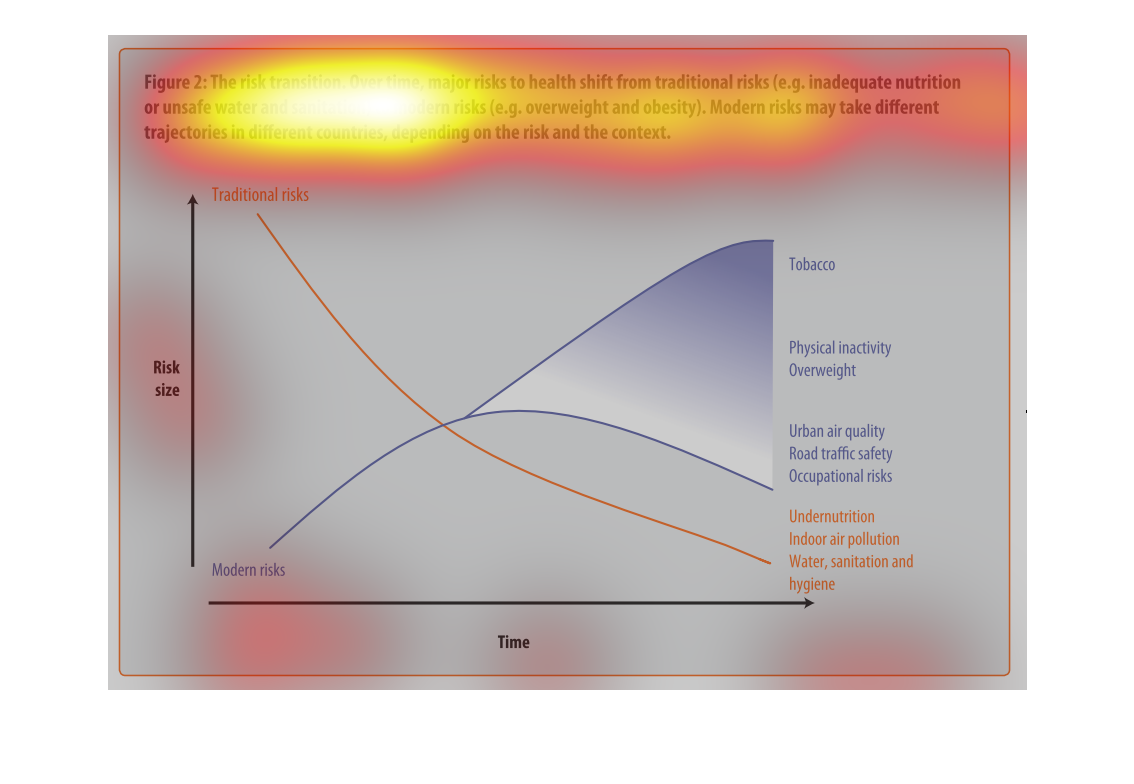
This image describes how specific risks to health change over time depending on if the country
is developed or not. Based on the graph, you can see that traditional risks to health such
as sanitation and hygiene have fallen as modern risks such as tobacco and obesity have risen
over time.
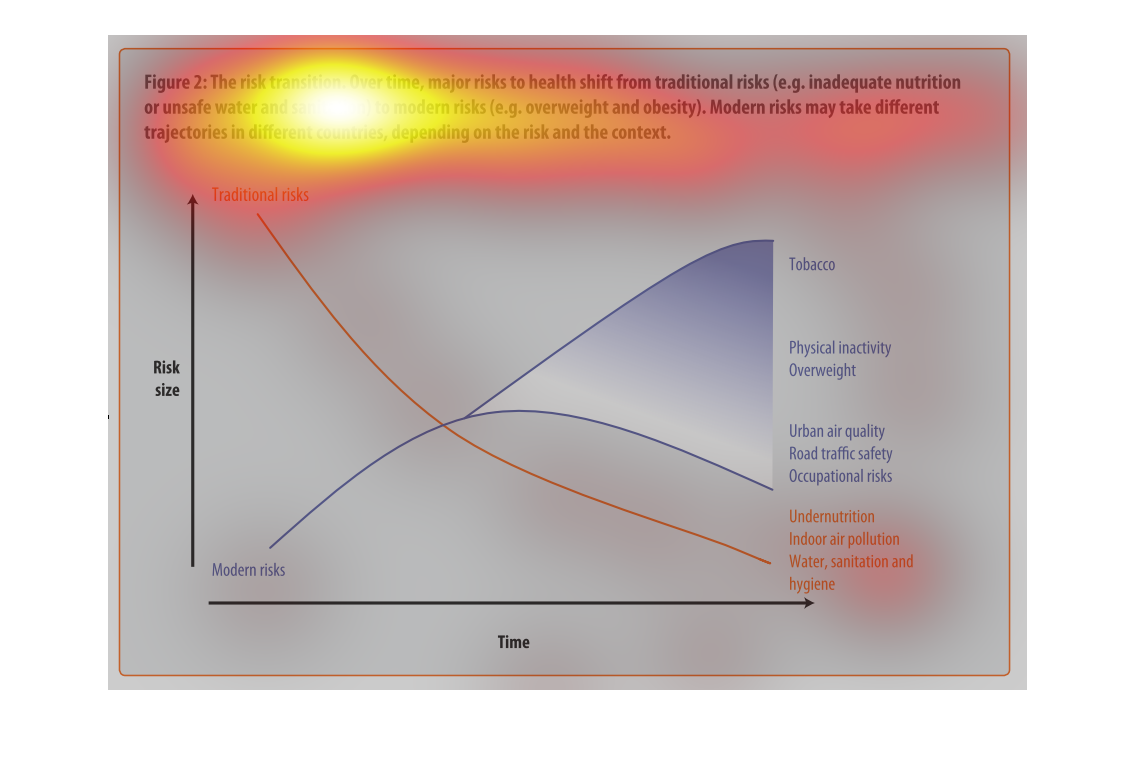
The graph shows the relative risk of a variety of different factors like tobacco and obesity
over time. The trend is that risk factors like tobacco increase over time.

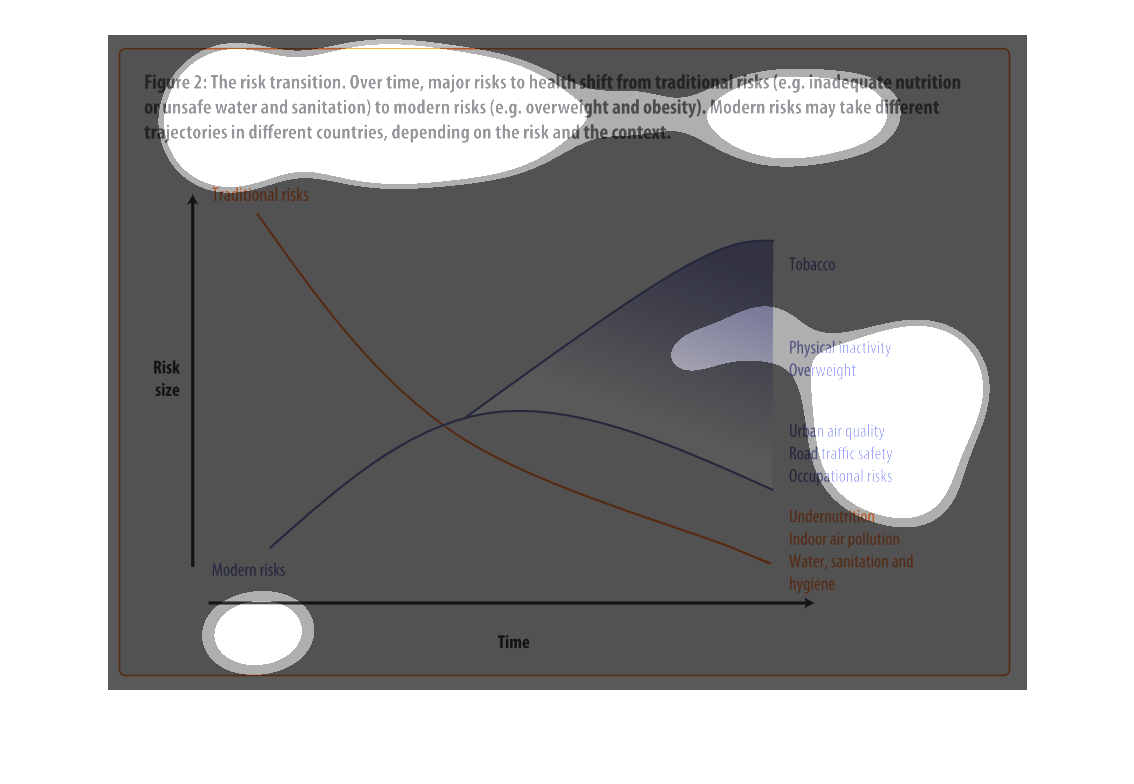
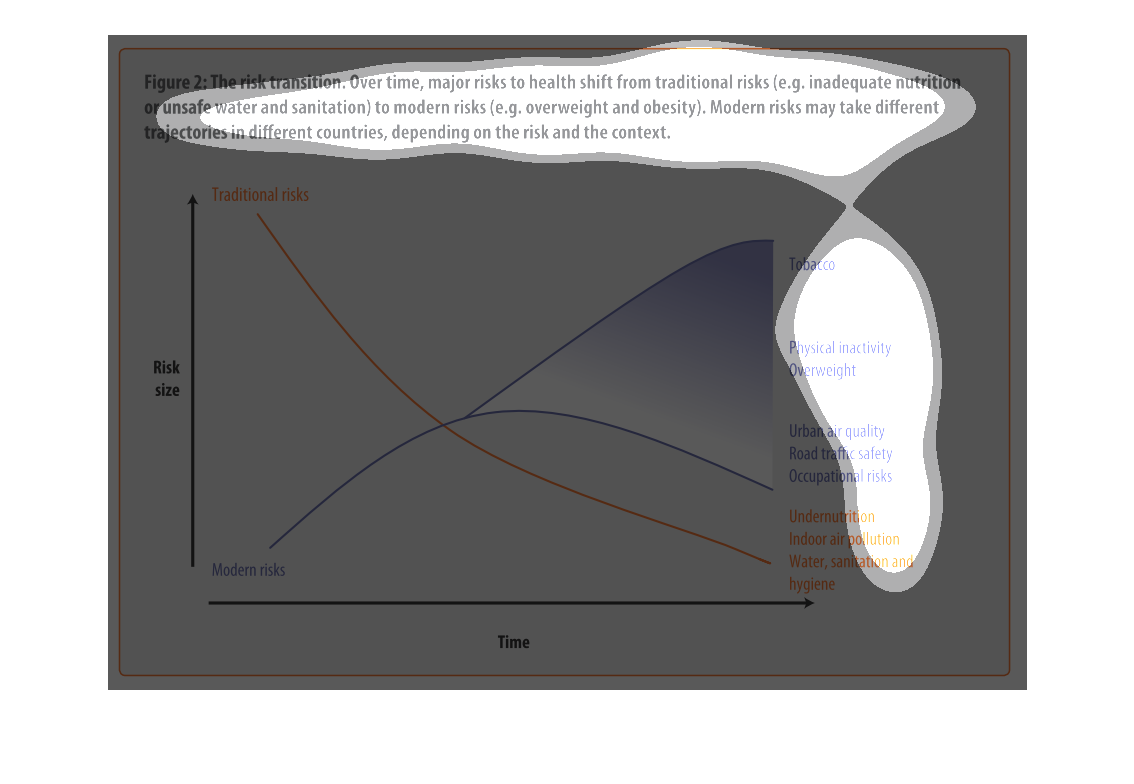
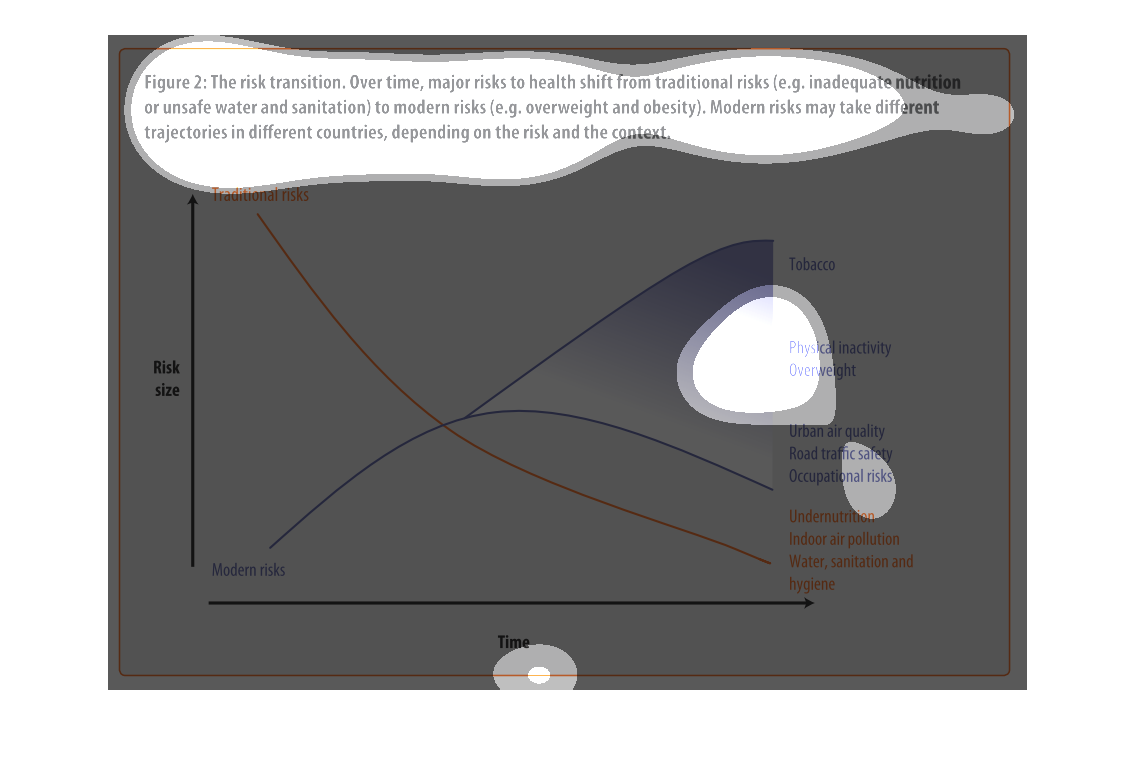
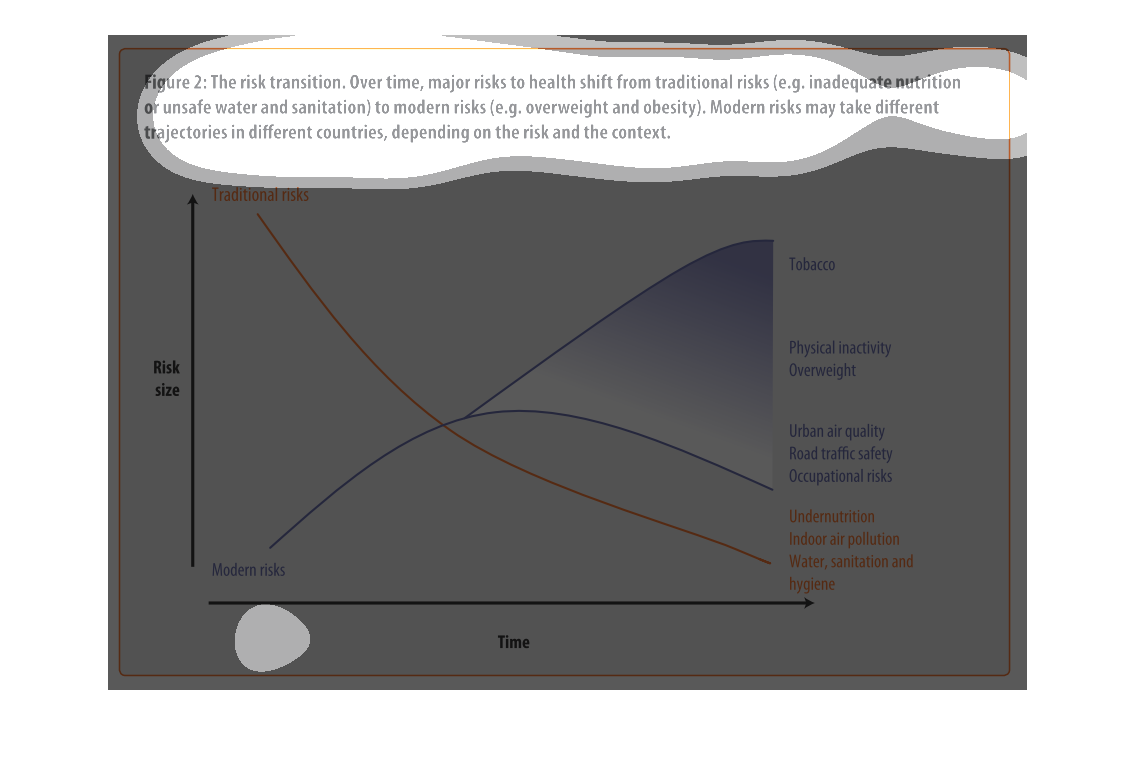
Describes the relationship of the risk translation between traditional risk (under nutrition,
indoor air pollution, sanitation, etc) compared to modern risk (tobacco, inactivity, overweight).
 Presents the trajectories of each as they correlate to each other.
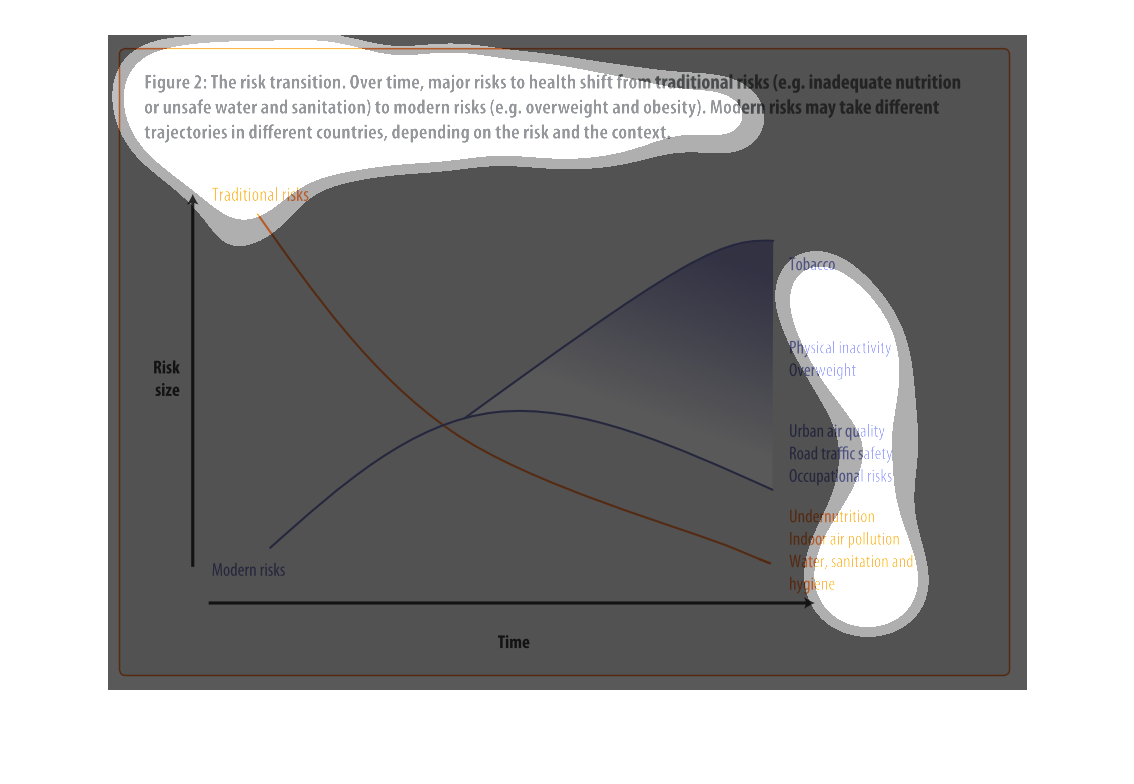
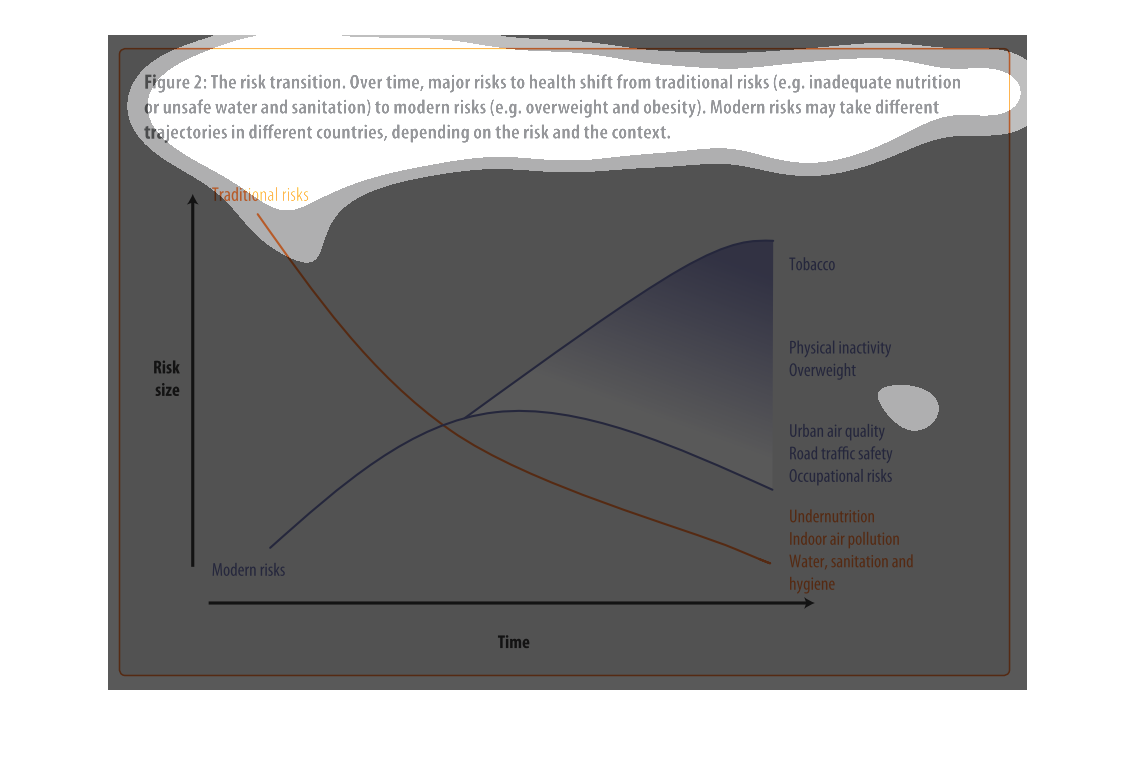
The figure presented is titled risk transition.  The figure is an actual representation of
the statistical dated for major risks to health that have shifted.
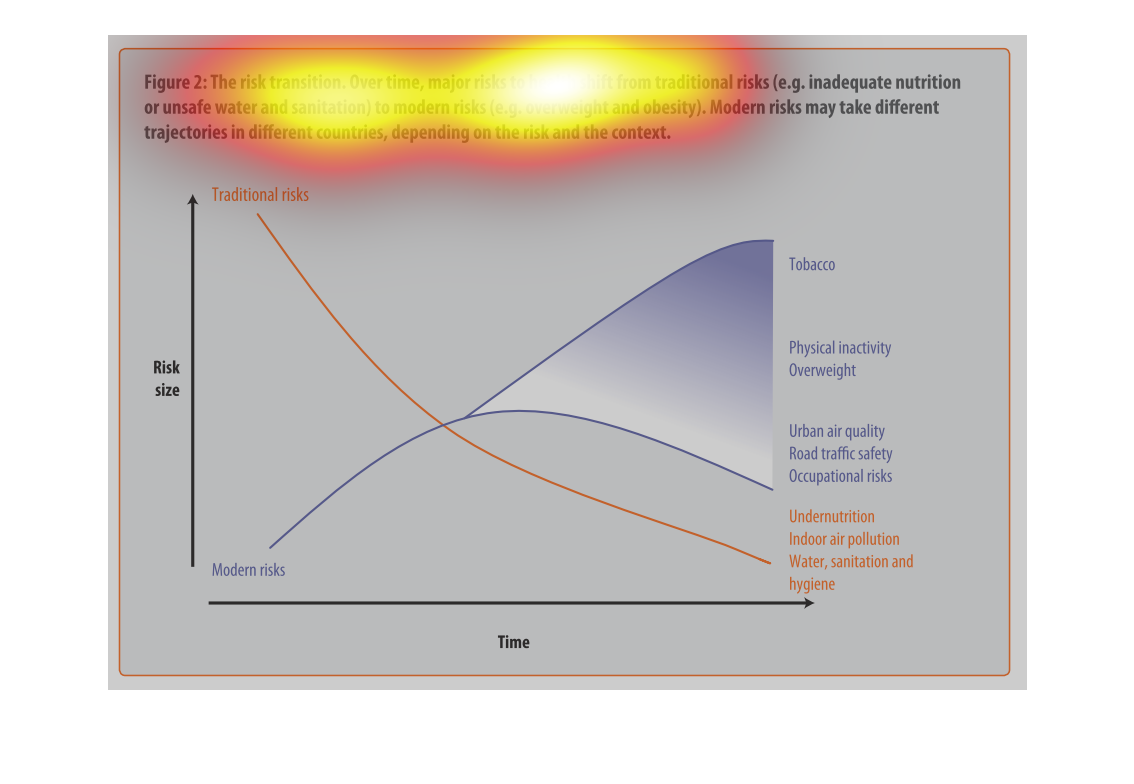
This graph shows the shift of traditional risk factors on health to modern risk factors on
health.  The chart shows that over time traditional factors such as under nutrition decrease
in risk size, while modern factors such as physical inactivity increase in risk size.
This chart is showing the health risks of water sanitation in certain areas alongside other
health concerns: tobacco, obesity, etc.  Again, China and India lead the way.
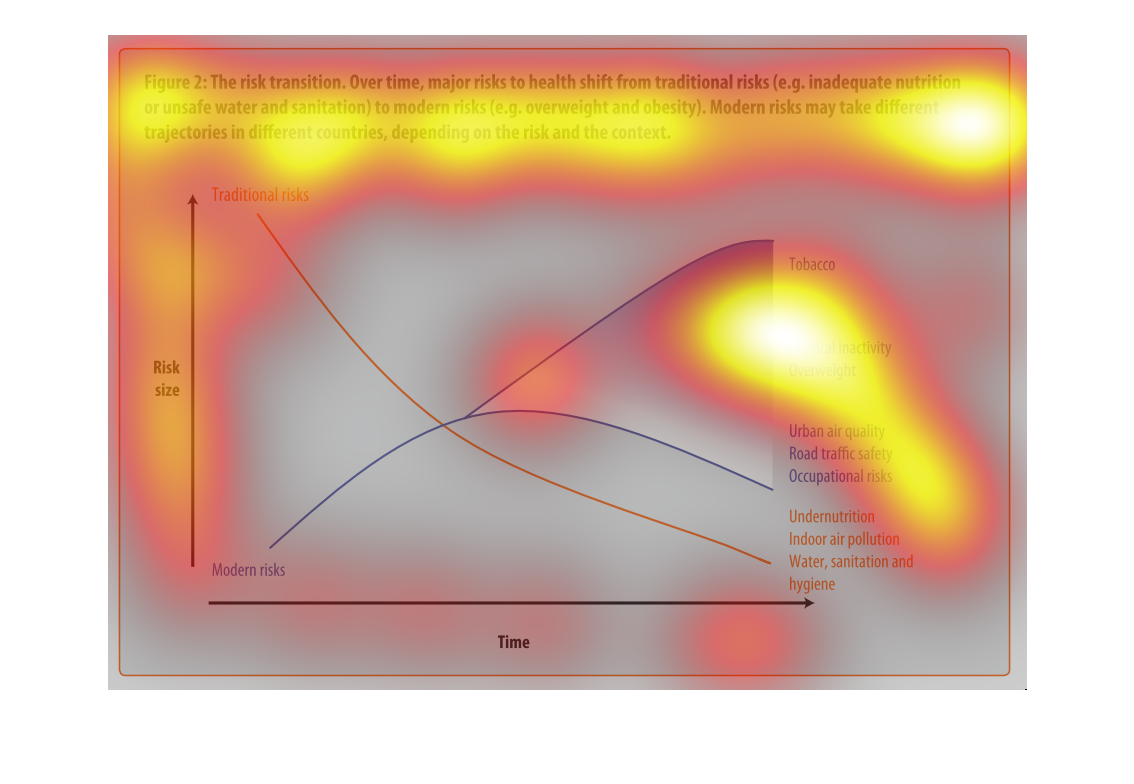
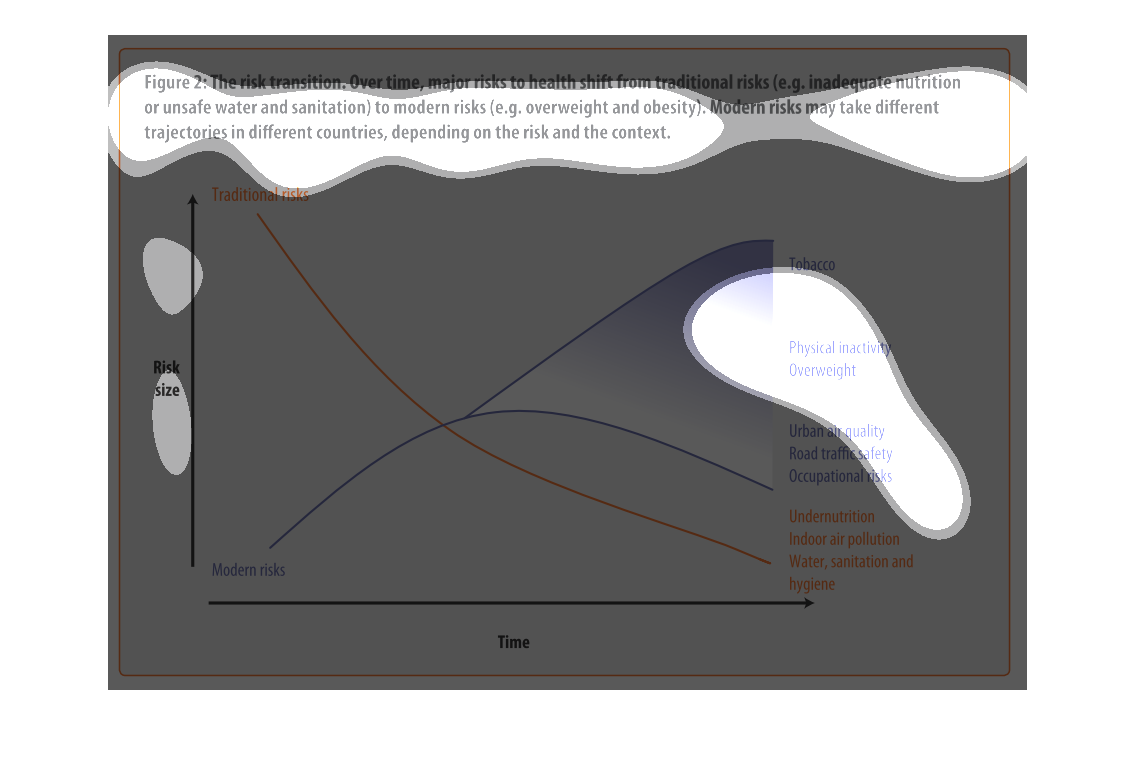
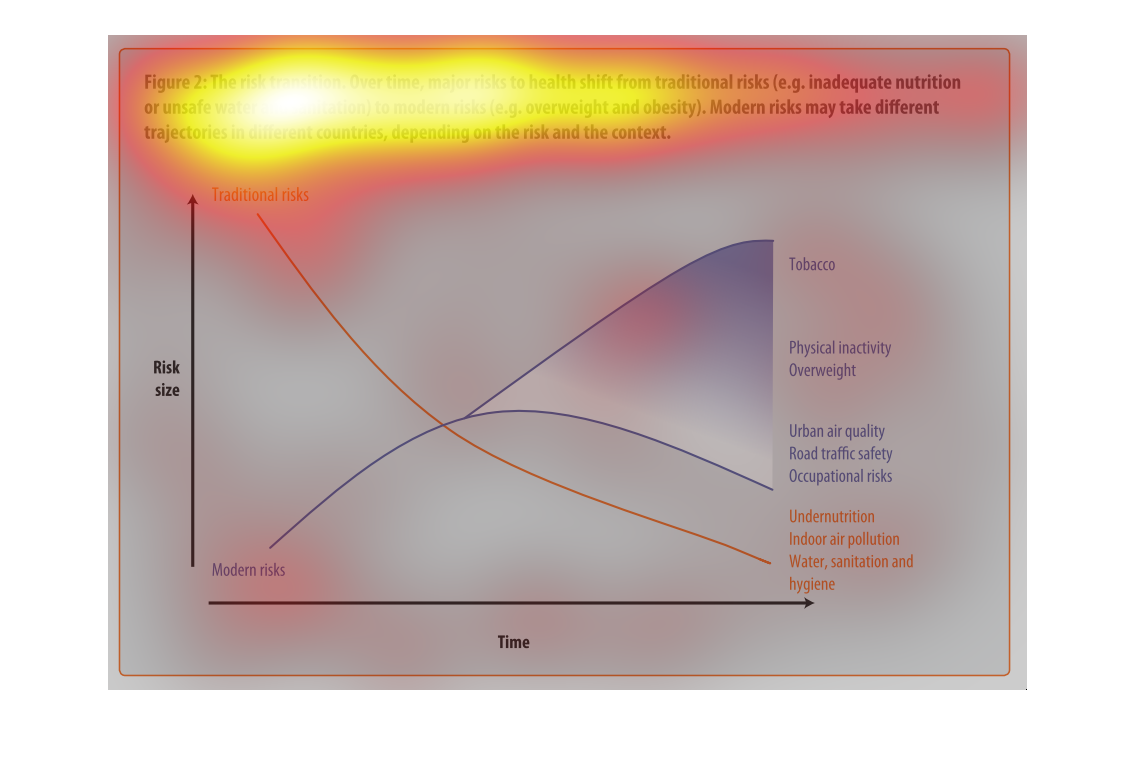
figure 2, the risk transmission over time major risks to health switch from traditional risks
of water , and nutrition to obesity and other health risks brought on by modern ways of living.
Y axis risk size, X axis is time, we see nutritional causes decrease and environmental factors
increase such as air quality
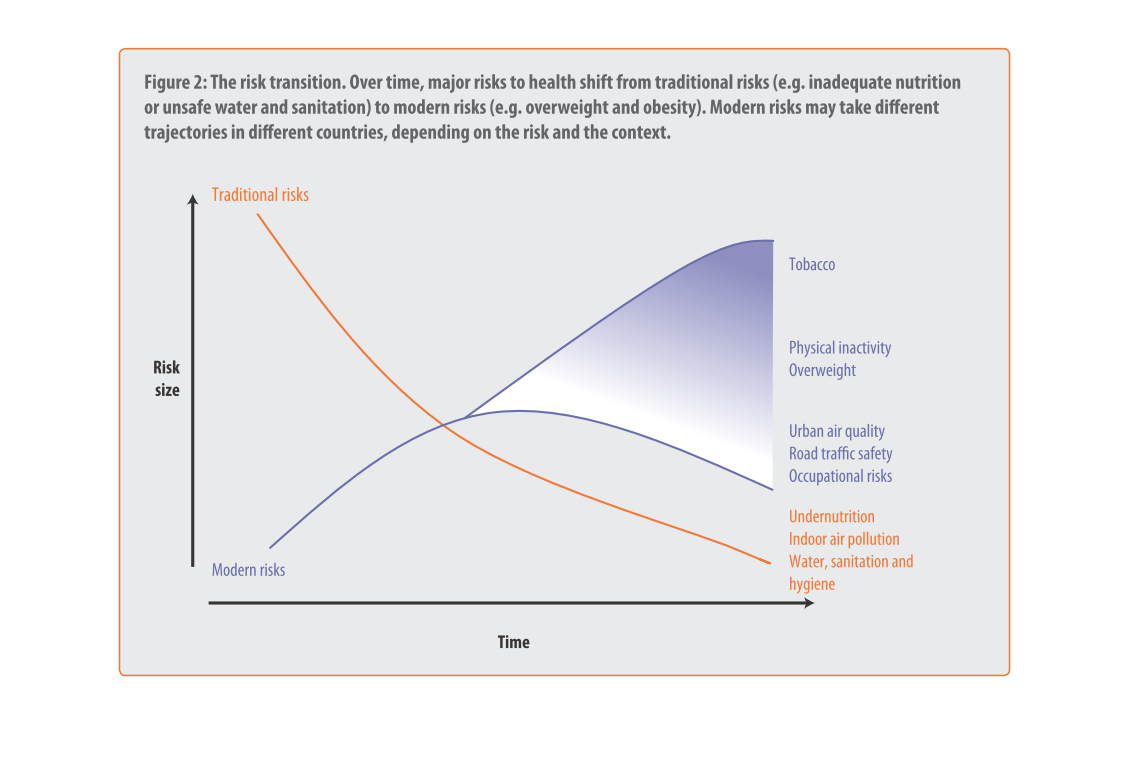
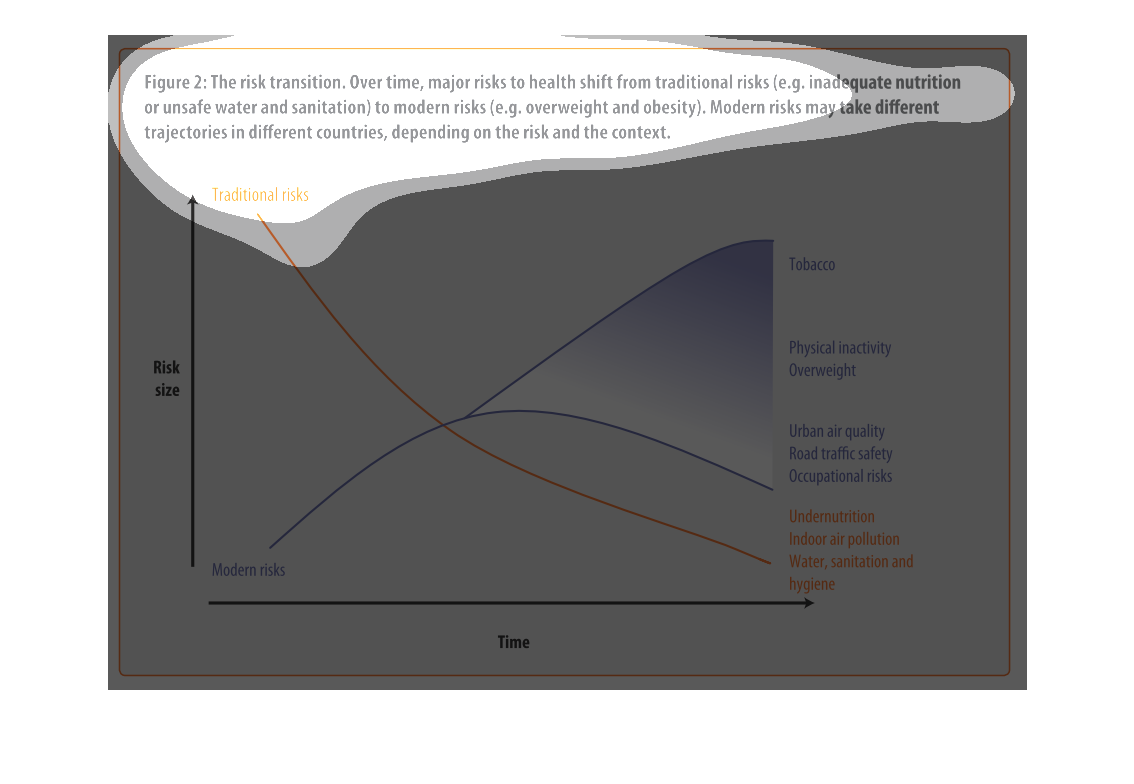
This chart describes the risk transition. Over time, major risks to health shift from traditional
risks to modern risks. Modern risk may take different trajectories in different countries.
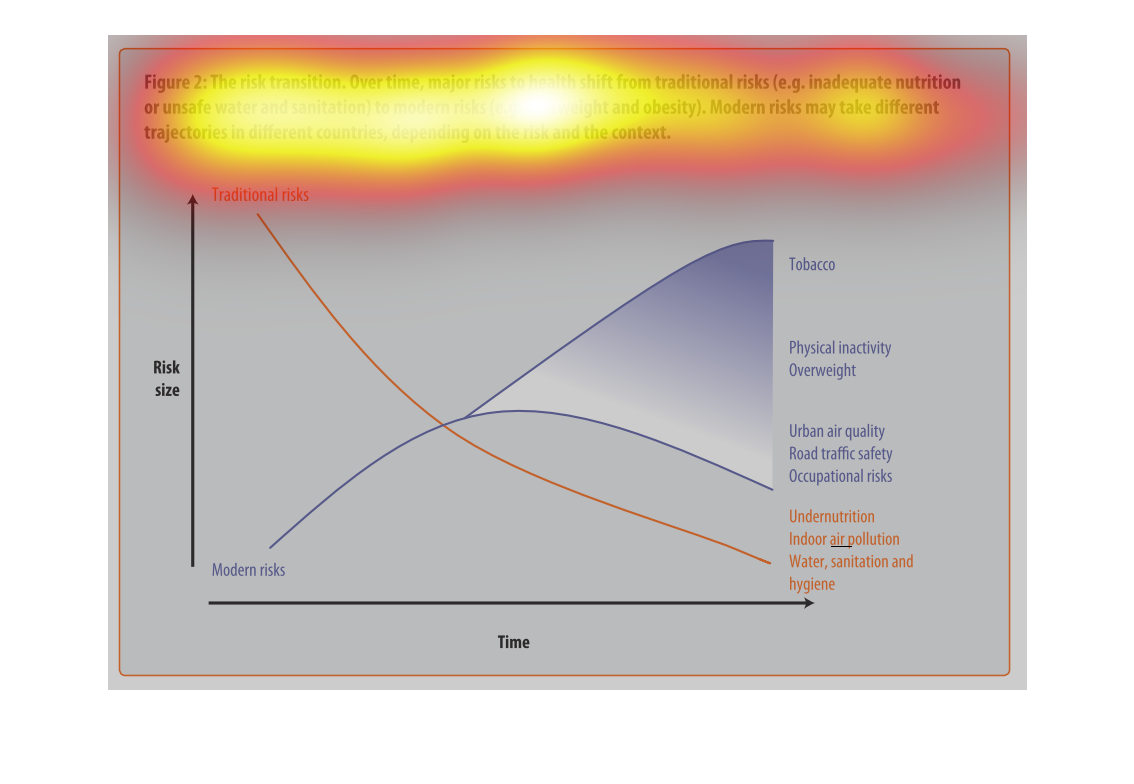
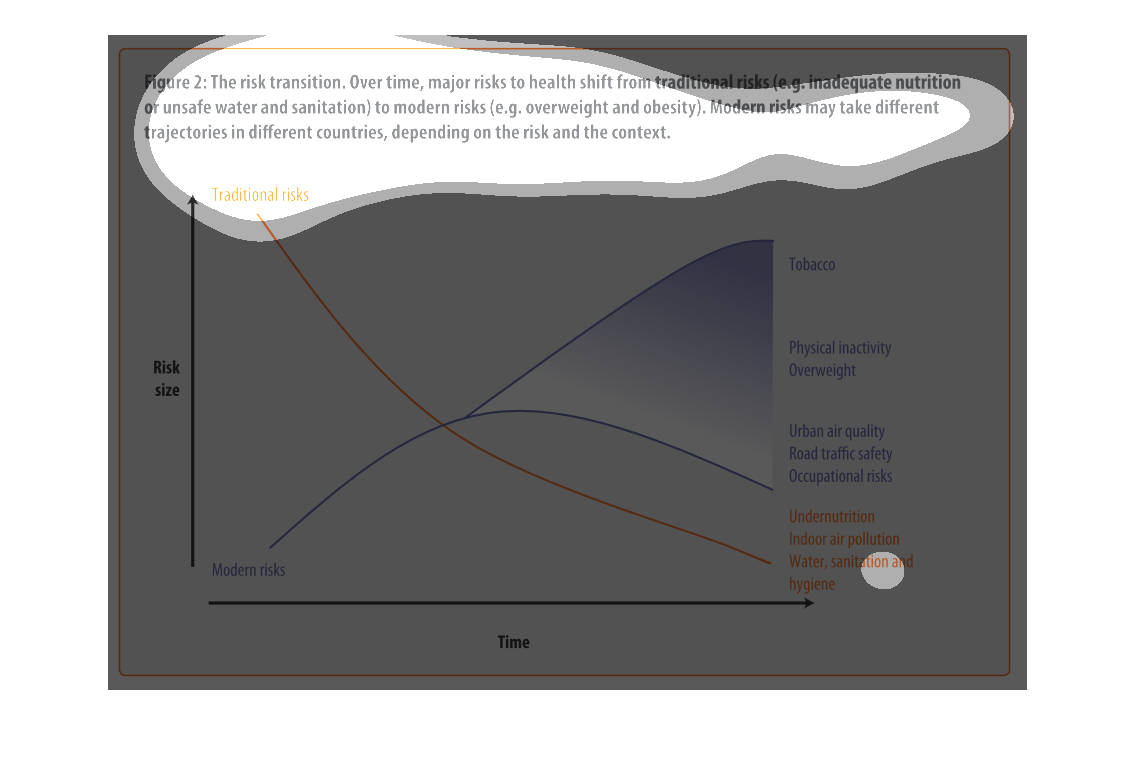
This is a color coded chart depicting a shift from traditional risks to modern risks over
time for a varying number of health and wellness factors consistently over time.
This chart shows that over time, major risks to health shift from traditional risks (i.e.
inadequate nutrition or unsafe water) to modern risk (i.e. obesity, tobacco use).  Modern
risks may take different trajectories depending upon the country.
This graph is about risk transition.  This is relating to modern risk like obesity or eating
and drinking unhealthy things.  Risk can change over time.