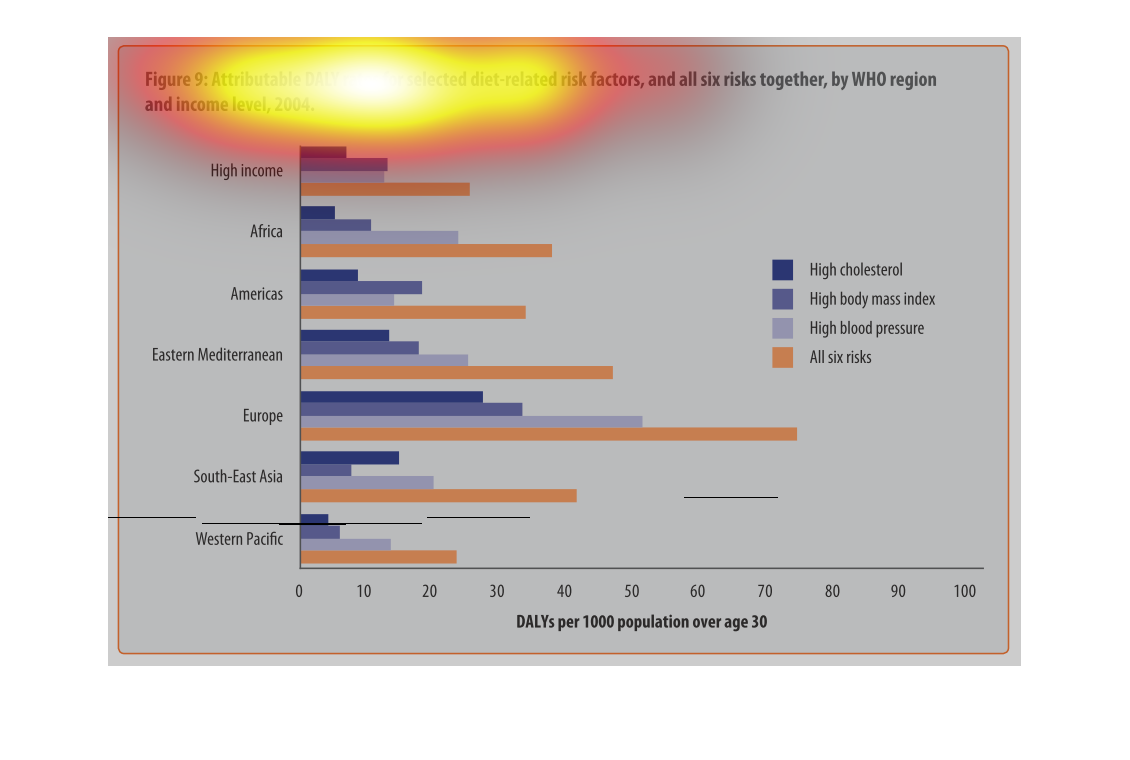
The graph describes the attributable daily rates for selected diet-related risk factors by
WHO region and income level of 2004. The areas are Africa, Americas, Mediterrenean, Europe,
South East Asia and the Western Pacific.
This image is a chart of diet-related risk factors from WHO data for the year 2004. The risk
factors graphed include high colesterol, high body mass index, high blood pressure, and the
combination of all 6 risk factors. The data is aggregated across demographic groups, than
include High Income, Africa, Americas, Eastern Mediteranean, Europe, South-East Asia, and
Western Pacific regions. Total risks are highest for the Europe demographic. The Americas
and High income demographics show a disproportionately high amount of high body mass index
as a risk factor.
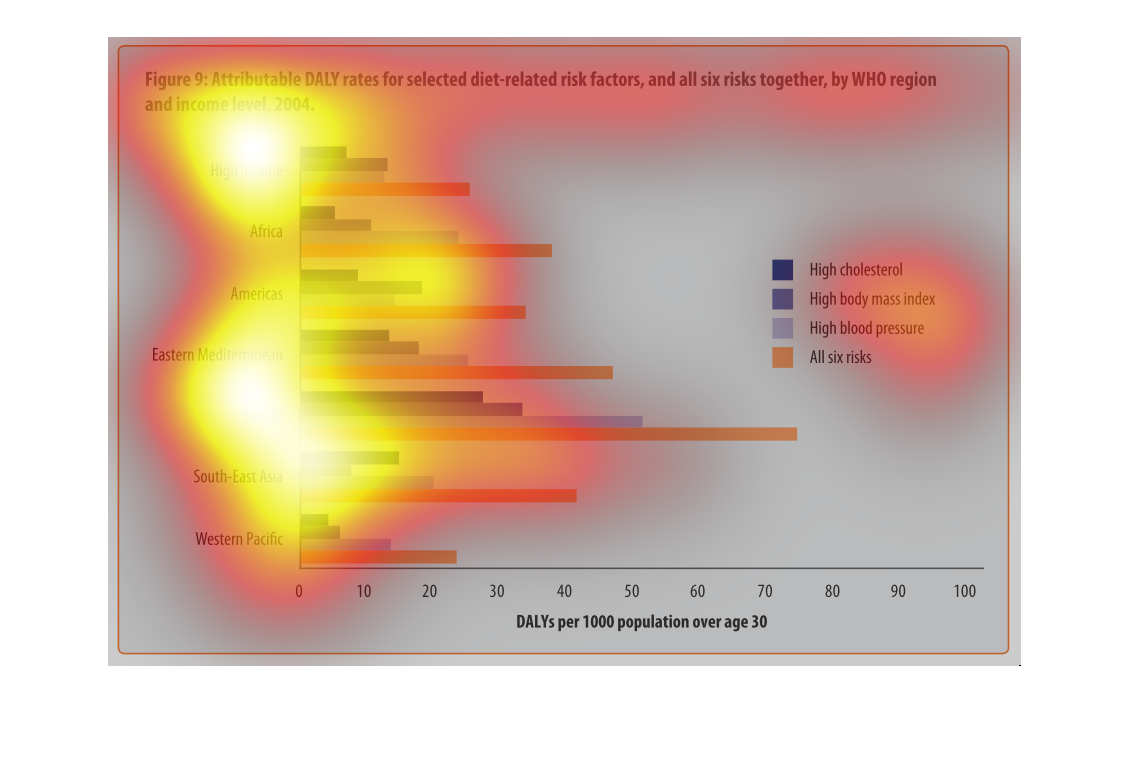
This chart shows the main six diet-related risk factors and sorts them by global region and
income level. Europe has the highest risks for all factors.
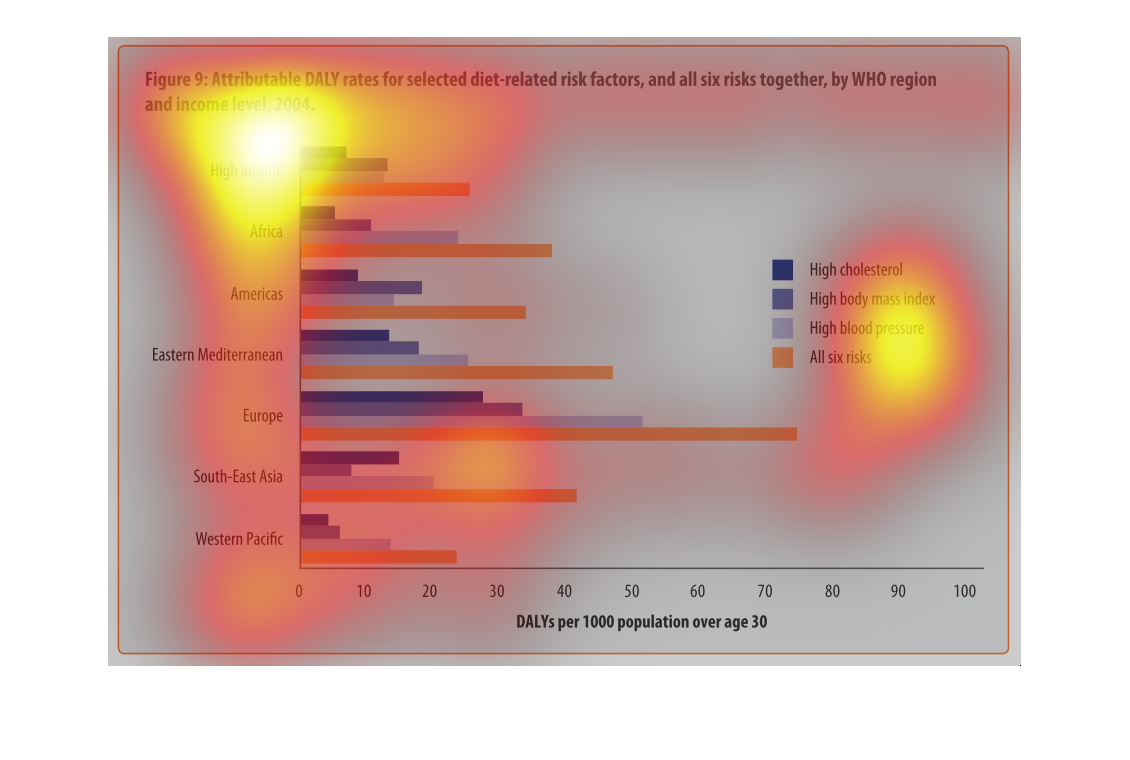
This chart describes attributable DALY rates for selected diet-related risk factors, and all
six risks together, by WHO region and income level, for the year 2004.

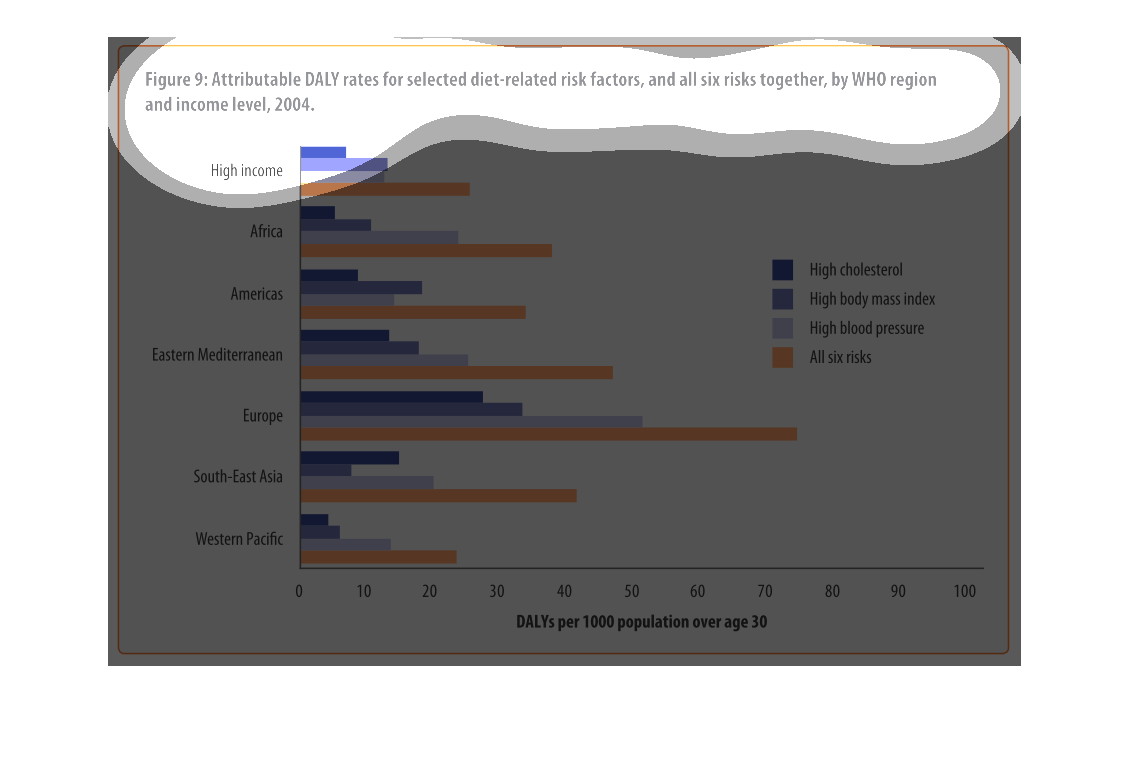
The graph shows attributable DALY rates for selected diet related risk factors in relation
to income level and global region versus DALY's per 1000 population over age 30. The risk
factors listed are high cholesterol, high BMI, high blood pressure, and all 6 risk factors.
The image depicts attributable DALY rates for selected diet-related risk factors, and all
six risks together, by WHO region and income level, 2004. Categories compare different regions
around the world and different diet-related risk factors for each region. Risk factors include:
High cholesterol, high body mass index, high blood pressure, and all risks. The "All risks"
category is the leading diet-related risk factor, in every region listed, across the board,
with high cholesterol being the least cited risk factor.
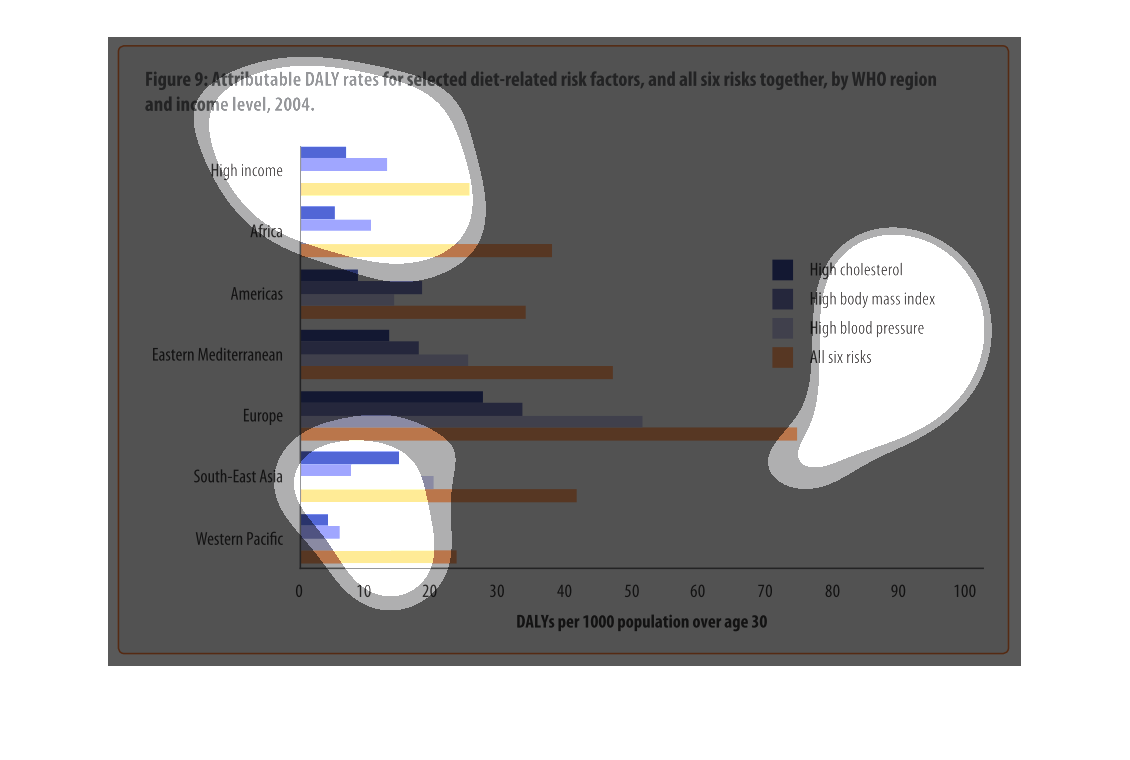
This graph shows the people per 1000 that presented diet-related risk factors for different
regions of the world. The region with the largest portion of people that presented these risk
factors was Europe the region with the smallest portion of people was Western Pacific. At
the top of the graph was another section labeled "high income" that suggested those with a
higher income were less likely to have these diet-related risk factors.
Daily rates for selected diet-related risk factors and all six risks together by World Health
Organization region. The top three risks are: high cholesterol, high body mass index, high
blood pressure. All six risks are highest in Europe.
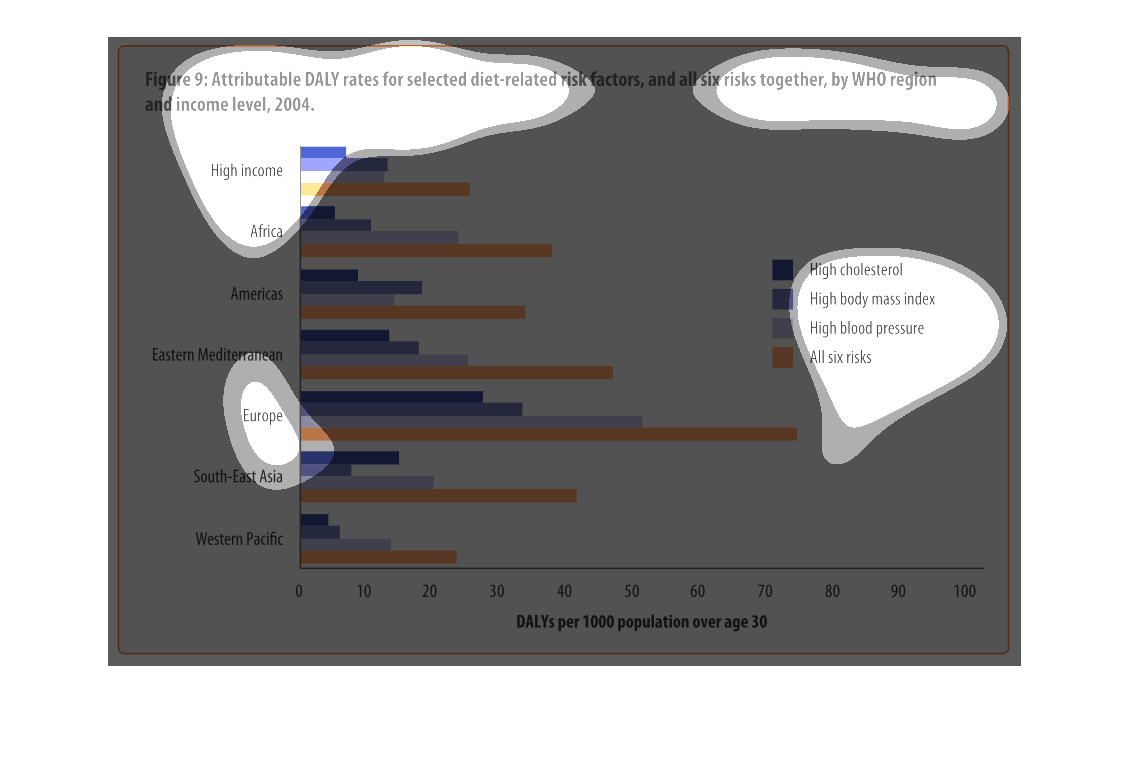
This chart describes attributable DALY rates for selected diet related risk factors, and all
six risks together, by WHO region. Categories on the chart include high income.
This shows six risk factors when dieting. The bars on the graph seem to break up the information
by country with Europe having the highest risk factor. These risks include high cholesterol,
high body mass index and high blood pressure as well.
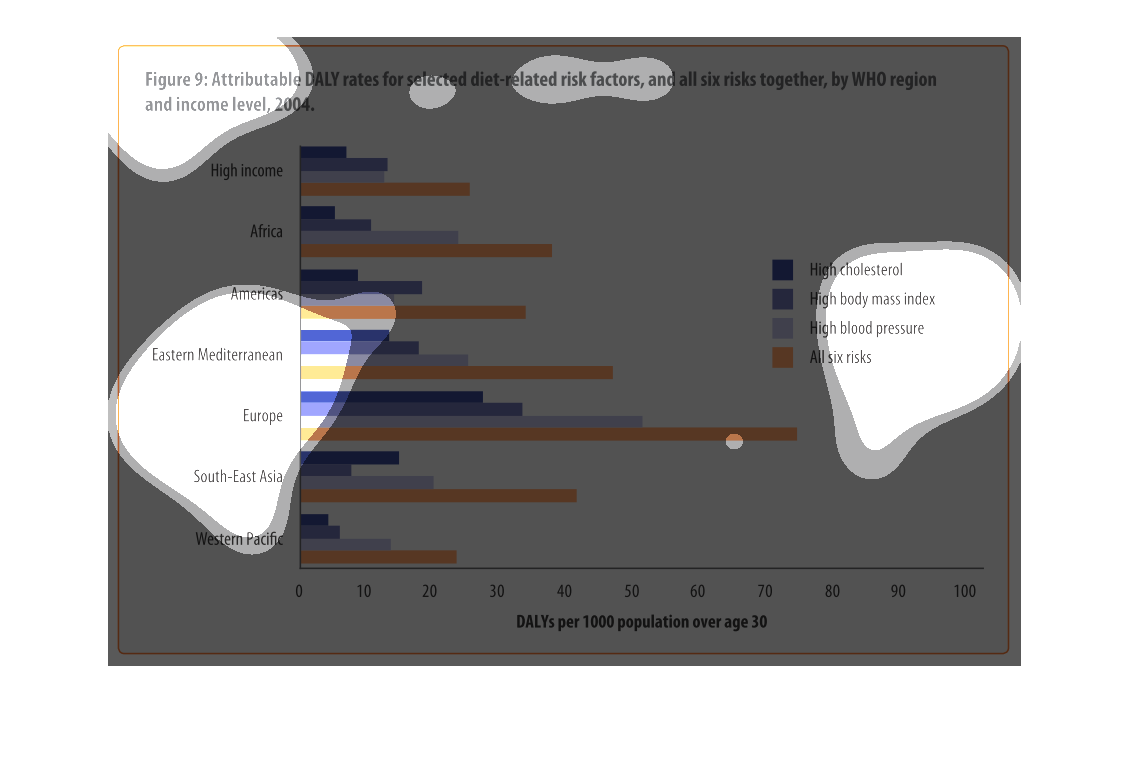
This chart shows attributable daily rates for selected diet-related risk factors and all 6
risks together by region.   The regions shown are Africa, Americas, Eastern Mediterranean,
Europe, Southeast Asia and Western Pacific.
this graph is a bar graph this bar graph has two or more colors on it and the name of this
graph is called it dont have a name but it has four colors
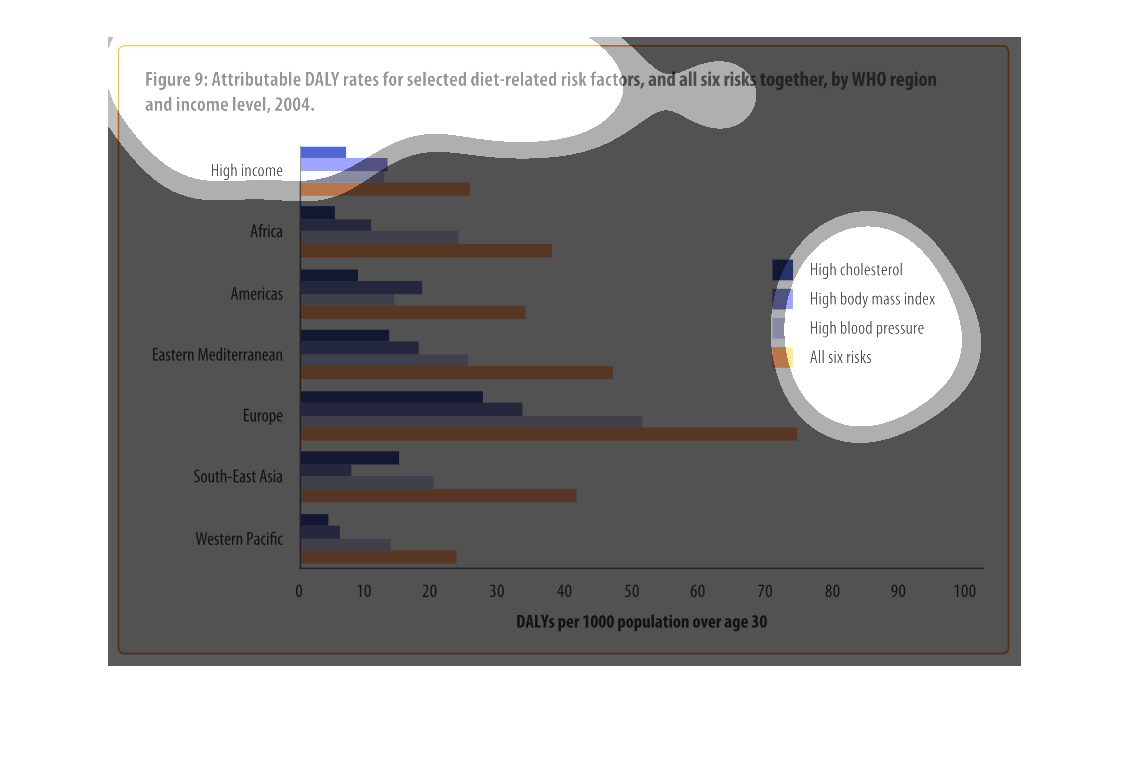
This is a graph that shows attributable DALY rates for selected diet related factors and all
six risks together by WHO region and income level for the year 2004.
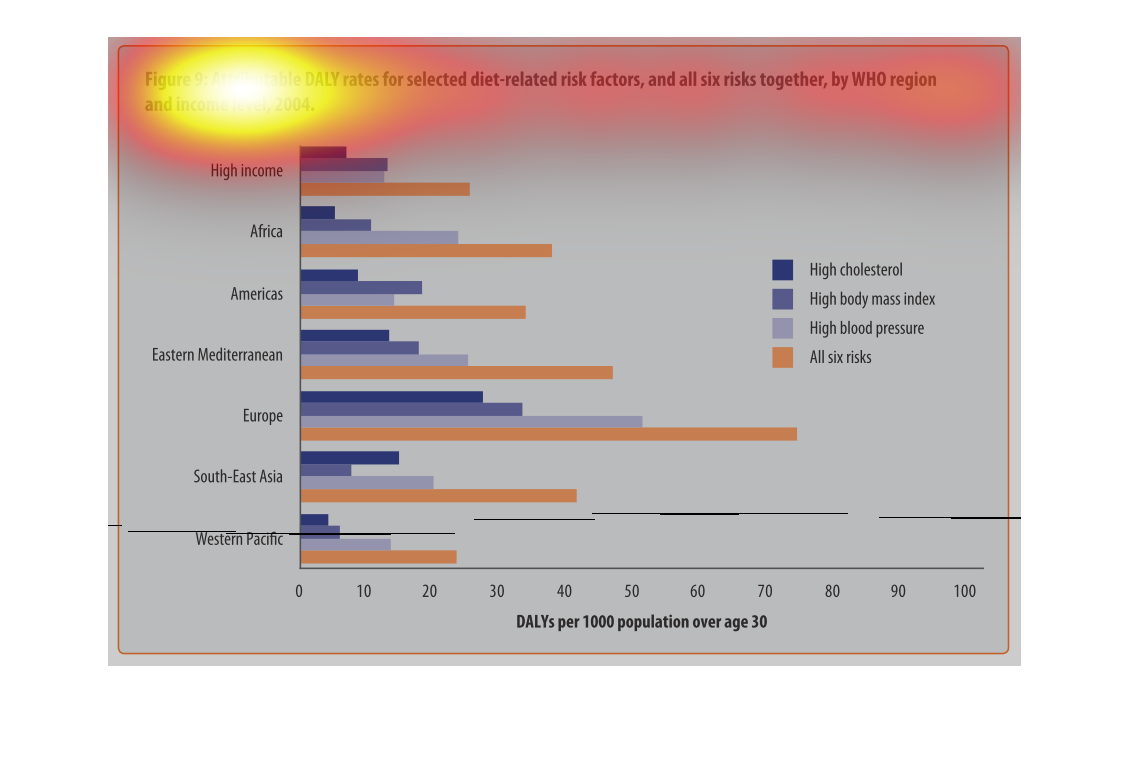
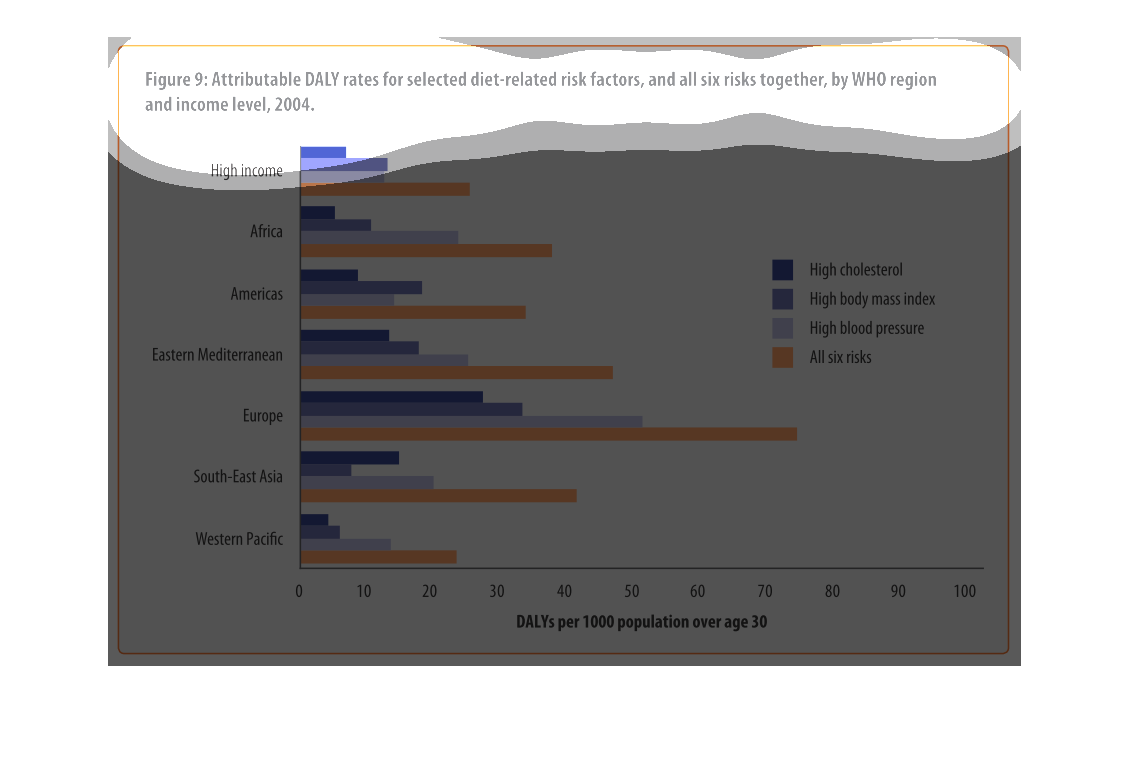
The figure presented is titled: Figure 9: attributable DALY rates for selected diet-related
risk factors.  The figure is a representation of attributable DALY rates.