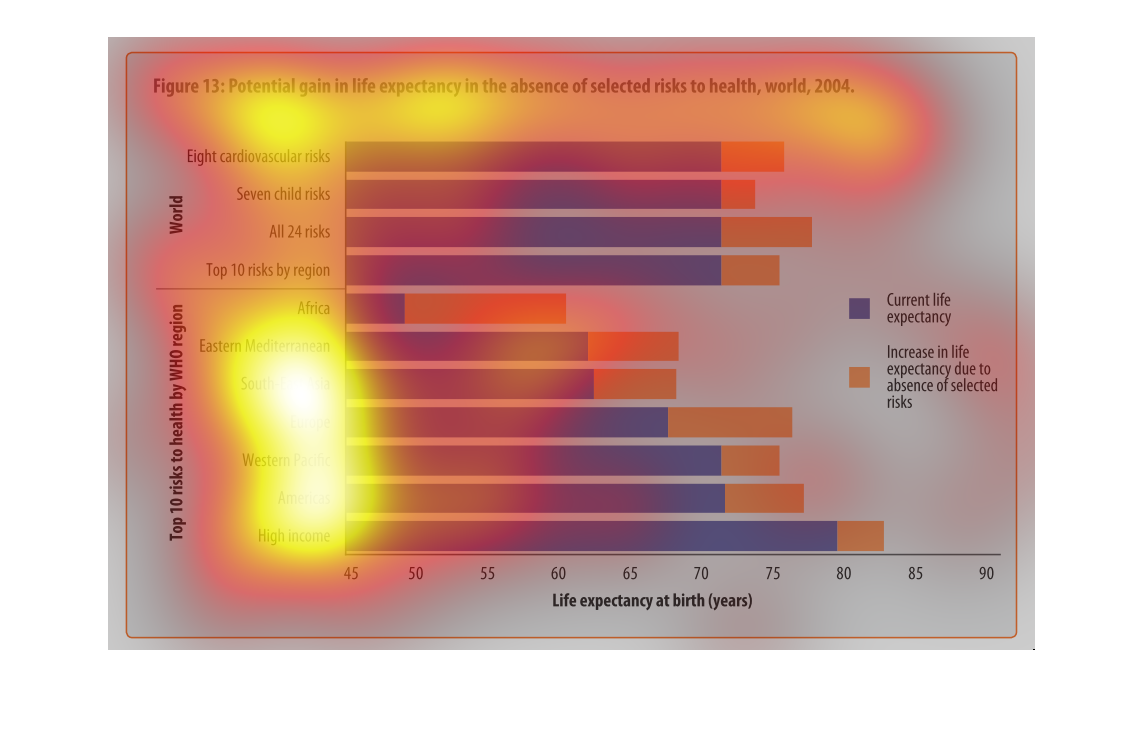
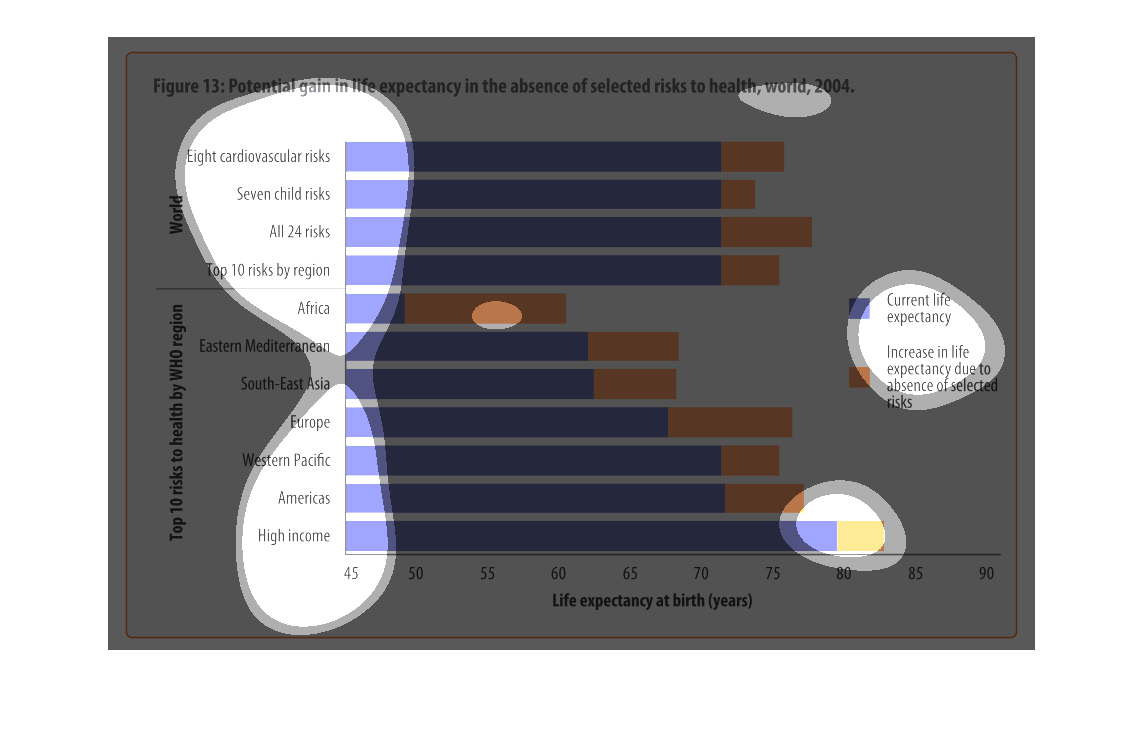
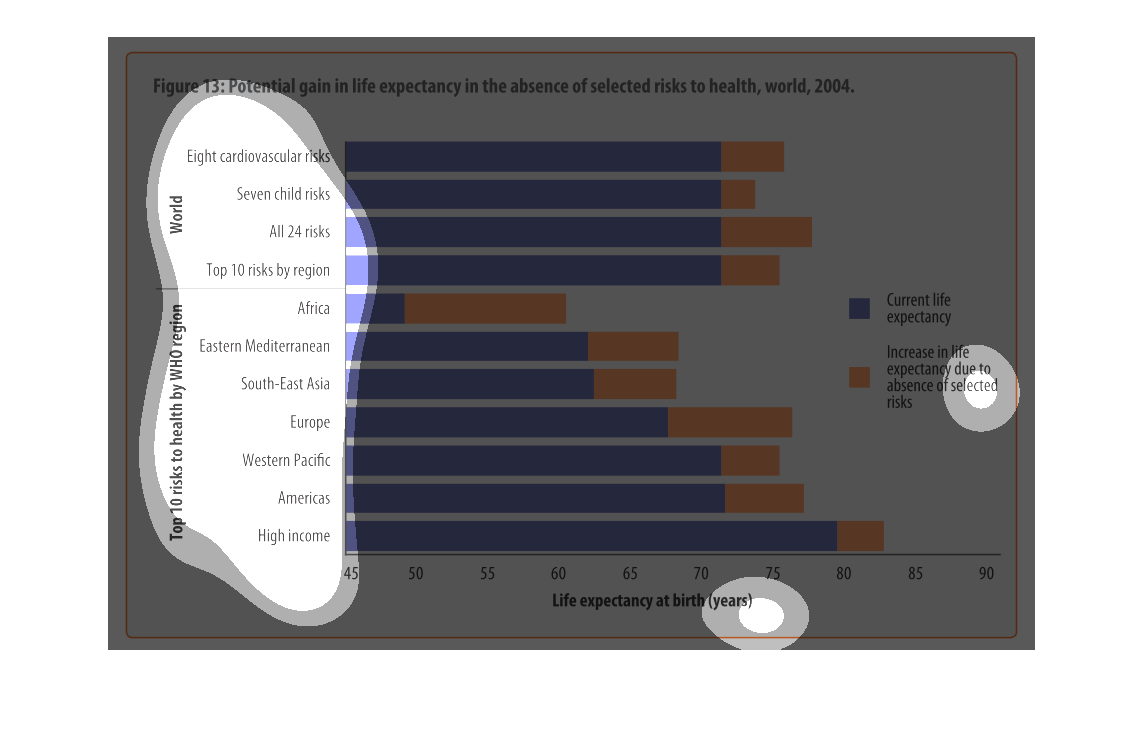
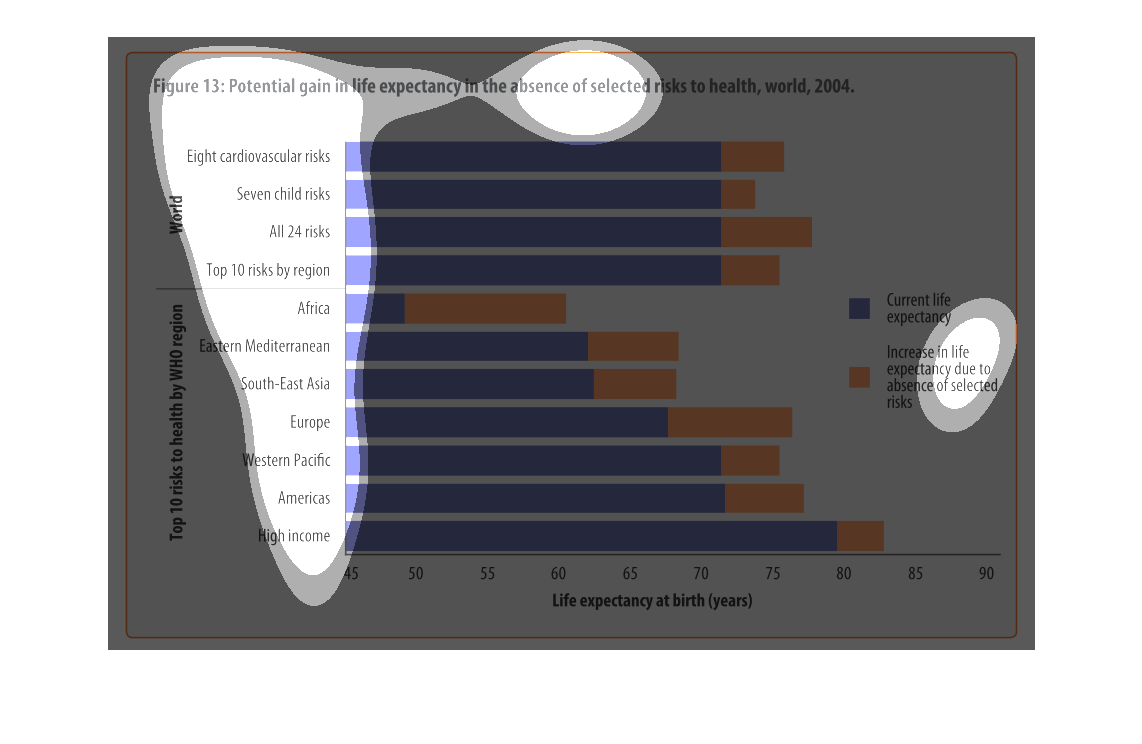
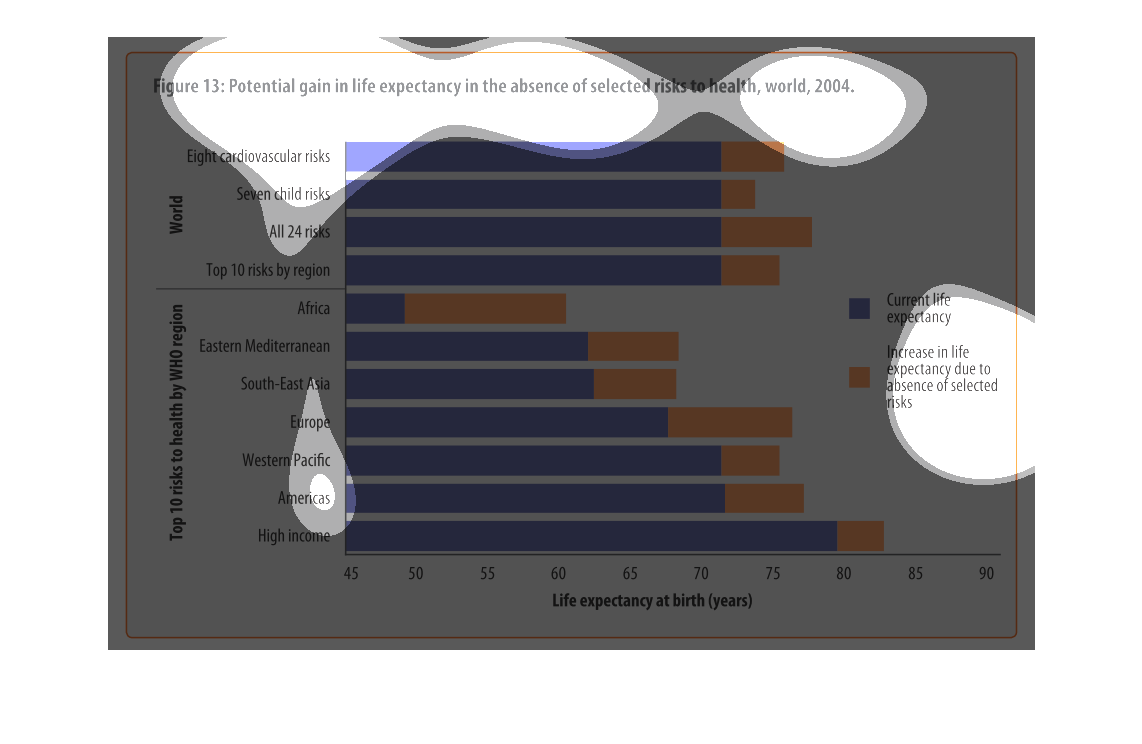
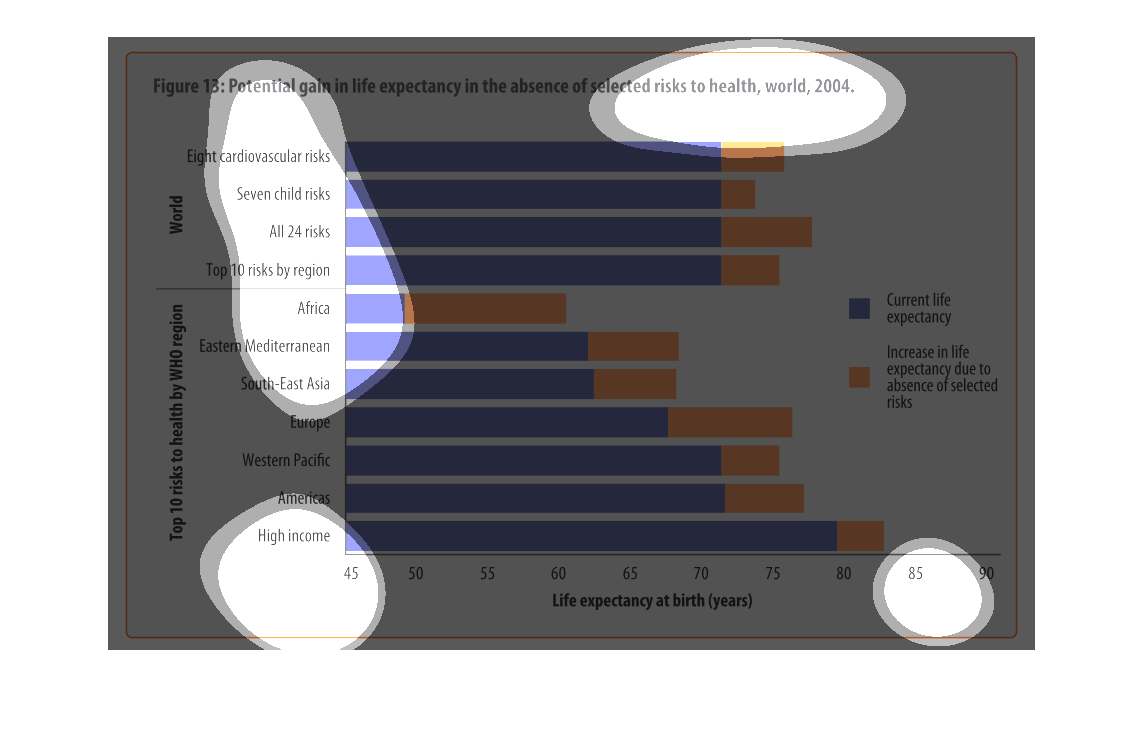
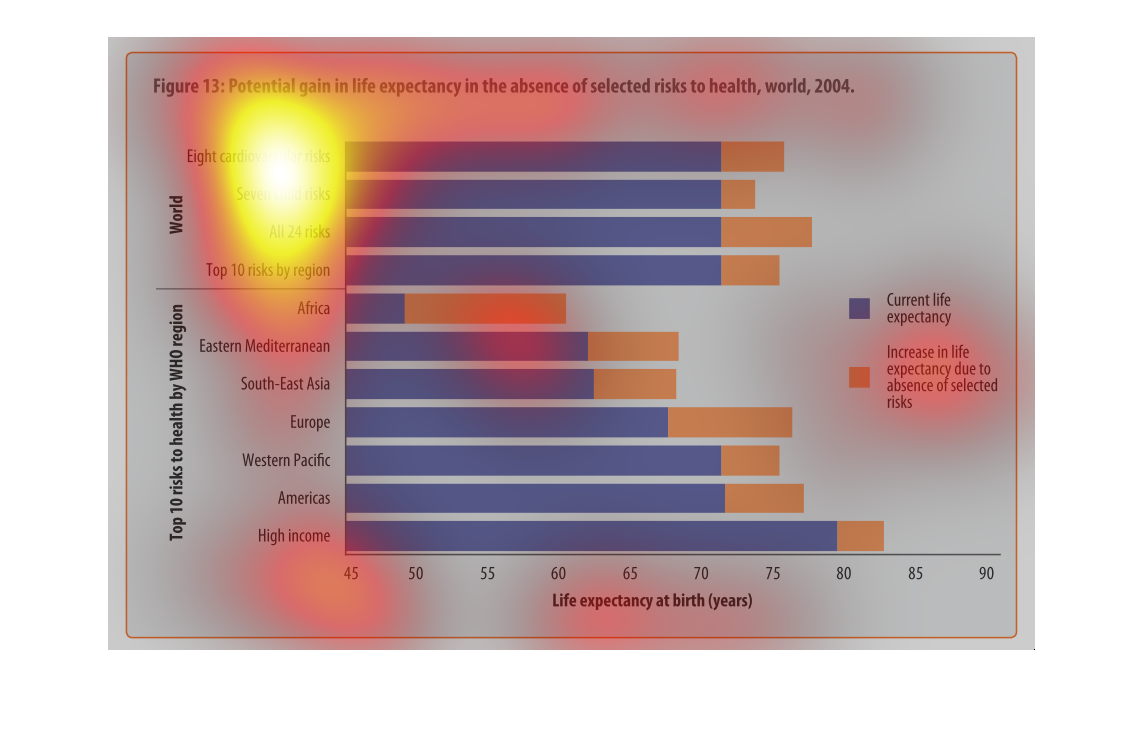
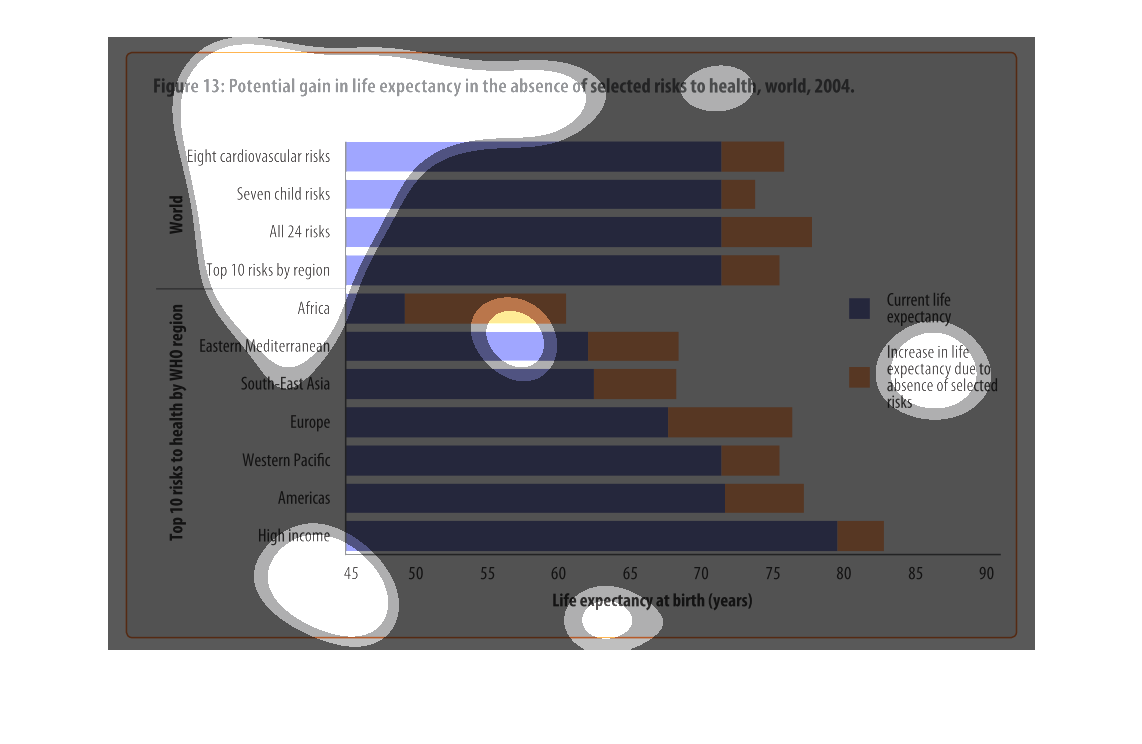
The figure presented is titled figure 13: potential gains in life expectancy in the absence
of selected risks to health, world, 2004.  The figure is a bar graph.
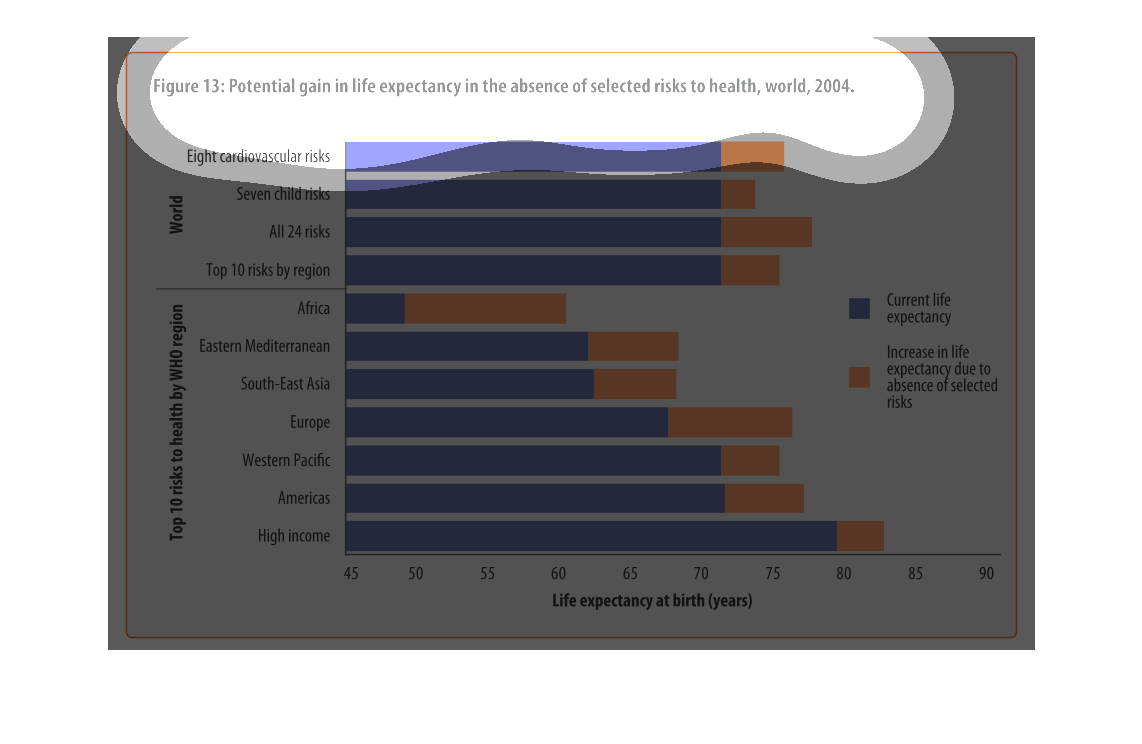
This is a series of bar graphs depicting the potential gain of life expectancy in the absence
of selected risks to health throughout the world in the year 2004.
This chart measures the gain in life expectancy in the absence of certain health risks around
the world.(2004)   Africa had the most substantial gain, while those with high income started
with life expectancies better than all other groups even before the gain was applied. The
seven child risks showed the least improvement.
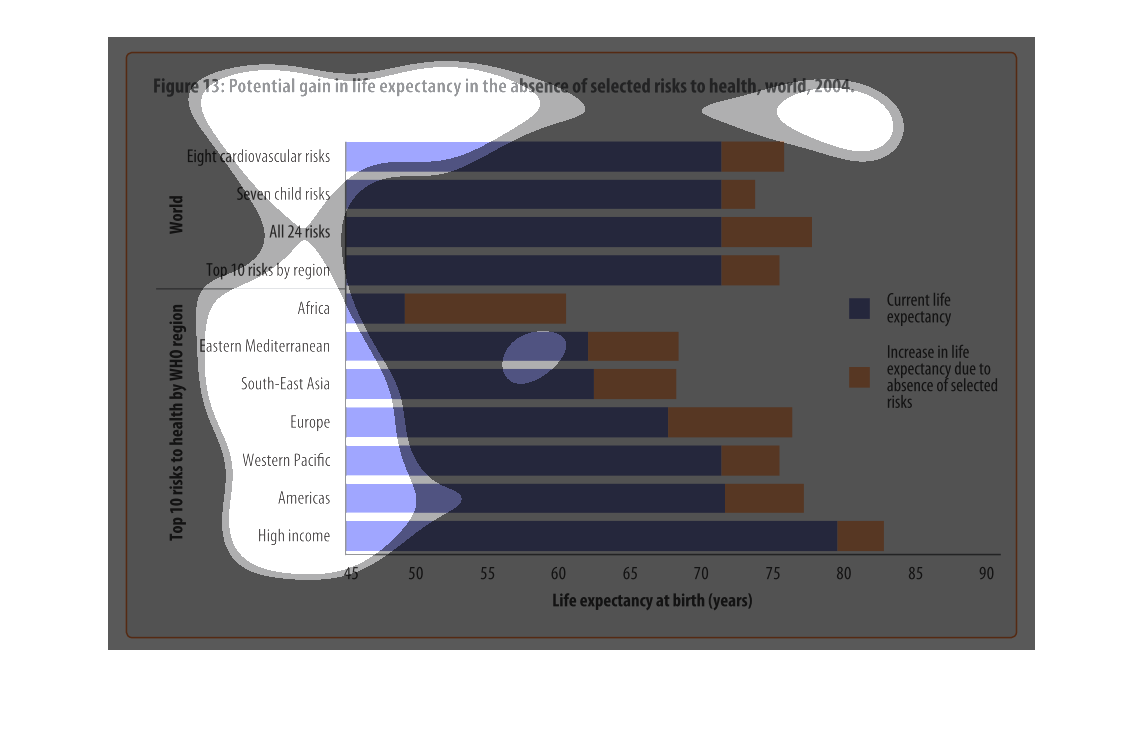
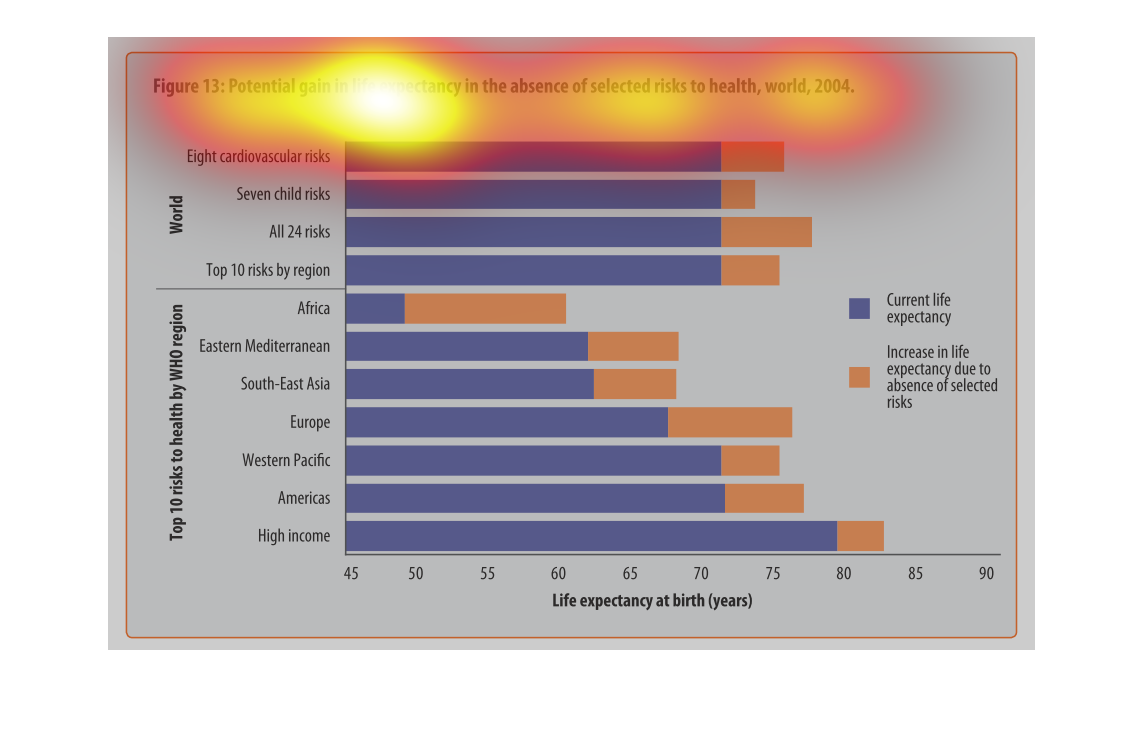
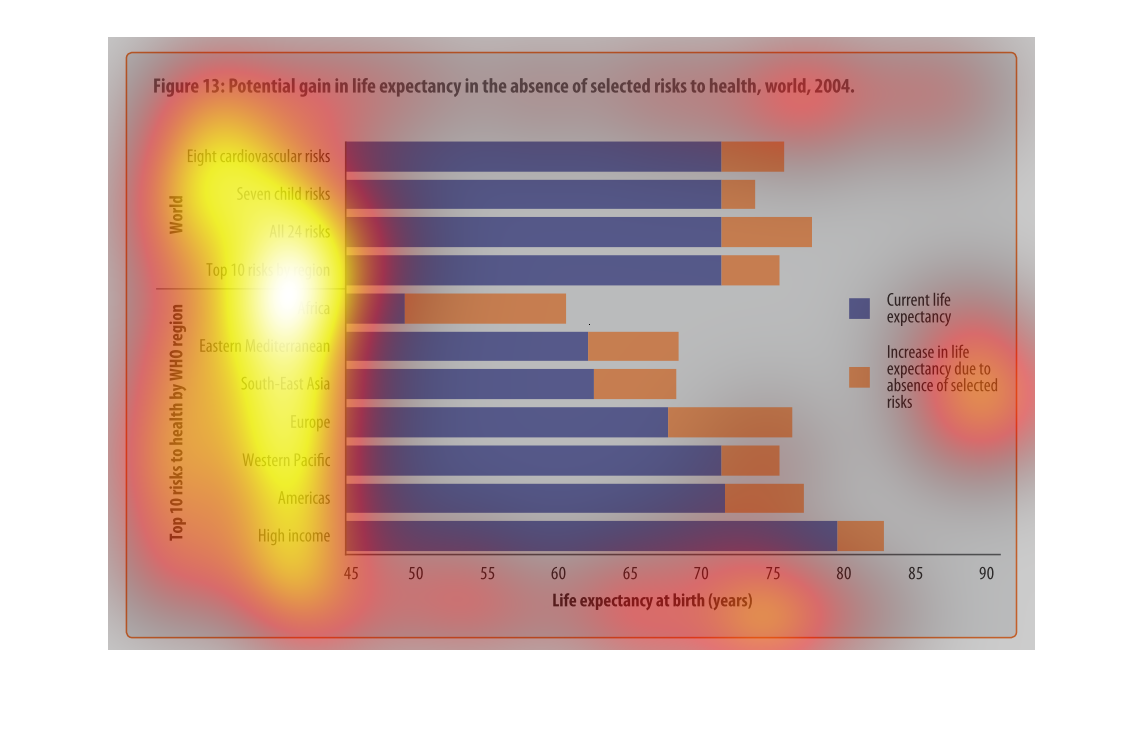
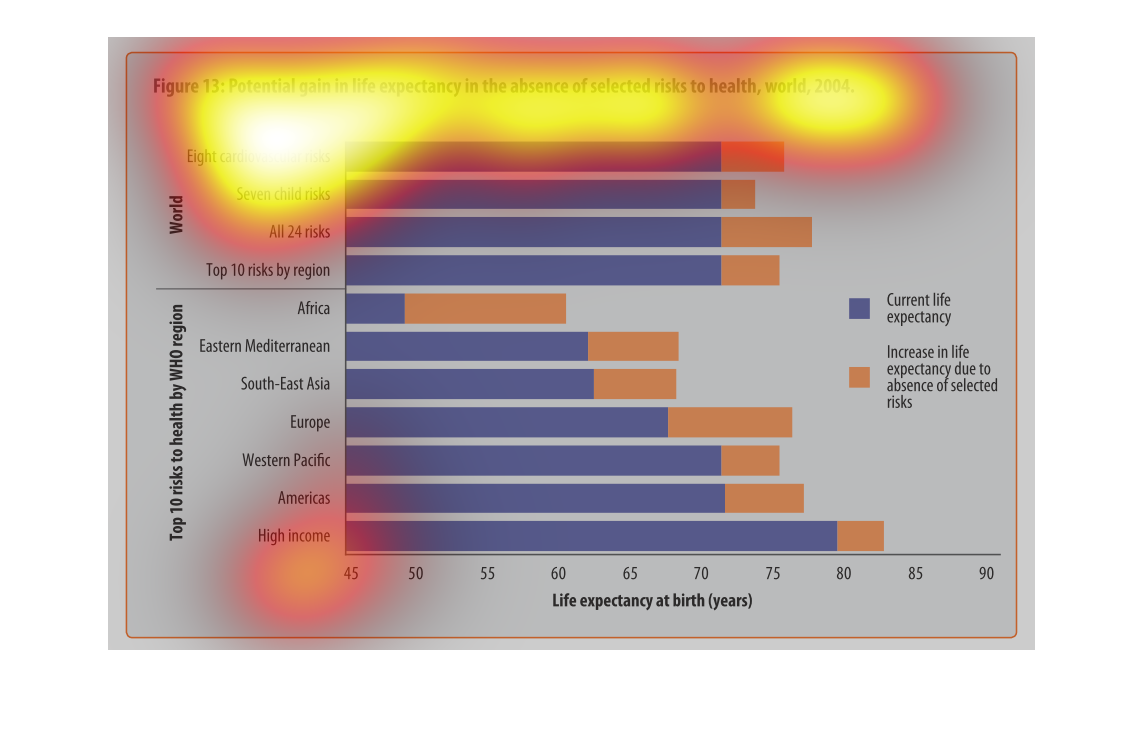
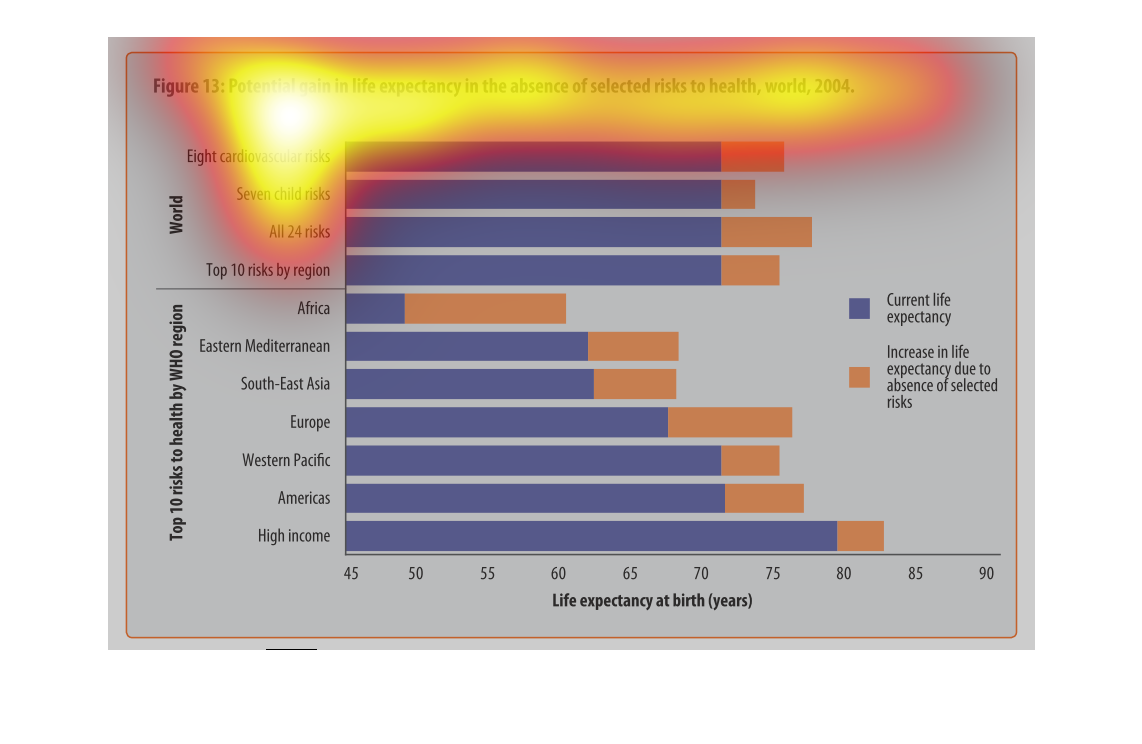
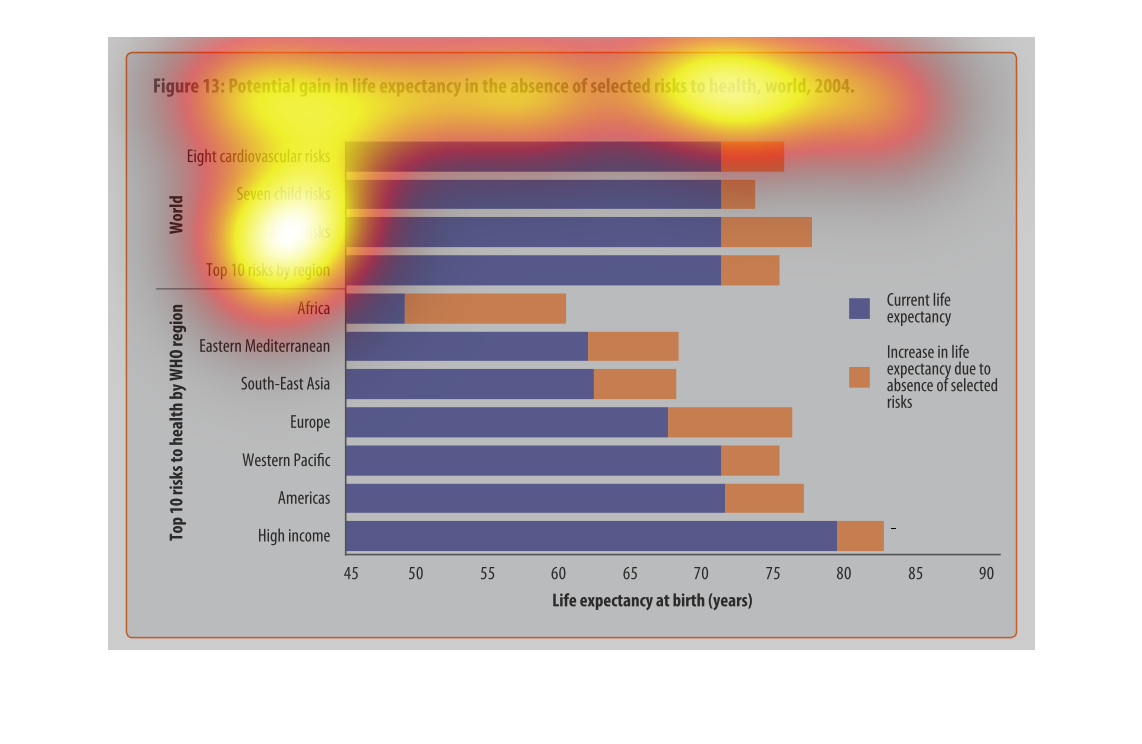
This info graphic shows the average life expectancy when certain health factors aren't present.
In other words it shows how longevity would increase.
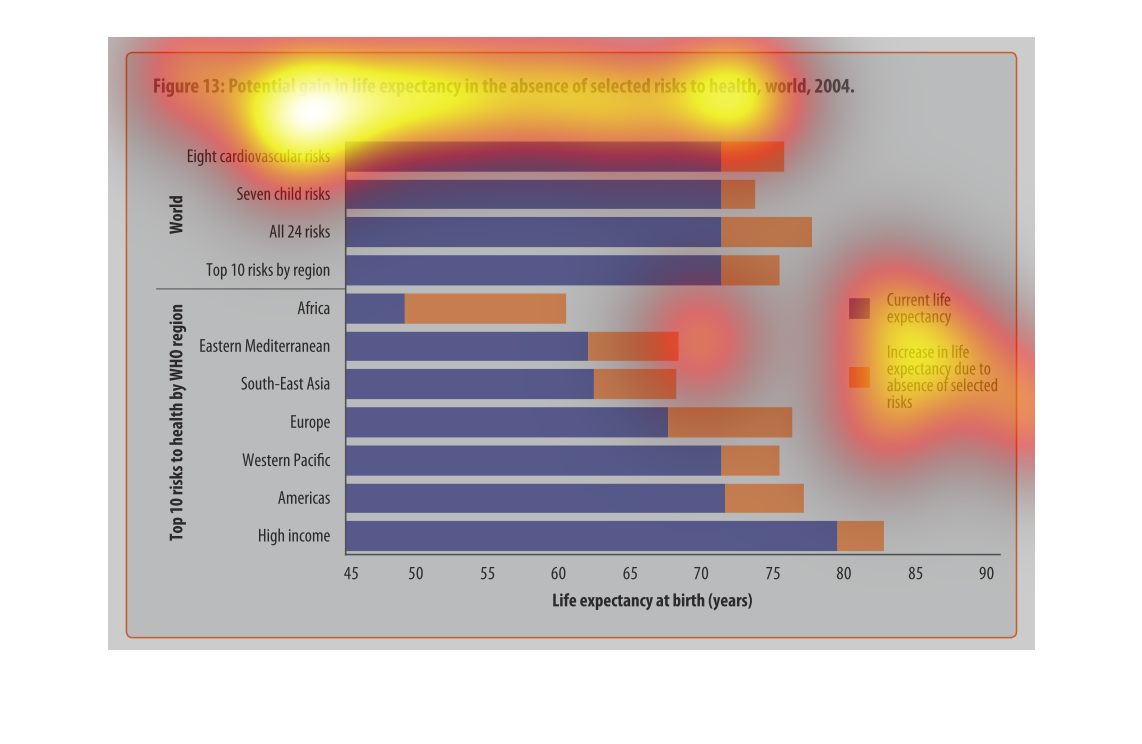
This chart shows the potential gain in life expectancy in the absence of selected risks to
health and world. This study was conducted in the ear 2004. It shows the top ten risks to
health as conducted by WHO region.
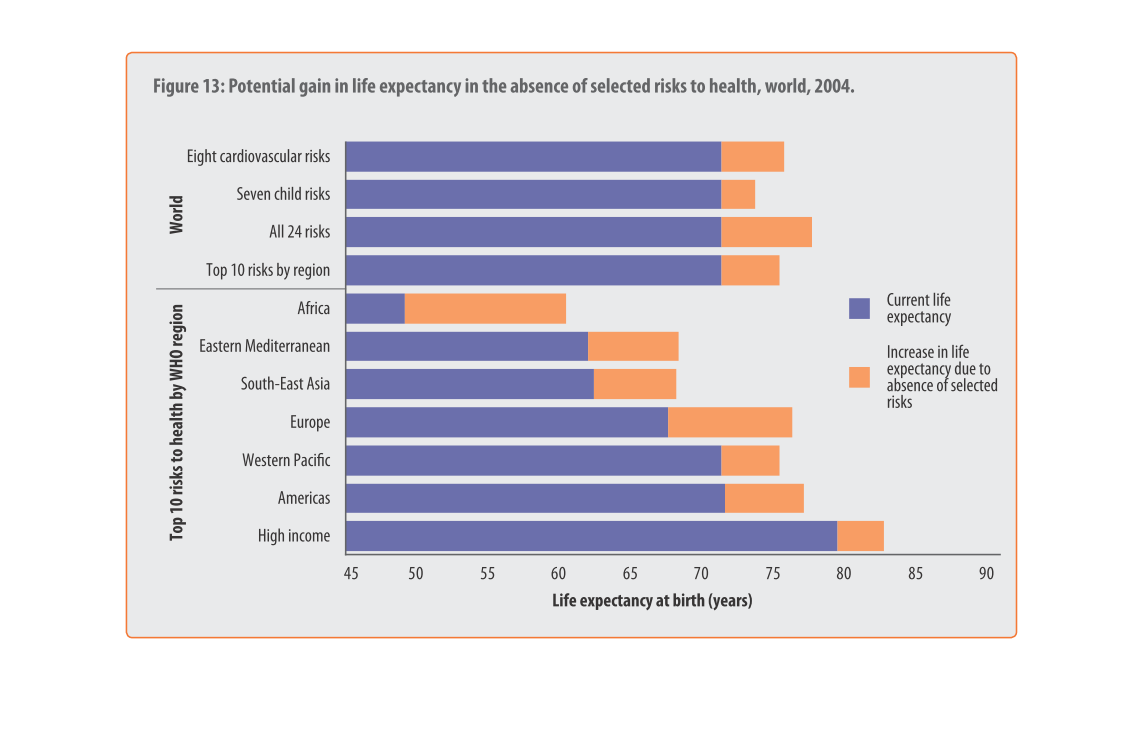
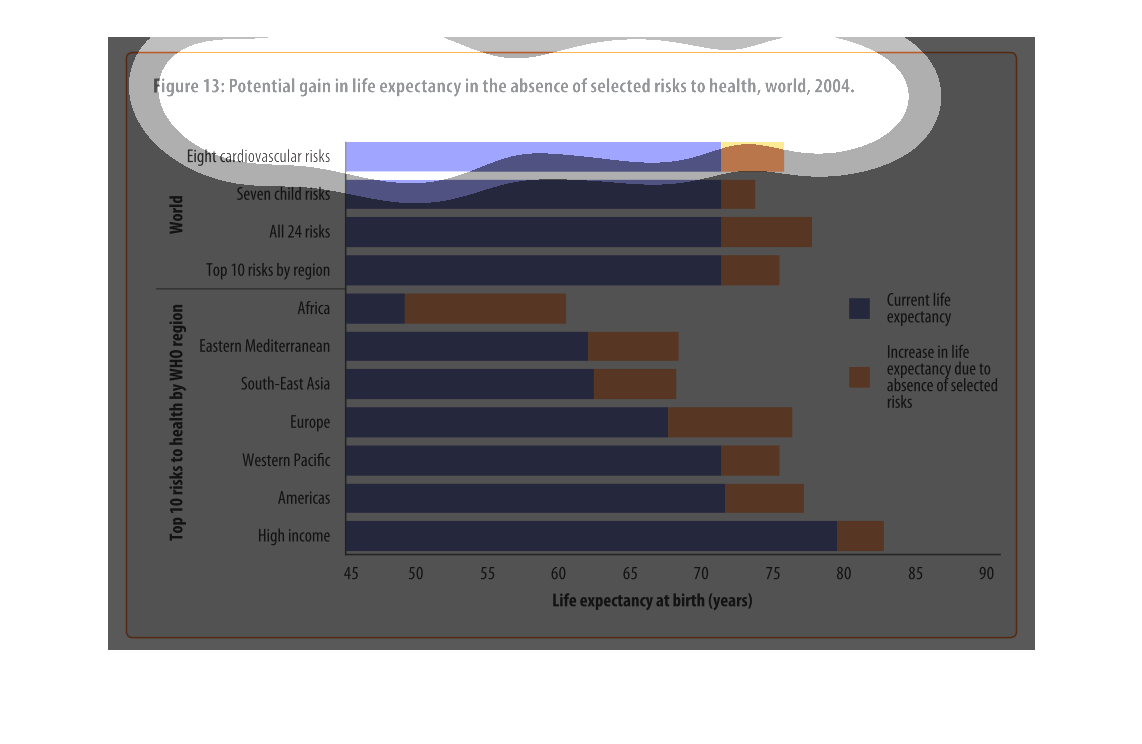
This chart/graph demonstrates potential gains in the absence of selected risks of health world
as of 2004. The number one on the chart is high income.
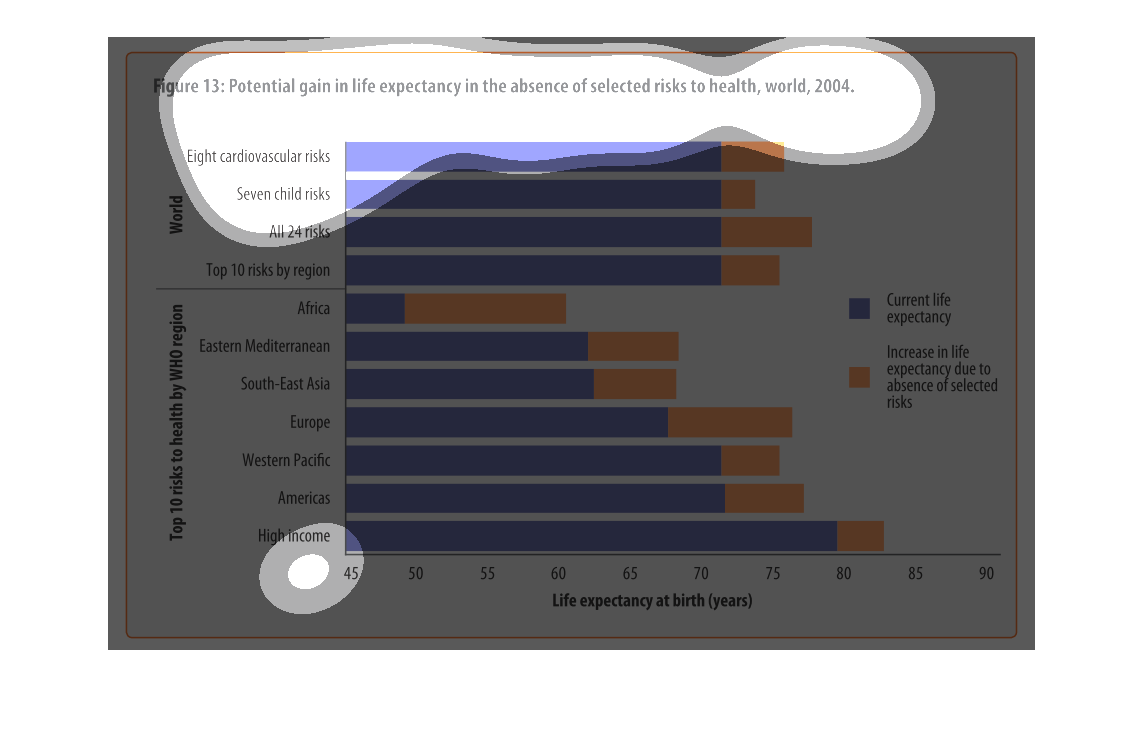
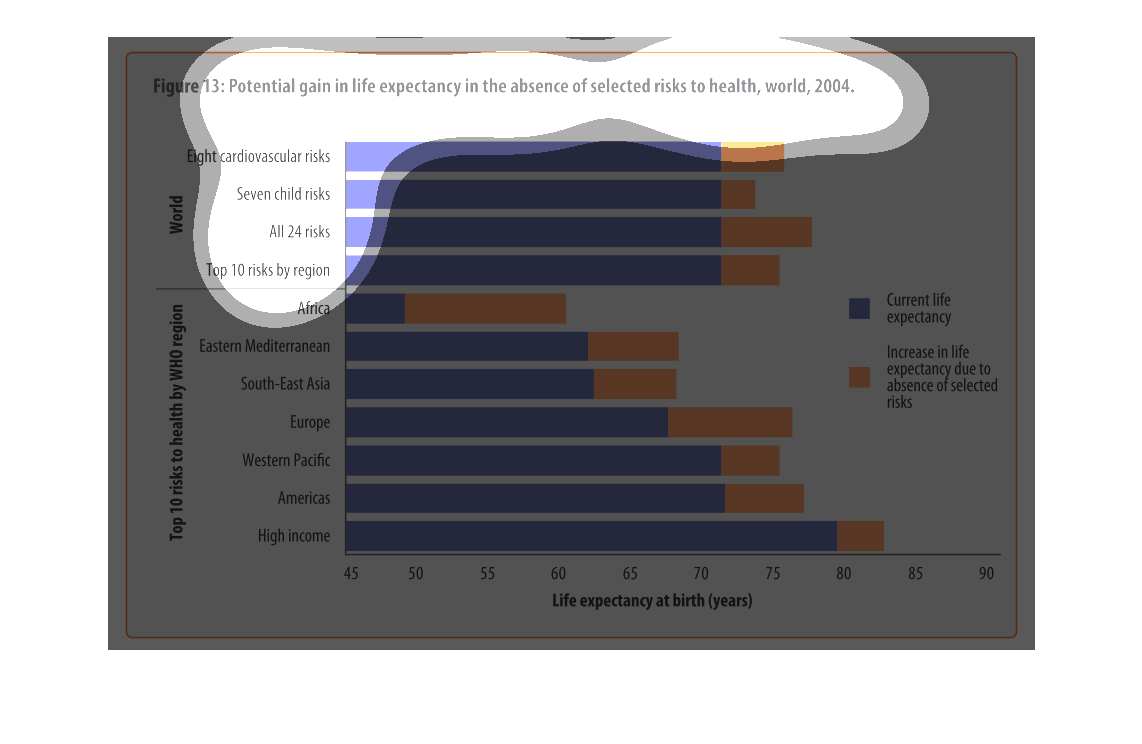
The chart shows the potential gain in life expectancy in the absence of selected risks to
heath in the world in 2004.  The risks include cardiovascular, child risks, etc.  It also
shows life expectancy by global region.
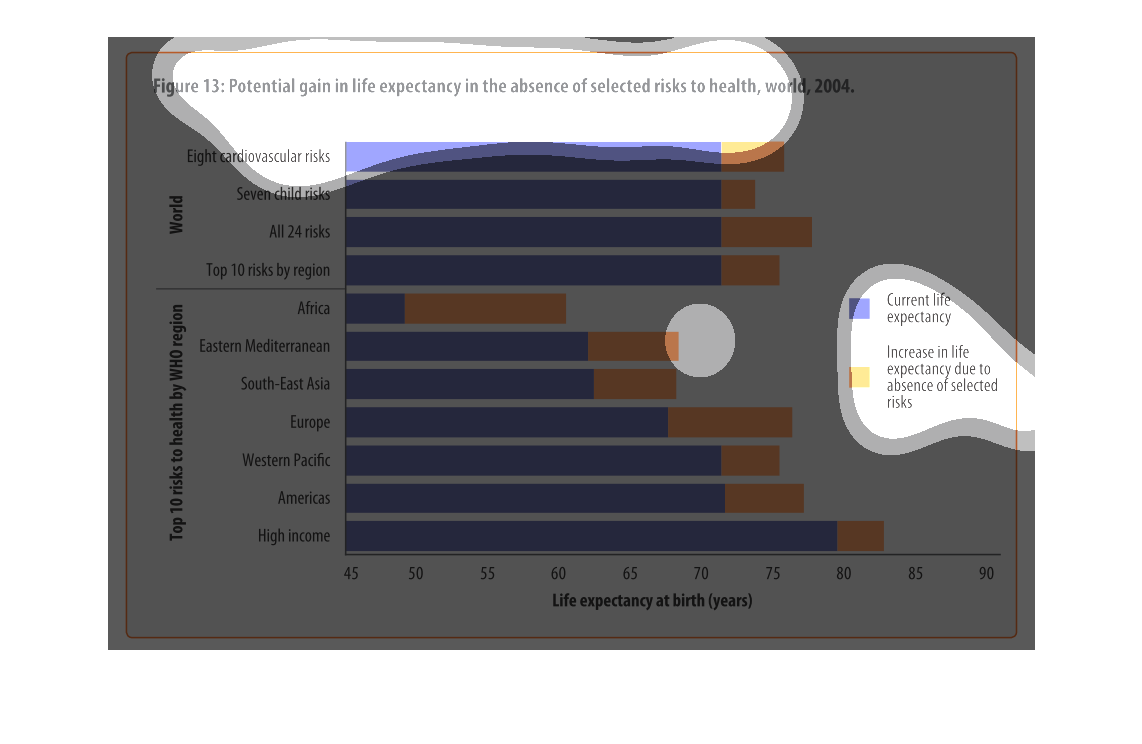
This chart describes potential gain in life expectancy in absence of selected risks to health,
world, for the year 2004. categories on the chart include seven child risks.
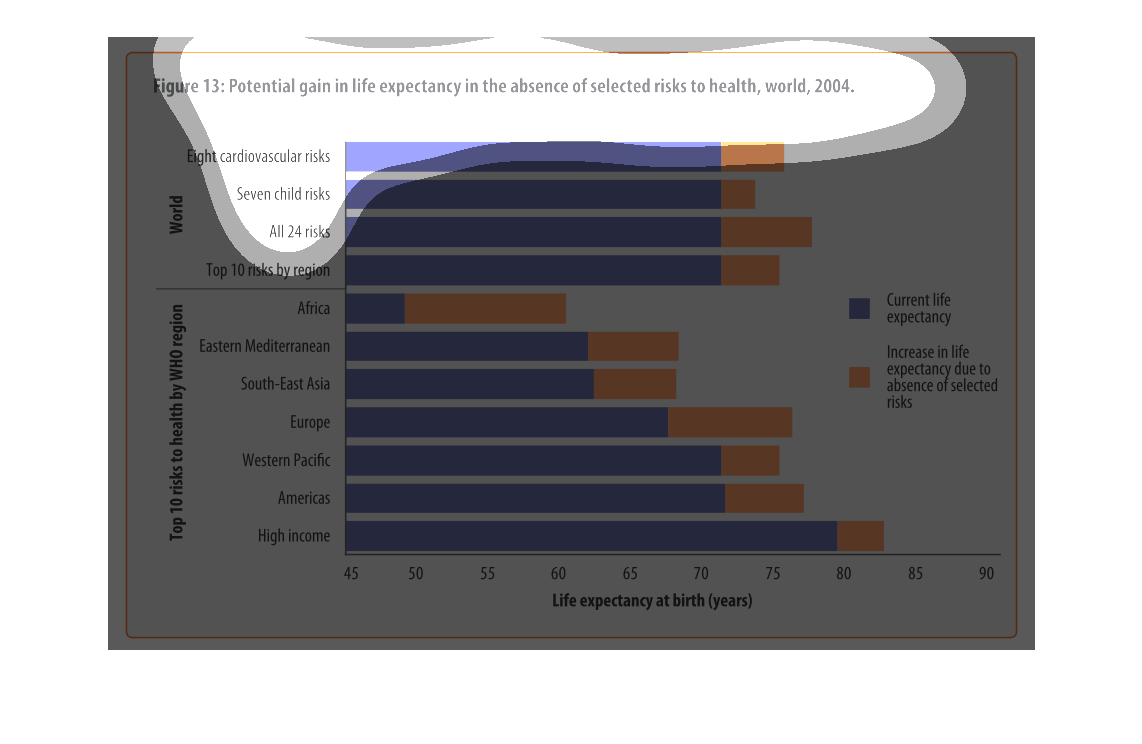
This graph shows "Potential Gain in the Life Expectancy in the absence of selected risks to
health, world, 2004.". In the blue it shows current life expectancy, and in the orange it
shows Increased life expectancy due to absence of selected risks. Along the left it shows
different countries.
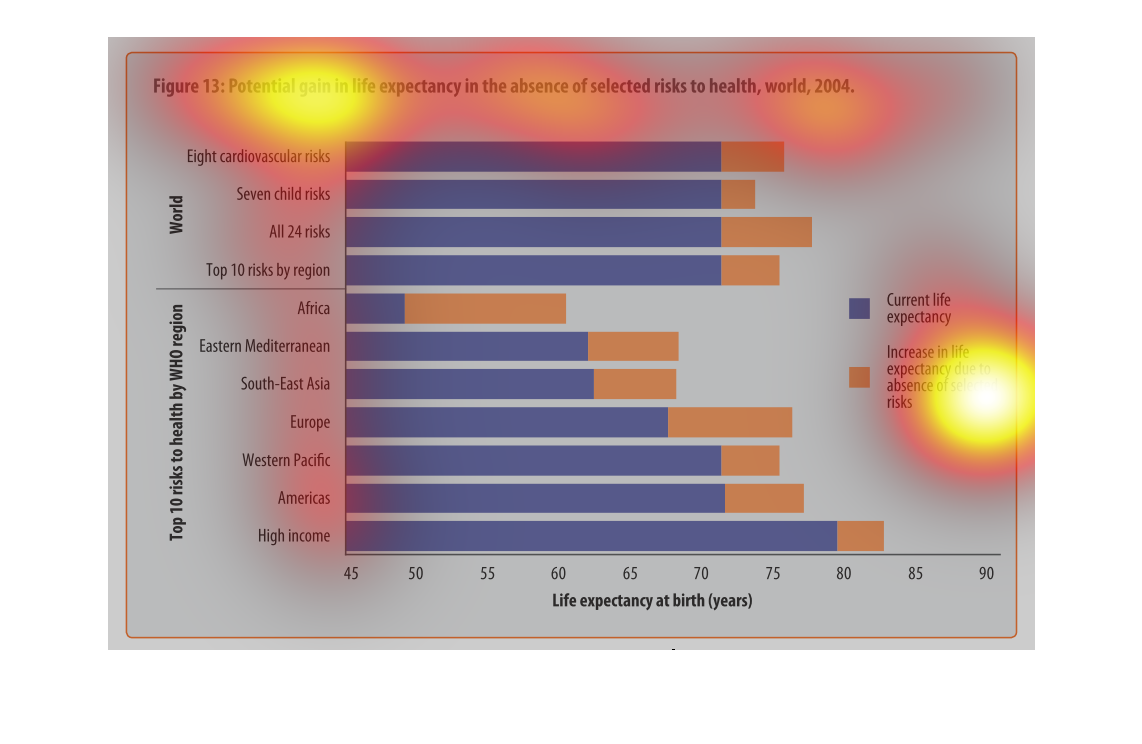
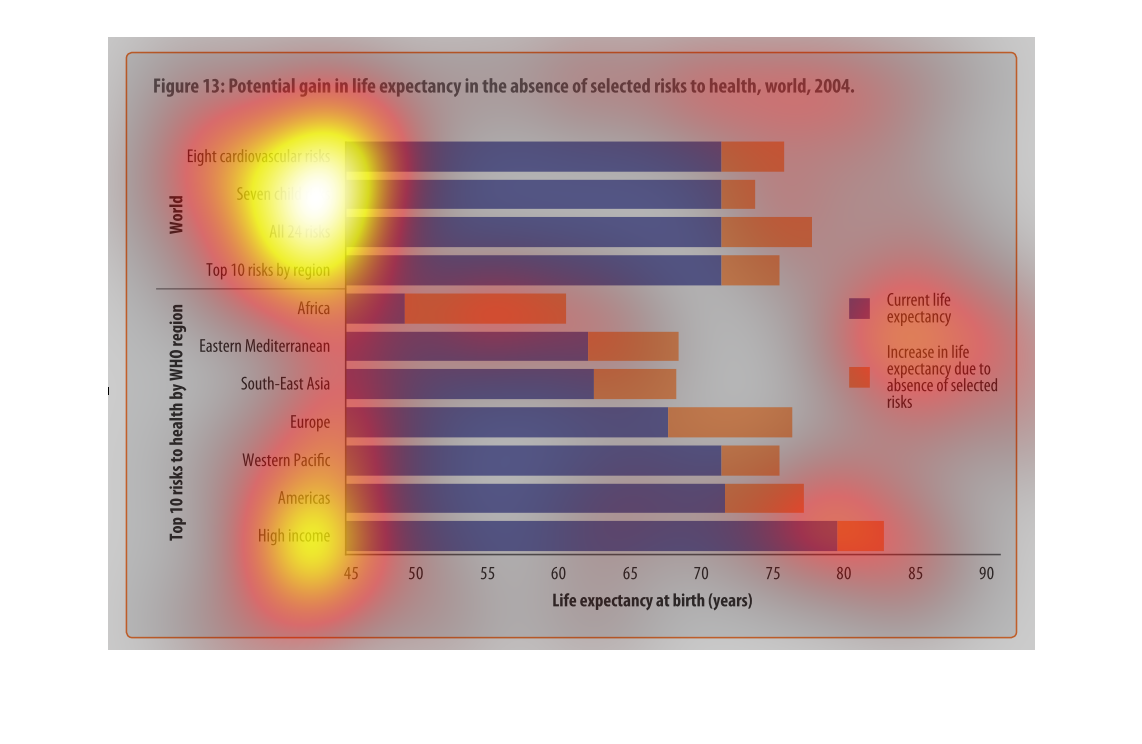
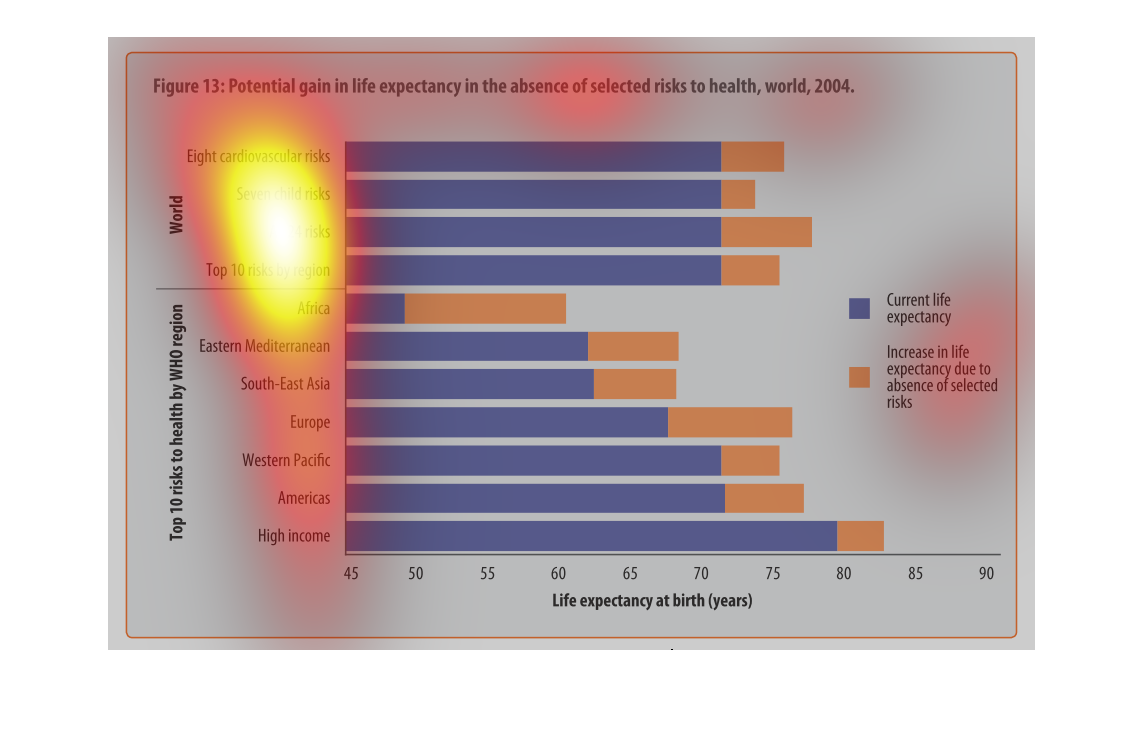
This chart describes potential gain in life expectancy in the absence of selected risks to
health, world for the year 2004. Categories on the chart include seven child risks.
This chart shows the potential gains in life expectancy. Being in Africa has the lowest life
expectancy but has the largest gain potential. The average life expectancy is still below
85 for all countries/risks. Having a high income allows a person to have the highest life
expectancy.
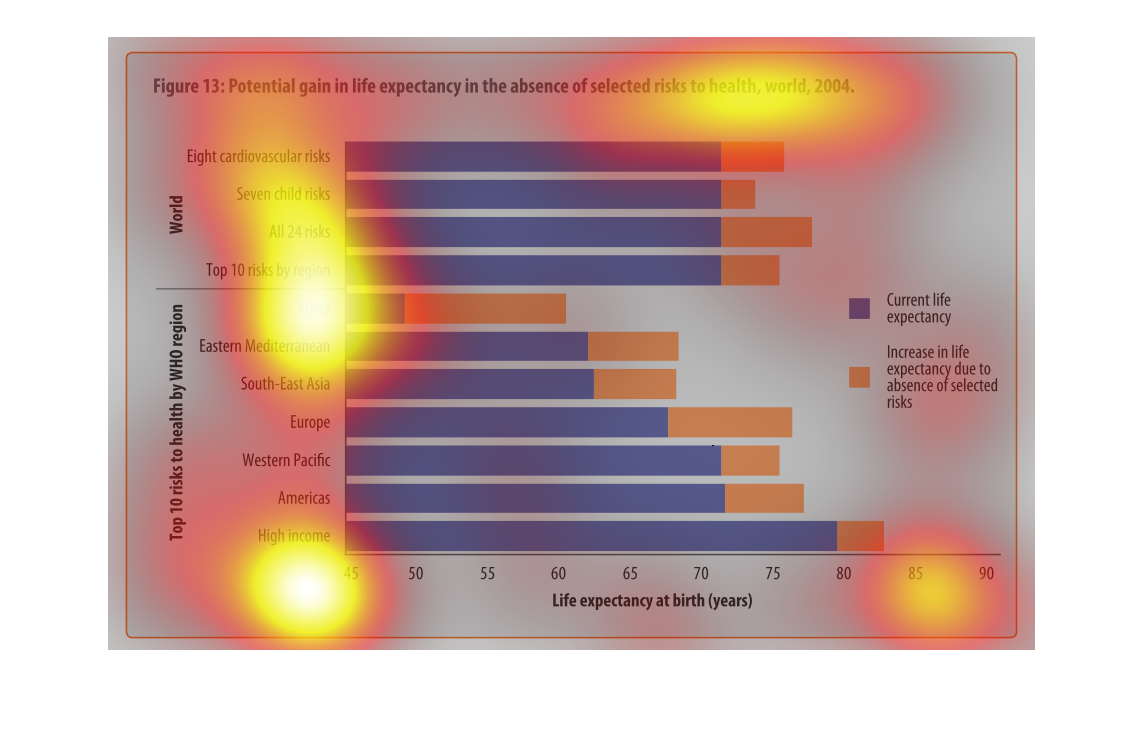
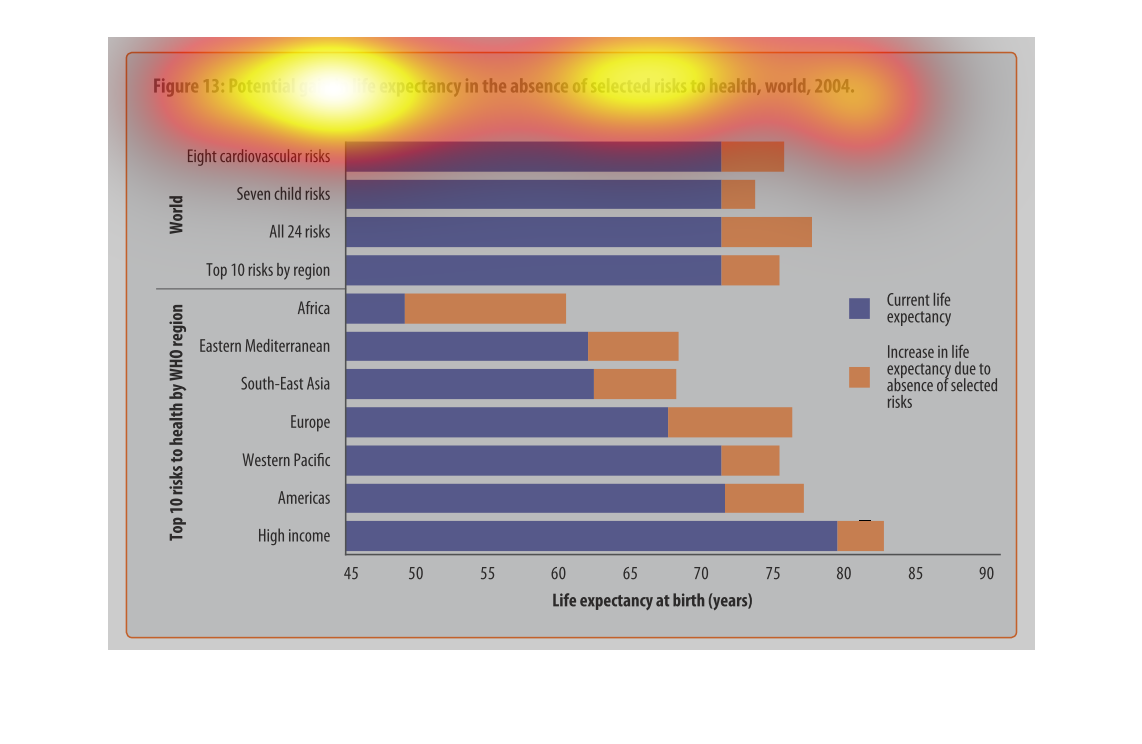
This chart is the expected gain in life expectancy with the absence of selected risks to health
from 2004. Broken down by things like cardio vascular and child risks. Those with high income
seem to have longest life expectancy. People in Africa would gain the most years by removing
certain risk from their environment.
In this 2004 study, which eliminates the potential for illness or any other major cause of
death, tries to illustrate how one could theoretically expect to live in each of these regions
of the world.