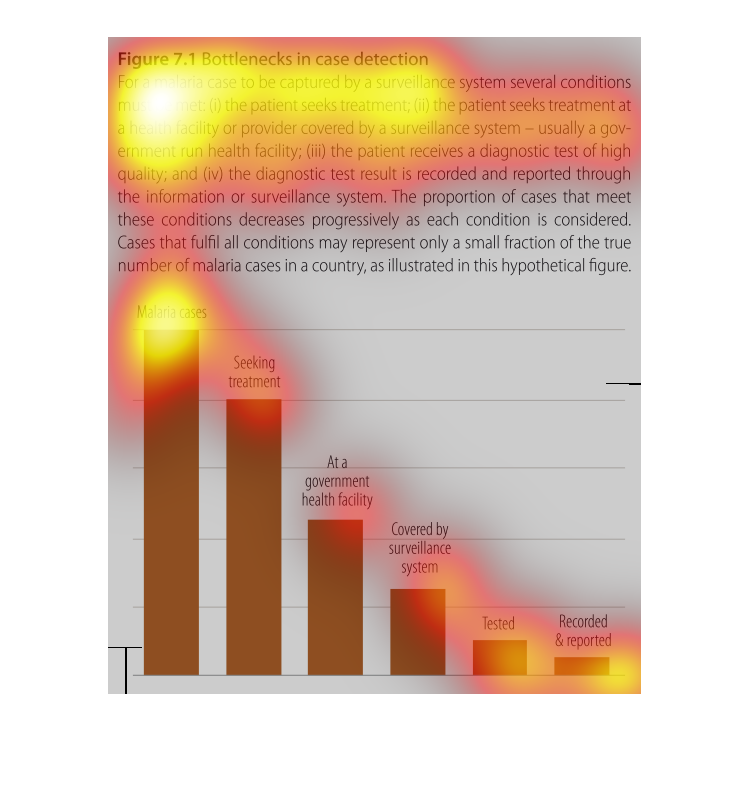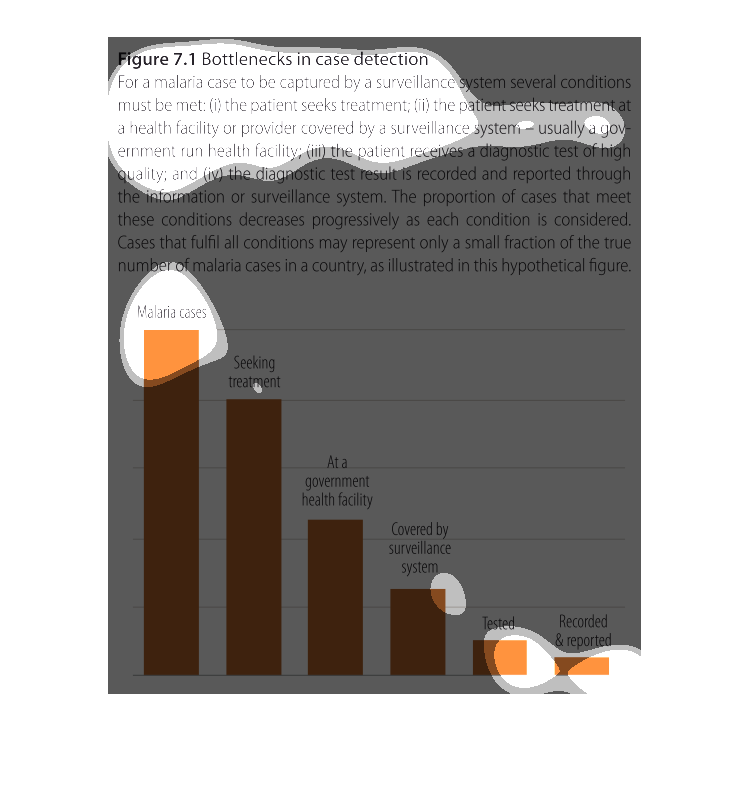
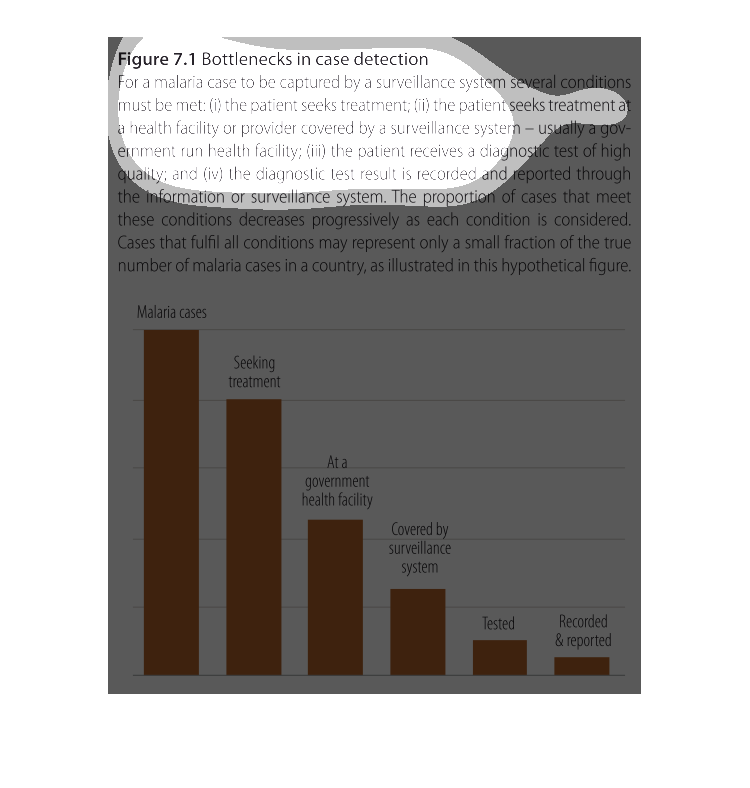
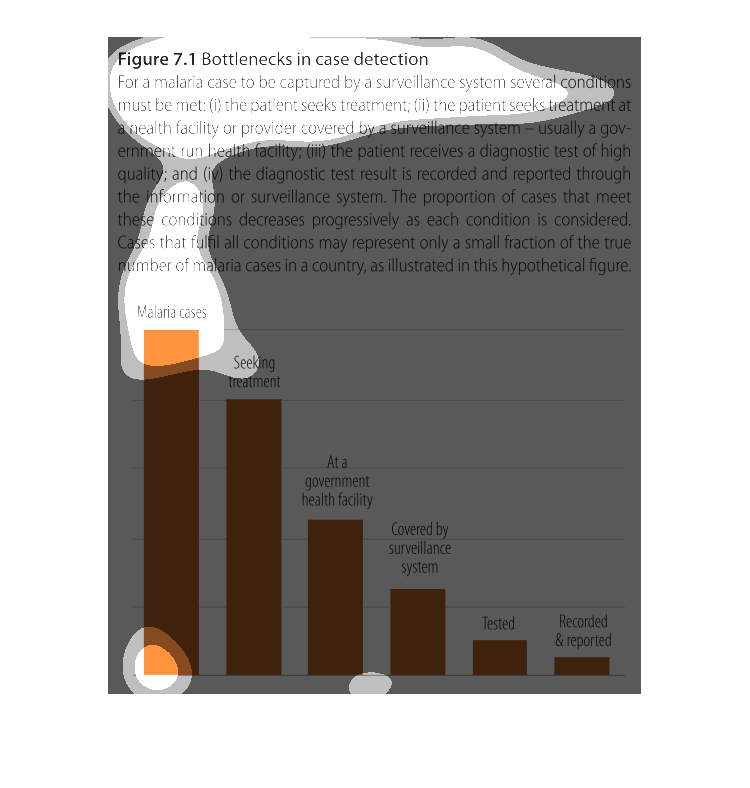
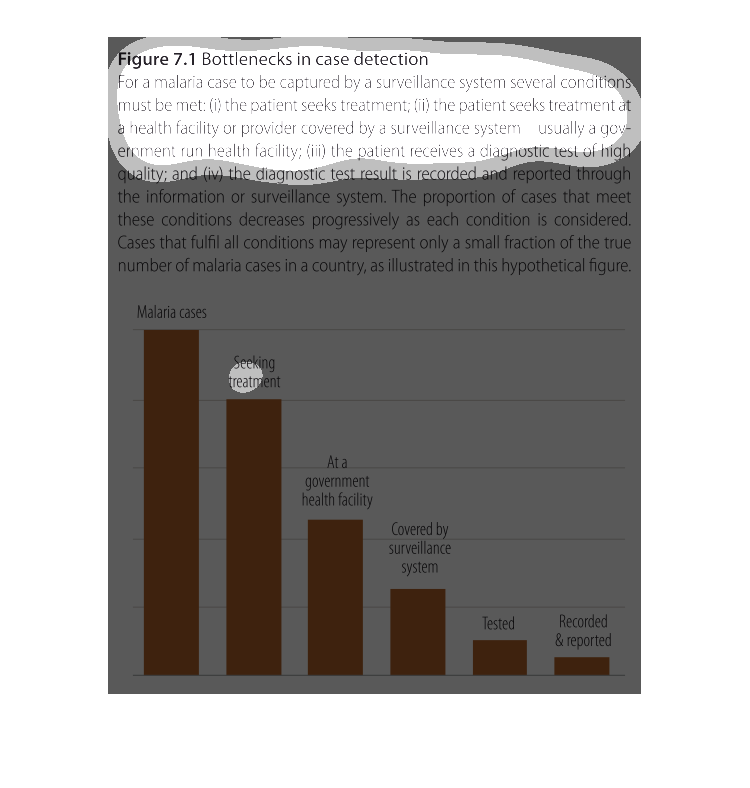
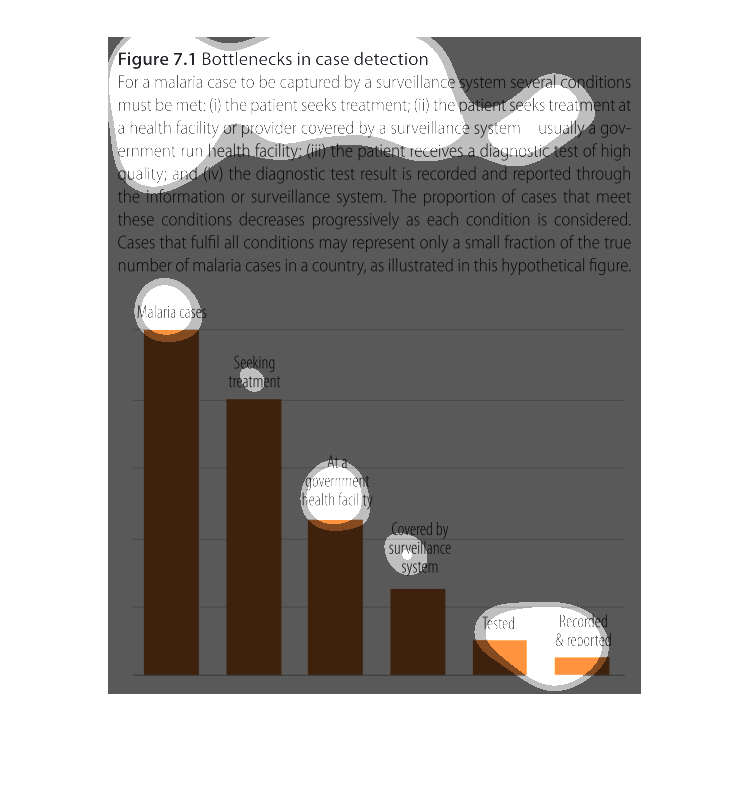
The figure presented is titled figure 7.1 bottlenecks in case detection.  The figure is an
actual representation of the number of bottlenecks in case detection.
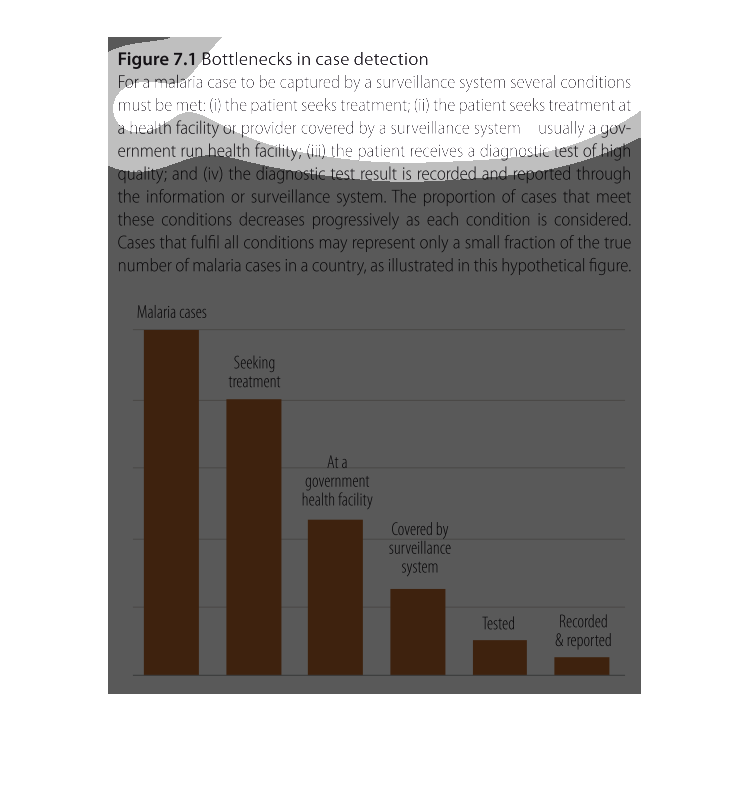
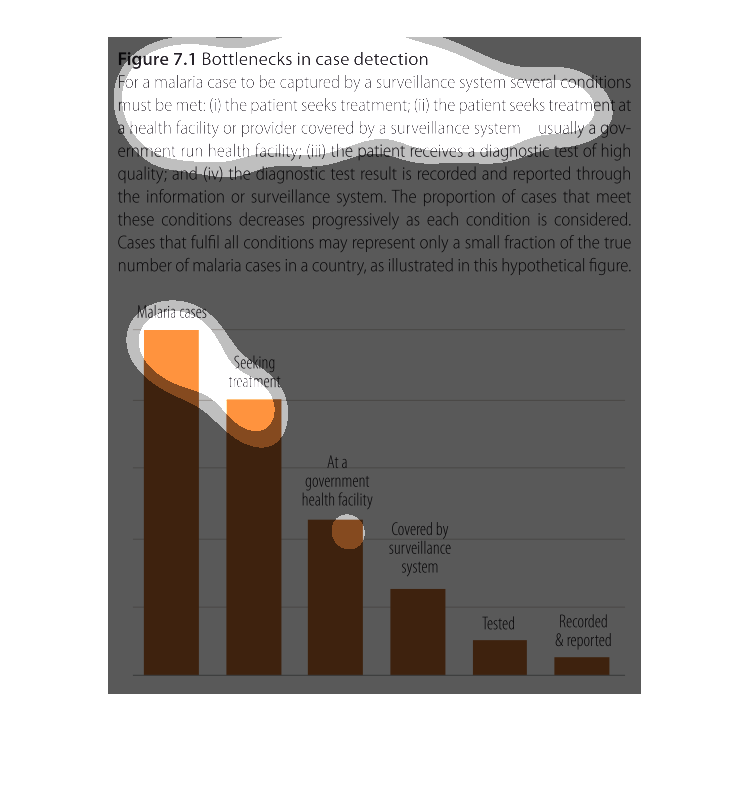
This graph lists the bottlenecks that plague case detection for malaria. The first bar shows
the amount of cases, while subsequent decreasing bars show the amount that make it through
the system and are actually captured and recorded in the end.
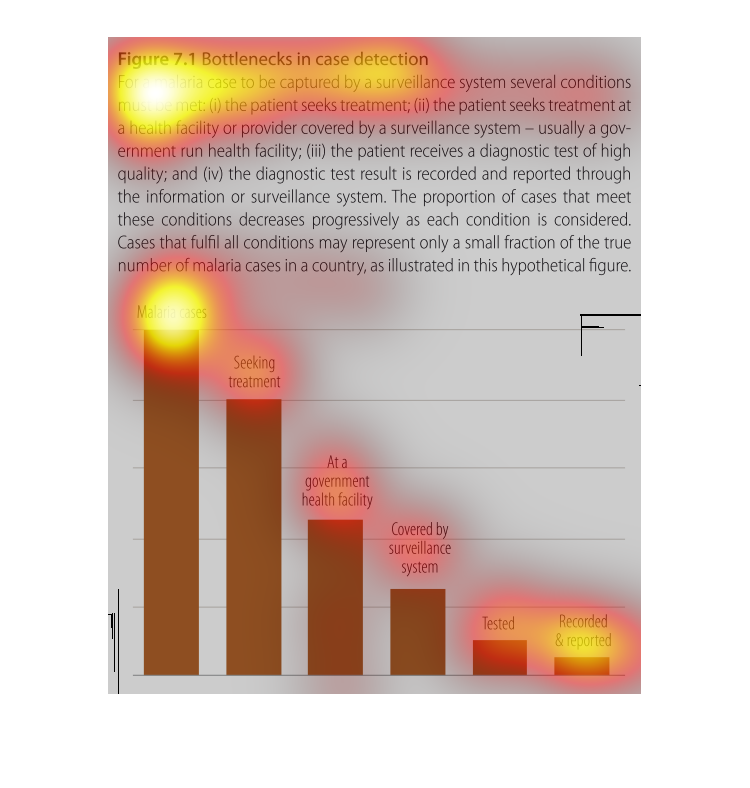
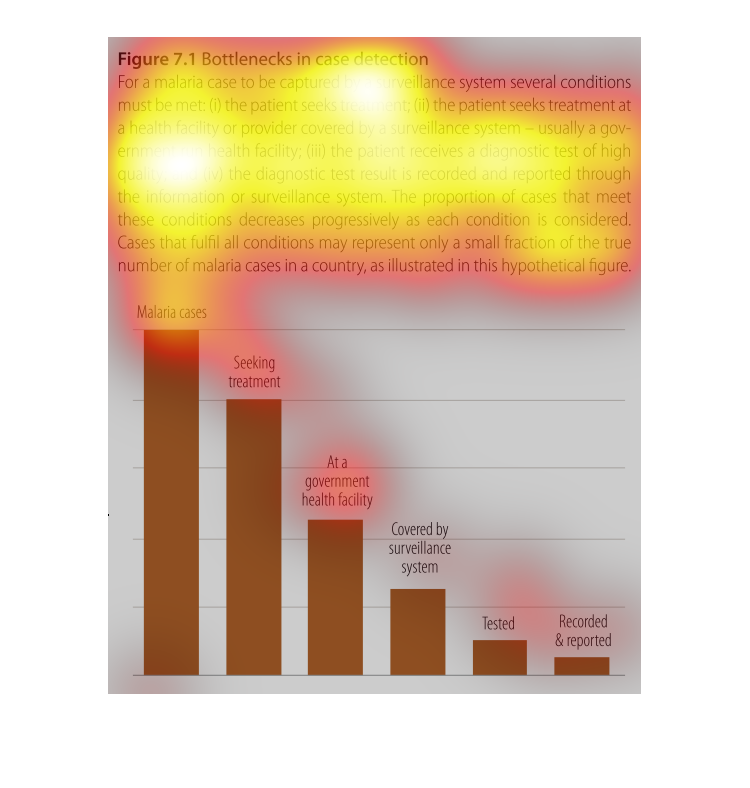
This chart describes bottlenecks in case detection for malaria case to be captured by a surveillance
system several conditions must be met: the patient seeks treatment.
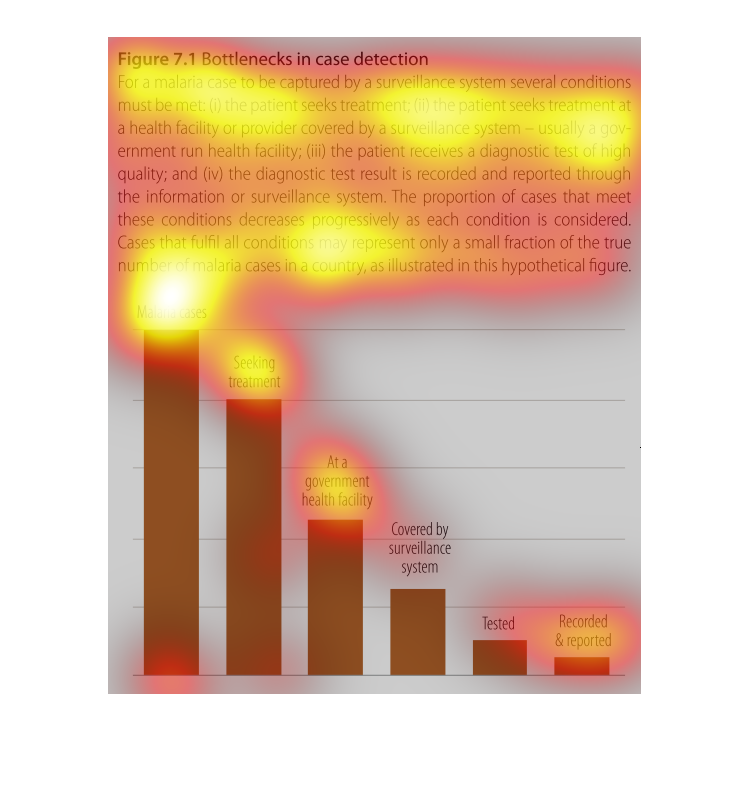
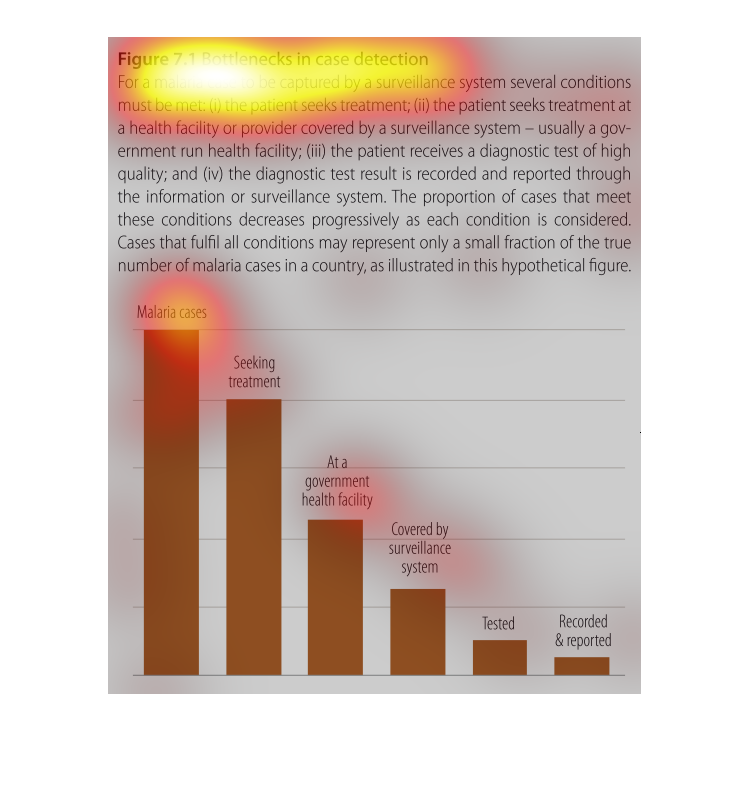
This chart describes bottleneck in case detection. Specifically, for a malaria case to be
captured by a surveillance system, several conditions have to be met.
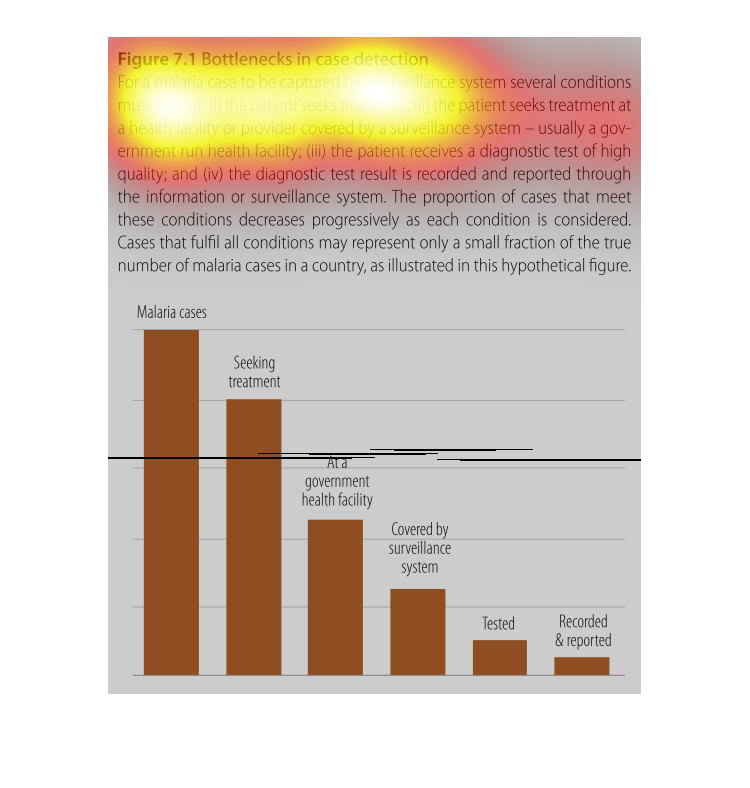
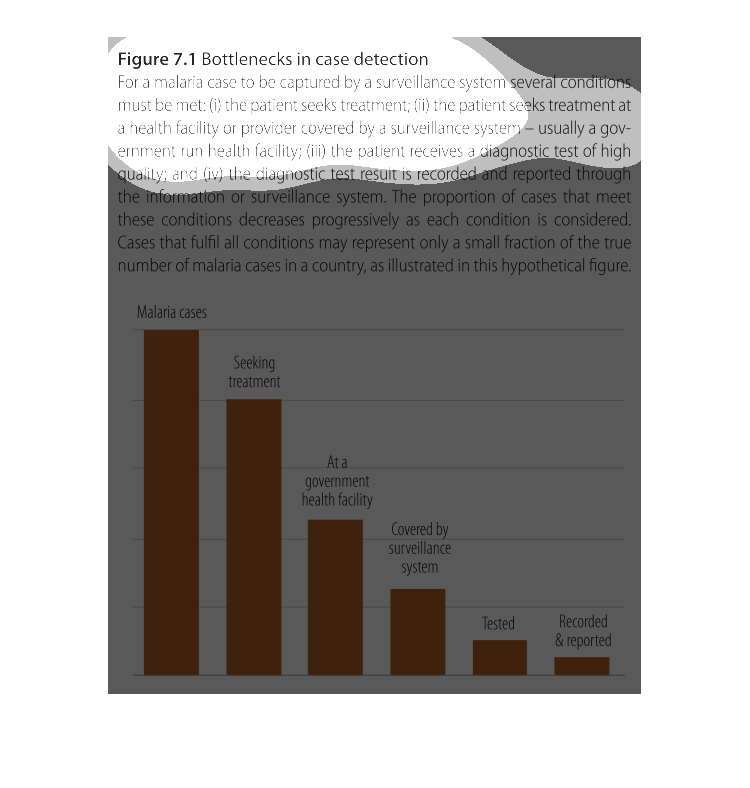
figure 17.1 bottlenecks in cause detection. a small blip about malaria diagnosis, Y axis is
nonexistent. X axis is not labeled but we see bars representing different aspects of malaria
detection and treatment
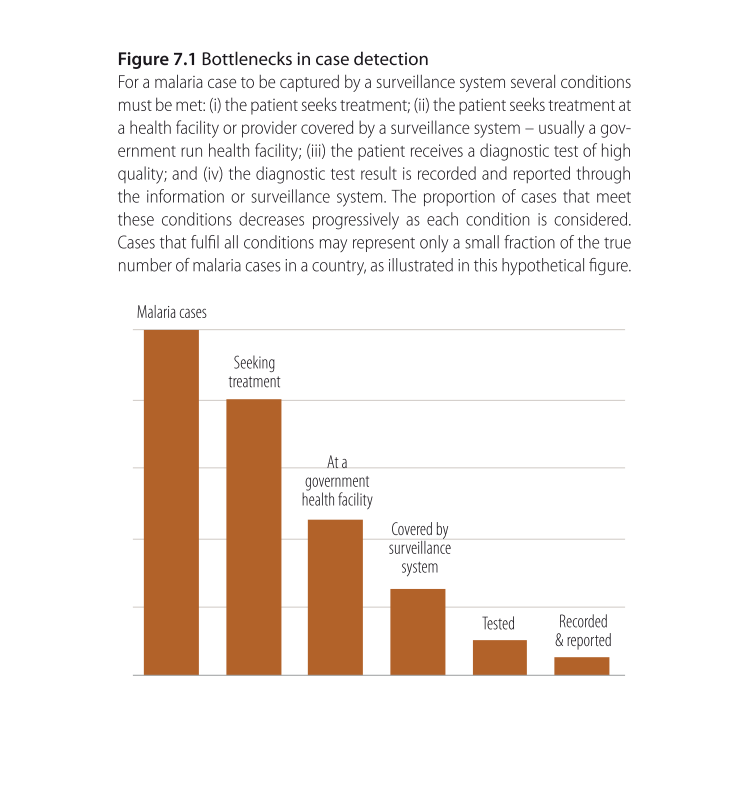
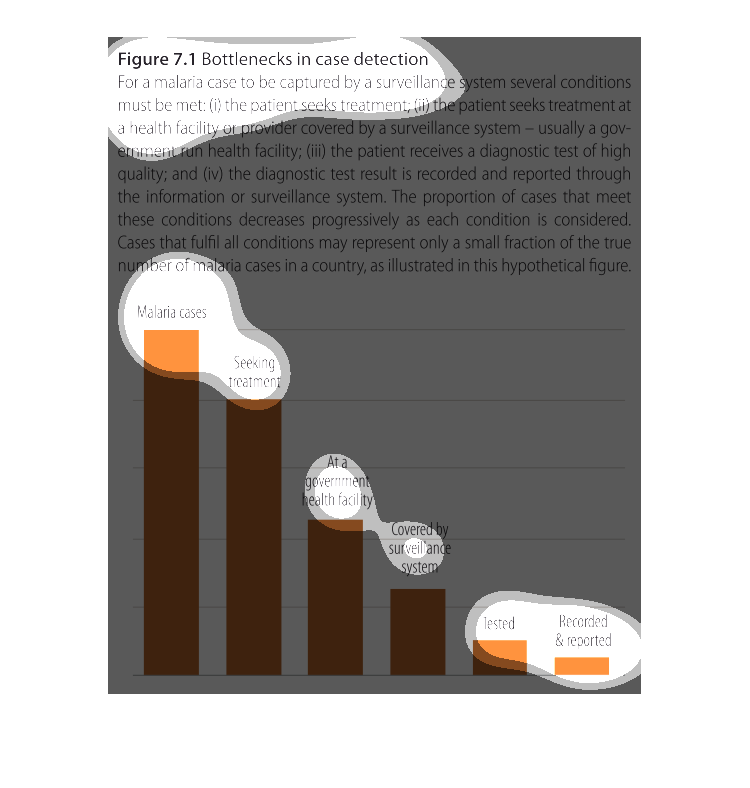
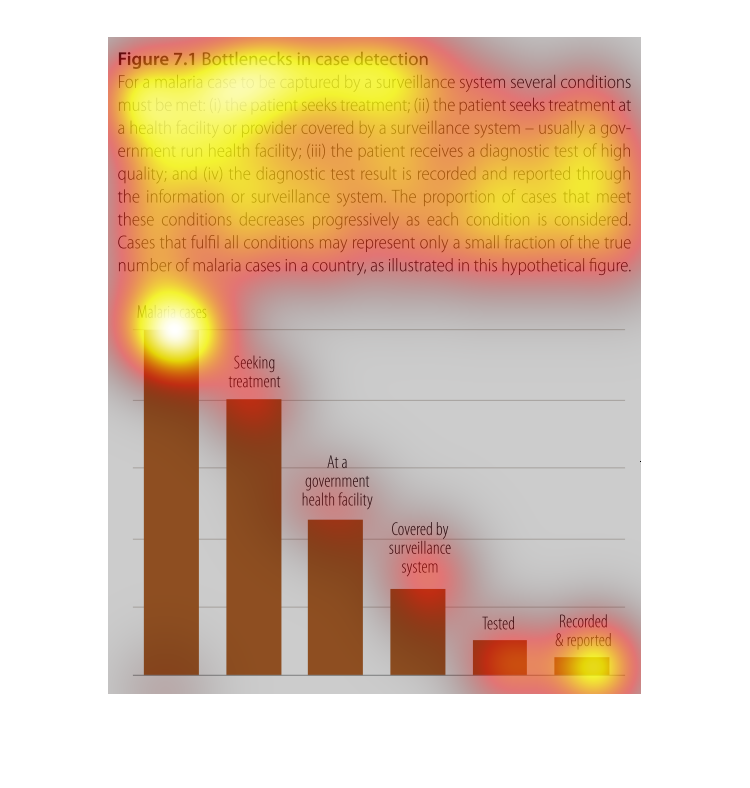
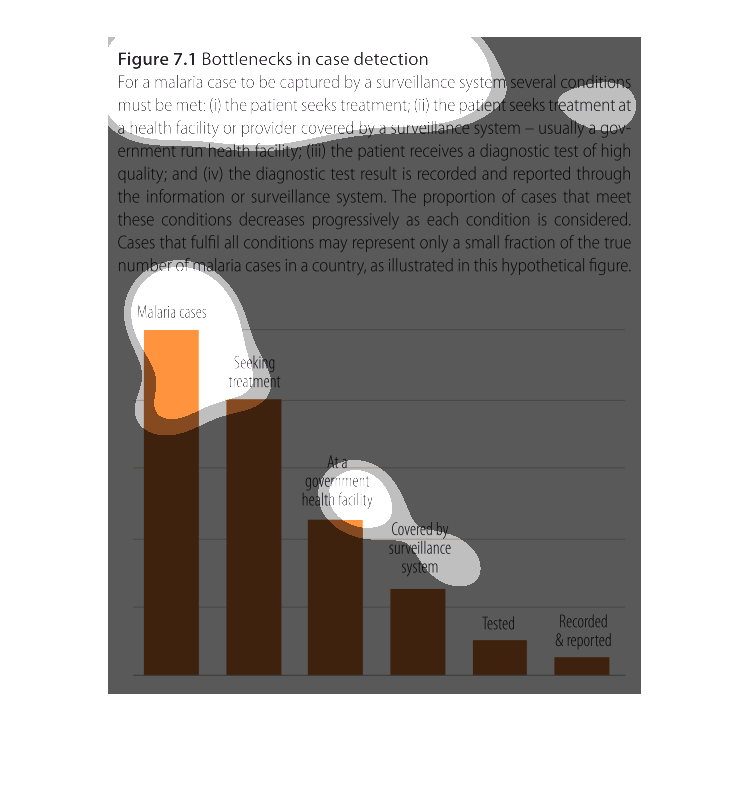
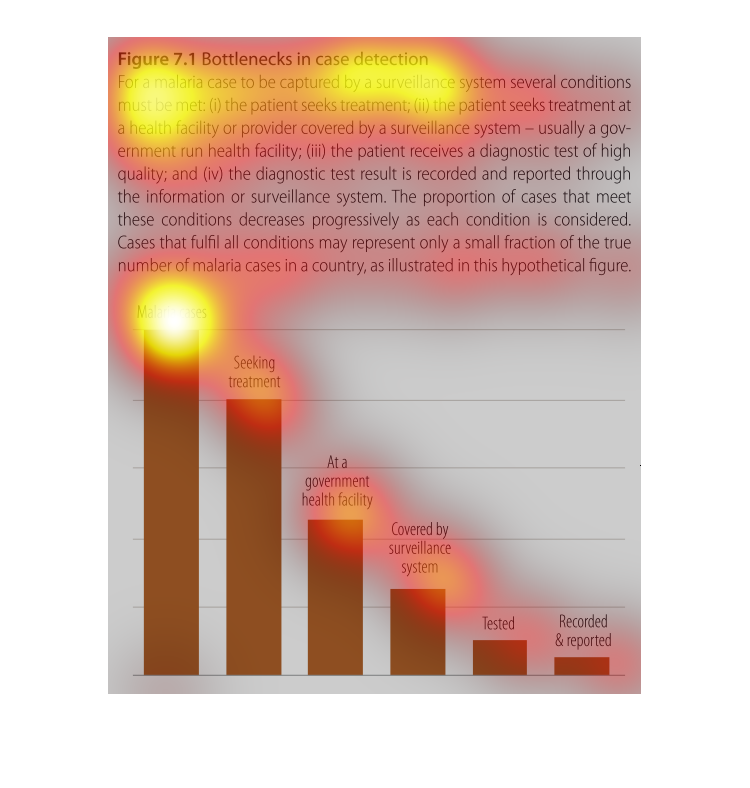
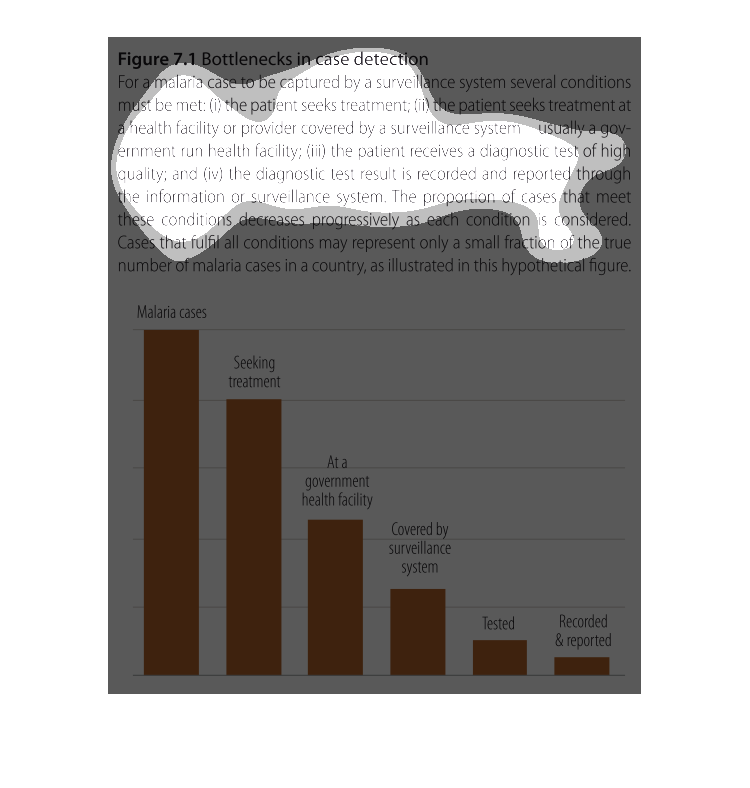
The image shows a bar graph of bottlenecks in case detection of malaria. The data shows that
few cases are recorded and reported, tested, and covred by surveillance systems. Actual cases
of malaria reported are high, with many people seeking treatment, and typical seeking treatment
at a government healthcare facility. Major disparity between detected, recorded and reported
cases, and actual cases.
This is a graph that describes a the conditions for a malaria case to be captured by a surveillance
system. The patient must seek treatment at a health care facility, that is usually government
run.
This bar graph shows the study of cases of Malaria in a country and how each case is reported
and how this effects the actual number of individuals with Malaria. The difference between
patience with Malaria, those that seek treatment, those that have received treatment at a
government health facility and the cases that were recorded properly.
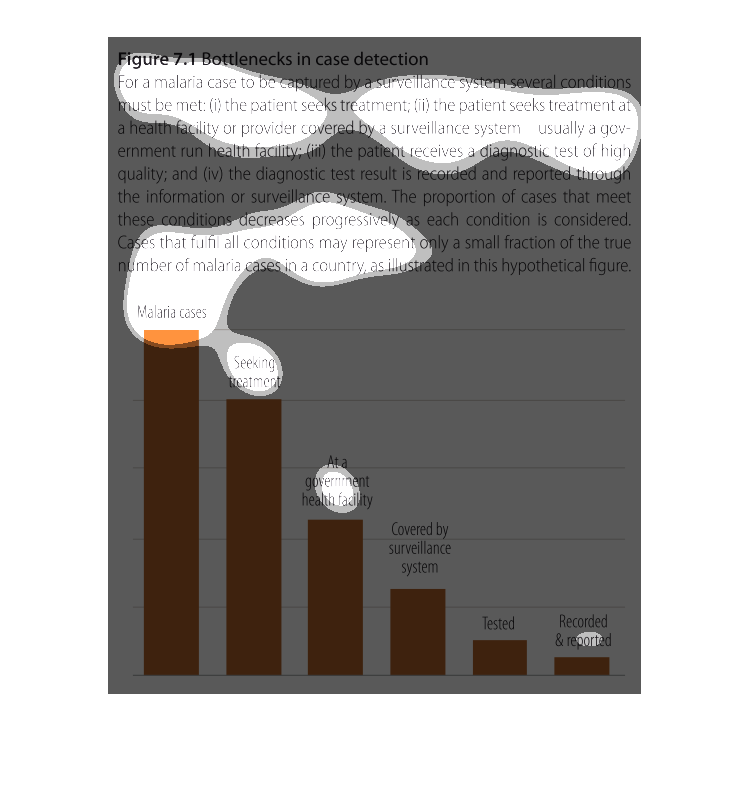
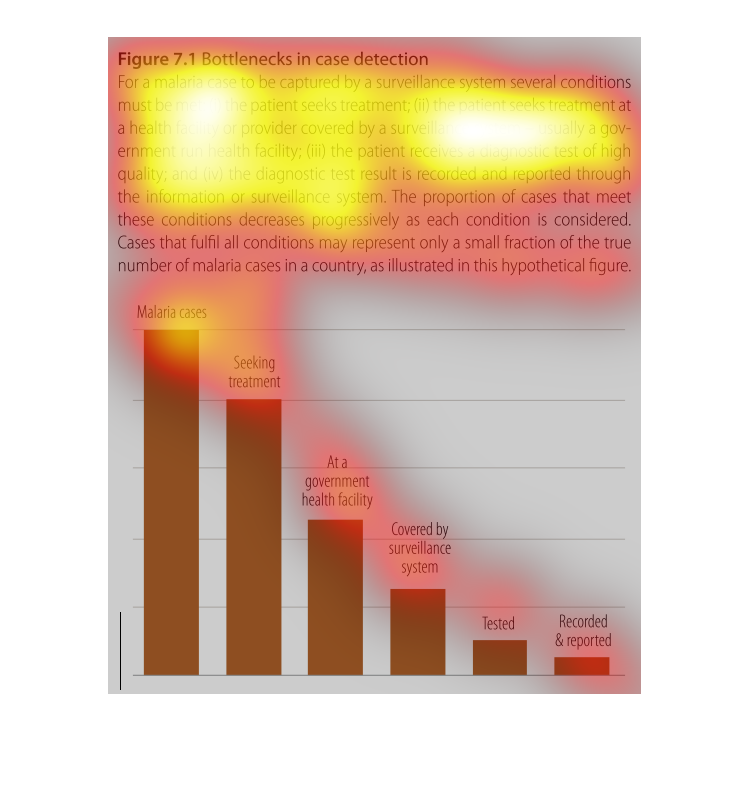
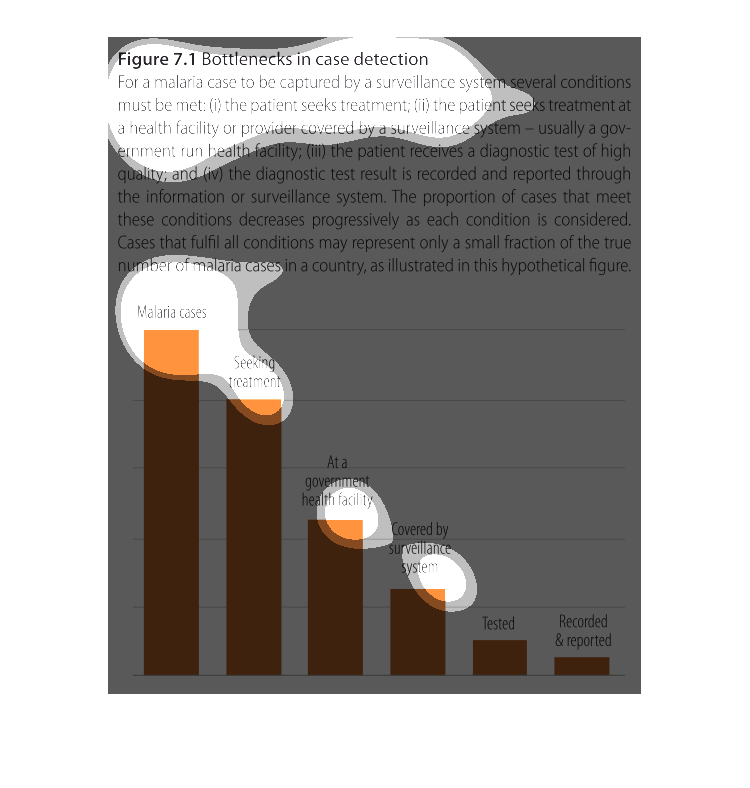
The graph is depicting how many malaria cases there were compared to how many were seeking
treatment, with each consecutive bar getting more specific, with how many sought treatment
at a government facility, seeking treatment at a government facility with a surveillance system,
how many were actually tested, and finally how many were recorded and reported. We can see
that though there is a high rate of malaria cases, as specifications increased, the bars got
steadily lower, with very few cases being recorded and reported.
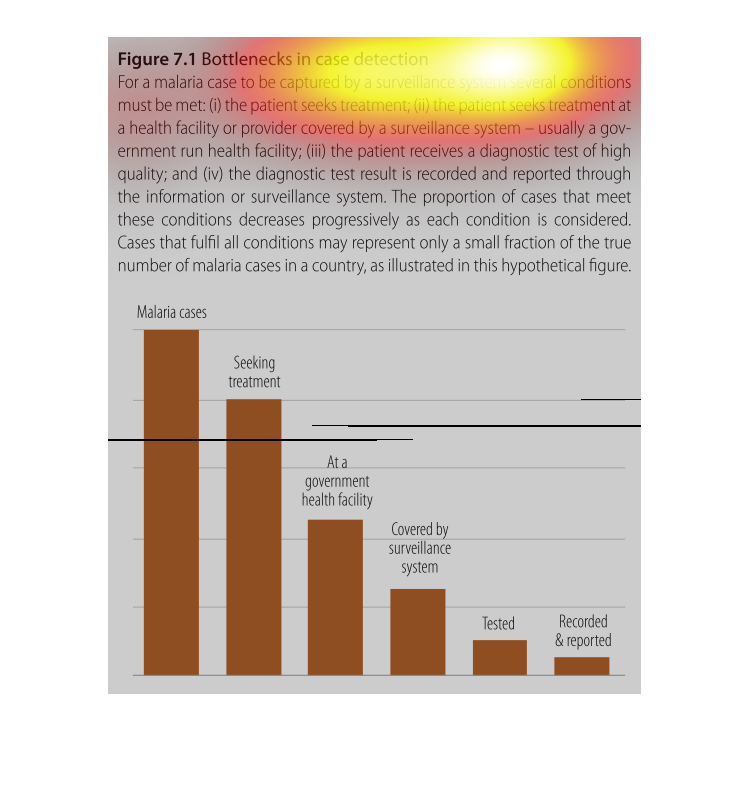
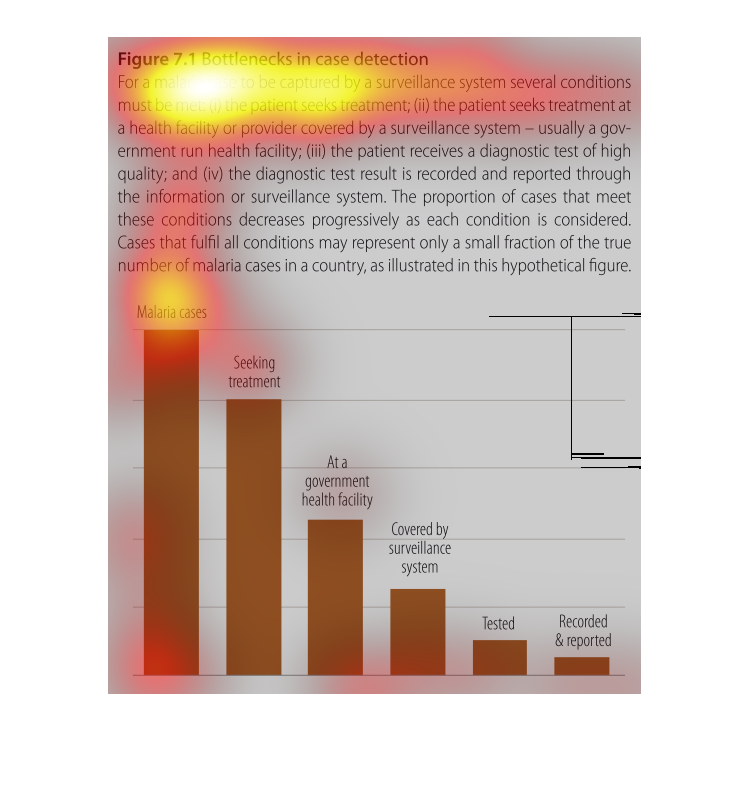
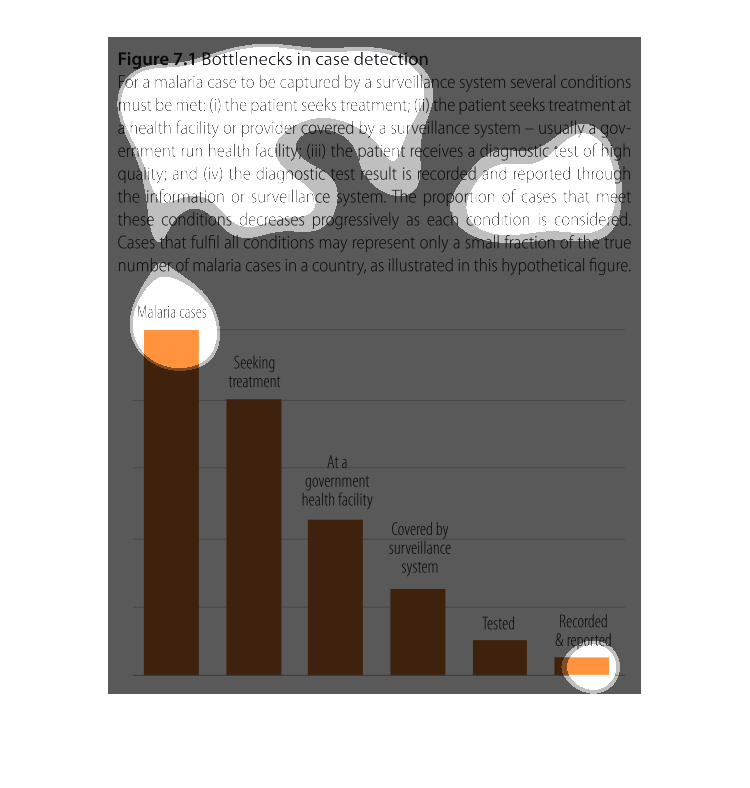
This is a graph about bottle necks in case detection.  IT shows malaria cases, those seeking
treatment, at a government health facility, covered by surveillance systems, tested, and recoreded/reported
This chart shows the number of malaria cases. Of the cases it shows the number that have been
tested at government facilities, tracked,  recorded and reported..
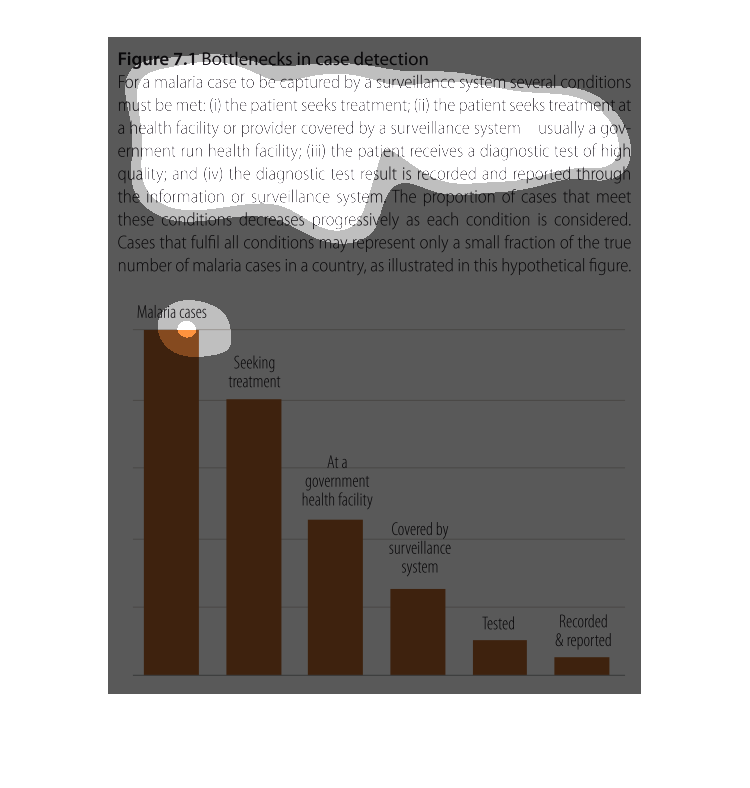
The chart describes the bottleneck in the detections of the malaria cases. We can see that
from all the malaria cases, those who are seeking treatment are approximately 80 % of the
total cases, about half of these cases seek help at a government health facility, about a
quarter is covered by surveillance system and less than 10% are tested, recorded & reported
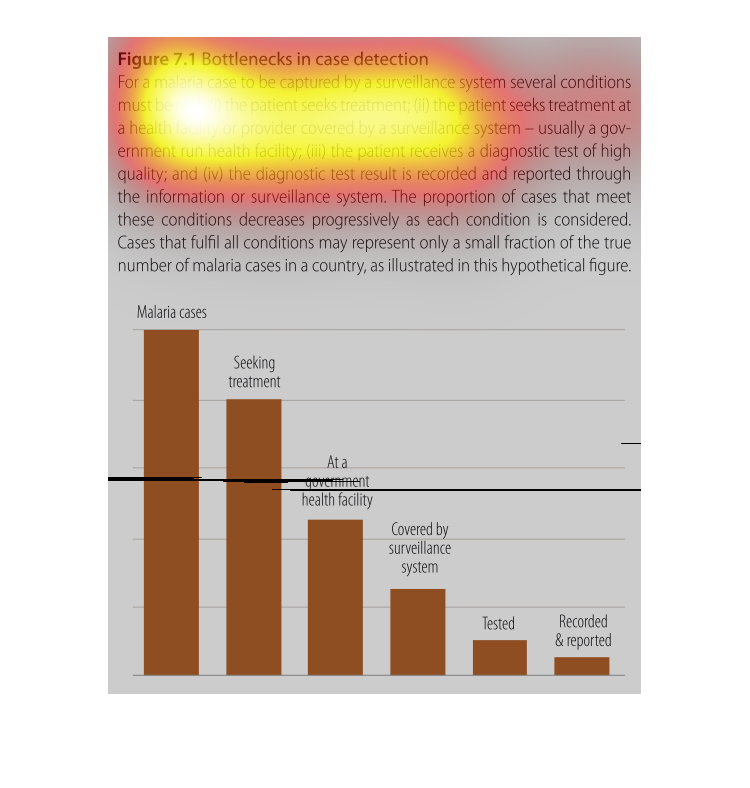
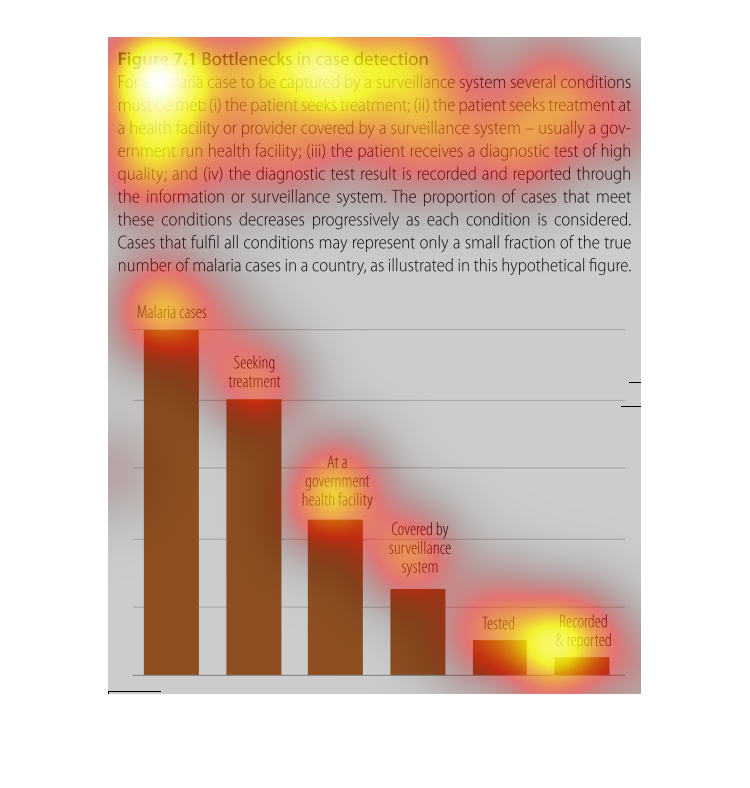
The image depicts a bar graph of bottlenecks in case detection of malaria by surveillance
systems. The data shows far more cases of malaria, versus malaria victims seeking treatment,
seeking treatment at governmental health facilities, actually being covered by surveillance
systems, being tested, as well as recorded and reported. Many cases of malaria are occurring
and not being properly detected or cataloged by systems.
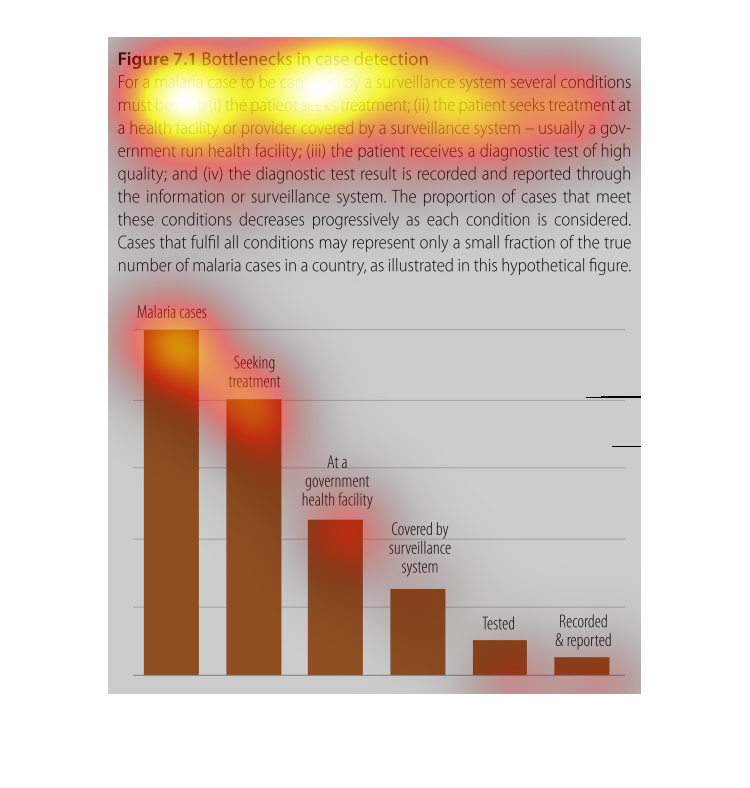
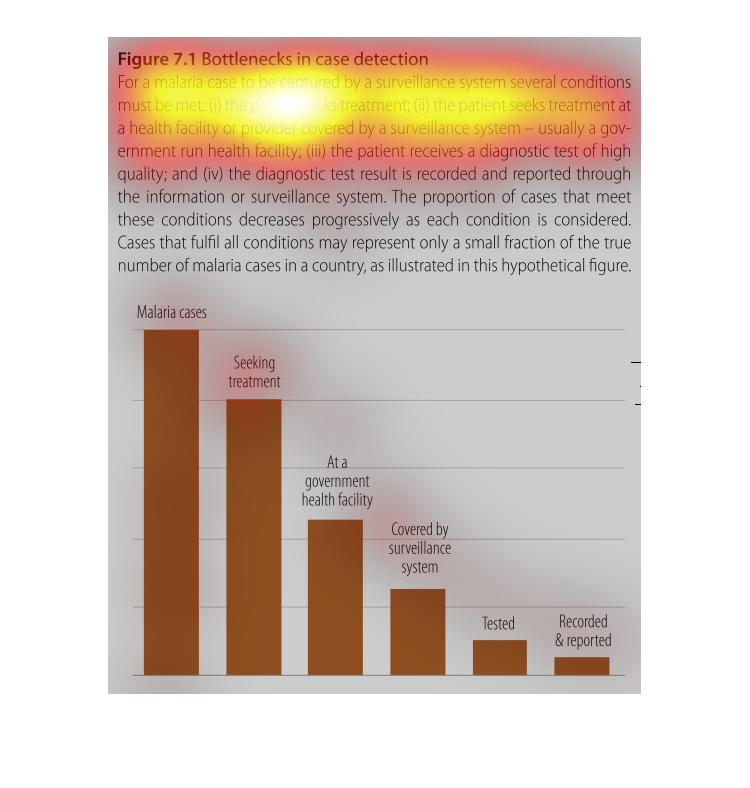
This graph shows the bottlenecks that occur in malaria case detection reported through a surveillance
system in diagnosed and reported cases. The graph itself is a hypothetical figure.
This graphs shows the relation between how many total malaria cases there are, and how many
less people are seeking treatment, seeking treatment at a government health facility, which
are covered by a surveillance system for reporting purposes, and how many actually get tested
and recorded in the end, which is a fraction of how many malaria cases there are.