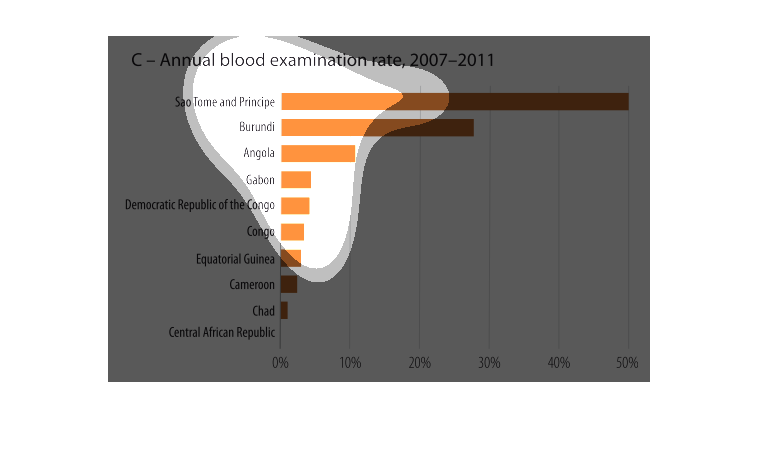
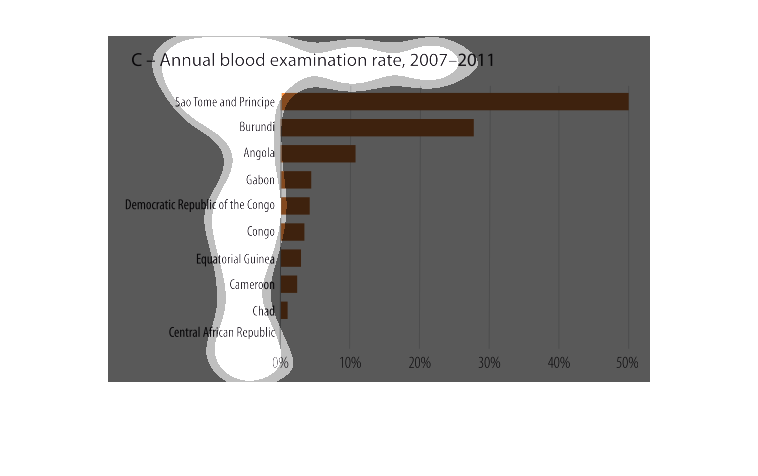
this shows a bar graph and the bar graph is c-annual blood examination rate of 2007.and the
graph shows that sao torne and principe  is the highest on the graph
This chart describes the annual blood exam rates in different African countries. São Tomé
has the highest blood exam rates and the Central African Republic has the lowest.
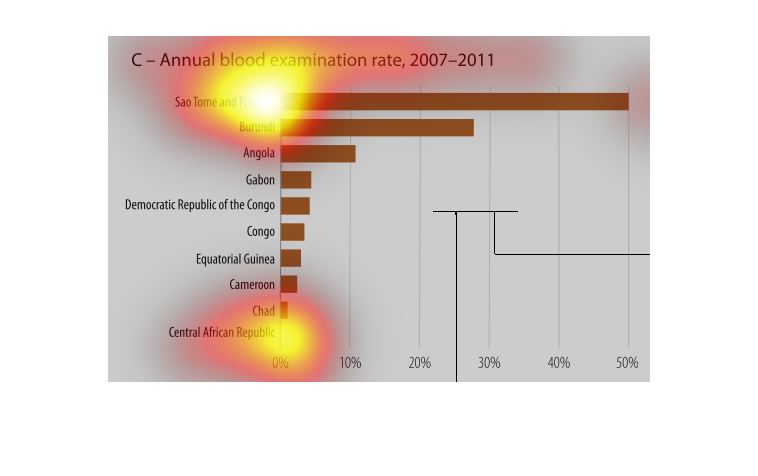
This is a chart of annual blood examination rate from 2007 to 2011. Central African Republican
the lowest annual blood examination rate. Sao Tome and Principe has the highest rate.
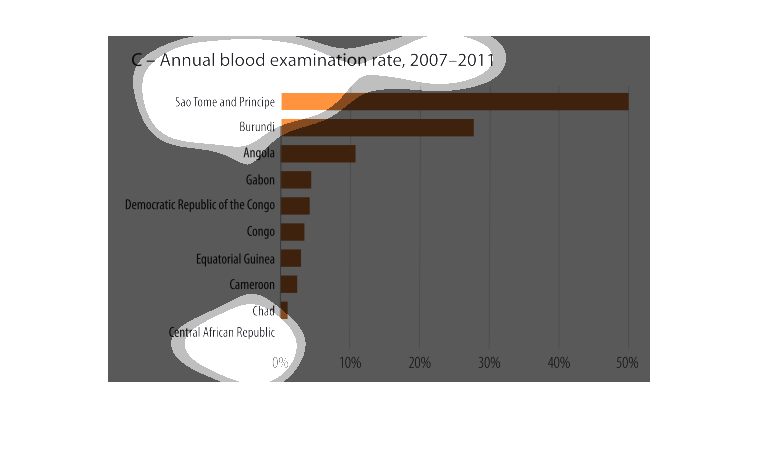
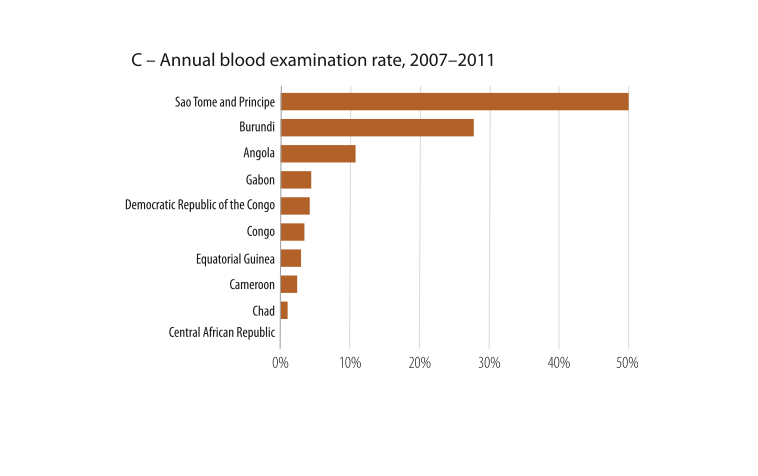
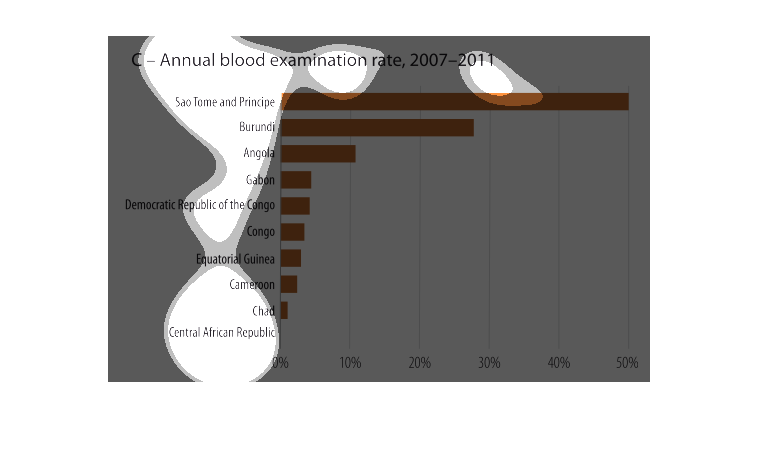
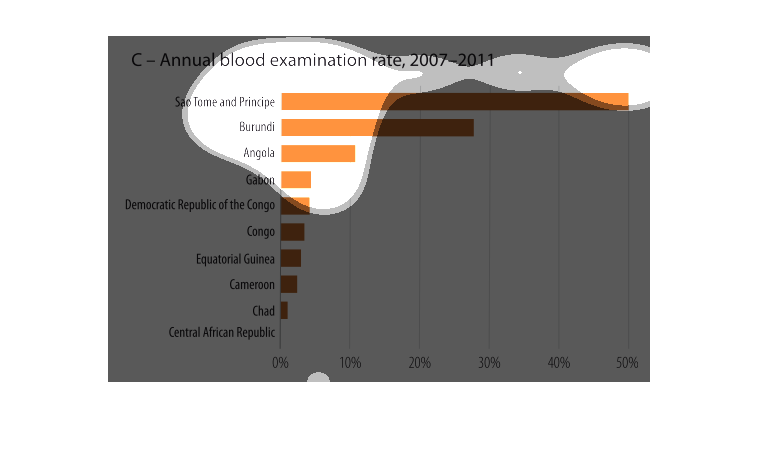
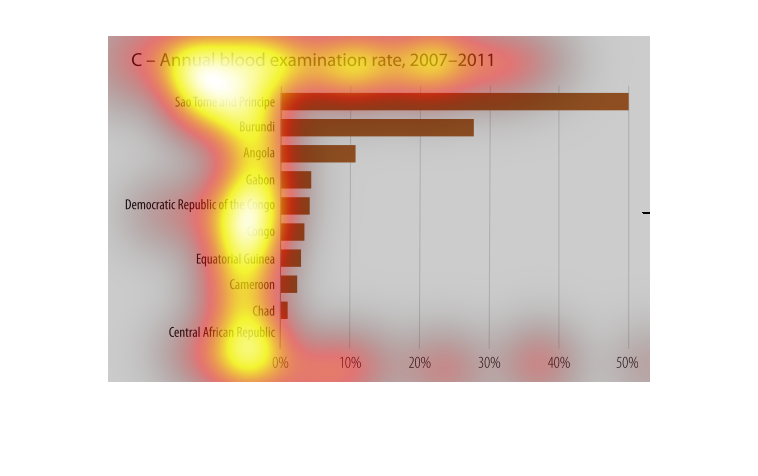
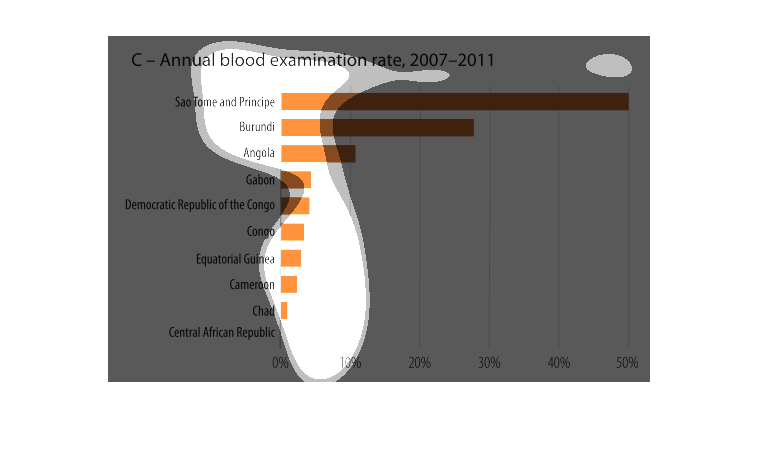
THIS PLOT SHOWS THE ANNUAL BLOOD EXAMINATION RATE BY PERCENTAGE FOR SEVERAL AFRICAN COUNTRIES.
THE LARGER THE BAR, THE HIGHER THE EXAMINATION RATE FOR THAT COUNTRY.
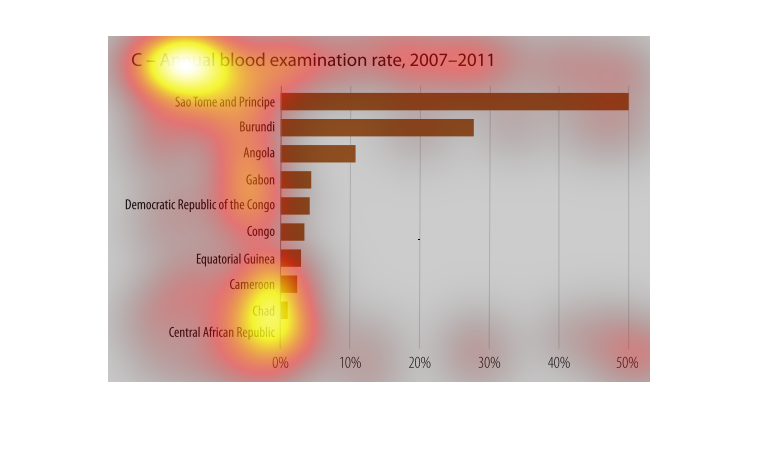
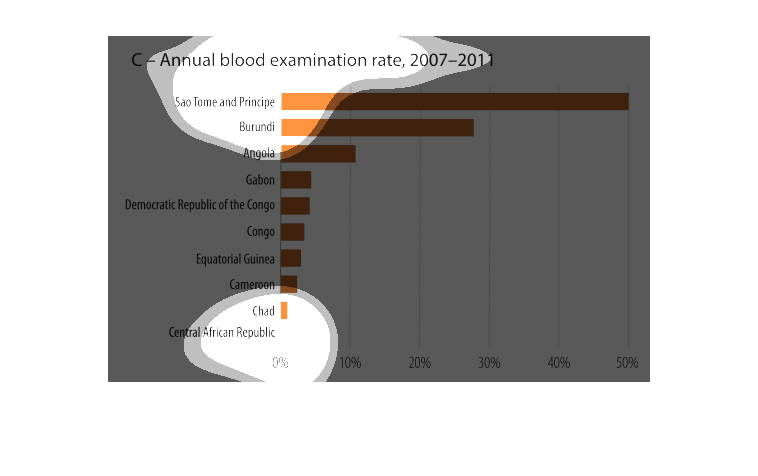
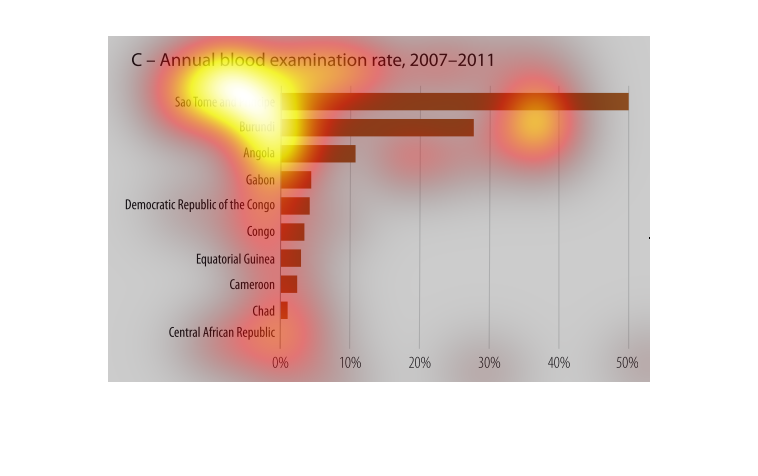
This chart describes annual blood examination rate, for the years 2007 through to the year
2011. Countries on the chart include Burundi, Angola, and Gabon.
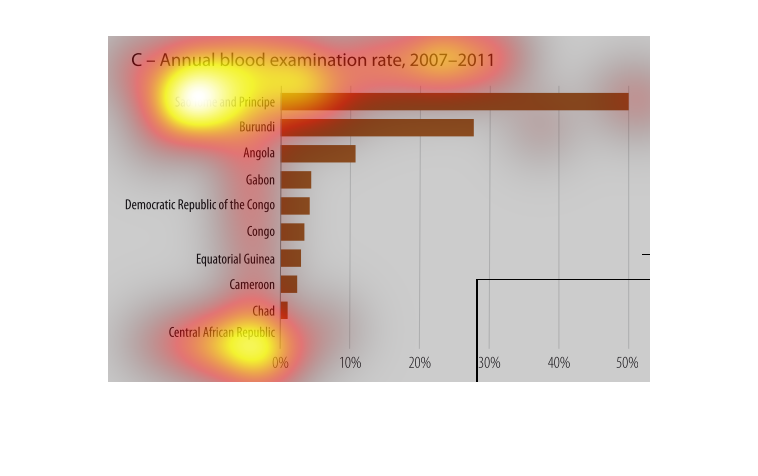
The image describes the annual blood examine rate from 2007-11. Sao tome and Principe have
the highest rate.  The Central African Republic has the lowest rate.
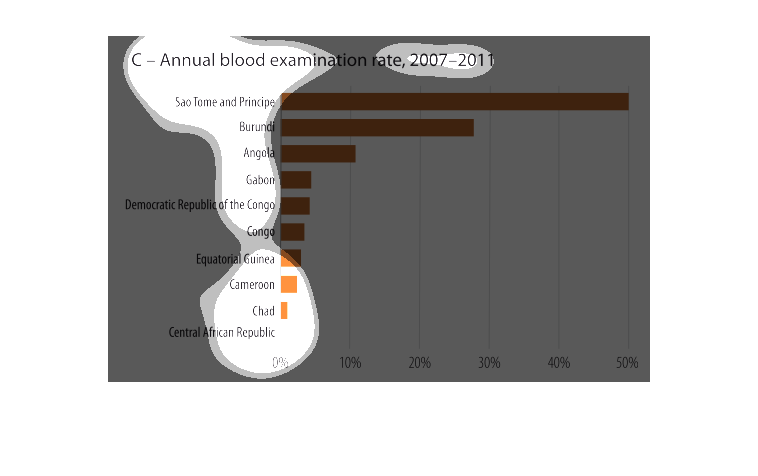
This graph breaks down the amount of blood work getting done in the countries listed. Blood
work is really important because it lets medical practitioners know what is going on within
people's bodies.
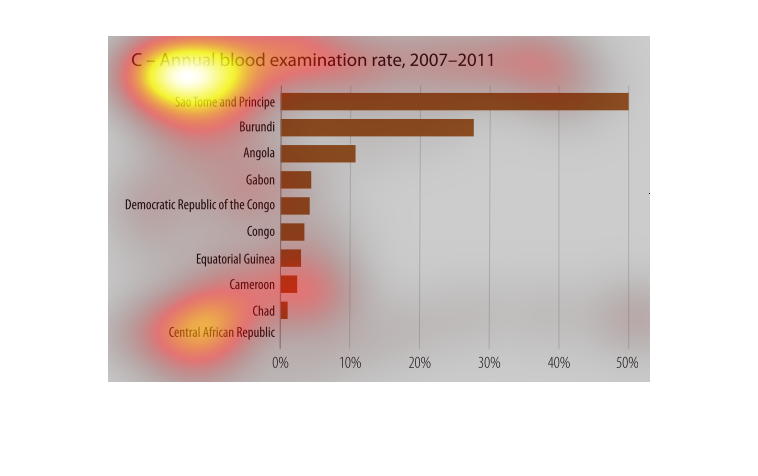
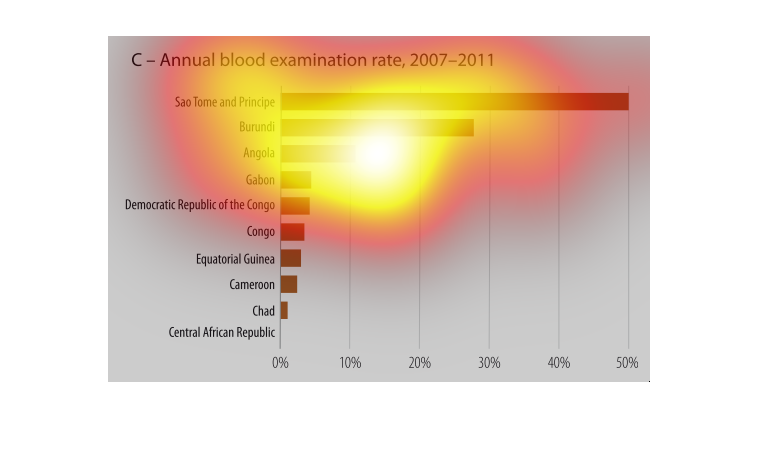
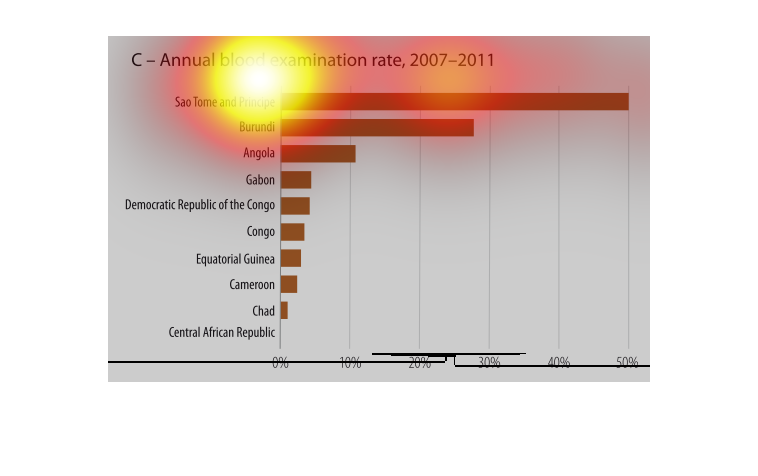
This graph illustrates the annual blood examination rate from the years 2007 to 2011.  It
shows Sao Tome and Principe having the highest examination rate for blood donations.
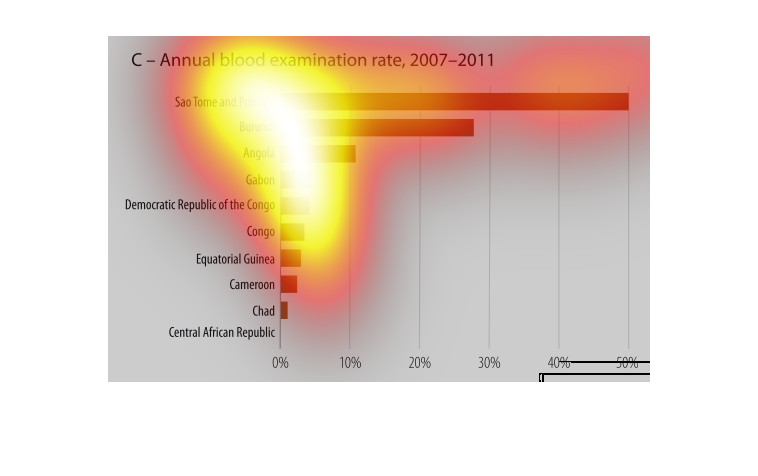
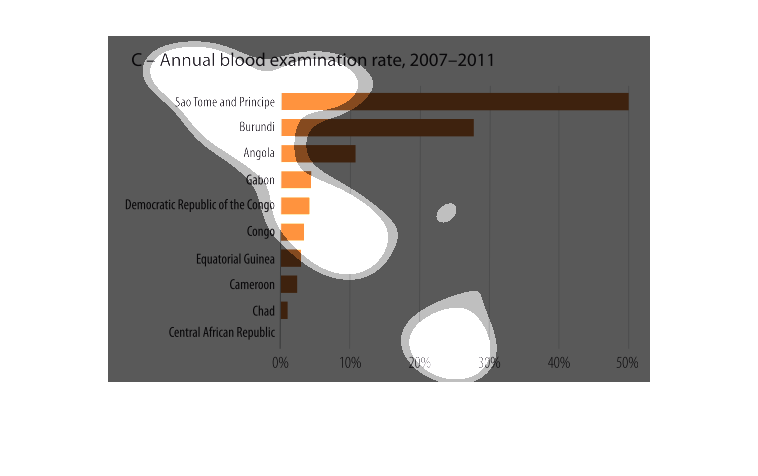
The figure presented is titled C-annual blood examination rate, 2007-2011.  The figure is
an actual representation of the annual blood examination rate.
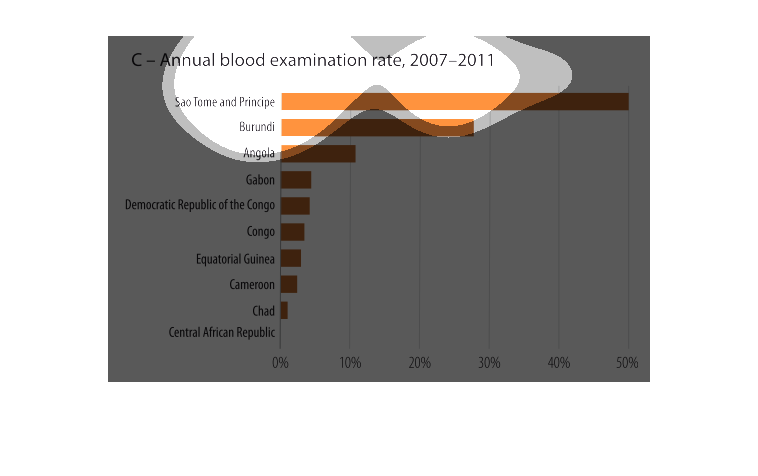
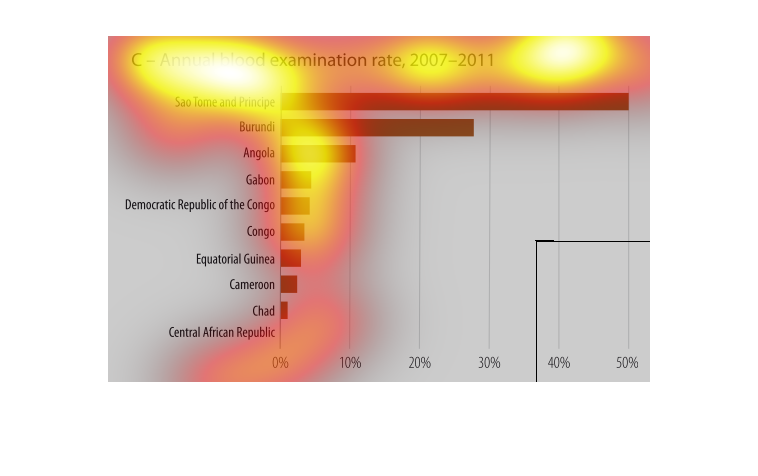
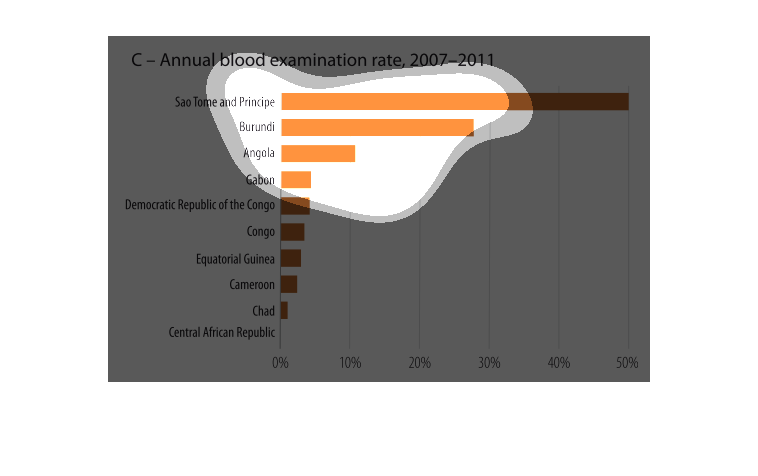
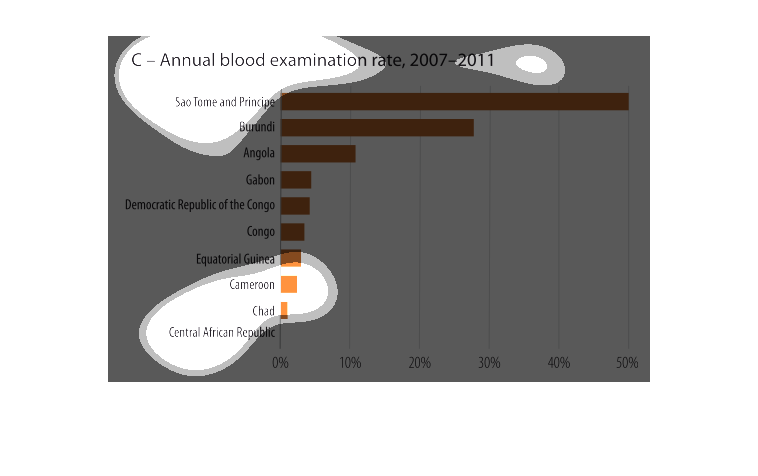
This chart shows the C-annual blood examination rate from 2007-2011, from the continent of
Africa. Central African Republic has the least at approximately 3%, while Sao Tome Principe
has the most at 50%.
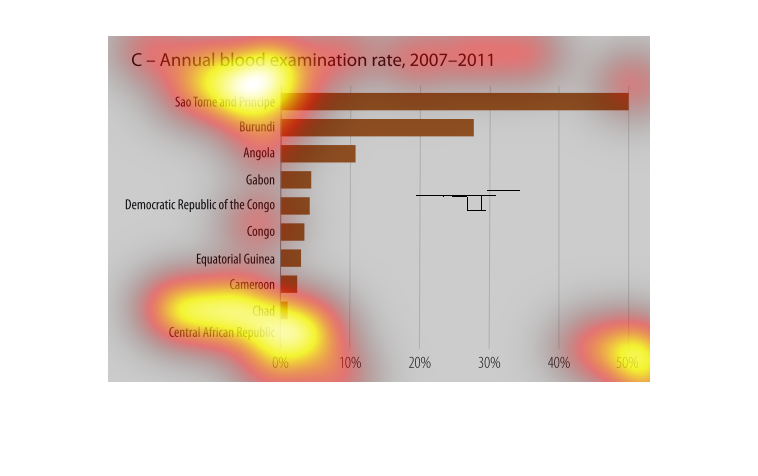
This chart concerns the annual blood examination rate for the years 2007 to 2011. The left
side lists off countries, Sao Tome and Principe, Burundi, Angola, Gabon, Democratic Republic
of the Congo, Congo, Equatorial Guinea, Cameroon, Chad, and the Central African Republic.
The bottom of the graph concerns the percentages.
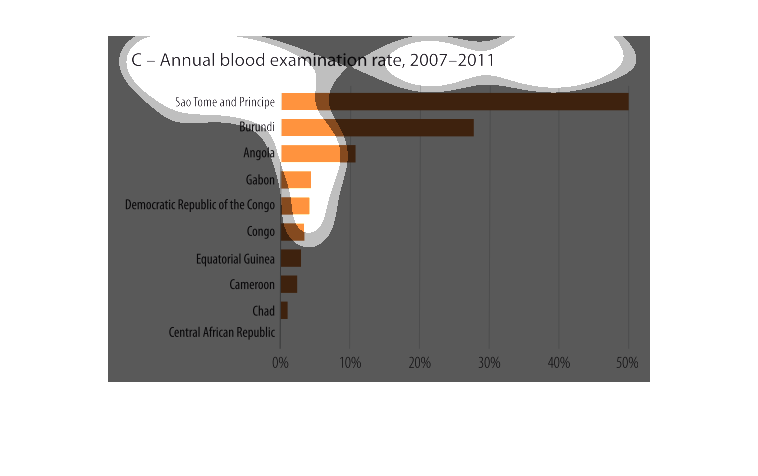
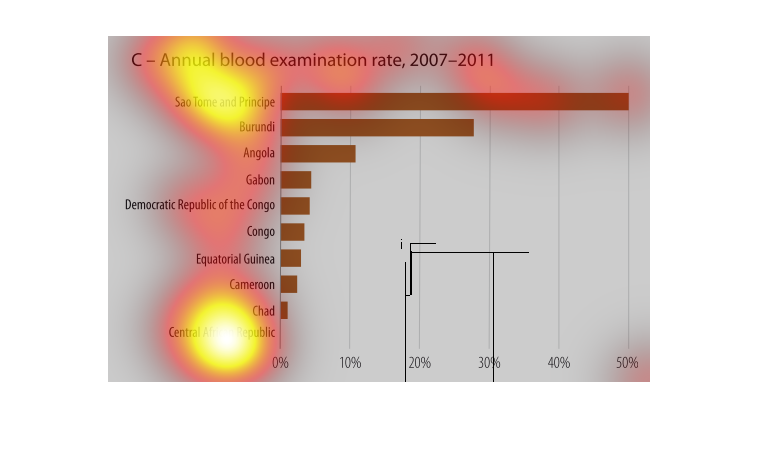
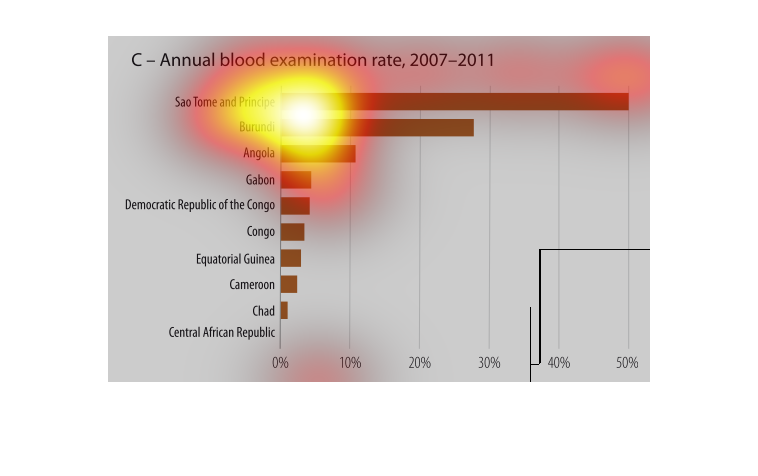
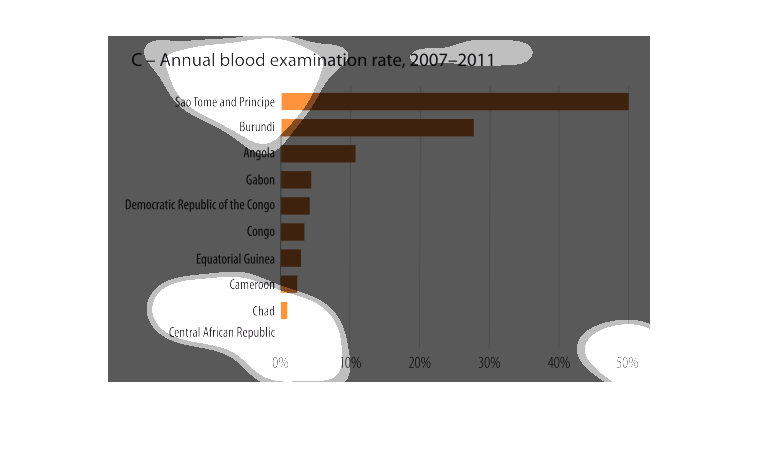
The image depicts annual blood examination rate, 2007-2011, in a number of African countries.
The majority of countries appear to have low examination rates, with only two having noticeably
high rates when compared to others.
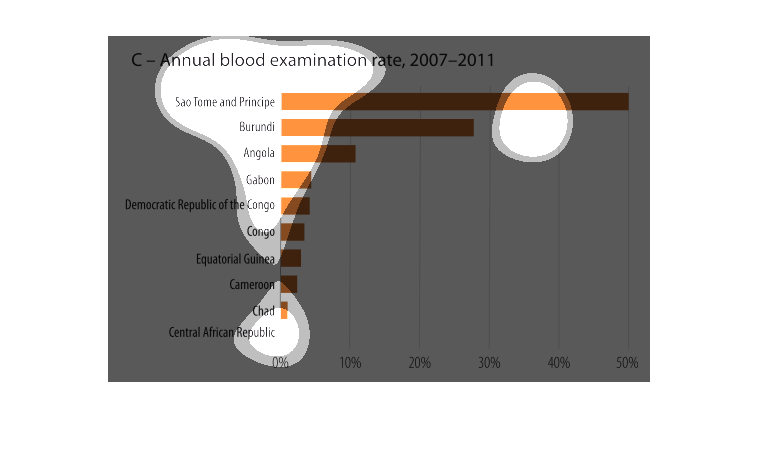
This graph illustrates the level of blood examinations done in these countries, and the level
of cooperation with the populace, as well as what to do to improve things.
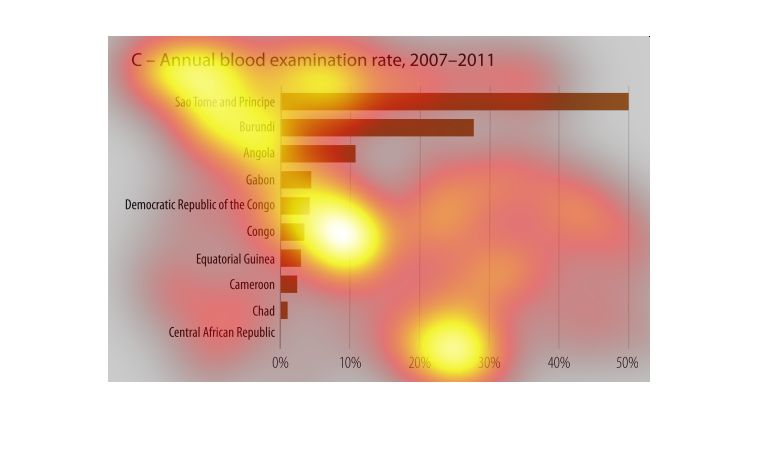
This chart describes annual blood examination rate, for the year 2007 through the year 2011.
Countries on the chart include Angola, Gabon,Congo, and Cameroon.

This is a graph that shows the C Annual rate with respect to the examination of blood for
the years 2007 to 2011. This graph shows only a selected sample of African countries.