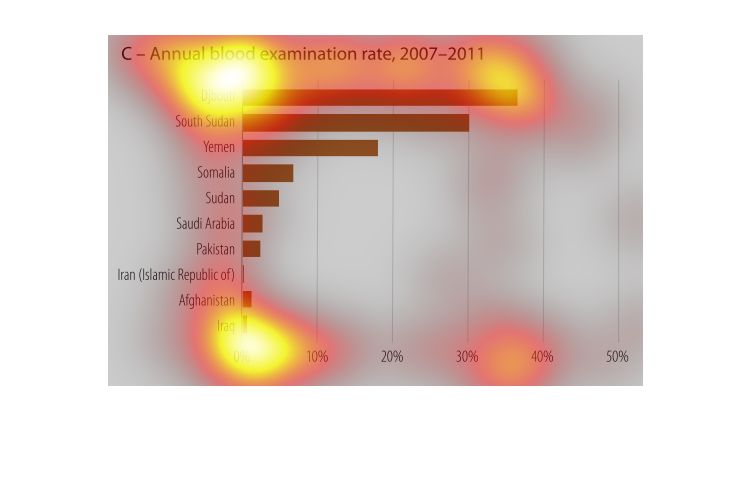
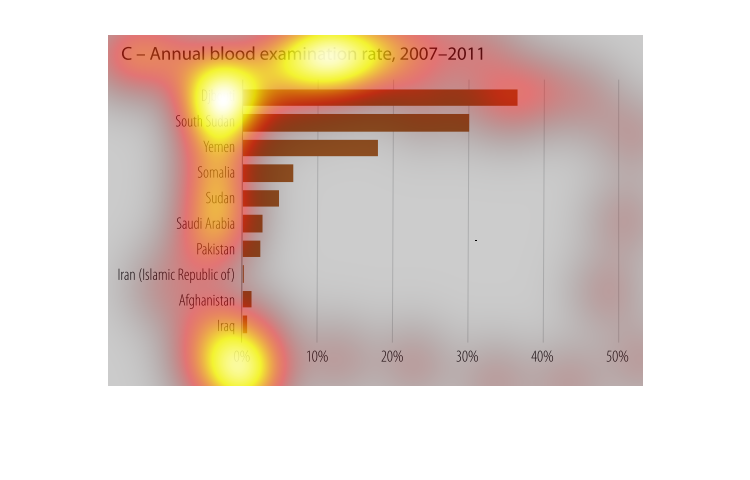
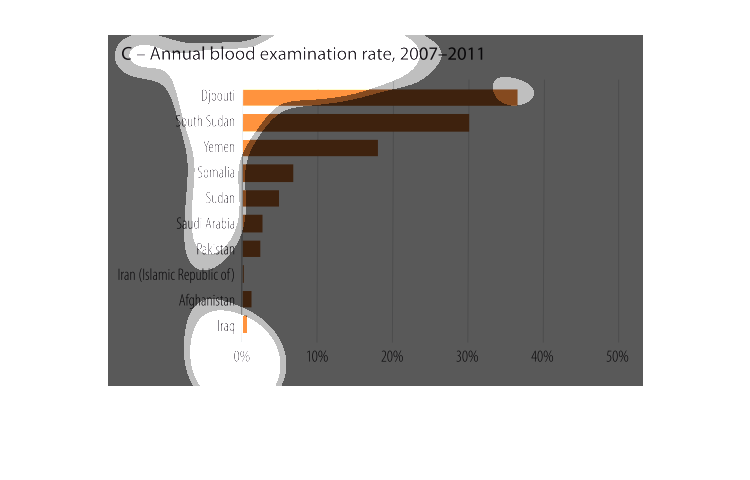
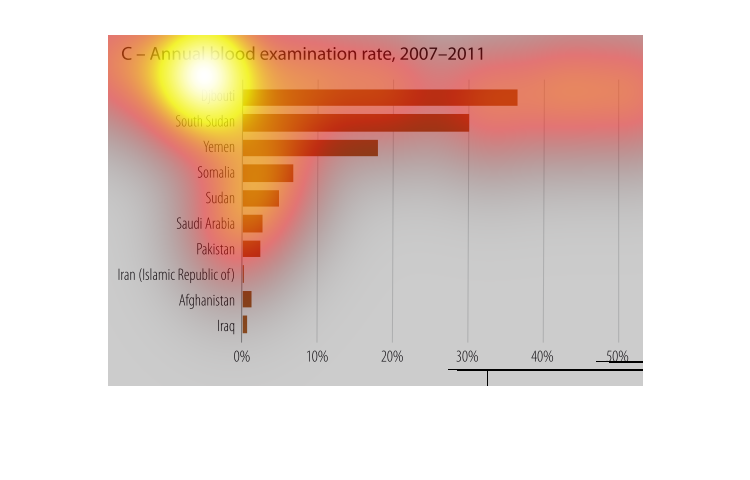
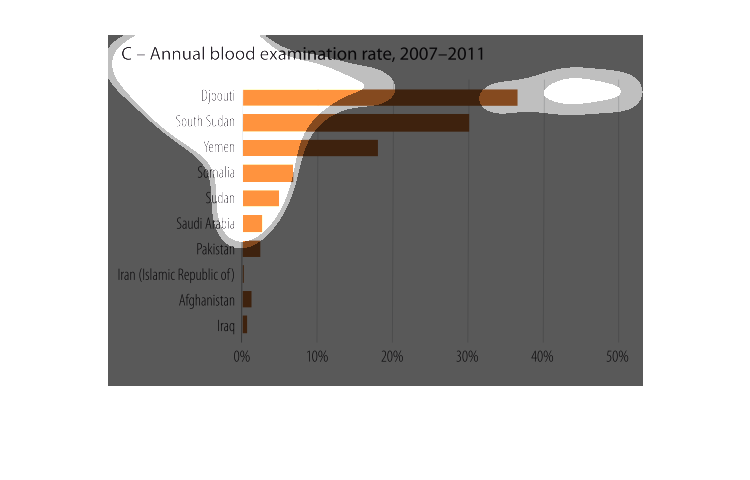
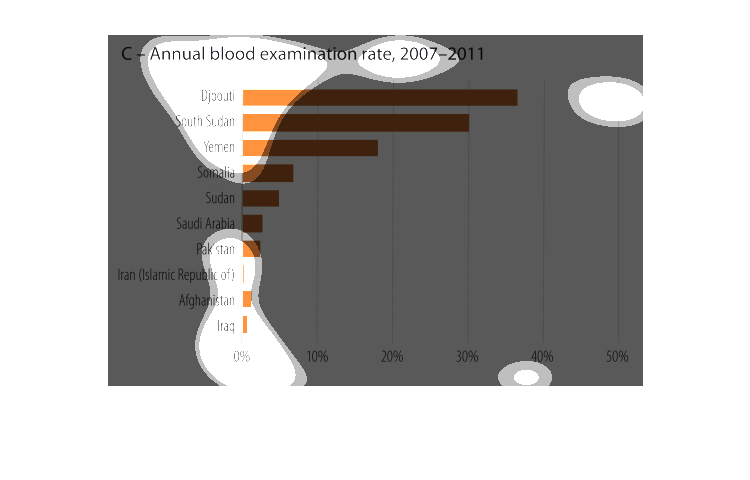
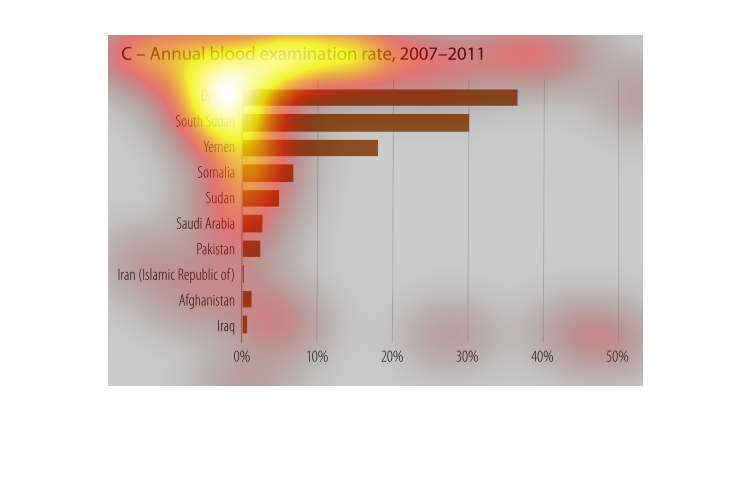
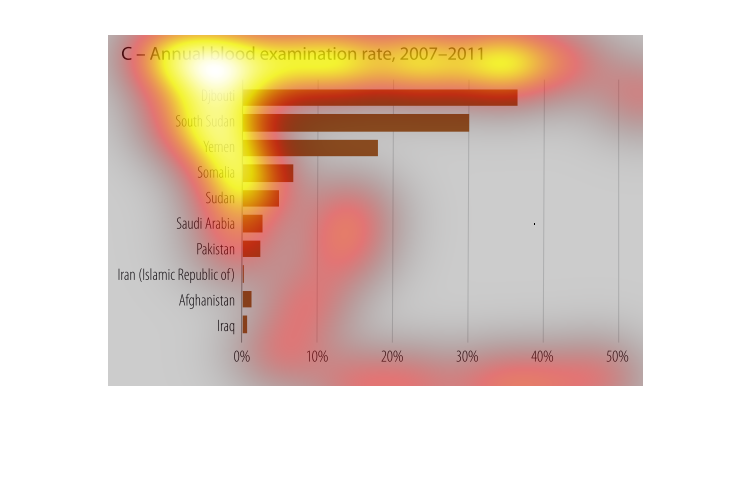
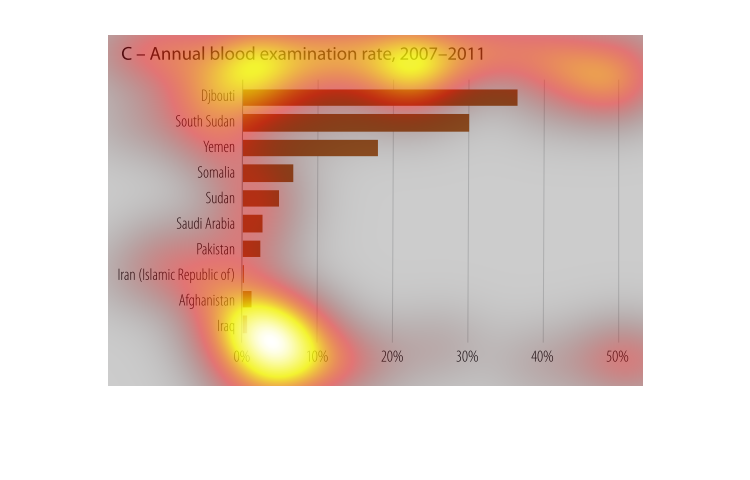
This chart describes annual blood examination rate, 2007- 2011. Regions on the chart include
Djbouti, South Sudan, Yemen, Somalia, Sudan, Arabia, and Pakistan.
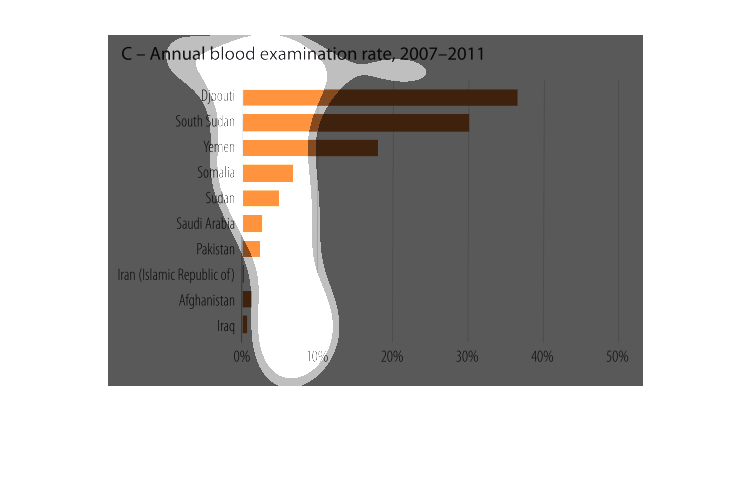
This graph shows the annual blood examination rate from 2007- 2011. It shows the amount of
blood exams from highest country at the top (Djbouti) to the least amount at the bottom (Iraq).
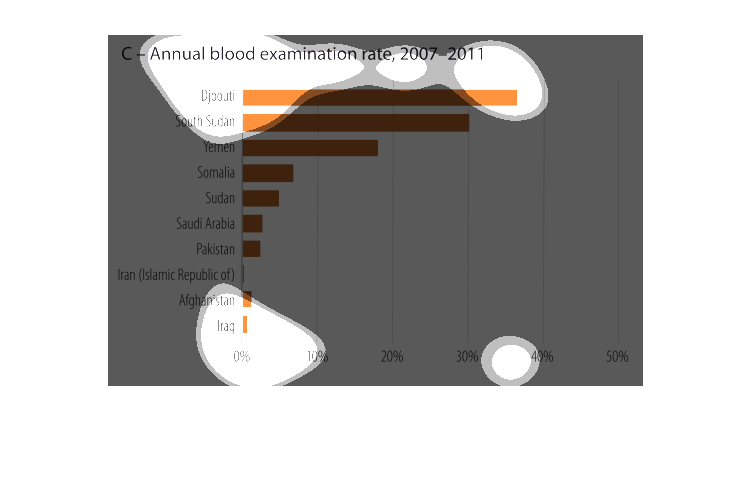
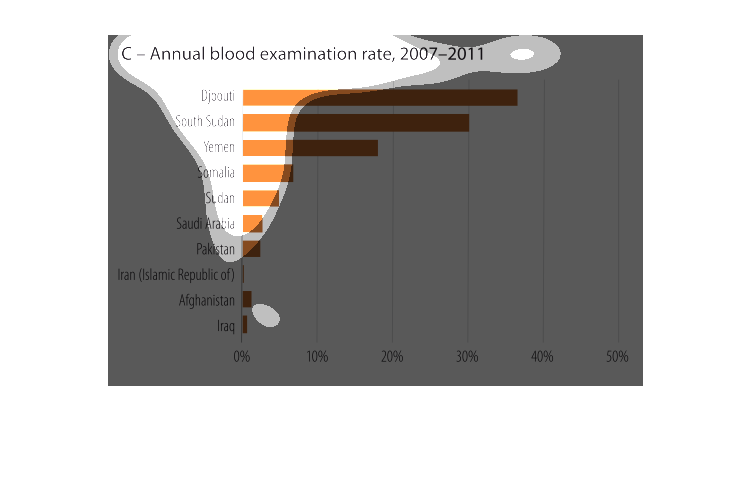
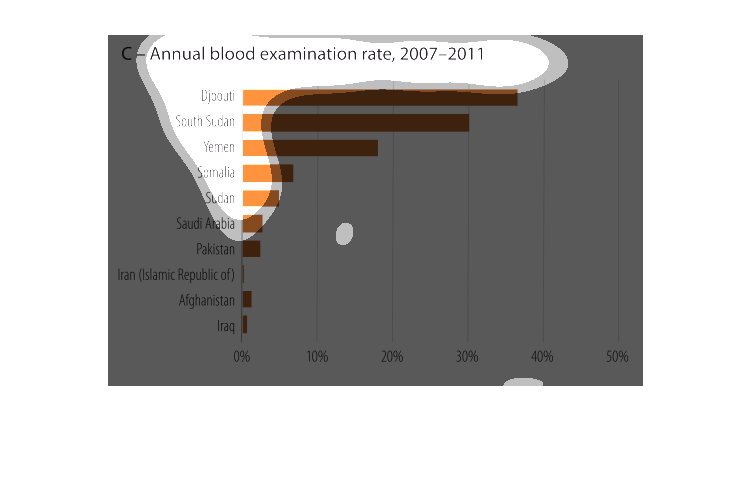
This is a series of bar graphs depicting annual blood examination rates in the years from
2007 to 2011in a group of several selected countries around the world.
This chart shows the annual rate of blood exams from 2007 to 2011. All of the horizontal bars
denote percentage, and the countries ranked are middle eastern and african nations.

This chart shows that annual blood examination rates across Africa are different, and the
countries with the highest exam rates have healthier populations.
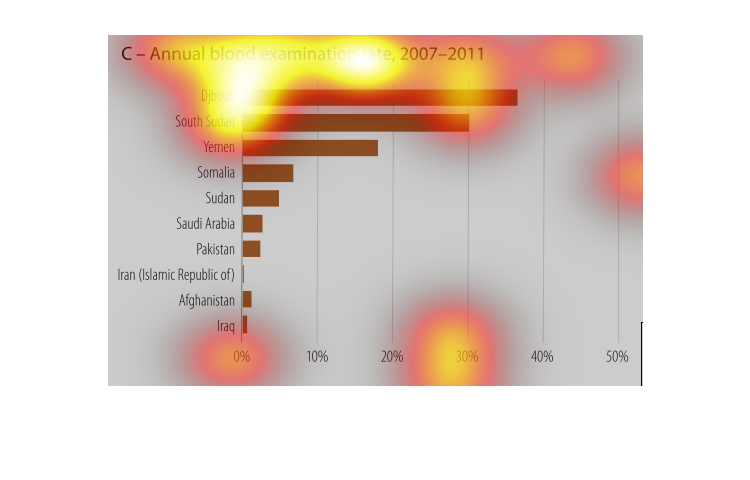
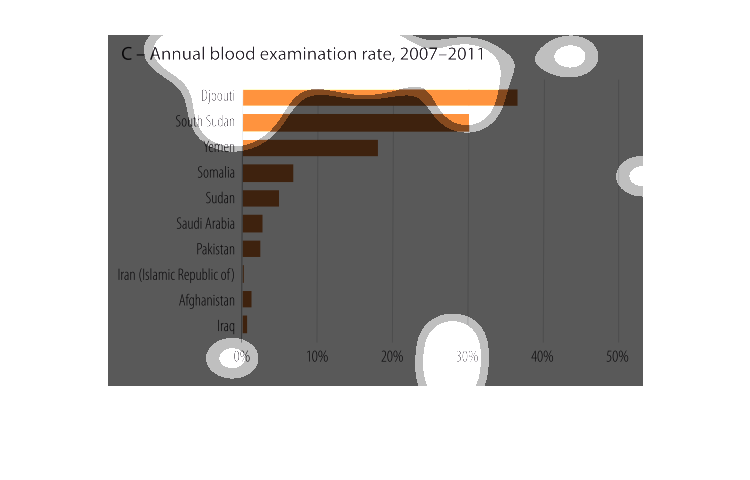
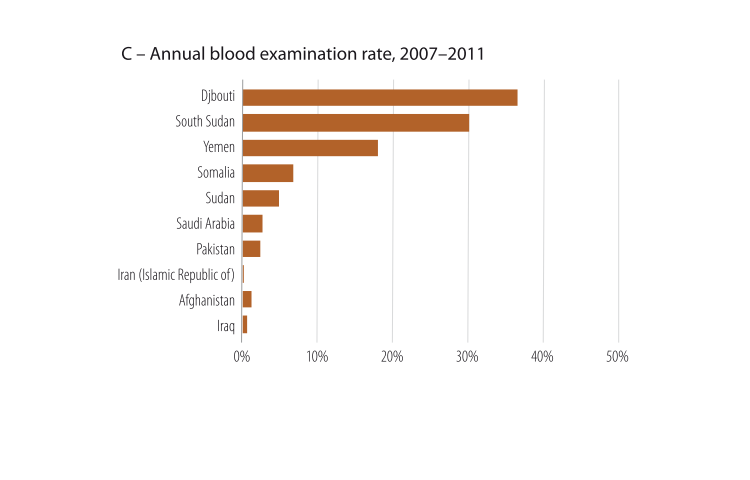
This graph shows annual blood examination rates from 2007-2011, focusing mainly in the North
African / Middle East region. Overall, less than half of blood was examined. Highest examination
rates were in Djibouti, Yemen, and South Sudan.
This chart describes annual blood examination rate, for the years 2007 through to 2011. Regions
on the chart include Djbouti, South Sudan, Yemen, and Somalia.
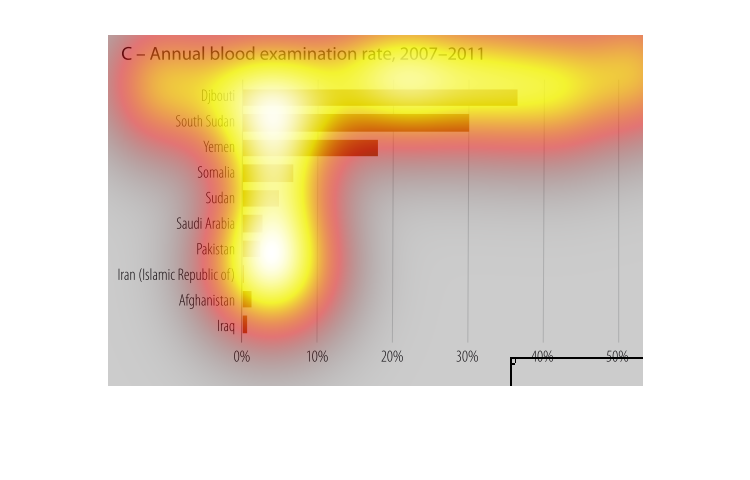
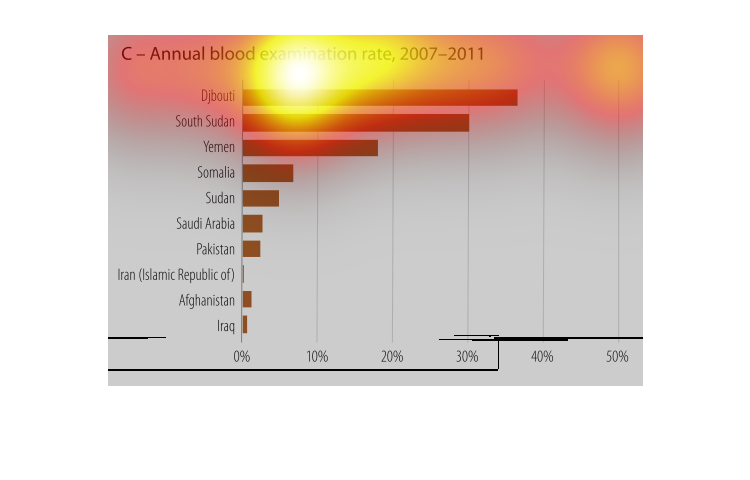
The chart depicts a list of Middle Eastern and East African countries and their number of
C-annual blood examination rates. Essentially, each country is assessed on the percentage
of its population that undergoes the examination.
The figure presented is titled C-annual blood examination rate, 2007-2011.  The figure is
an actual representation, with a bar graph, of blood exam rates.
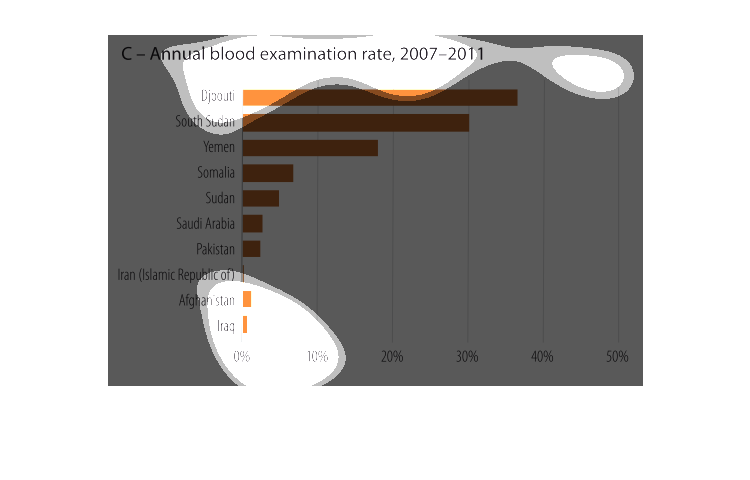
This chart shows the annual blood examination rate 2007-2011 for some middle eastern locations.
 Djbouti had the highest blood examination rate in the high 30% range and Iraq had the lowest
rate in the 1% range.
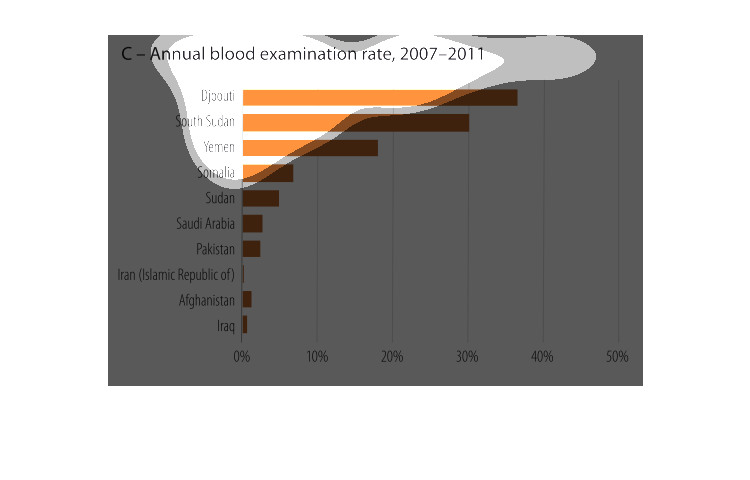
This chart shows the frequency of blood examination in African country. According to the graph,
Djibouti and South  Sudan has the highest number of population taking blood examination.
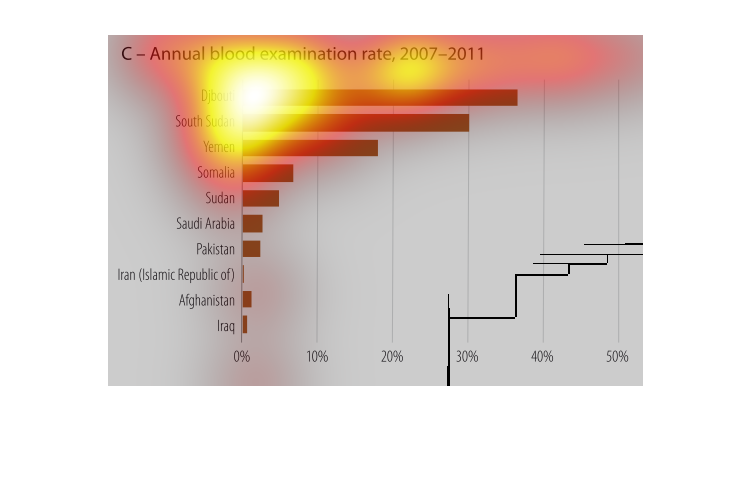
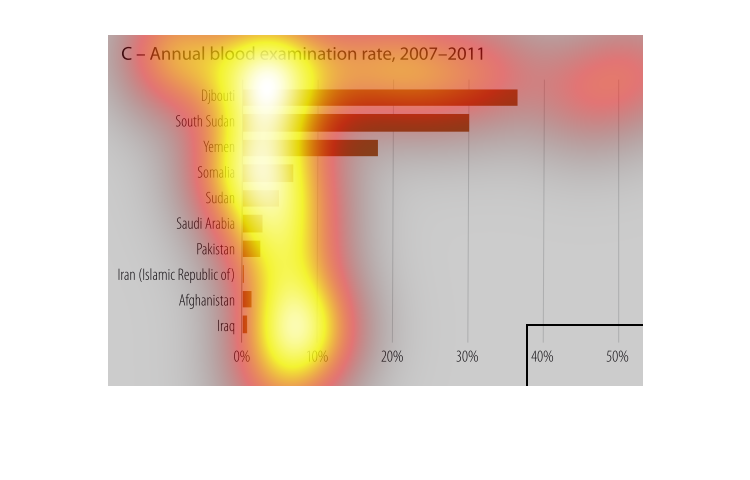
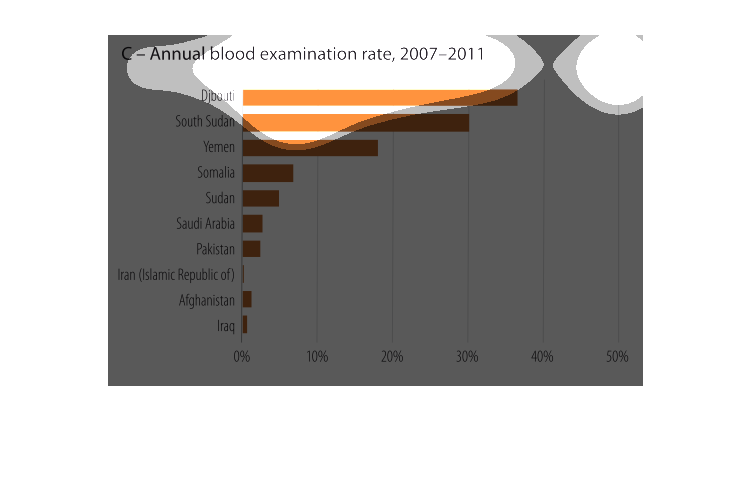
C- annual blood examination rate 2007-2011. Y axis shows middle eastern countries, the X axis
shows percentages. Taking the list by a land slide is Djbouti, South Sudan, Yemen. By the
way...this graph is ugly and different colors could have been used to show intensity, Red
for the top countries, then amber, green.
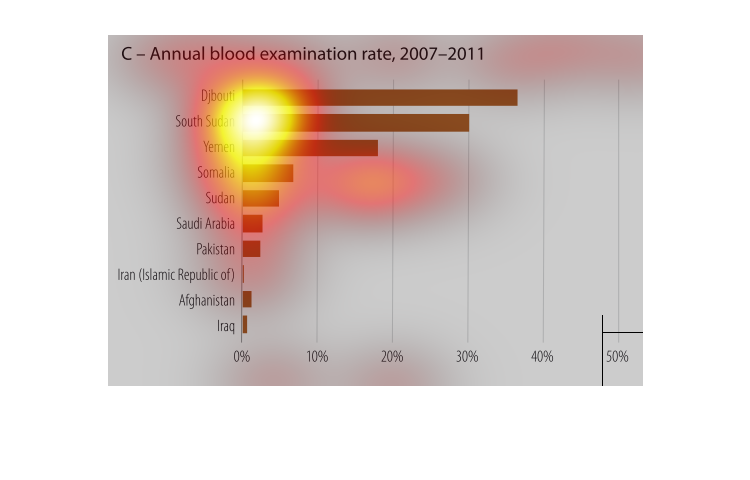
this graph compares the blood examination rate between 2007-2011   within 10 different countries.
Djbouti has the highest blood examination level of all for their patients.  Iraq has the least.
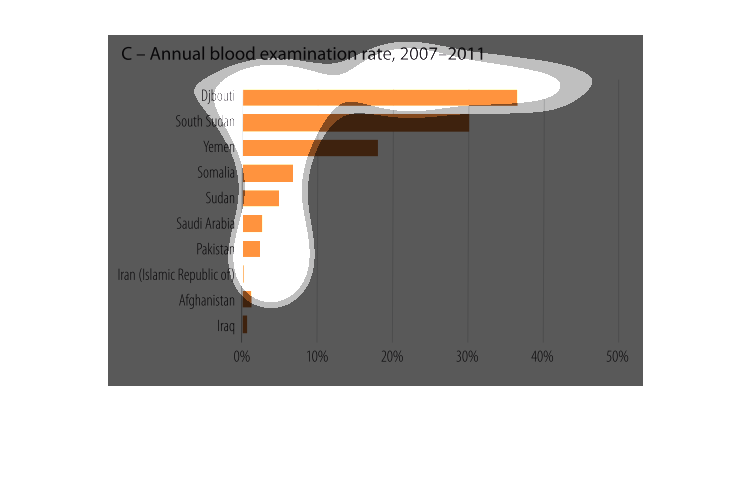
This chart looks at the percentage of annual blood examination rates between 2007-2011.  Several
countries in Africa and Middle East are listed with percentages between 0-50%.  The countries
in the Middle East have lower percentages, while the African countries have much higher percentages.
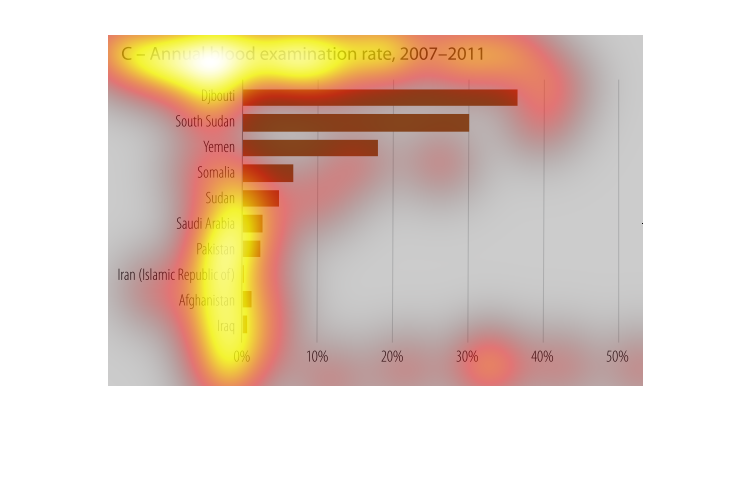
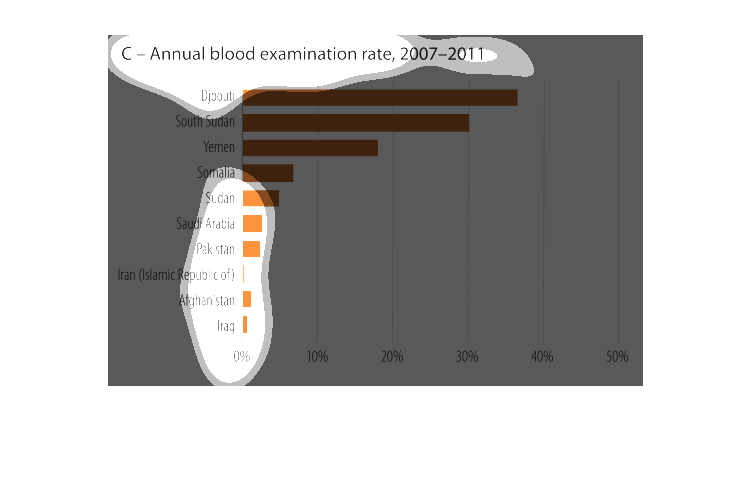
This bar chart describes the annual blood examination rate between 2007 and 2011 for several
reported nations. Djbouti reported the highest examination rate at approximately 45% and Iraq
reported the lowest at approximately 1%.