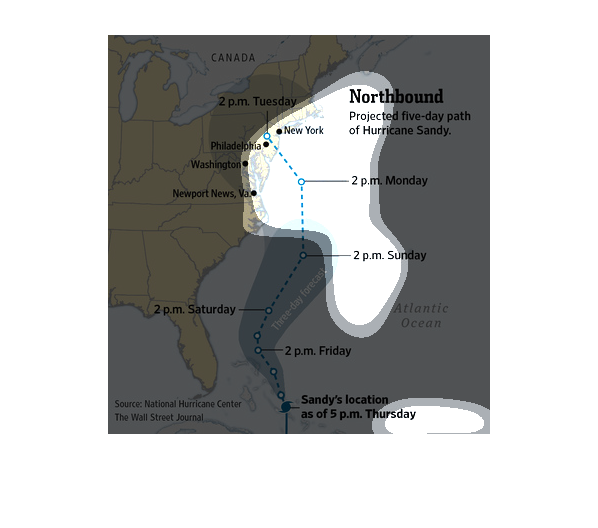
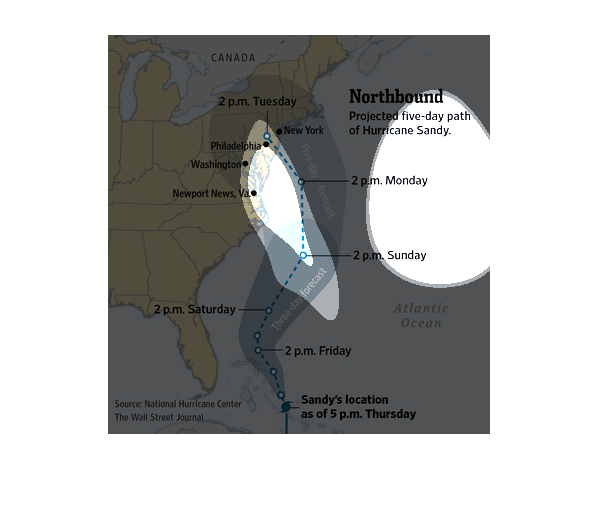
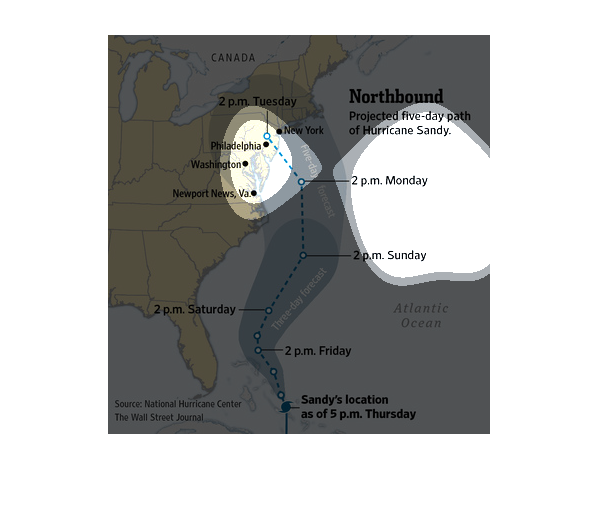
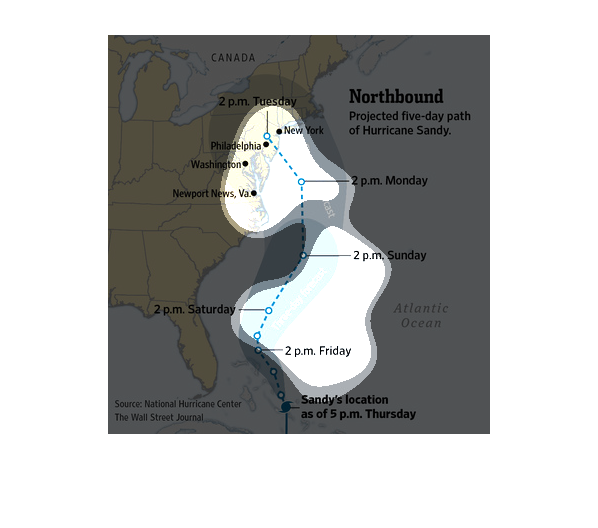
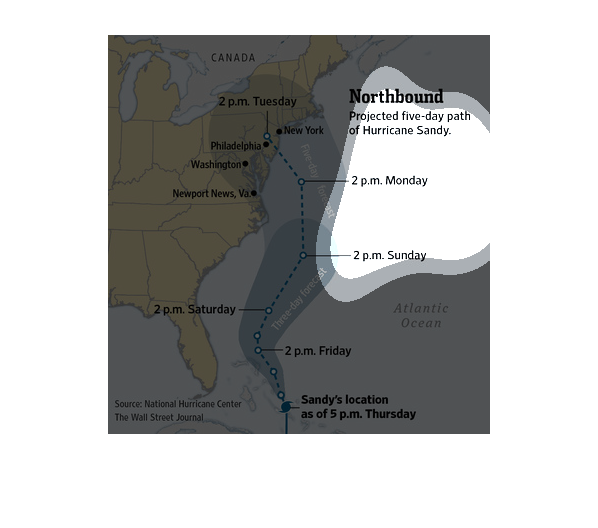
This chart shows the eastern coast of the United States. It shows the forecast for Sandy the
hurricane. It seems that although the southern coast will be safe, the northern coast will
possibly get hit with in the next three days.
The vector image shows a partial map of the east cost of USA depicting the movement of hurricane
Sandy by time and day. Starting at NY moving South. The source of information comes from the
National Hurricane Centre and Wall Street Journal.
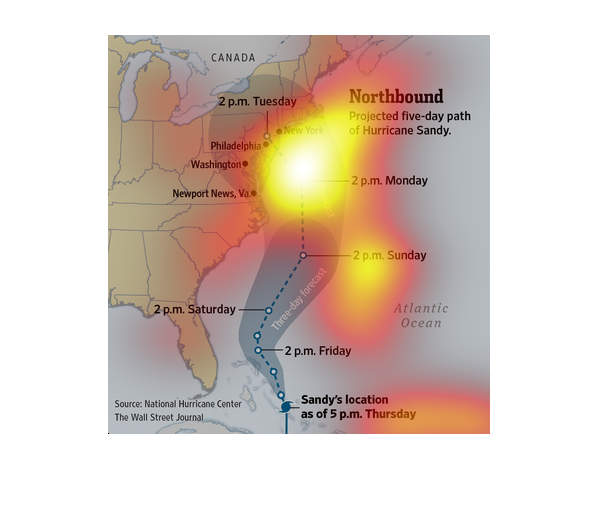
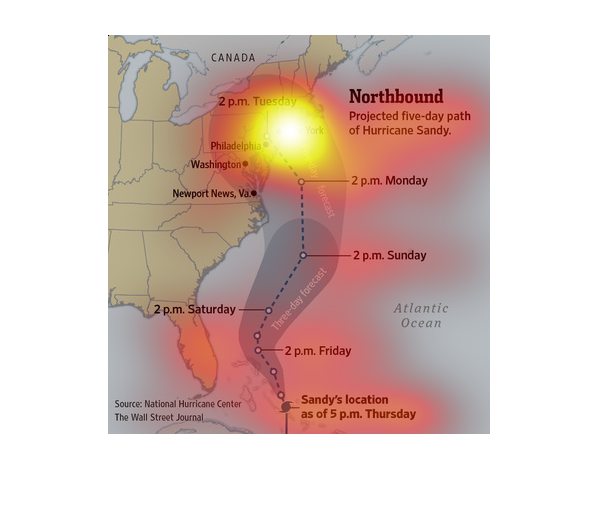
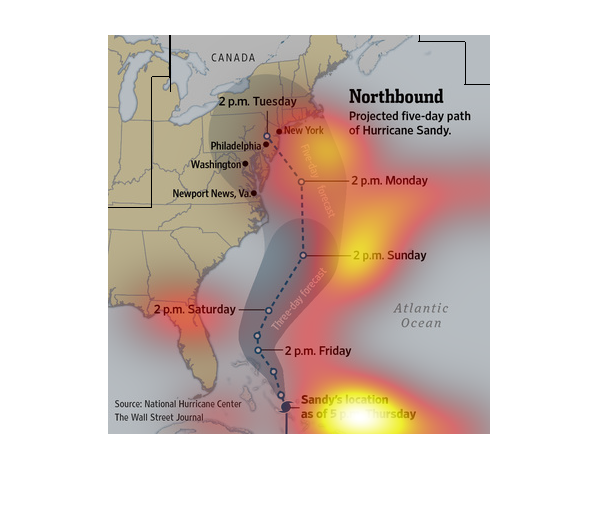
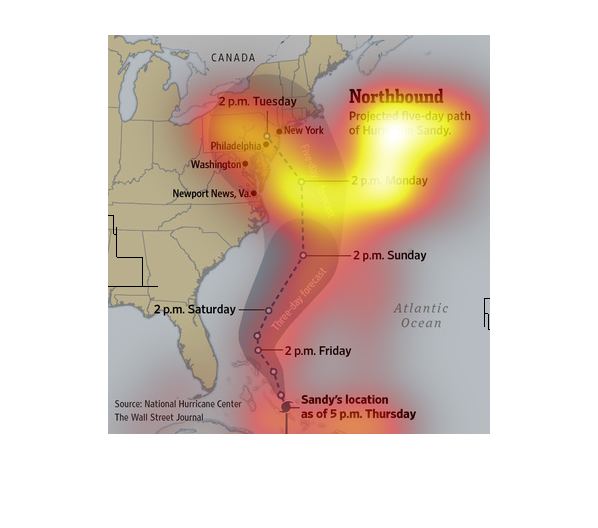
This chart describes North Bound. Specifically, the projected five day path of hurricane Sandy.
Different region on the chart are represented by dots on a map.
This illustration demonstrates the trajectory of hurricane Sandy through the east coast of
the United States of America. It is done in an hour per hour, exact timing of occurrences.
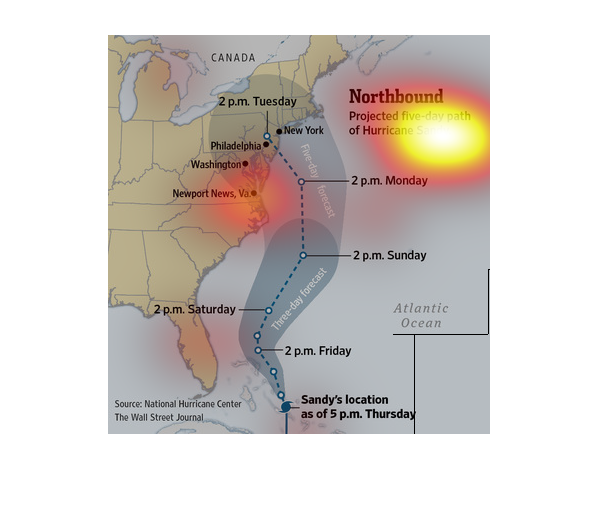
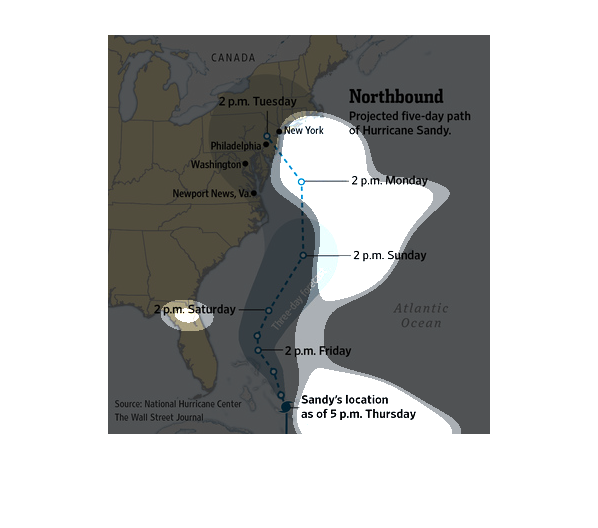
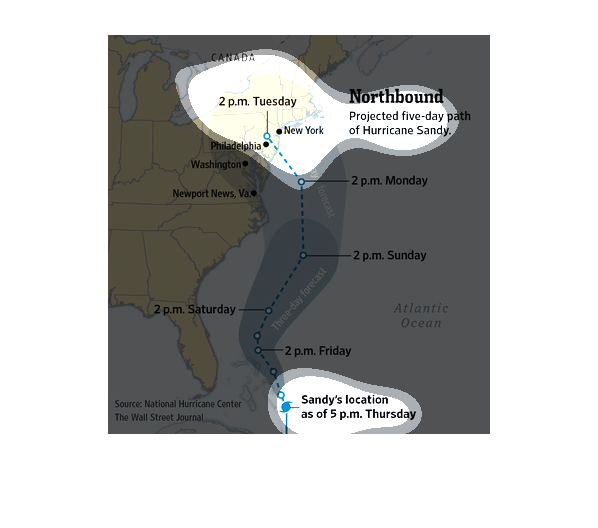
The figure presented is titled Northbound: projected five-day path of Hurricane Sandy.  The
figure is a representation of the projected path of Hurricane Sandy.
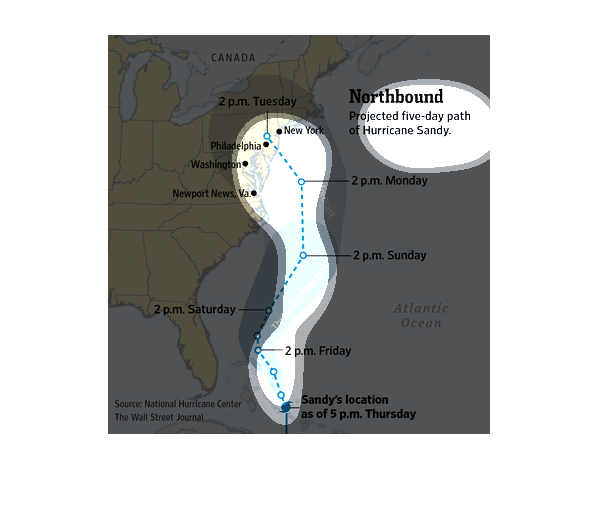
This map depicts the 5 day, Northbound path of Hurricane Sandy. It began off the shore of
Florida at 5 pm on Thursday, It reached land 2 pm Tuesday between Philadelphia and New York.
This chart describes Northbound. Specifically, the projected five-day path of hurricane Sandy.
Different regions on the chart are represented by black dots.
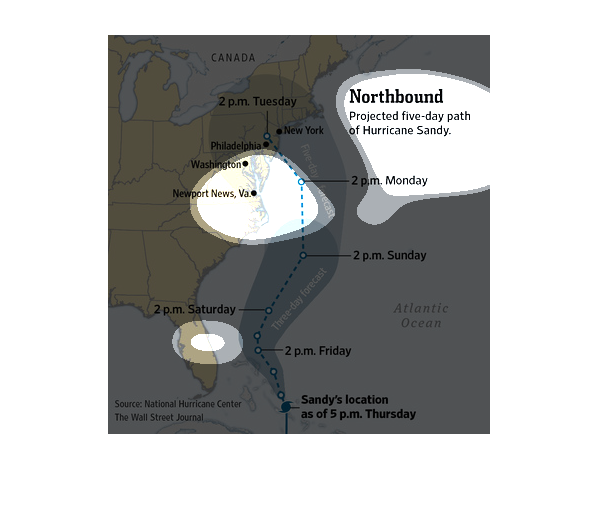
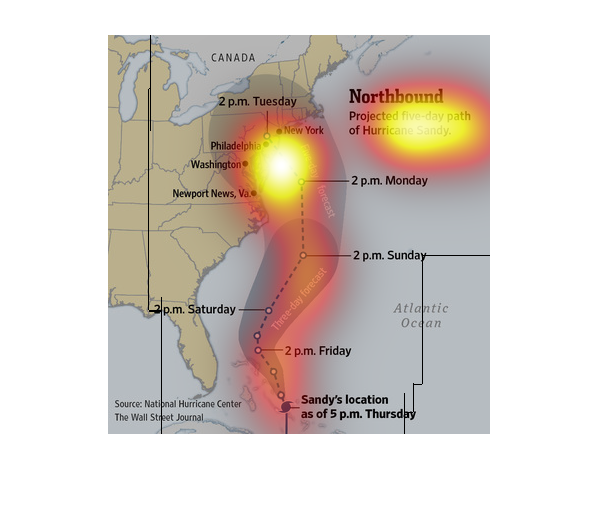
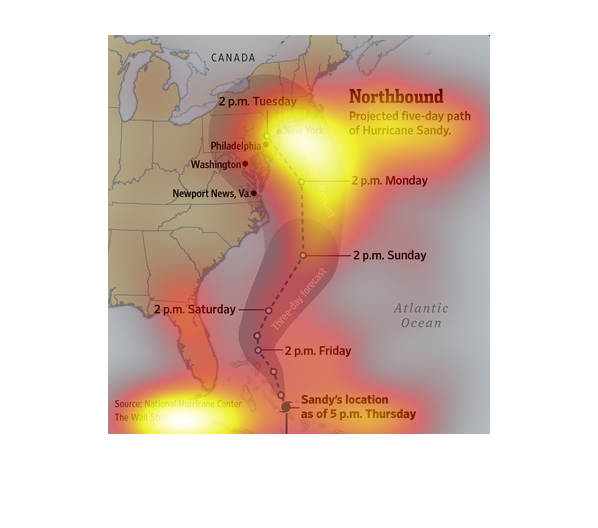
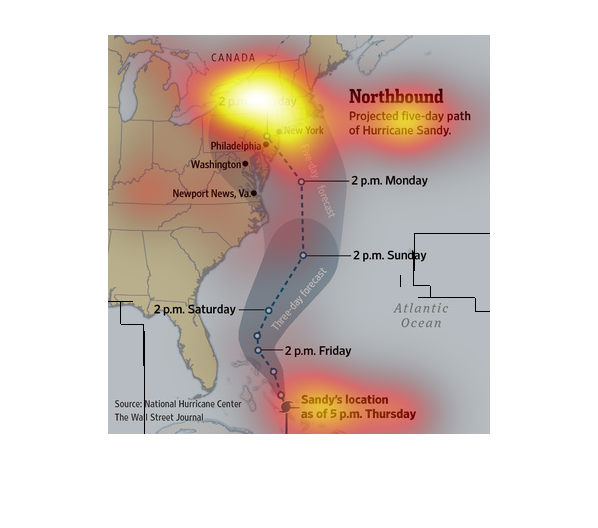
This is a map of the eastern seaboard of the United States showing super-storm Sandy's position
as well as a three and five day forecast cone of error.
This image is about hurricane sandy. It shows the projected path of the hurricane. It lists
the amount of days and time for the forecast along its path.
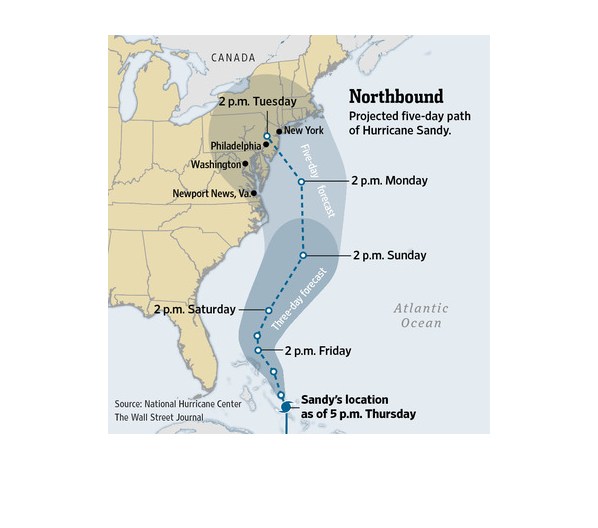
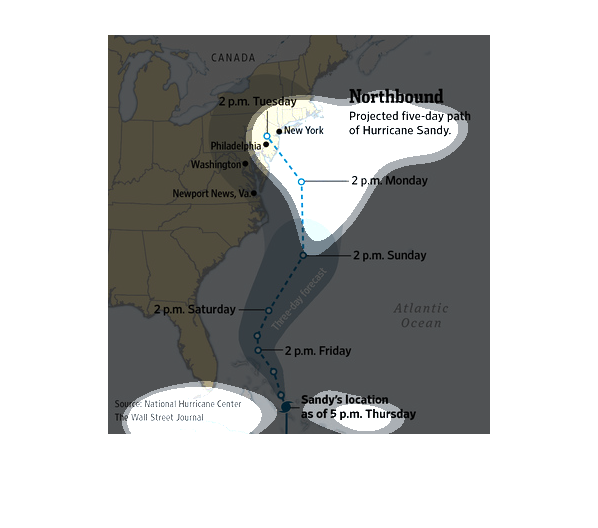
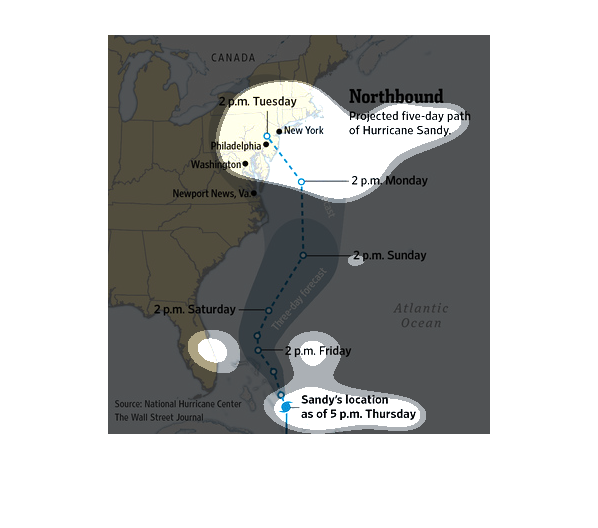
This chart shows a projected 5-day path of hurricane Sandy at the eastern coast of the United
States.  It begins on 5pm Thursday in the Caribbean and concludes 2pm Tuesday near New York
City.   It's range is off the coast for the first few days and ends up on land.
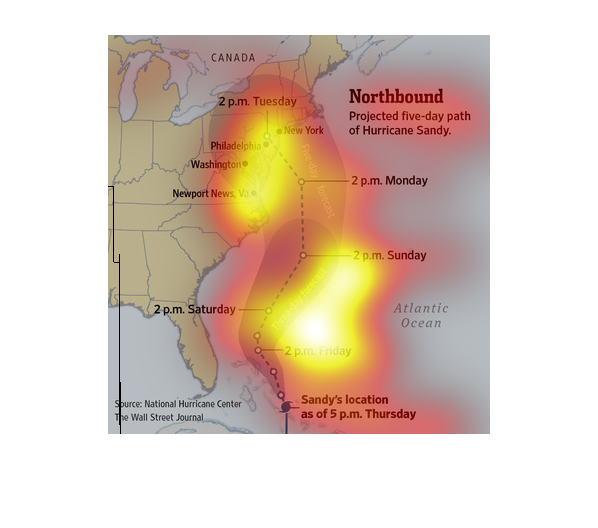
This is a map that is meant to illustrate and forecast the areas that might be impacted by
hurricane sandy. It shows the projected five day path that the hurricane will take.
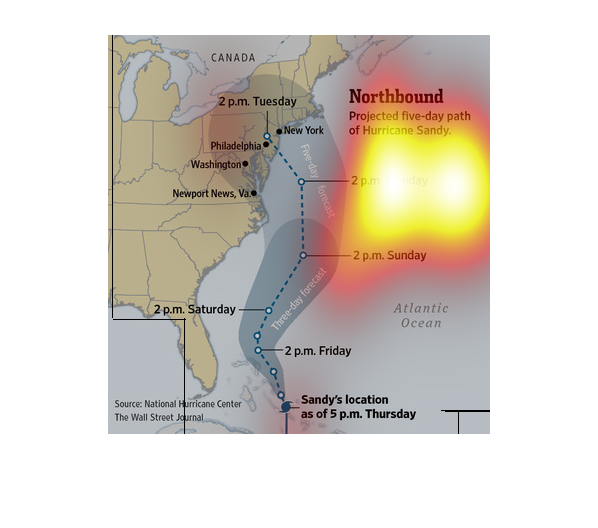
The image depicts the projected 5-day path of hurricane Sandy. The image shows hurricane Sandy's
path making it's way toward landfall as the days progress.
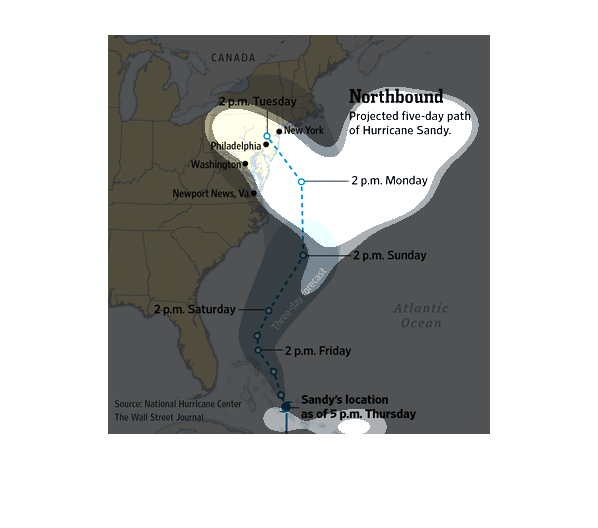
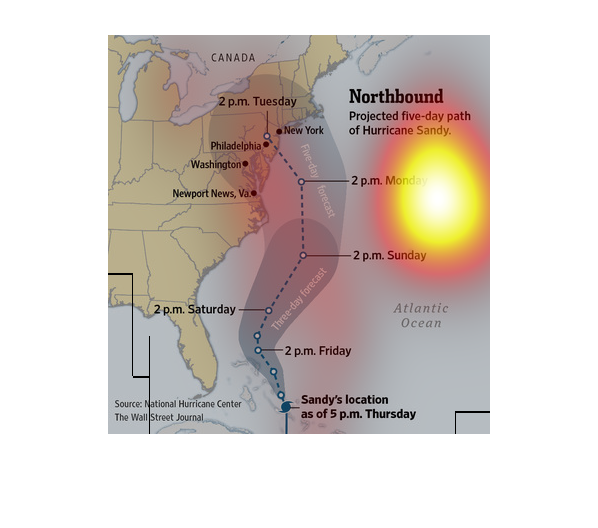
We see a map of the east coast of the United States showing the northbound five day path of
hurricane sandy. Hurricane sandy went up the east coast and was head for a point in between
philadelphia and new york city center