This chart describes capital flight. To gauge capital flows, the journal compared the change
in China's foreign-exchange reserves with movements in the factors that cause those reserves.
The figure presented is titled Capital flight.  The figure is an actual representation of
the statistical data shown for global net capital for multiple countries.
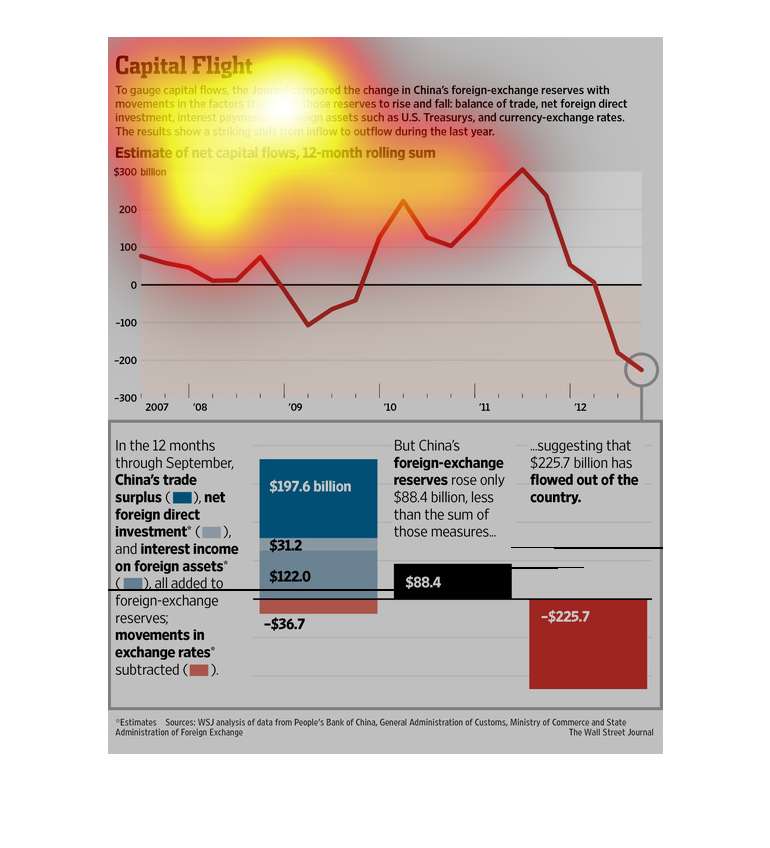
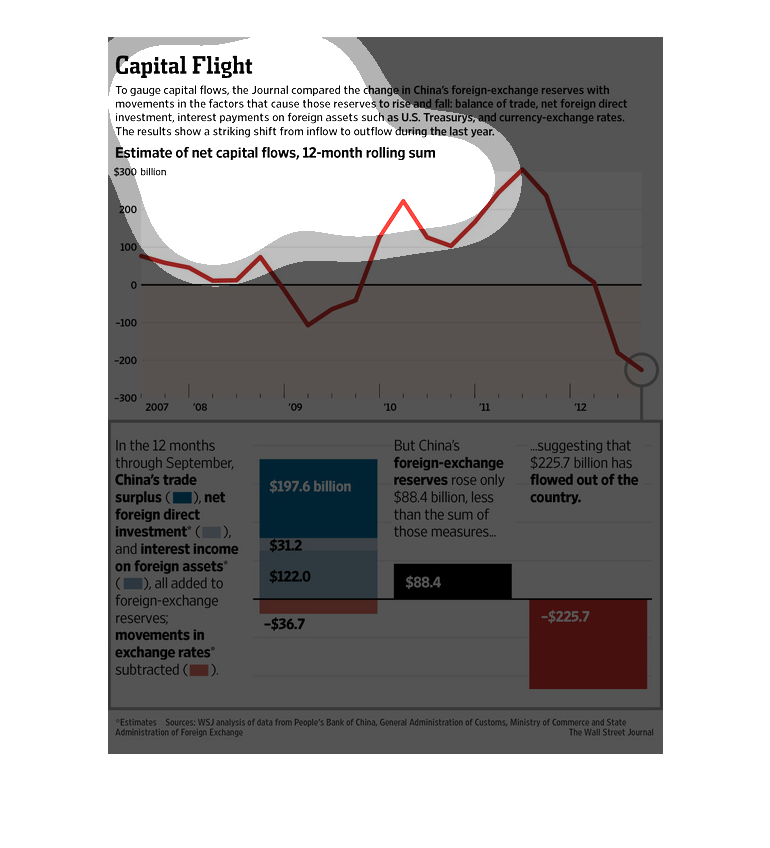
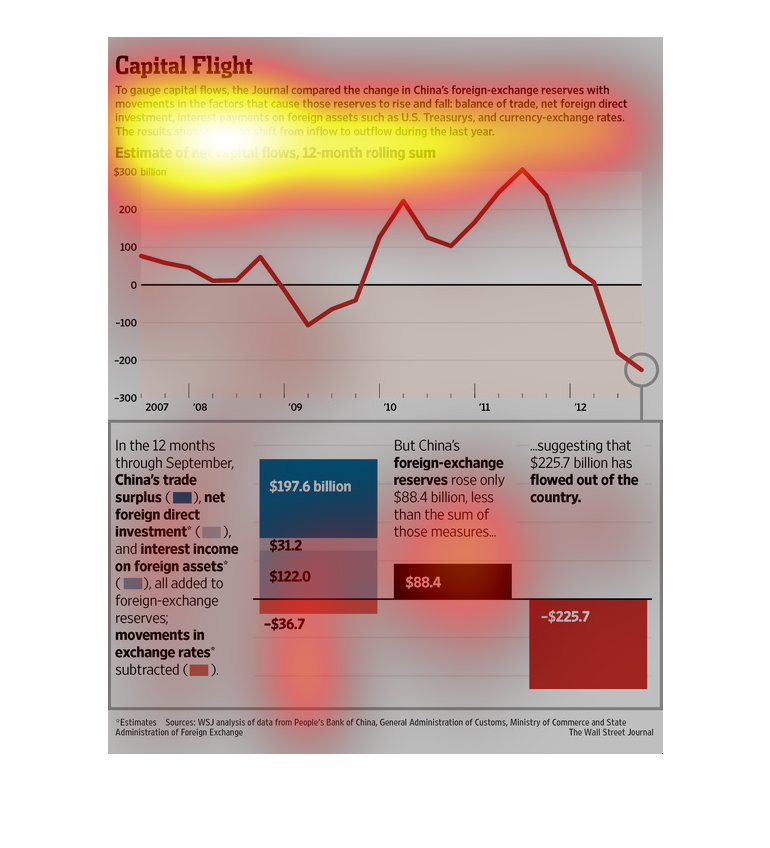
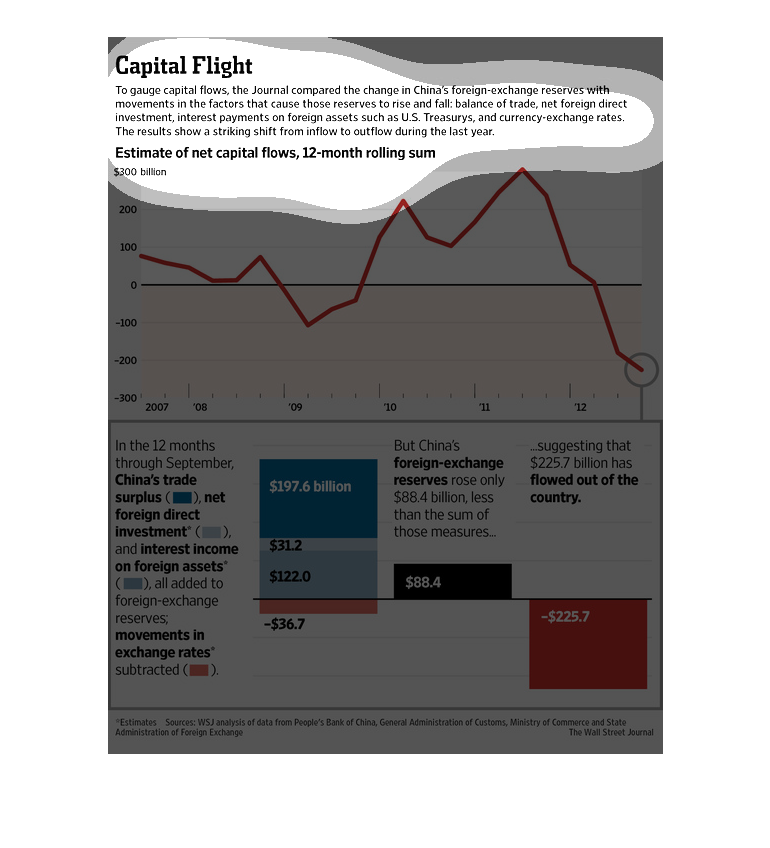
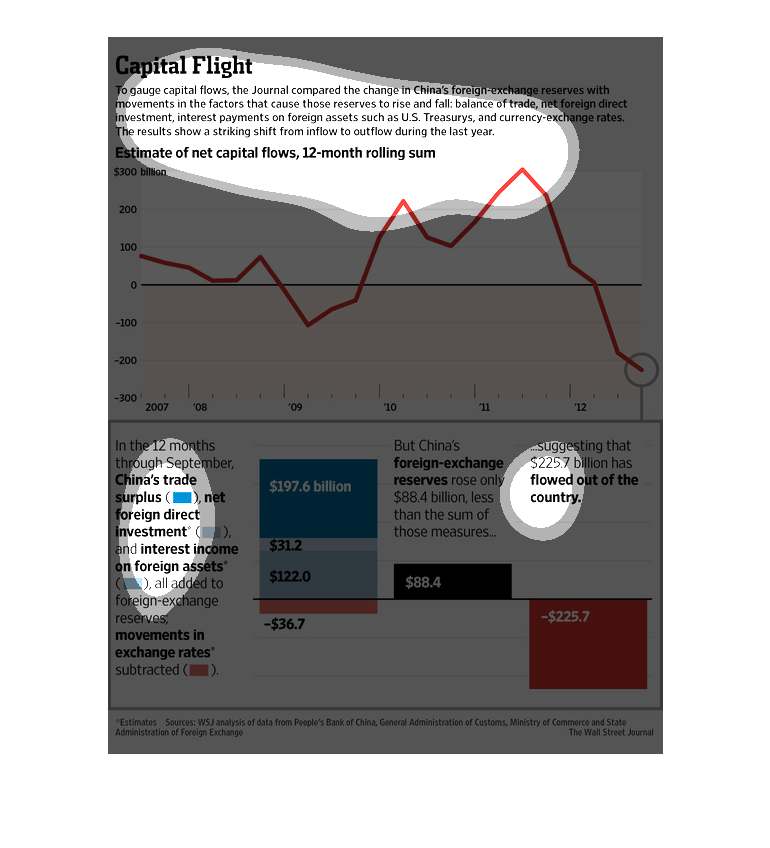
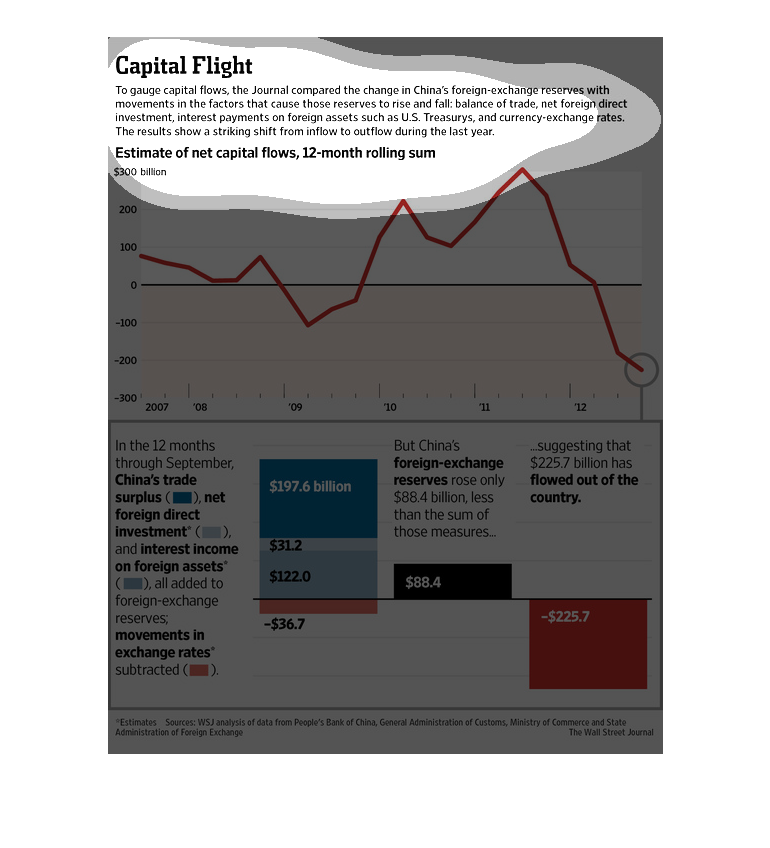
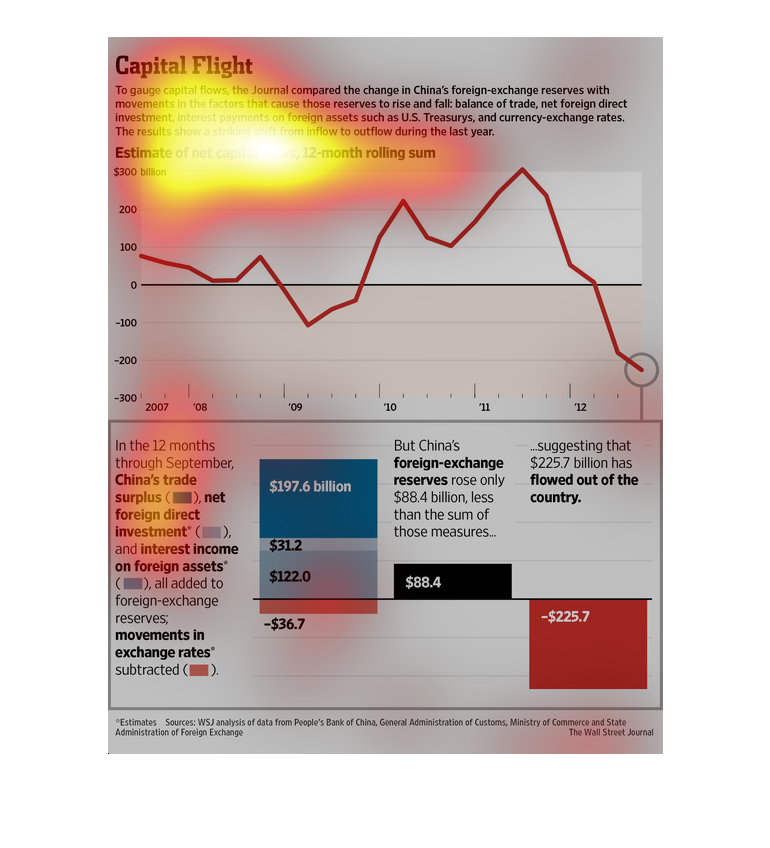
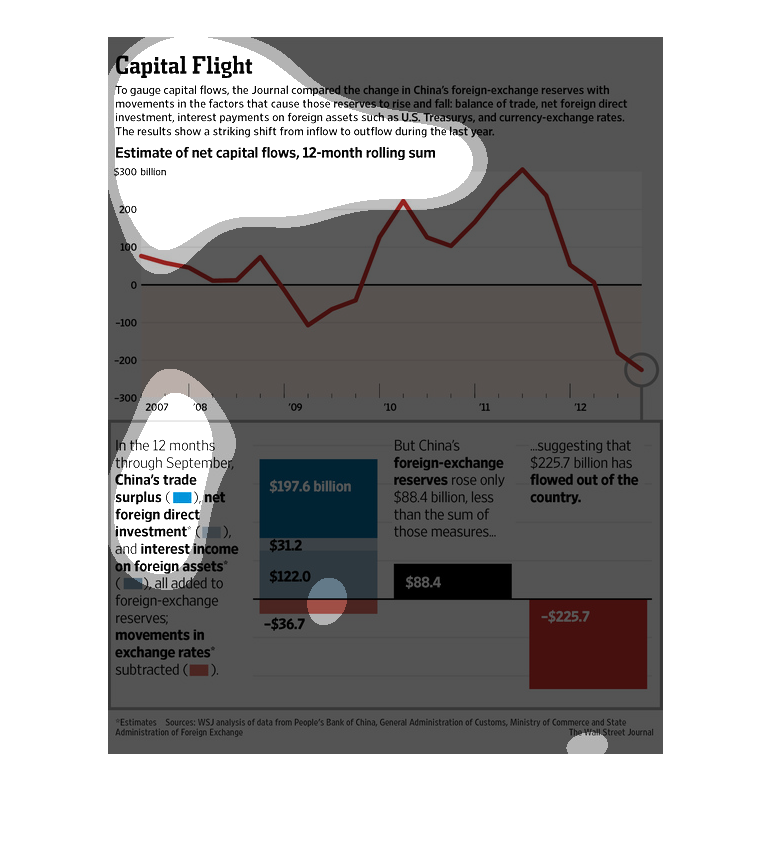
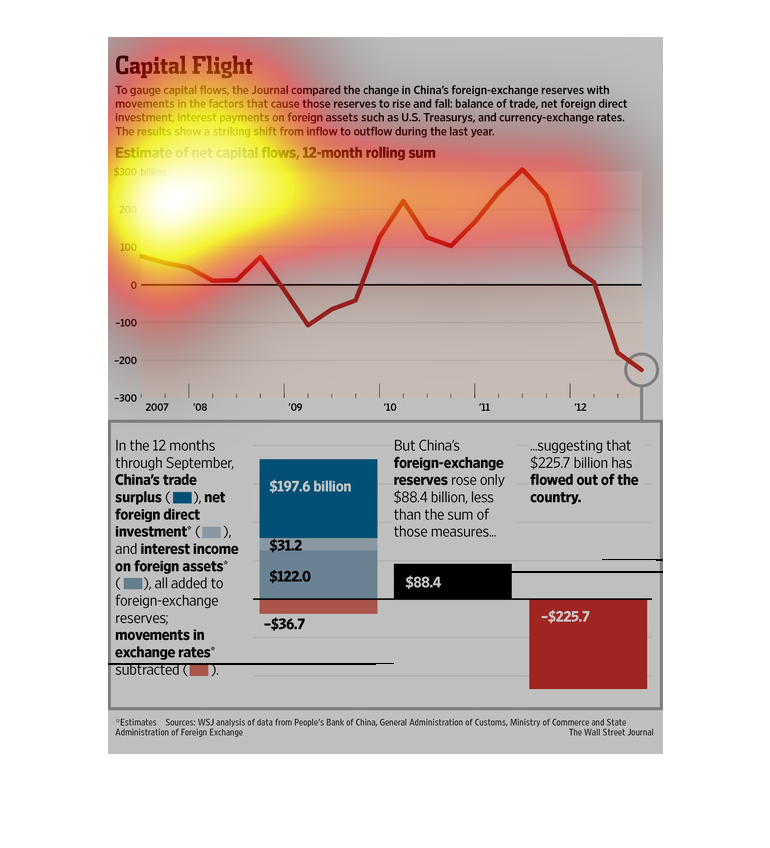
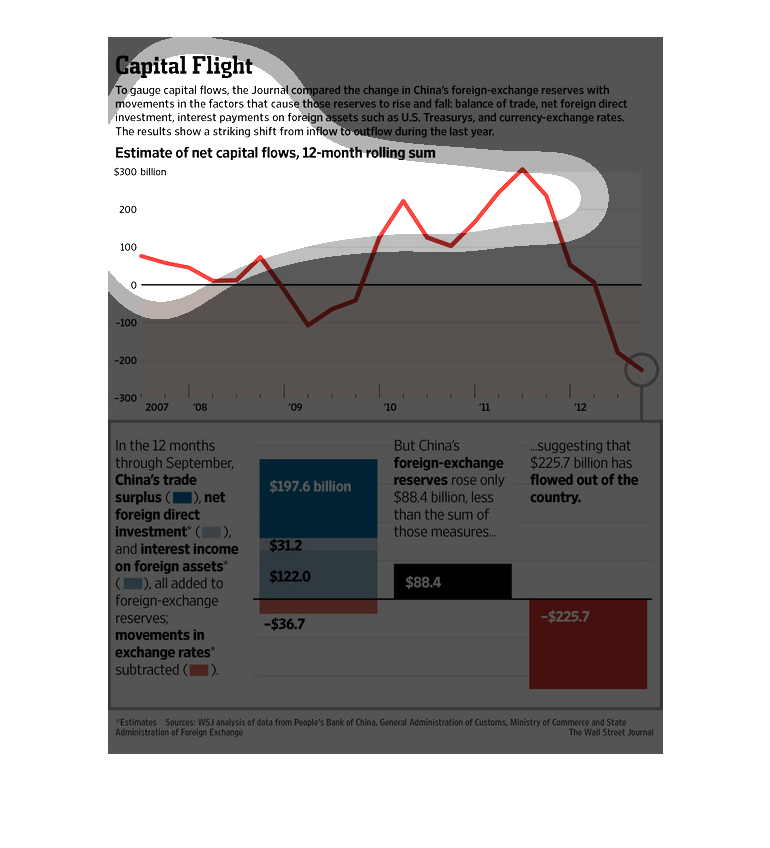
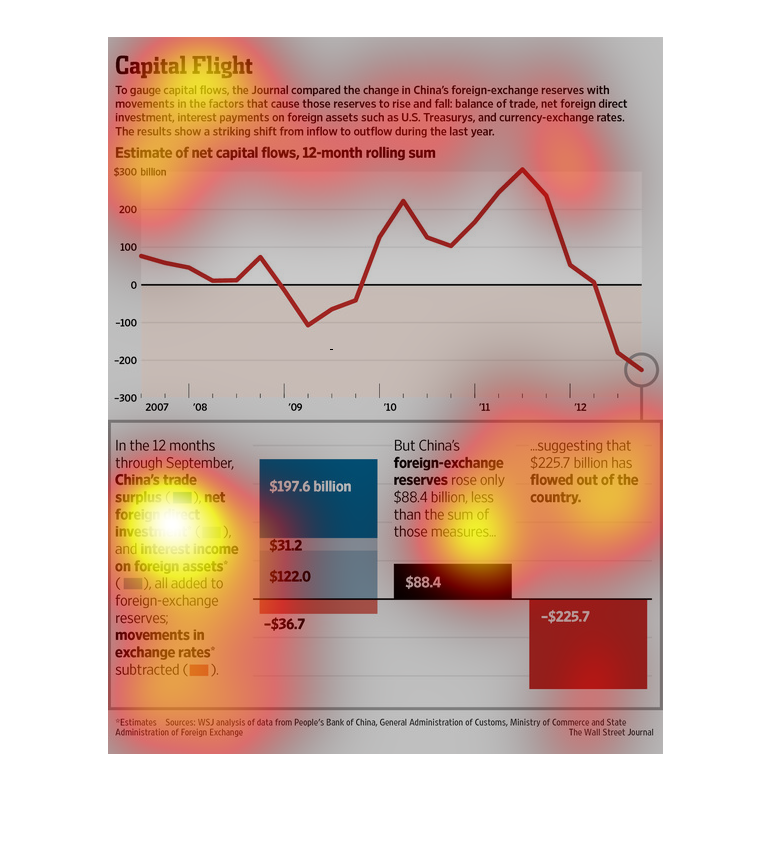
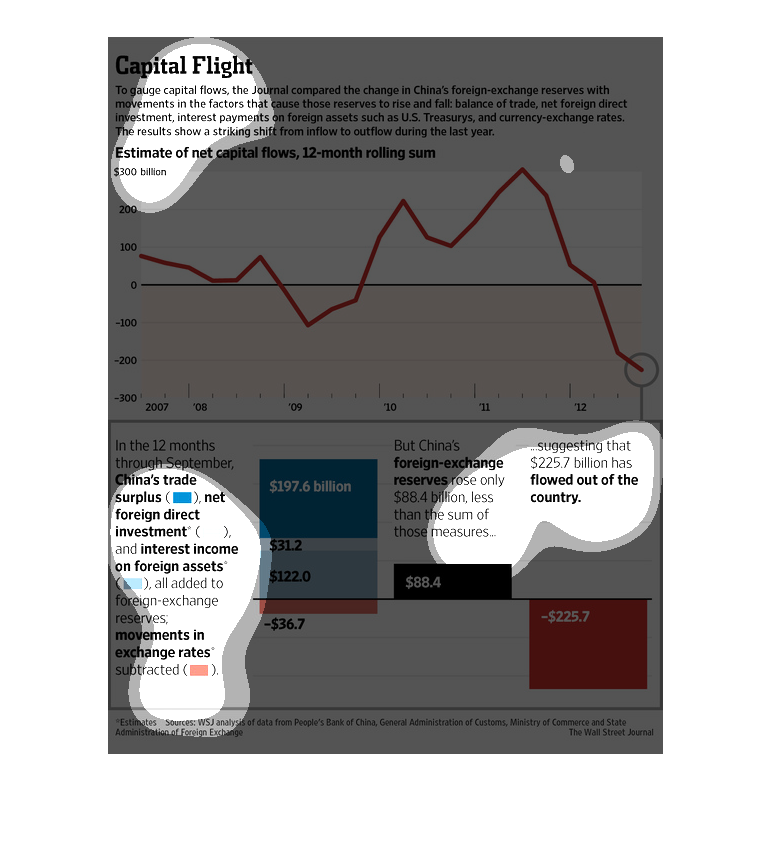
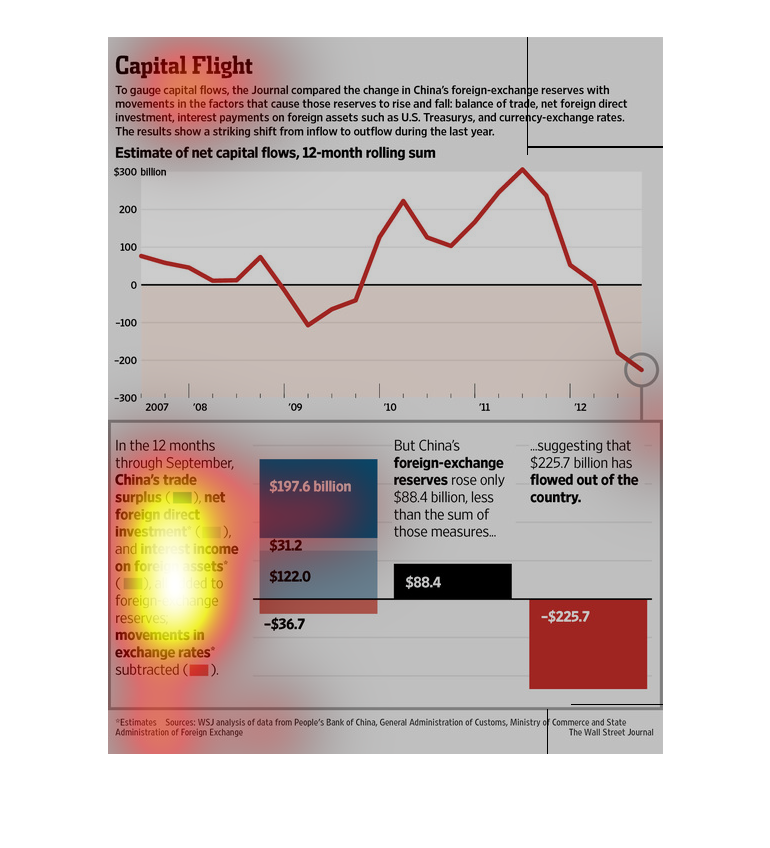
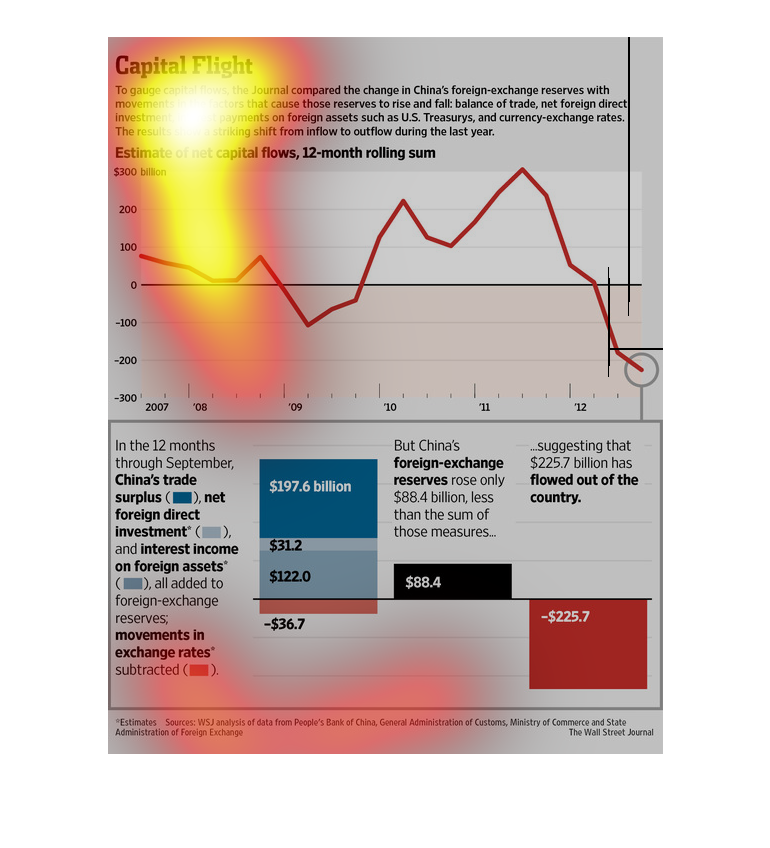
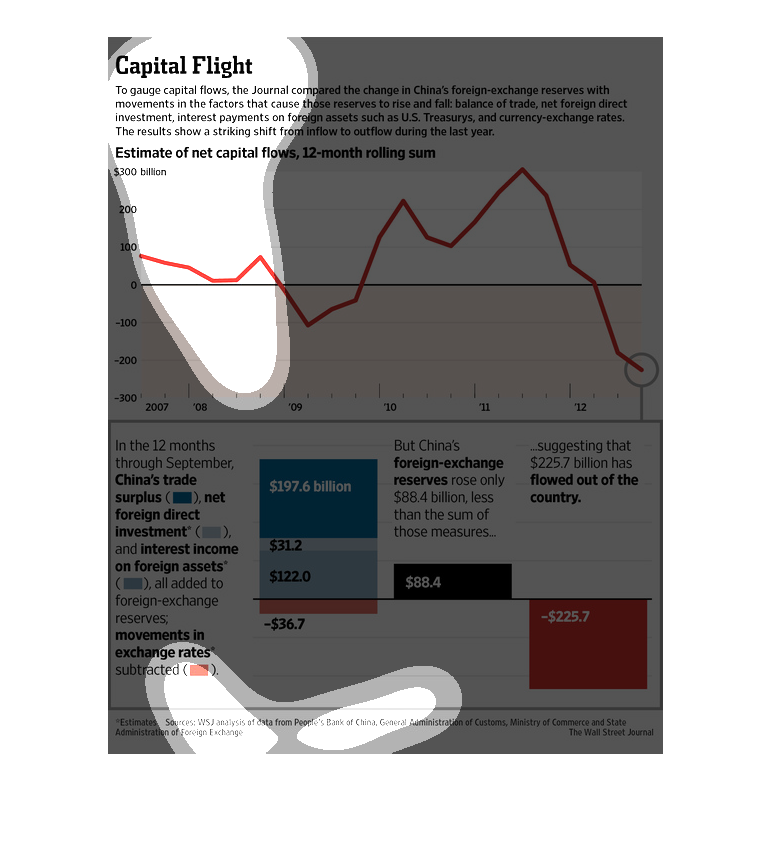
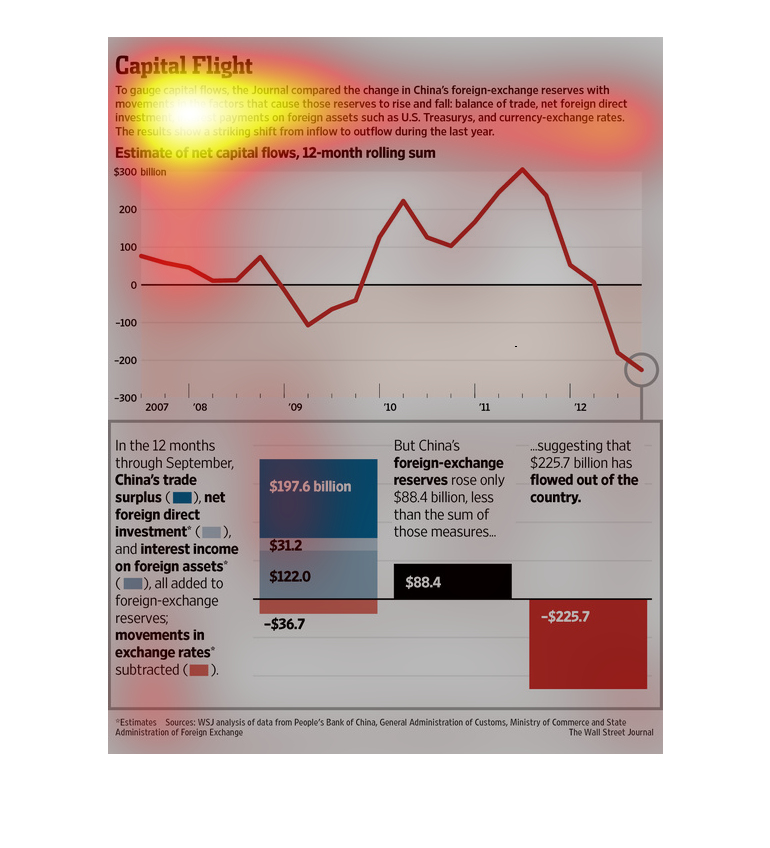
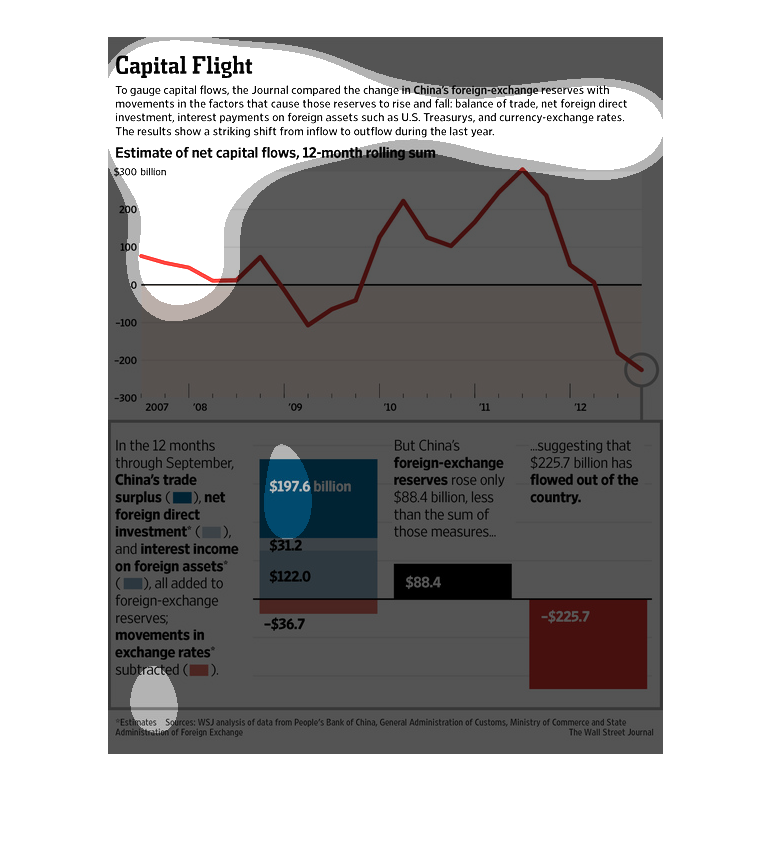
capital flight, a graph showing the flow of capital with a 12 month rolling sum, we see a
line graph, one line going up and down, rising, and then plumetting
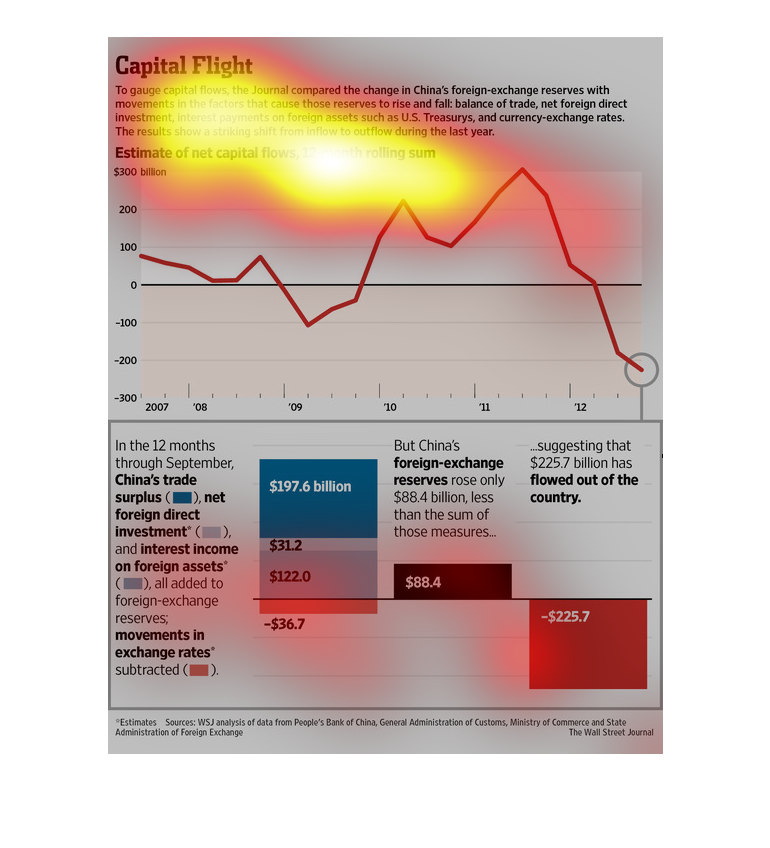
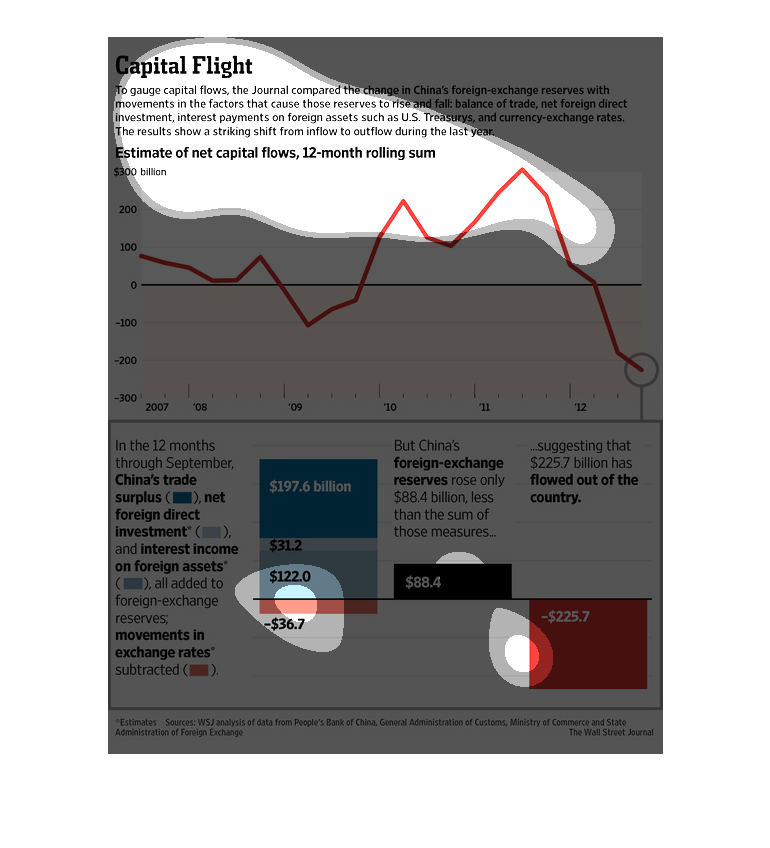
The chart shows the capital flight that to gauge capital flows of the journal compared the
change in China's foreign exchange reserves with movements in the factors that causes those
reserves to rise and fall balance of trade. That net foreign direct investment, interest payments
on foreign assets such as U.S. Treasury and currency- exchange rates. The results show striking
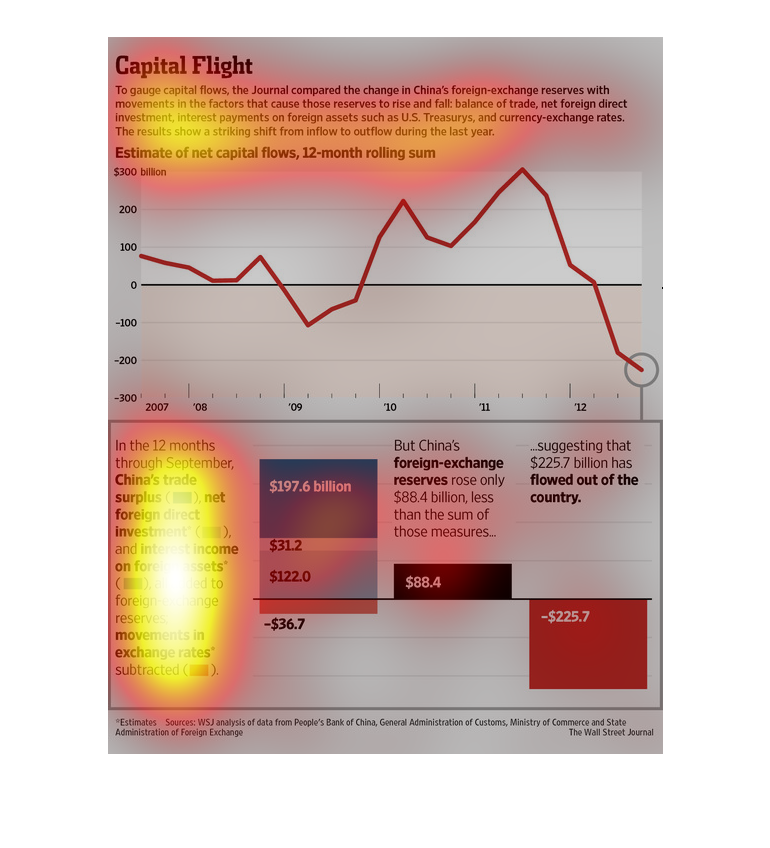
shift from inflow to outflow during the last year. In the 12 months through September, China's
trade surplus was $197.6 billion net foreign direct investment $31.2 and interest income on
foreign assets is $122.0 all added to foreign-exchange reserves. And movements in exchange
rates was subtracted to -$225.7.
There are two charts here. One is a line graph, one is a bar graph. They seem to be illustrating
the amount of cash that is flowing out of China and how little is coming back in. The chart
suggests that $225.7 billion has left the country.
This chart describes capital flight. Specifically, the change in China's foreign-exchange
reserve with movements in the factors that cause those factors to rise and fall.

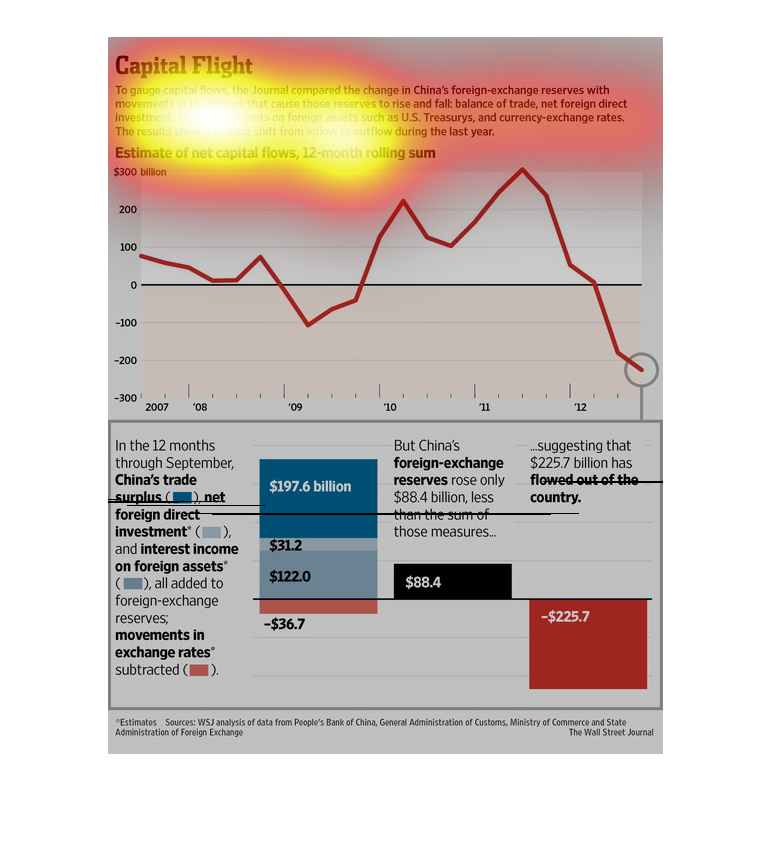
An infographic showing the loss of investment capital over a 12 month period in 2007. Shows
China's trade imbalance was one of the largest contributing factors
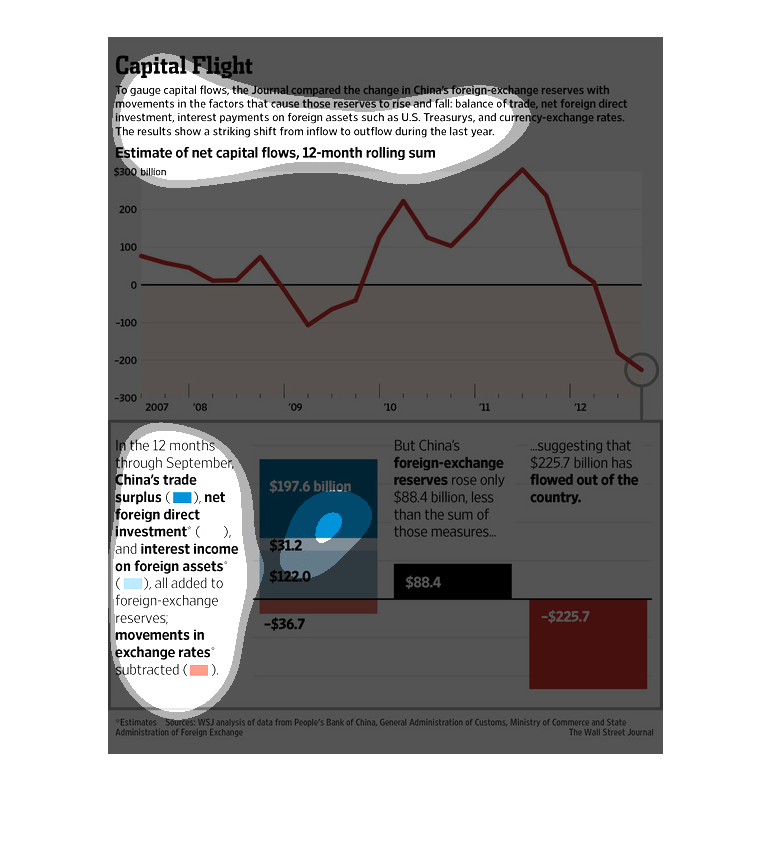
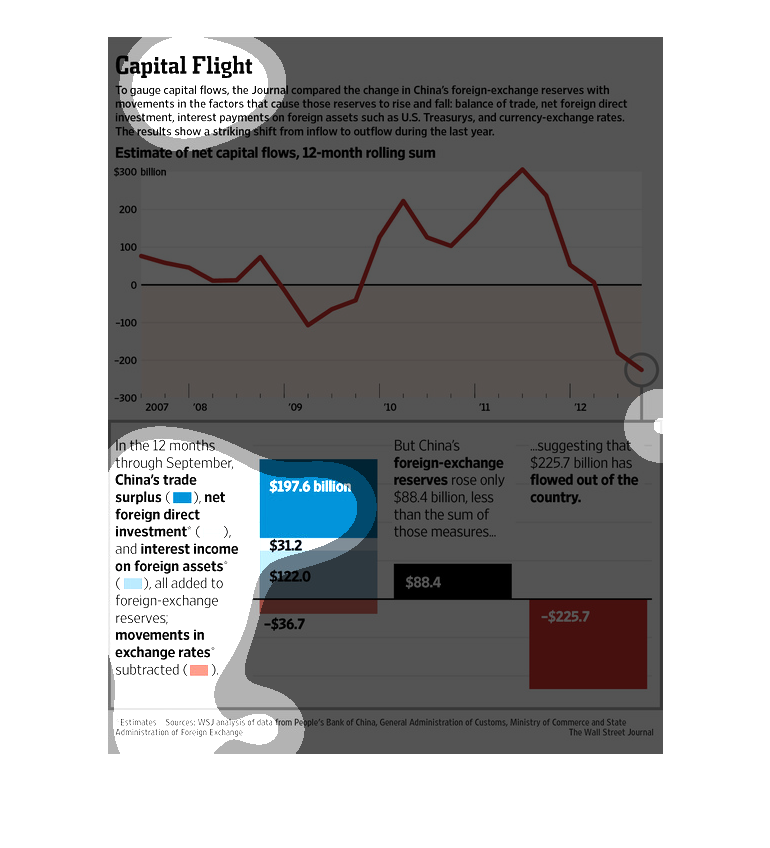
This is a graph that shows the extent to which there is capital flight. It shows an estimate
of net capital flows using a twelve month rolling sum and it in terms of billions.
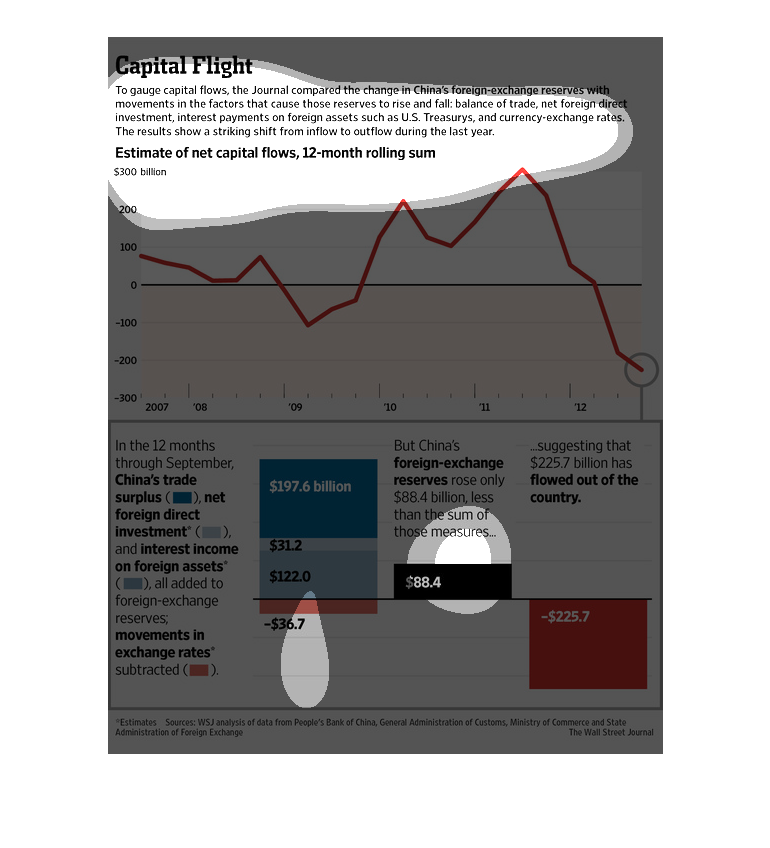
This chart shows a record of China's capital flows over a 12-month period. The data is presented
as a rolling sum. The peak of this sum appears in mid-2011, after which a sharp decline is
shown until the end of the chart, in mid-to-late 2012. The data appears to show that over
$225 billion has flowed out of China in the 12 months after reaching the peak of $300 billion.
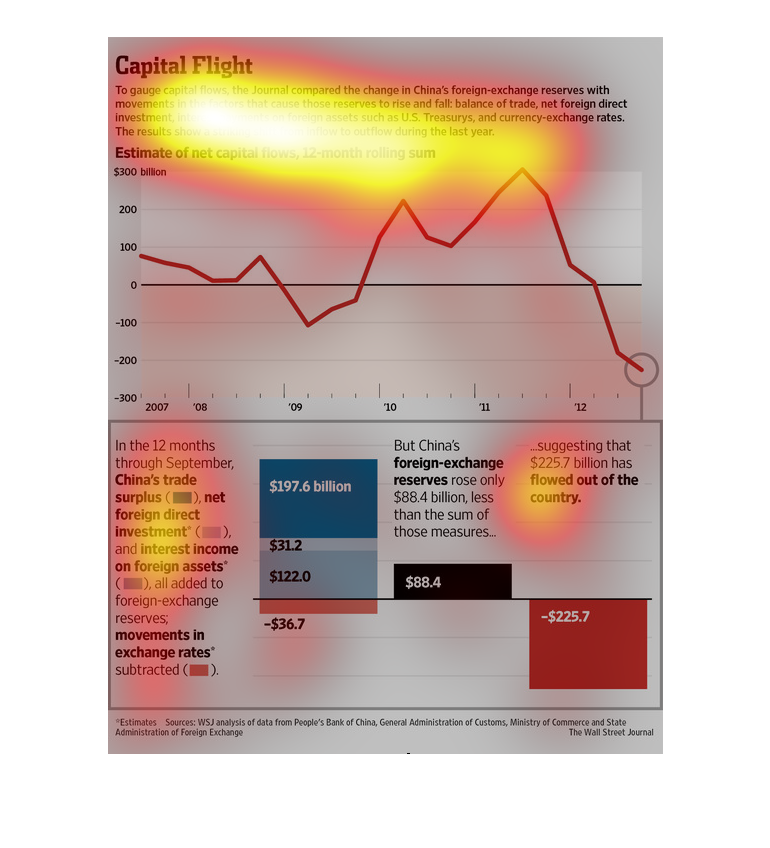
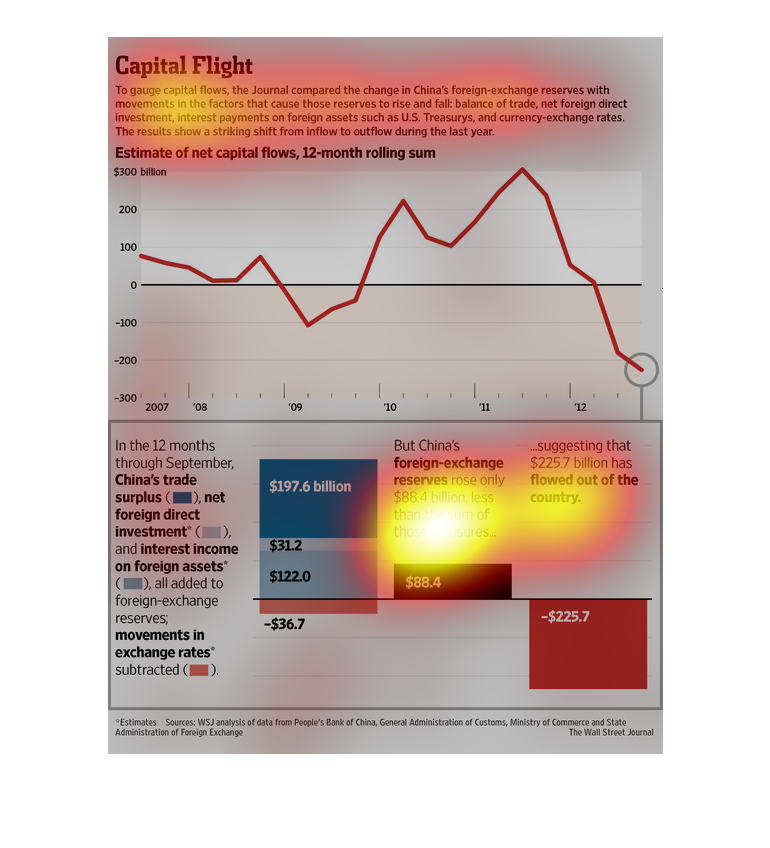
This graph illustrates capital flight from 2007 to 2012 and discusses such subjects as China's
trade surplus, the foreign deficit, and interest income on foreign assets.
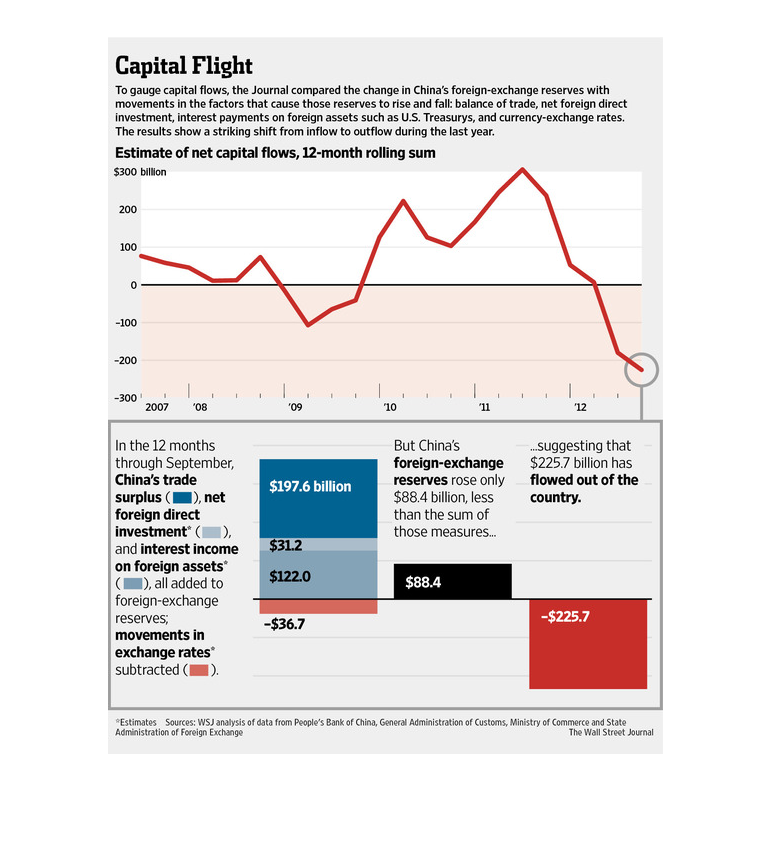
Capital Flight chart above shows a comparison of China and its foreign-exchange with Trades
and Investments.China's foreign exchange reserves rose only less of a sum of 88.4 billion.
Suggestion is that 225.7 billion has flowed out of the country.
This chart from the Economist or similar publication relates to capital flight and how it
has moved over time. Problem is it is so dense it is hard to make out more
Over the years the People's Republic of China over the years has been quite involved in the
world's finances; from buying up debt to textile trades. This chart shows the fluctuation
of funds within the Republic with a period of months.
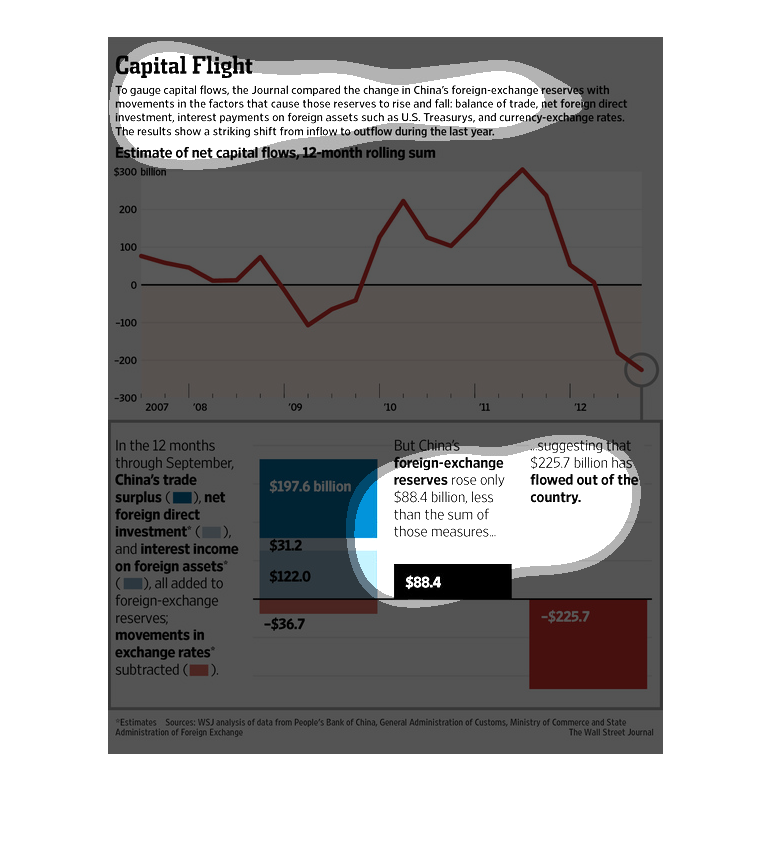
The following chart demonstrates the flow of China's foreign exchange reserves. The chart
first shows a steady increase within the first 6 months; however the last 6 months show its'
peak before it drastically falls in the last month. Its' highest point was $197.6 billion
while its' lowest point hit -$36.7 billion. Its largest is $88.4 billion.