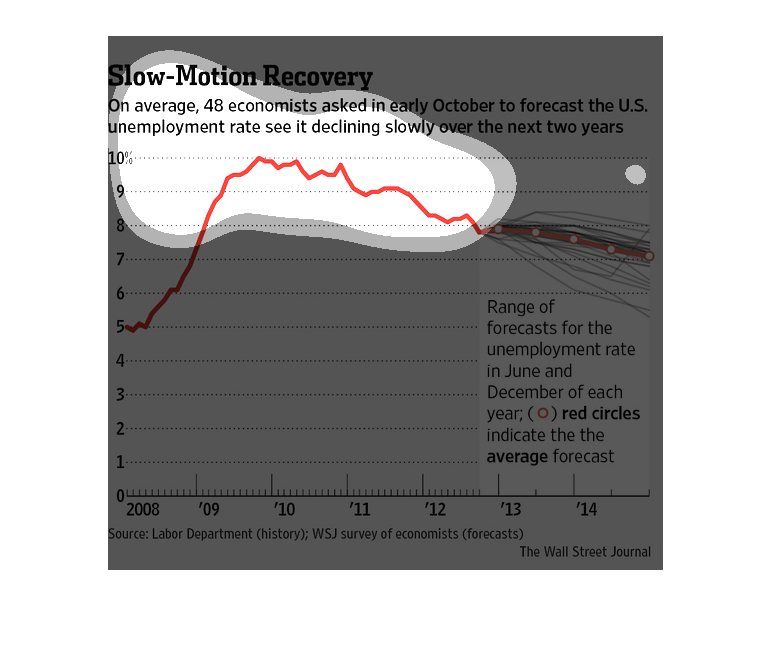
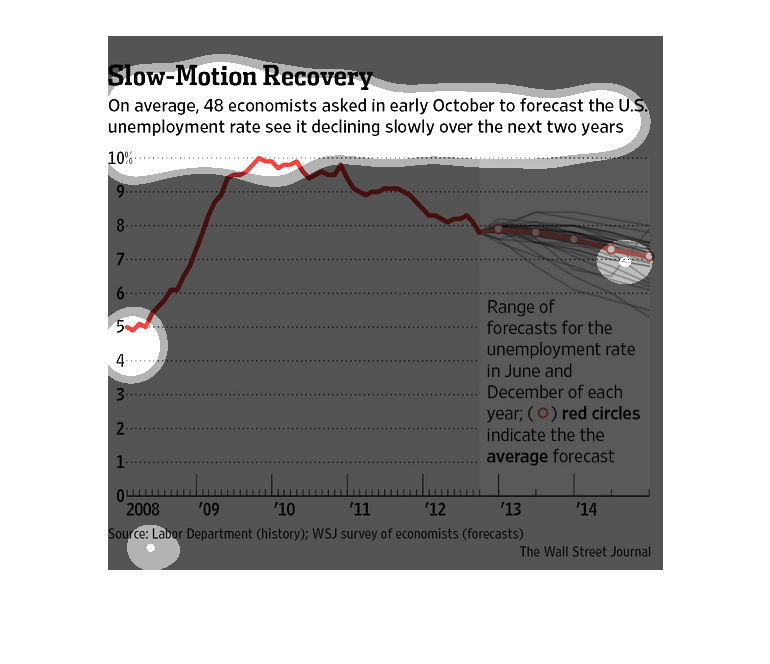
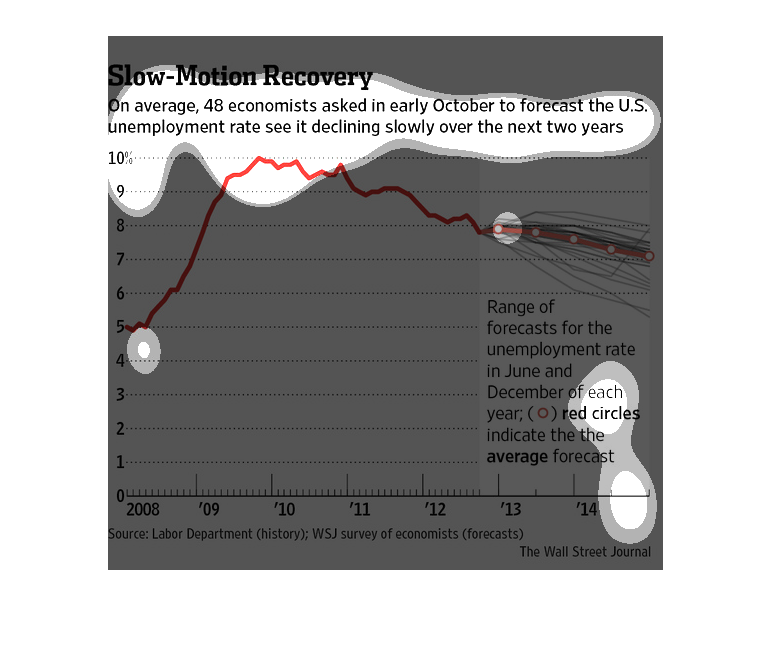
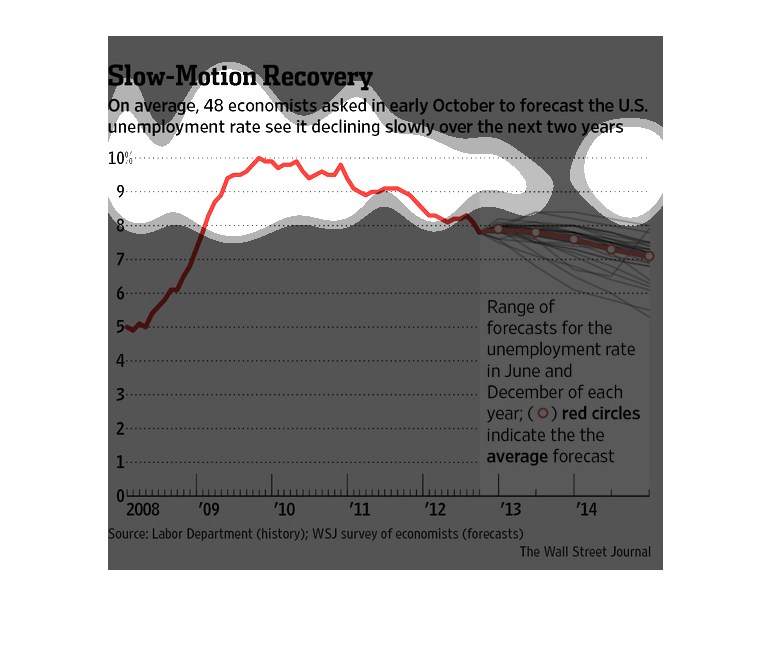
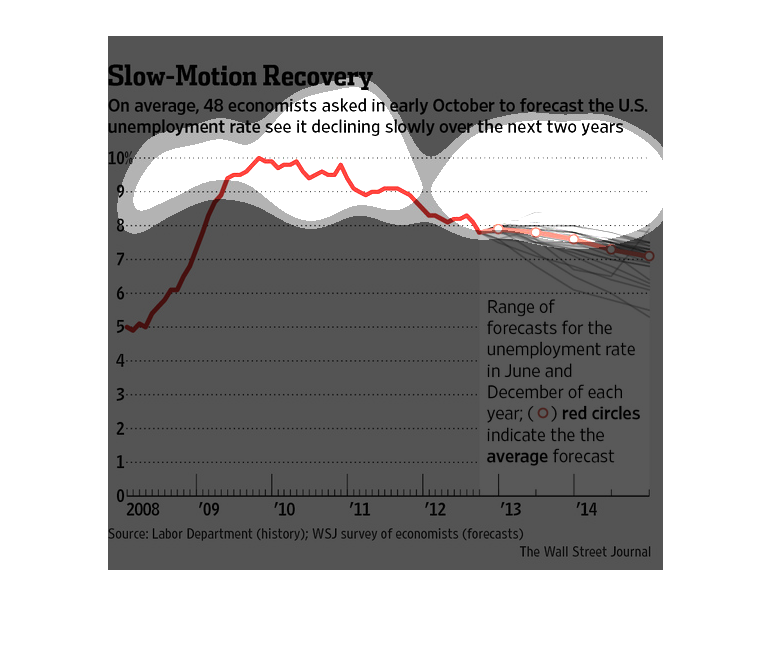
This chart describes slow motion recovery. Specifically, on average, 48 economists asked in
early October to forecast the US unemployment rate, see it declining slowly.
Unemployment is on a downward slope, according to this study. When the recession hit, it was
devastating but now a days there is plenty of jobs to be had, at least this graph says there
is. Go jobs? That is open to debate.
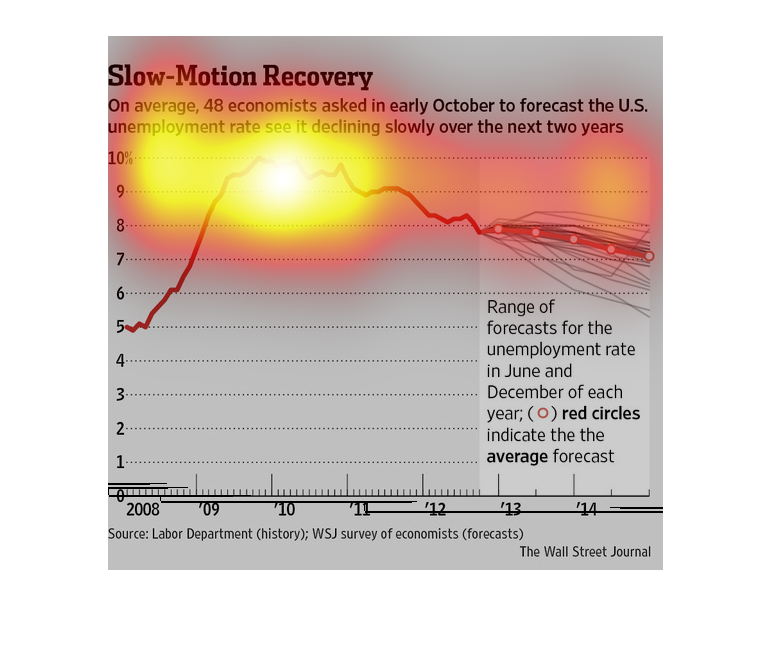
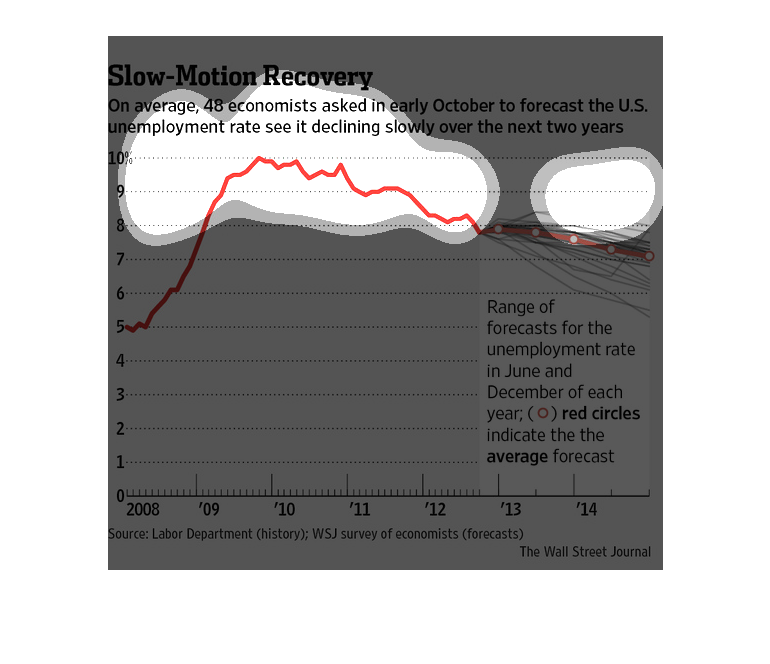
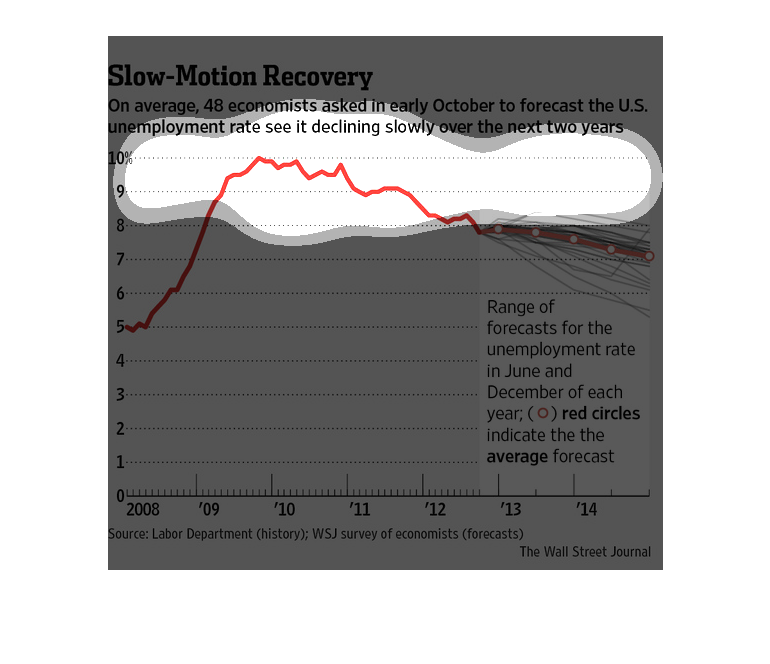
This chart is titled slow-motion recovery.  On average, 48 economists predict that the employment
rate will decrease over the next two years. From 2008 to 2010 the unemployment rate has risen
from around 5% to 10%. Economists now predict that unemployment will decrease to almost 7%
by 2014.
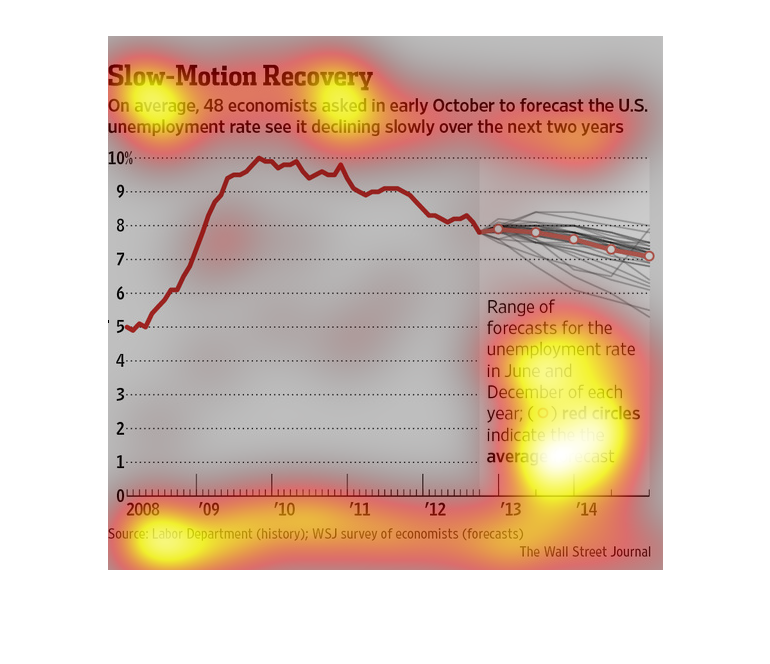
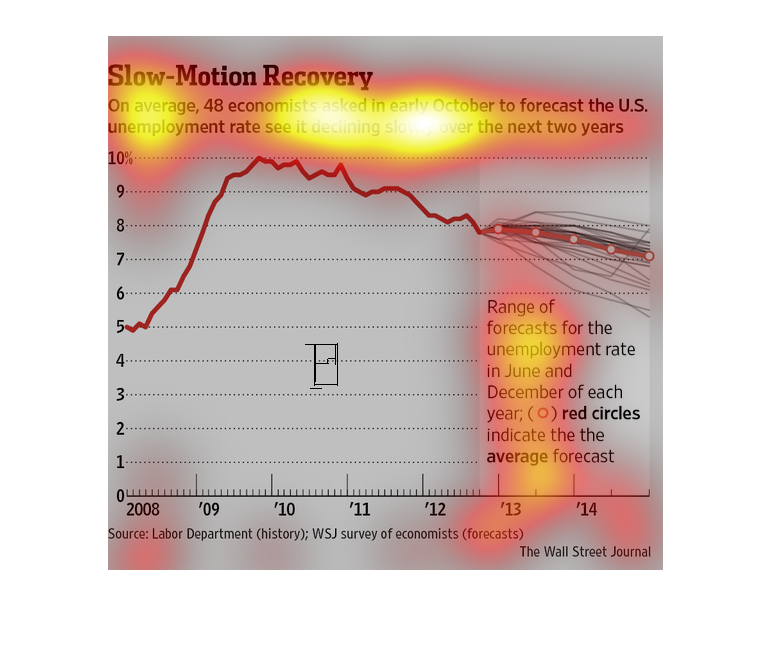
The graph shows the prediction of an estimated unemployment rate in the united states in the
next 2 years by economists. The economists expected 2010 to have a 10% unemployment rate.
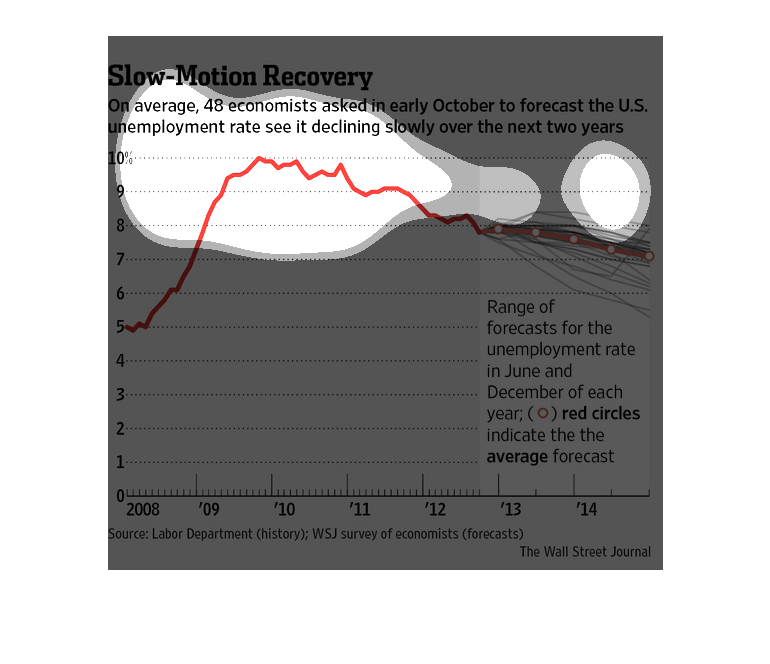
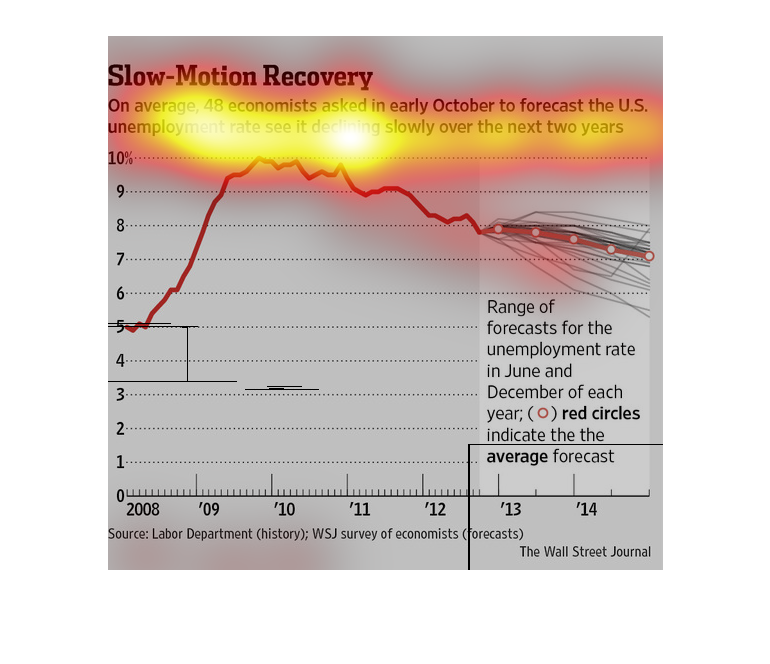
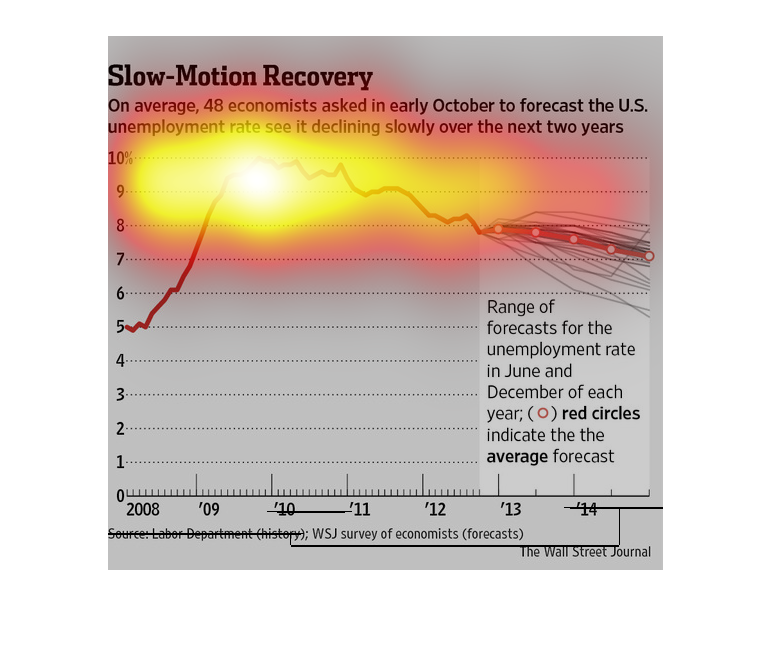
The image shows that the United States' unemployment rate is forecast to slowly decline over
the next two years. The unemployment rate was a staggering 10% in 2010 after seeing a huge
increase from a previous 5% in 2008.
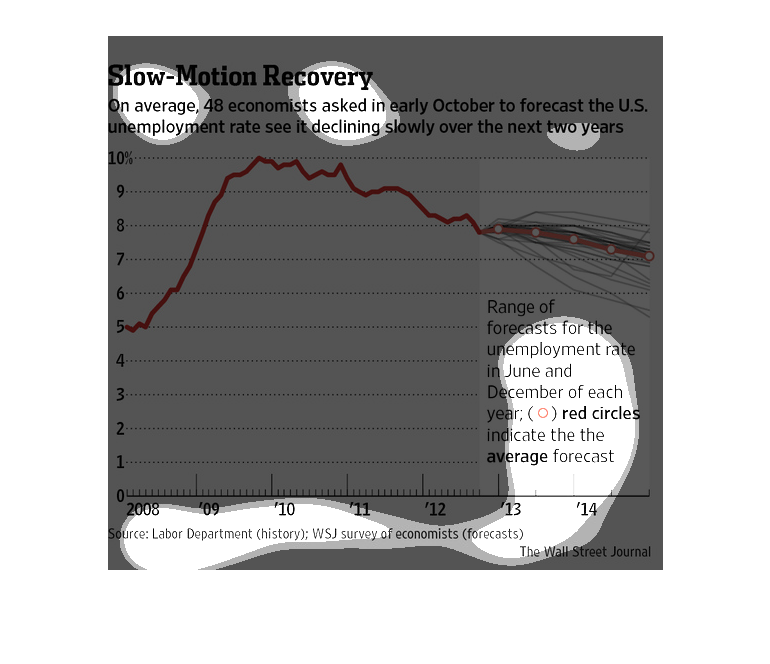
This graph is based on responses from economists forecasting the US economy over the next
2 years, from 2008. The line trends down, then diverges in 2013 based on individual responses.
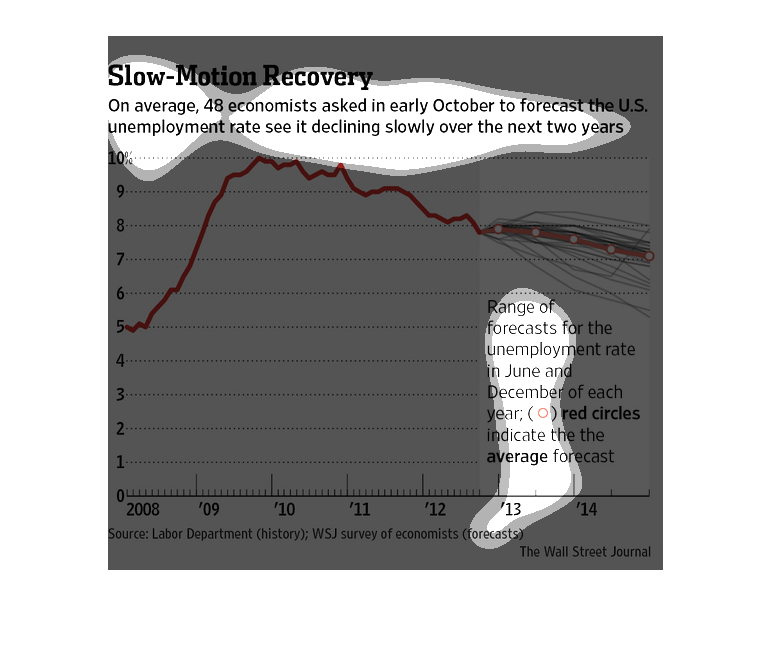
This is a graph that shows the recovery of the United States of America economy. Looking at
the graph, economists conclude that the recovery is very slow.
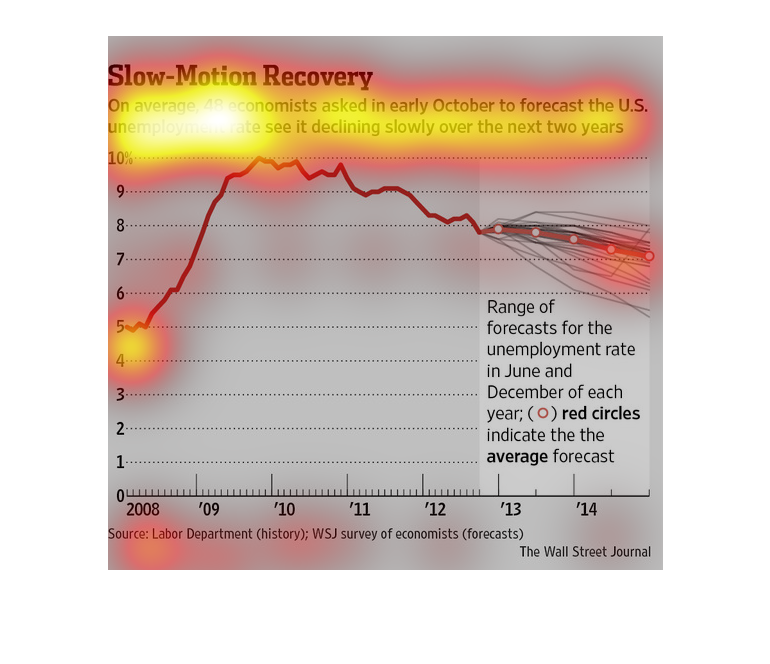
The image depicts the consensus among a majority of economists polled, as to how the unemployment
rate will fluctuate. The consensus showed that economists agreed that unemployment would in
fact decrease.
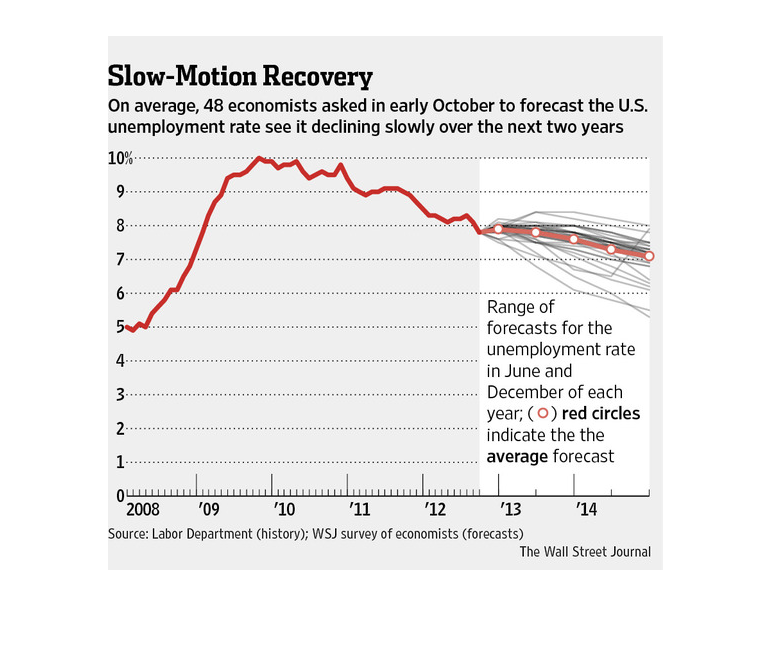
The figure presented is titled Slow-motion recovery: On average, 48 economists asked in early
October to forecast the U.S. unemployment rate see it declining slowly over the next two years.
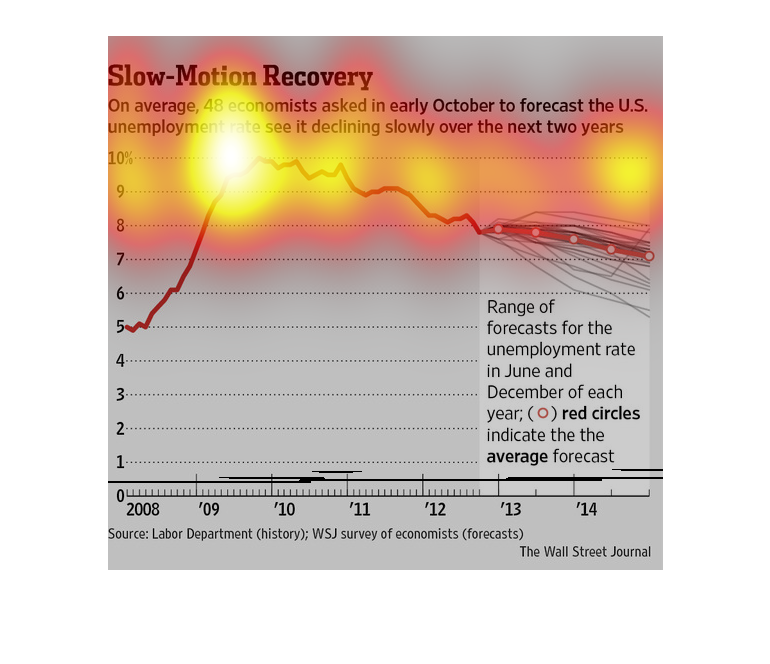
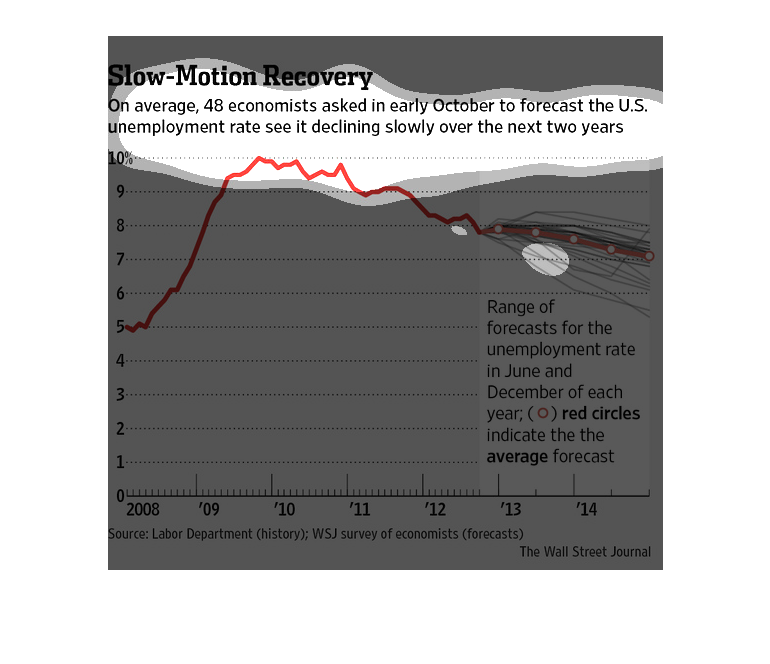
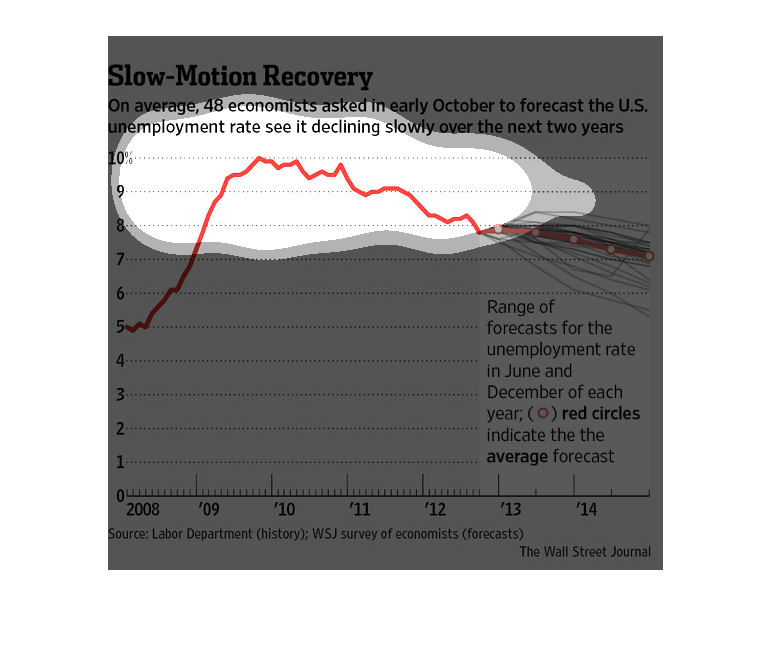
This graph shows slow-motion recovery and the projection of economists on the state of US
unemployment. Most of the economists surveyed project it to slowly decline over the next 2
years. There was a sharp increase in unemployment from 2008 to early 2010. Since then it has
steadily declined and most expect it to continue to do so.
slow motion recovery, A line graph based on the predictions of a few dozen economists, employment
rates have peaked and are and most likely will be on the steady decline
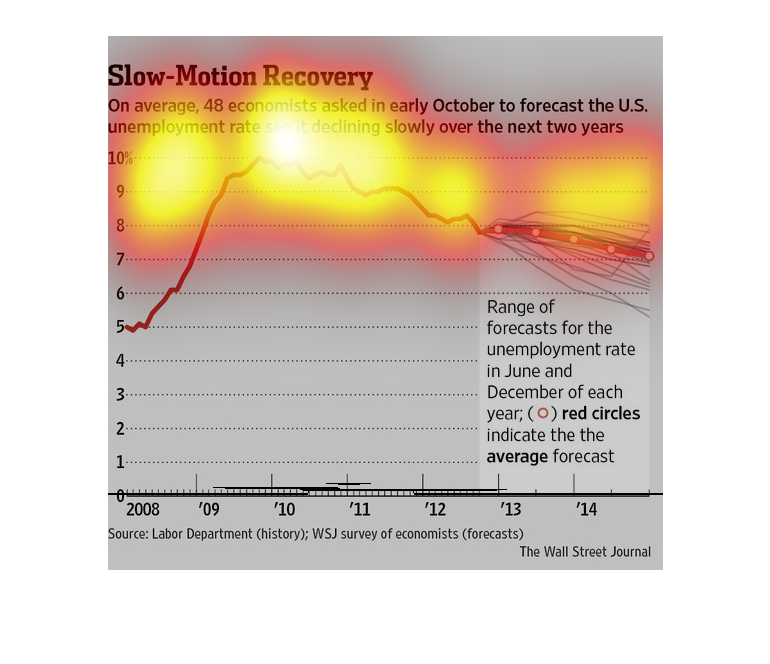
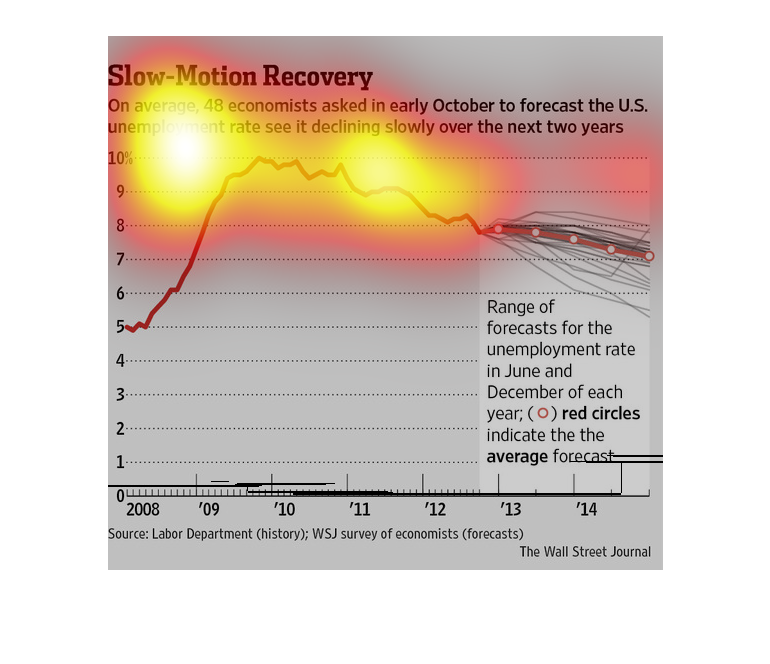
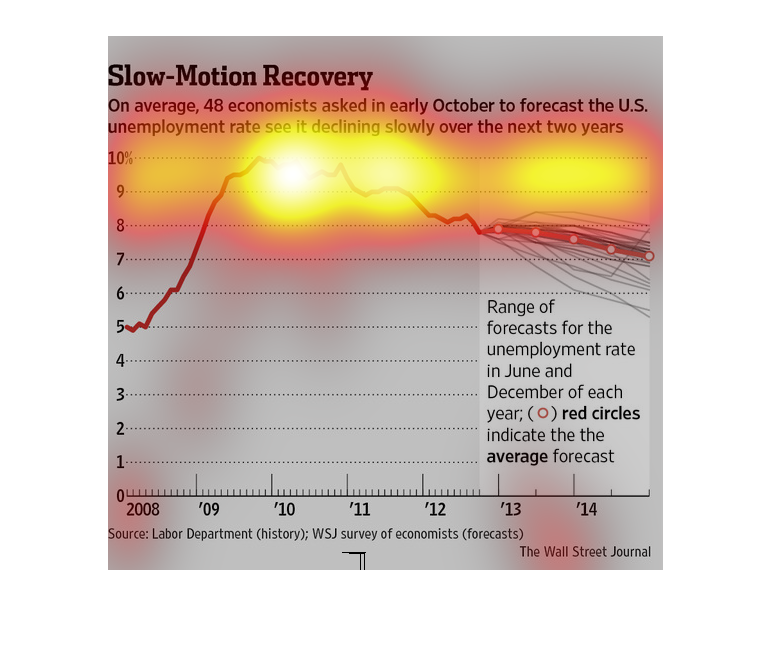
According to the "slow motion recovery" chart, 48 economists asked in early October to forecast
the U.S. unemployment rate see it declining slowly over the next two years.
This graph is to show the rapid decline in unemployment rates. It was at an alltime low, and
then had dramatically increased over time. By the end of the charting it was about average.
This chart describes slow motion recovery. Specifically on average, 48 economists asked in
early October to forecast the US unemployment rate, see it declining over the next two years.