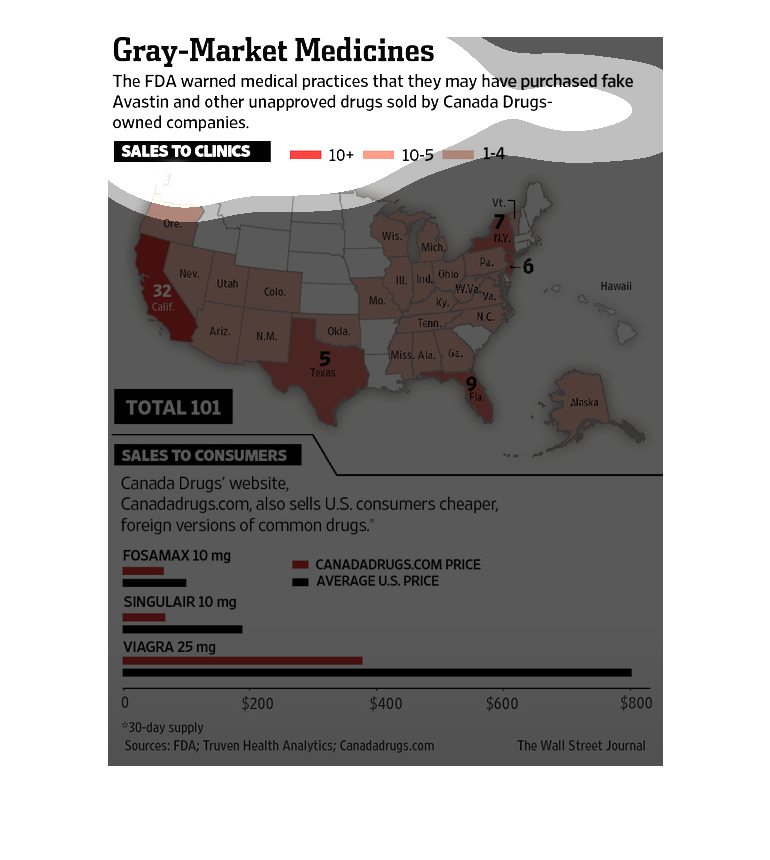
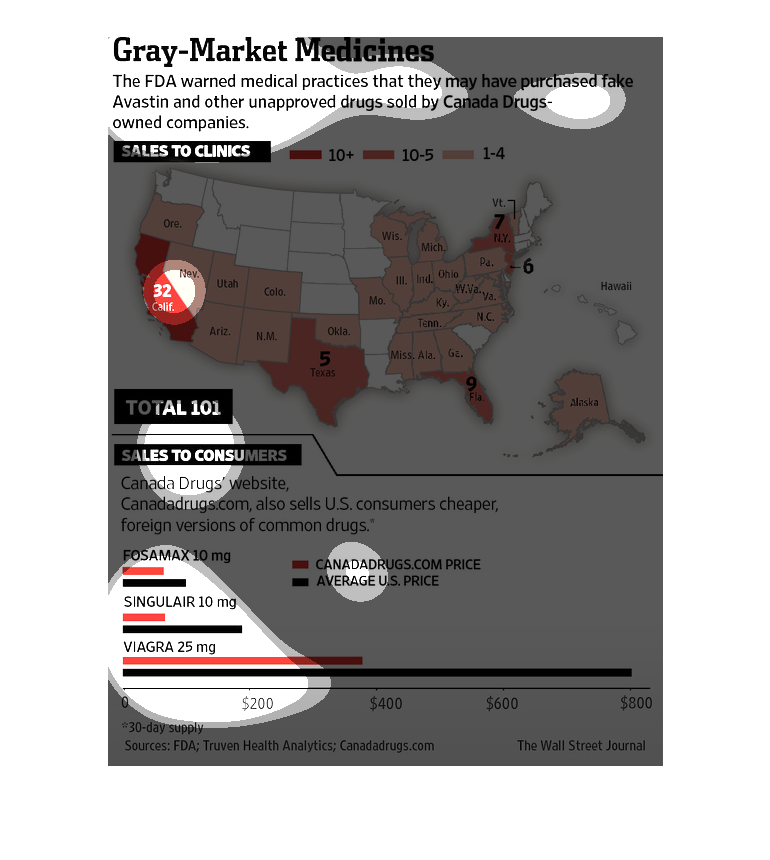
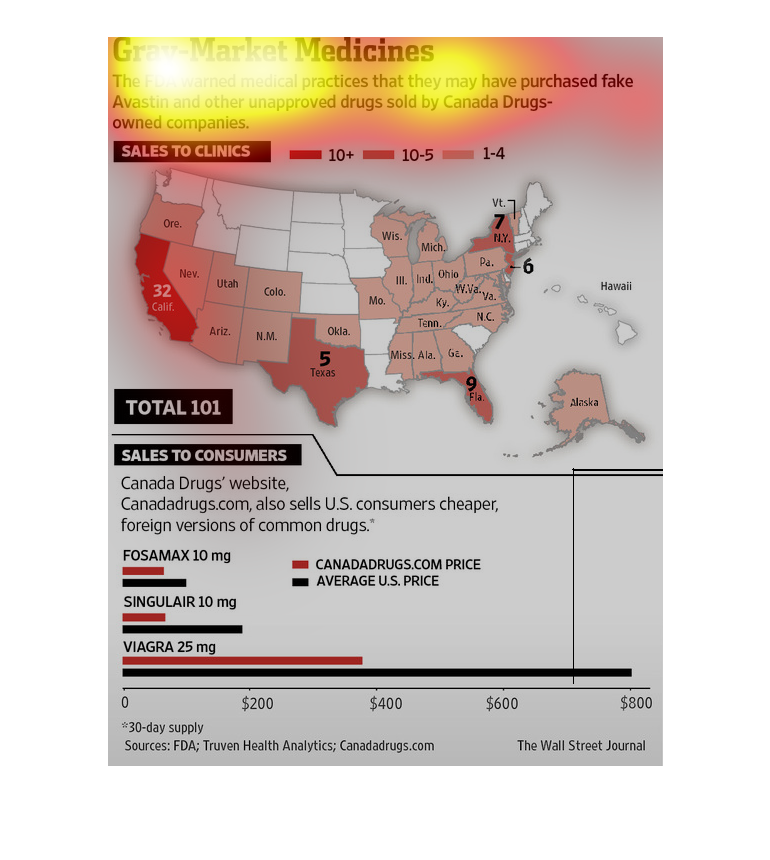
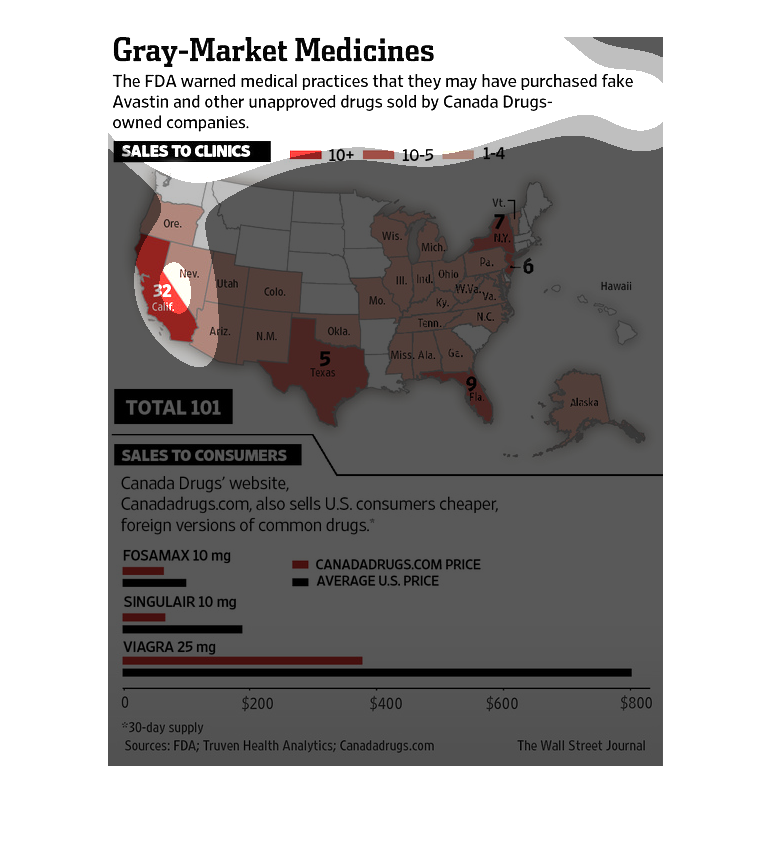
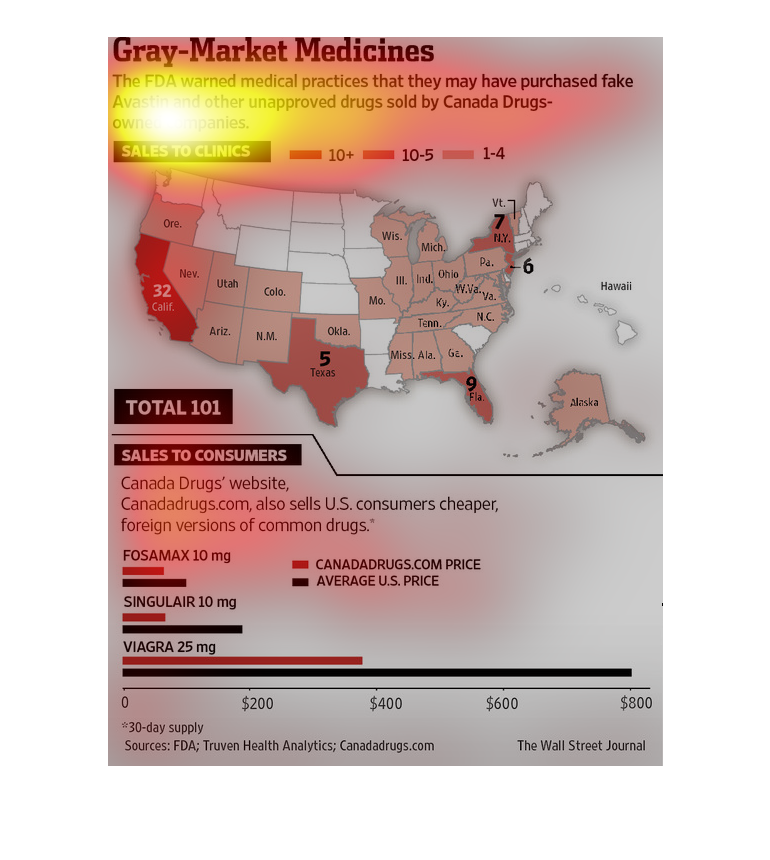
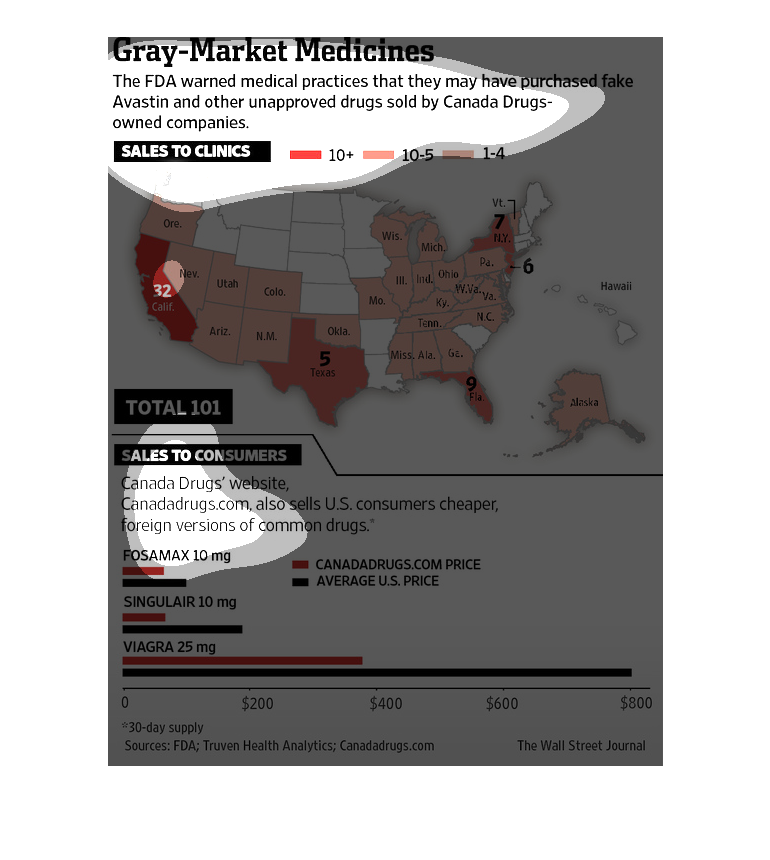
This chart describes gray market medicines. Specifically, the FDA warned medical practices
that they may have purchased fake Avastin and other unapproved drugs.
The graph is titled "Gray Market Medicines" and discusses the FDA's warning against companies
purchasing fake, or unapproved drugs by Canadian suppliers.
This chart describes gray market medicines. Specifically, the FDA warned medical practices
that they may have purchased fake Avastin and other unapproved drugs.
This chart is about the FDA warning drug companies that they may have purchased fake drugs
from Canada based companies. That is why Canada can get away with selling them cheaper to
US citizens as depicted in the graph.
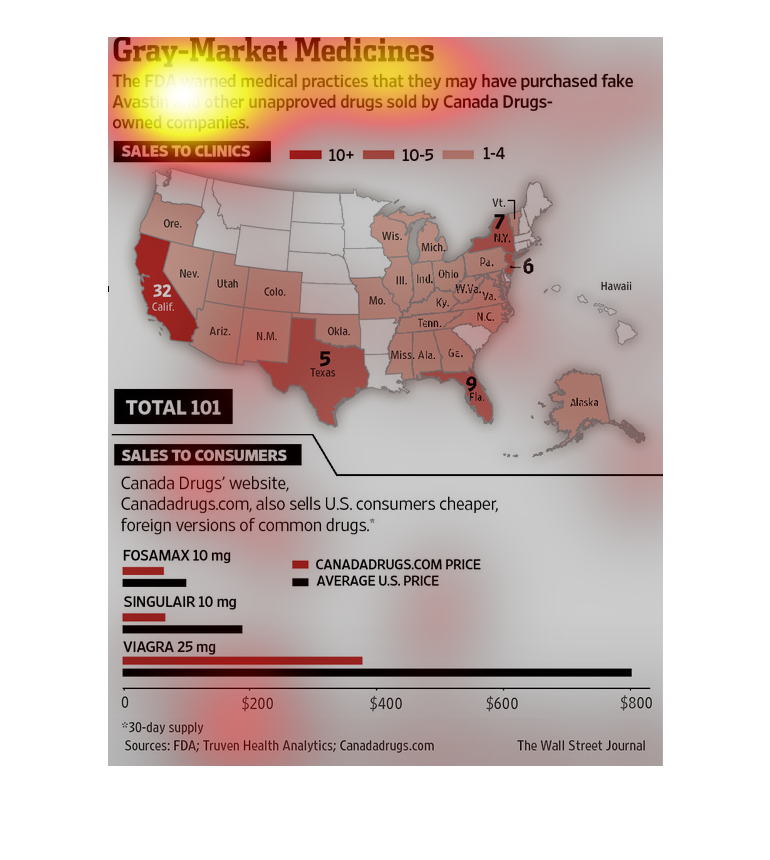
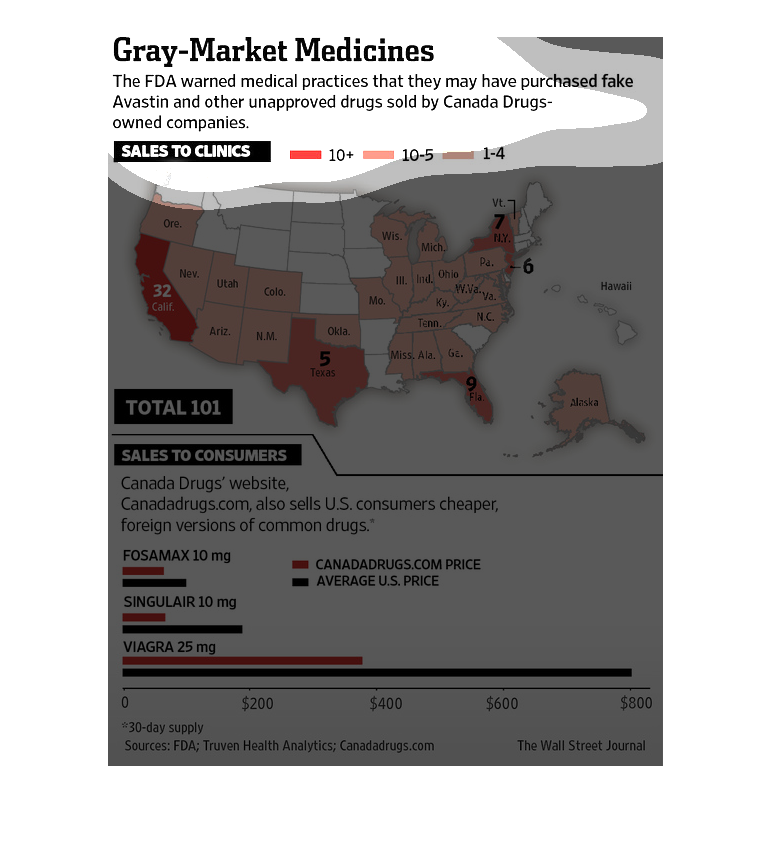
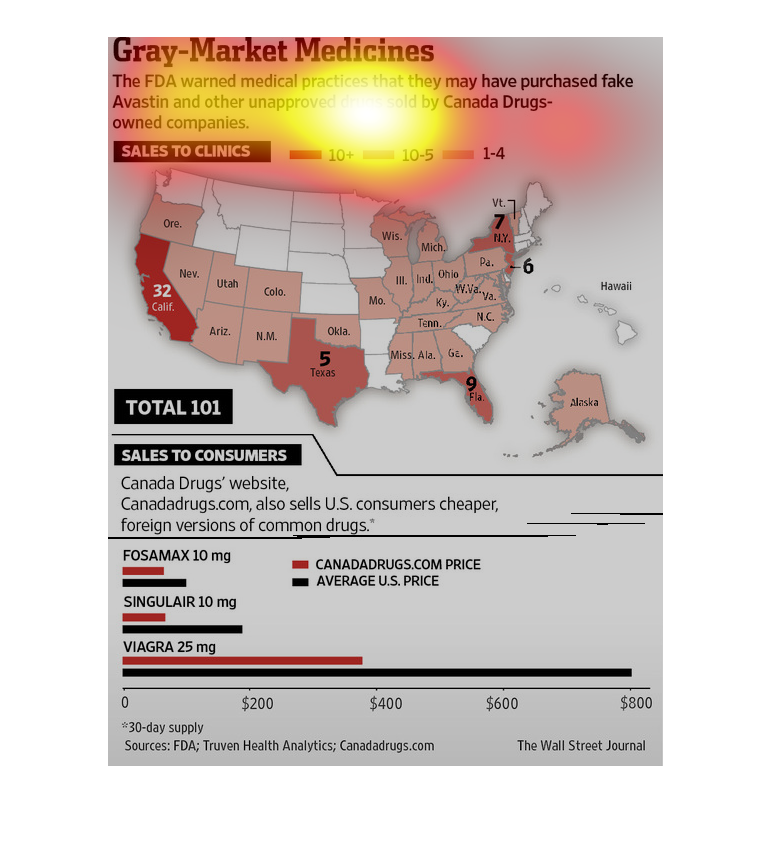
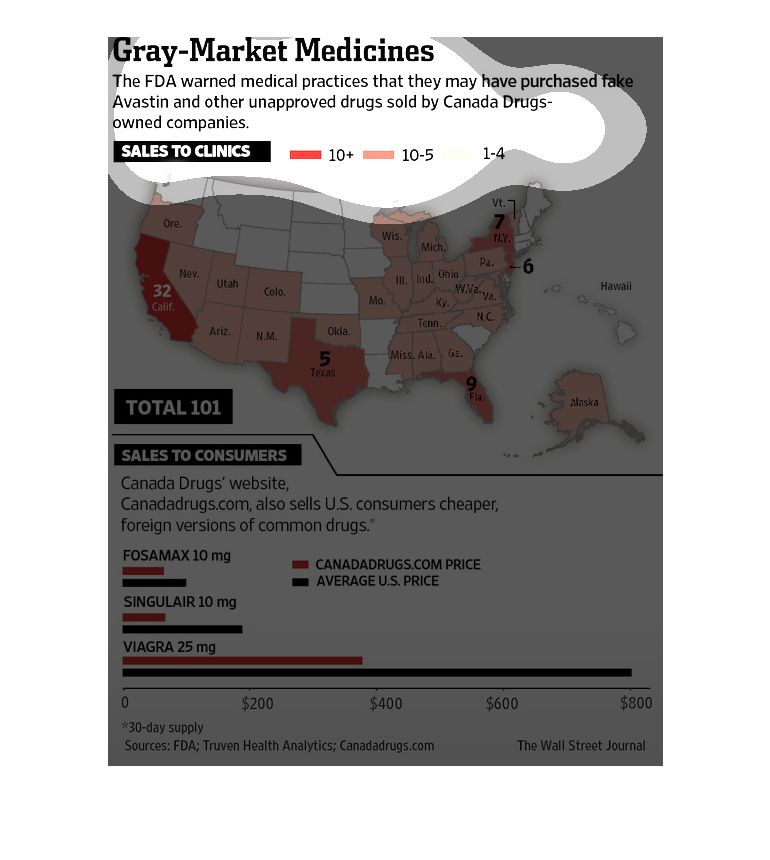
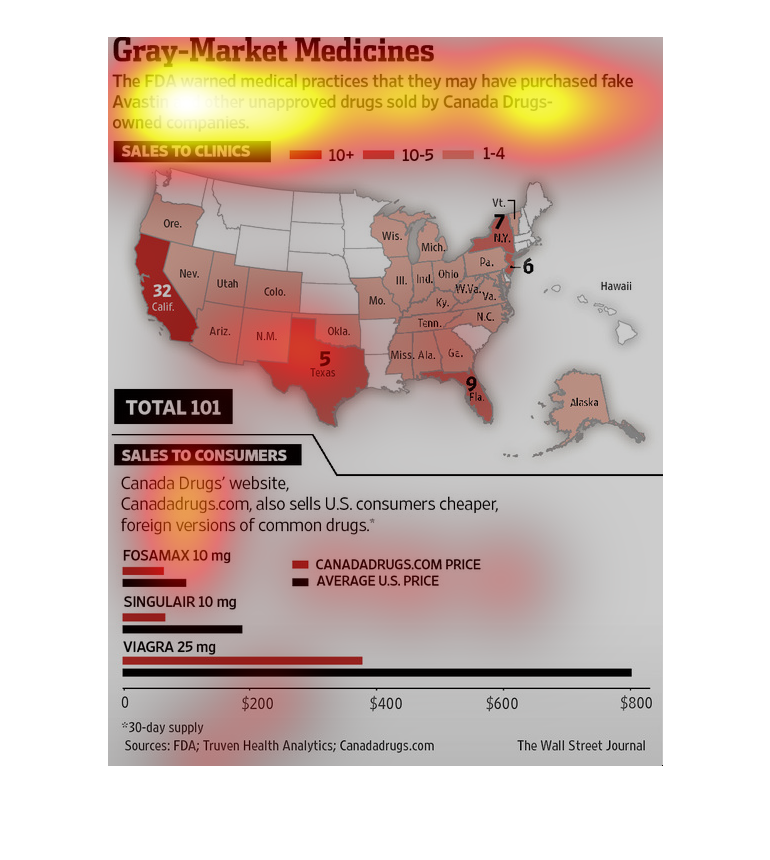
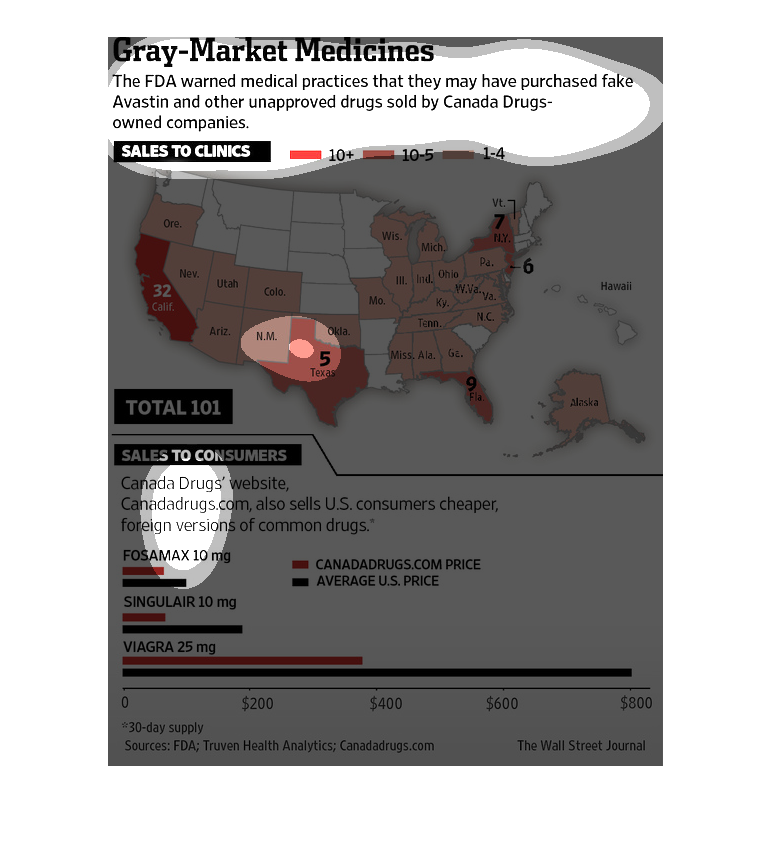
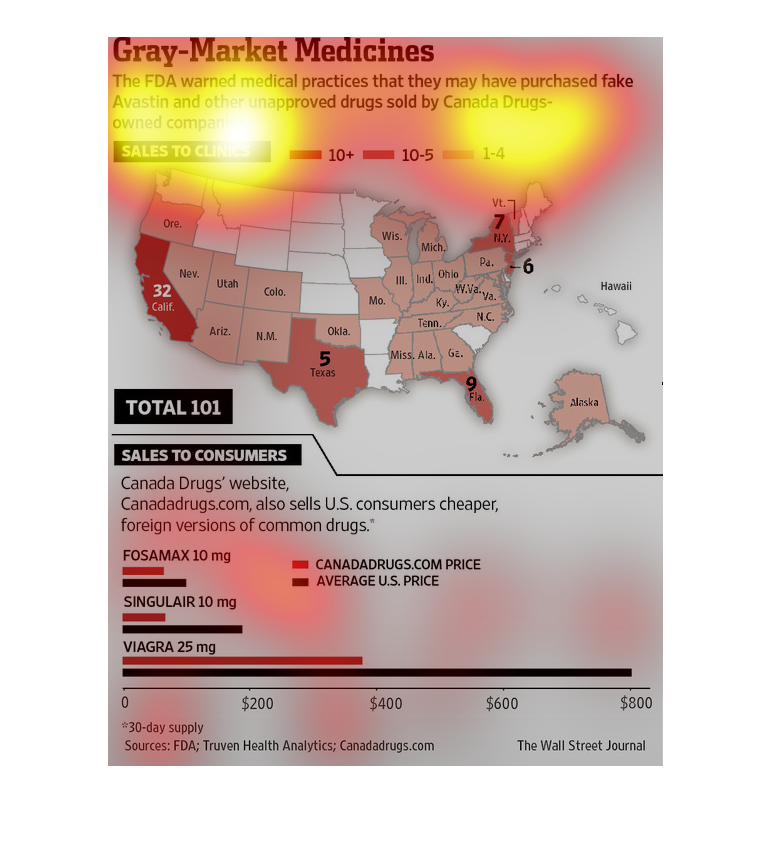
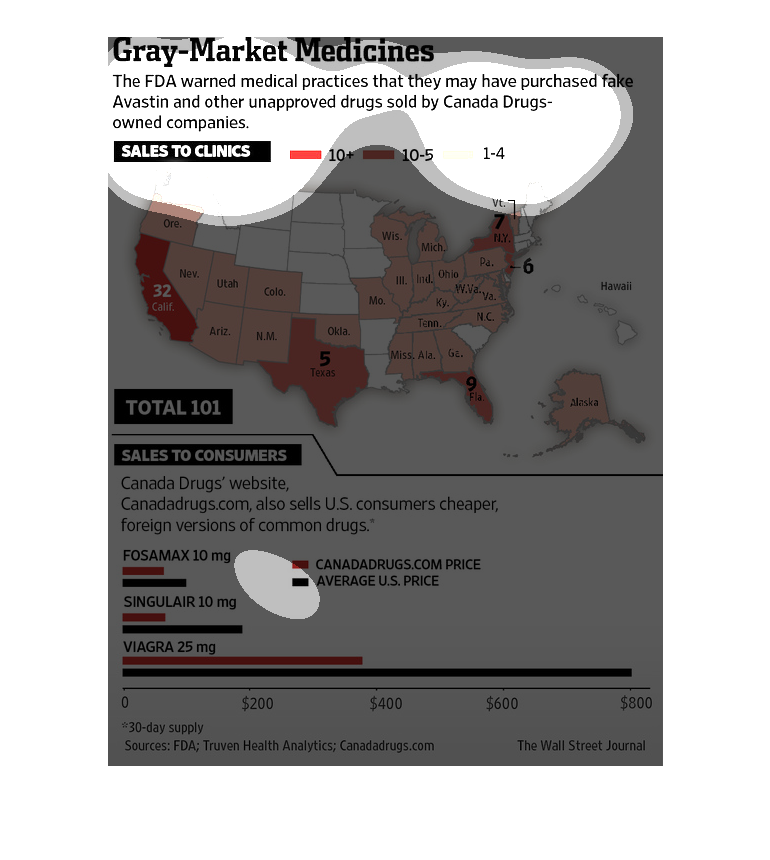
The image depicts how medical practices may have purchased fake Avastin and other unapproved
drugs sold by Canada Drugs-owned companies, citing effected states in the US.
A map of the United States called "Gray-Market Medicines" and the redder a state is on the
map, the more they have medicinal practices that are not approved of by the FDA.
The US may have purchased illegal drugs being sold by Canada.  It shows US domestic versus
foreign drug sales and sales to consumers as well as clinics.
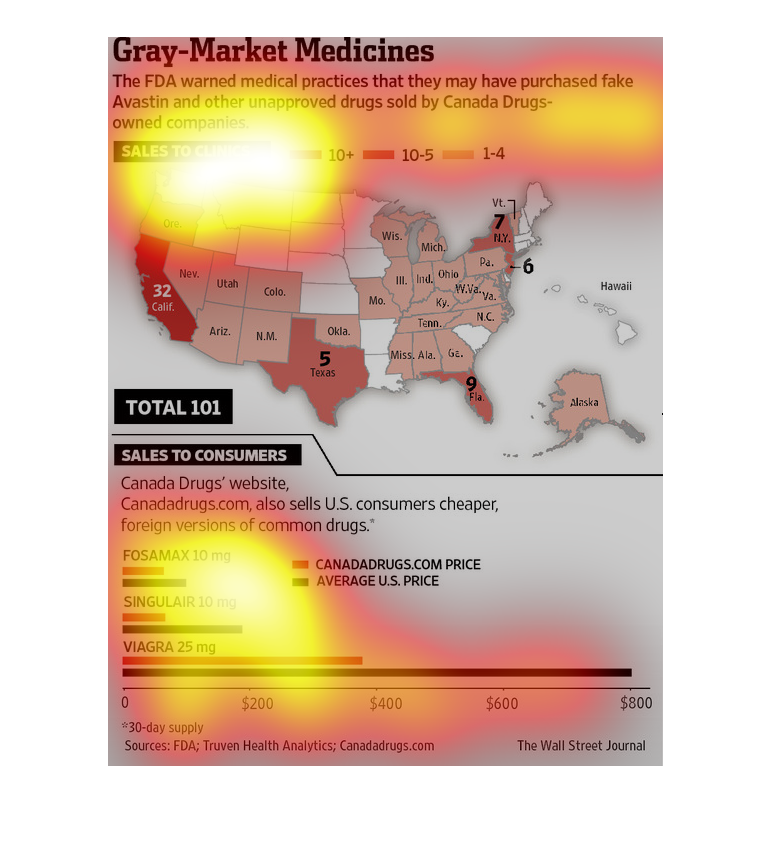
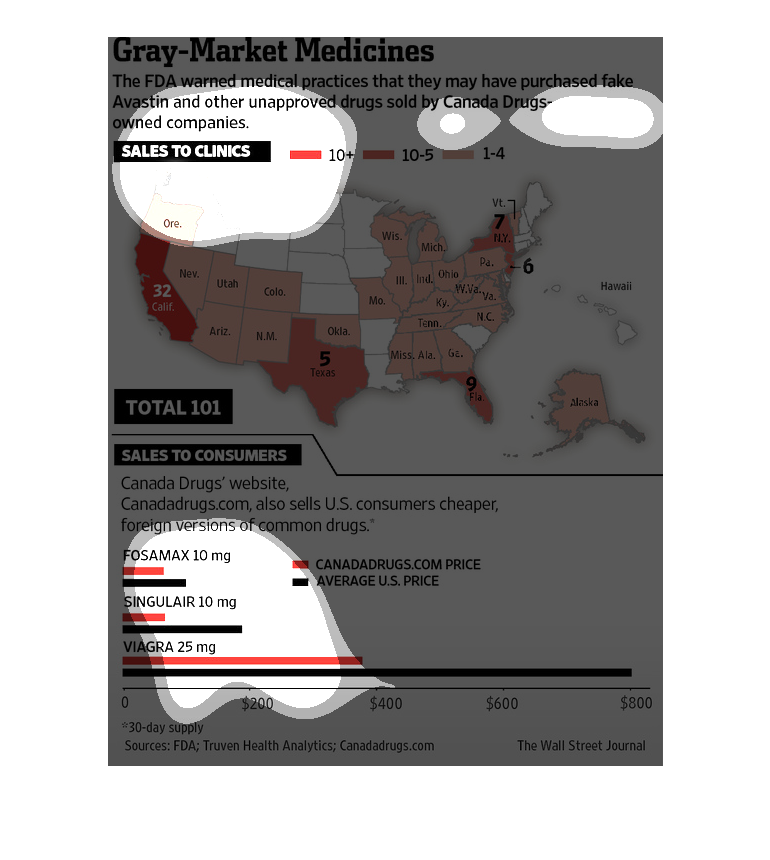
This is a map of the US showing which states have the most clinics that have purchased the
most foreign drugs from Canada. Leaders are California, Texas, New York, and Florida.
The image depicts the FDA warning medical practices about the purchasing of fake Avastin and
other unapproved medications from Canada Drugs-owned companies. A majority of states appear
to be affected by the purchasing of these fake drugs. With California and Texas leading the
pack.

The graph shows a breakdown by state of how many sales per clinic of fake or FDA unapproved
drugs.  It also shows the cost difference that consumers pay for some common drugs between
canadadrugs.com and average US prices.  Average US drug prices proving to be higher in all
cases.
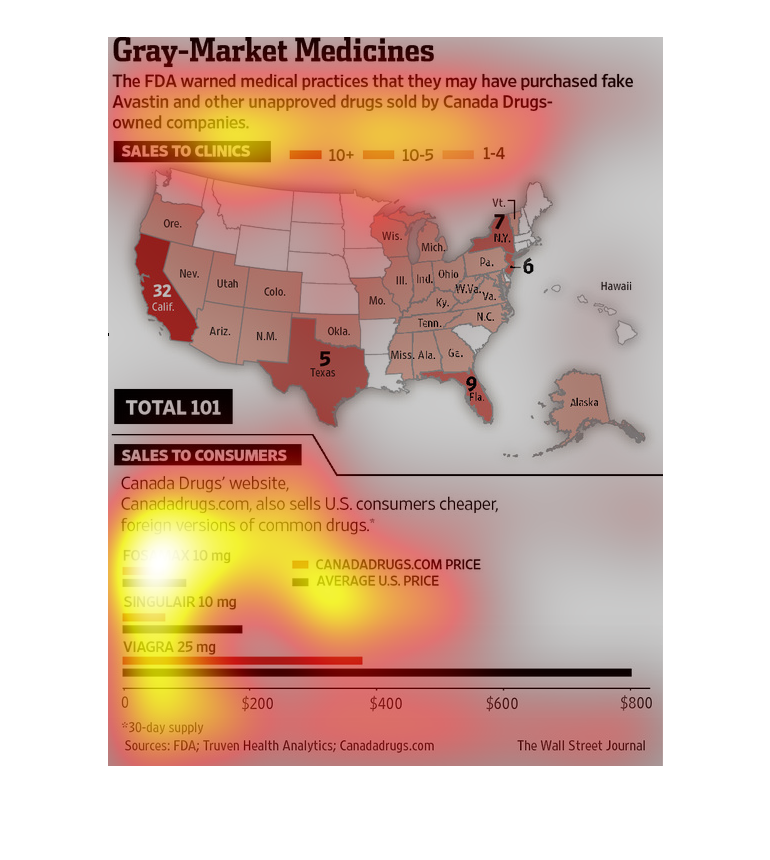
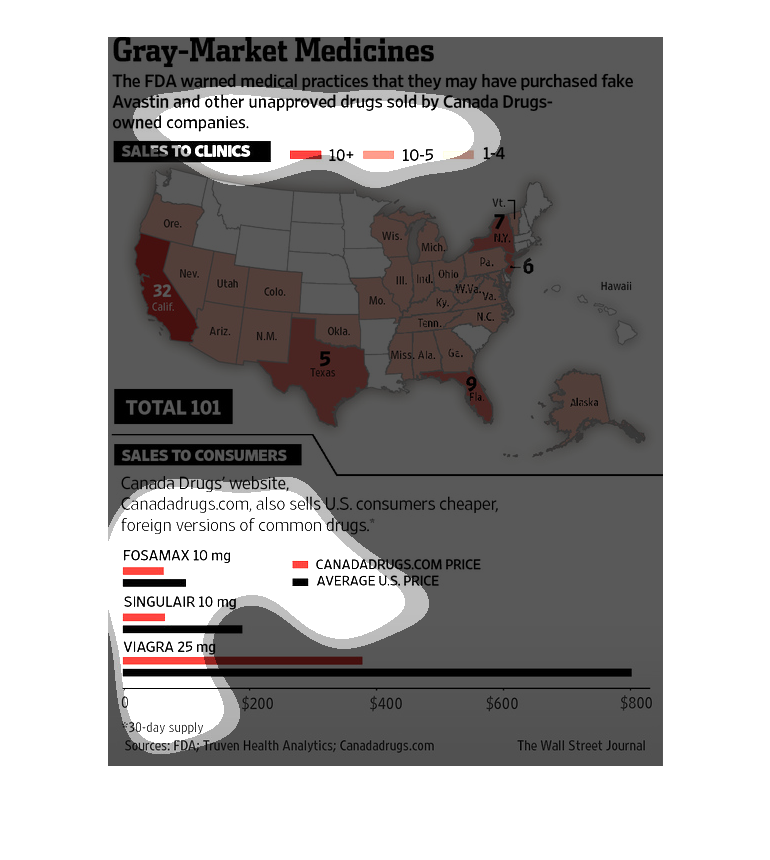
This chart follows gray market medicines that companies have bought that include unapproved
versions of Avastin and other drugs that were sent by Canada owned countries. The first half
of the chart shows state by state the sales to clinics in the United States with California
having the most with 32 and a total of 101 across the US. The second half of the chart refers
to sales to the cheaper prices of drugs sold by the Canadian companies compared to the average
US prices. These are measured in 30 days supplies and Viagra is the highest sold for both
American companies and their unapproved Canadian counterparts.
This is about the FDA warning medical practices that they may have purchased fake Avastin
and other unapproved drugs sold by Canada drugs. The title is Gray Market Medicines.
This is a color coded map of the United States and accompanying graphs depicting the areas
that the FDA warned may have purchased unapproved and/or fake prescription drugs from a Canadian
company.
This is a chart about "Gray Marked Medicines" It is showing that some companies may have accidentally
bought drugs from fake drug companies which is not good.
This image or figure shows or depicts in US Geographic statistical format areas of the country
that have various levels of Gray-Market medicines. FDA warnings made to certain manufacturers.