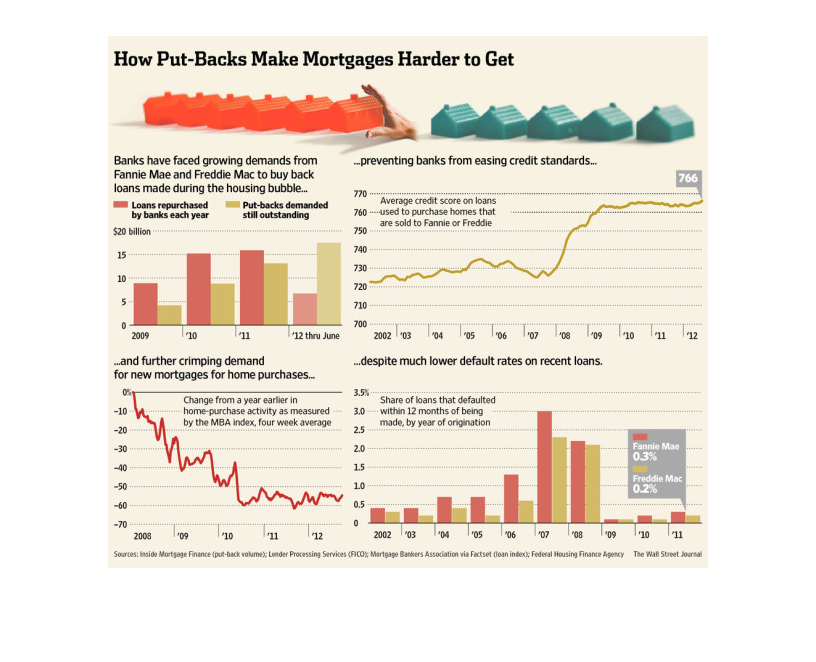
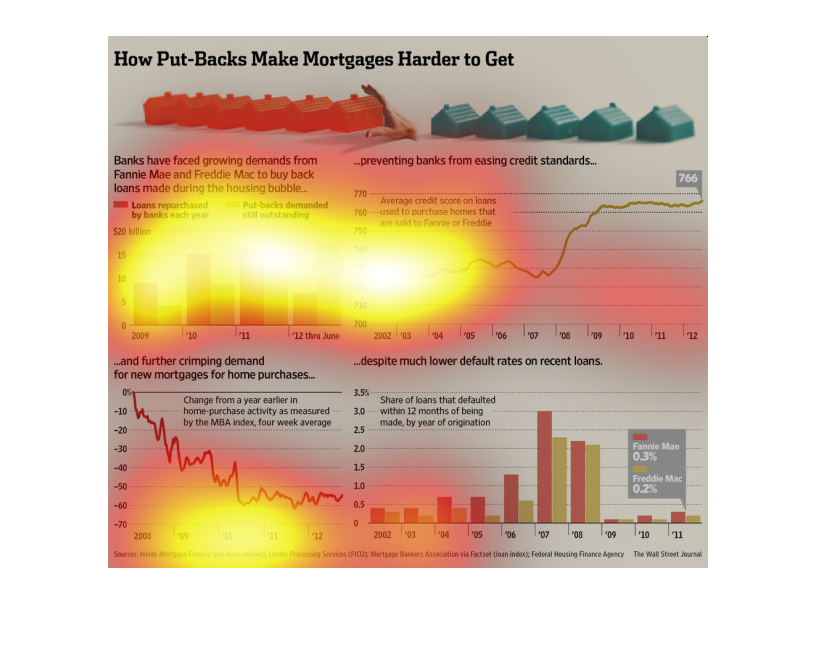
This is a collection of charts that are related to how the topic of mortgages and push-backs.
One chart is about default rate, another purchase activity, another status of defaulted loans
and the last is growth of banks.
This is a series of color coded graphs and charts along with related statistics depicting
how put-backs were making mortgages harder to get as banks were under increasing pressure
from the Feds to buy back inventory.
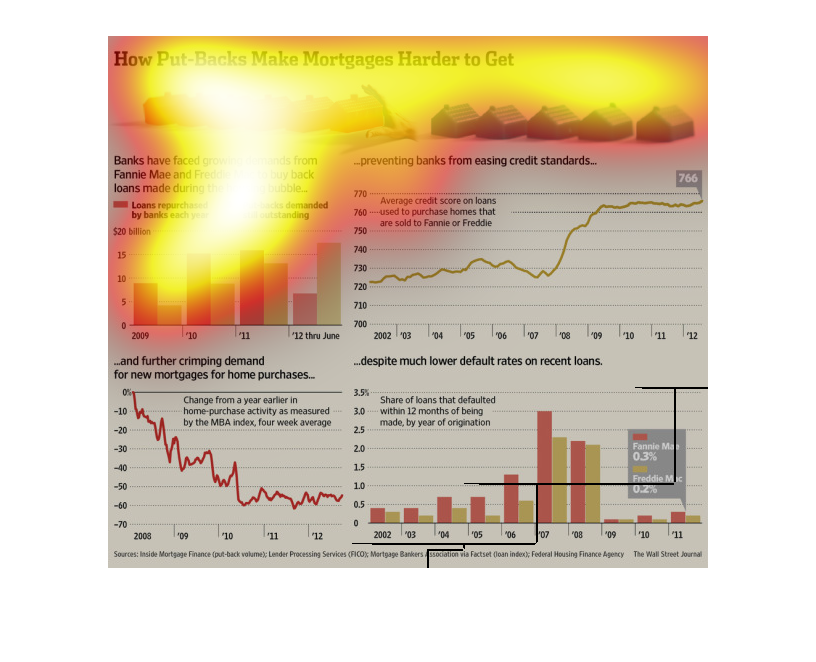
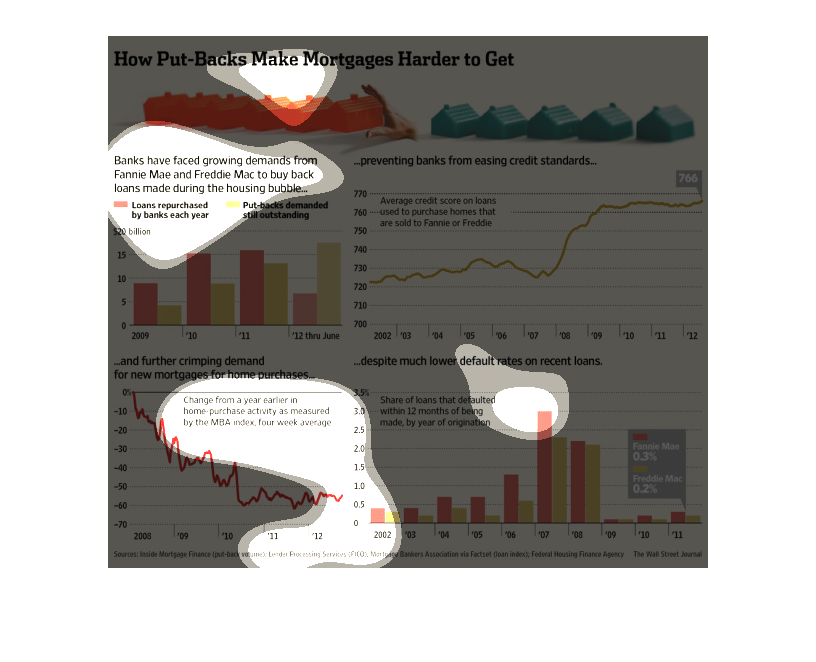
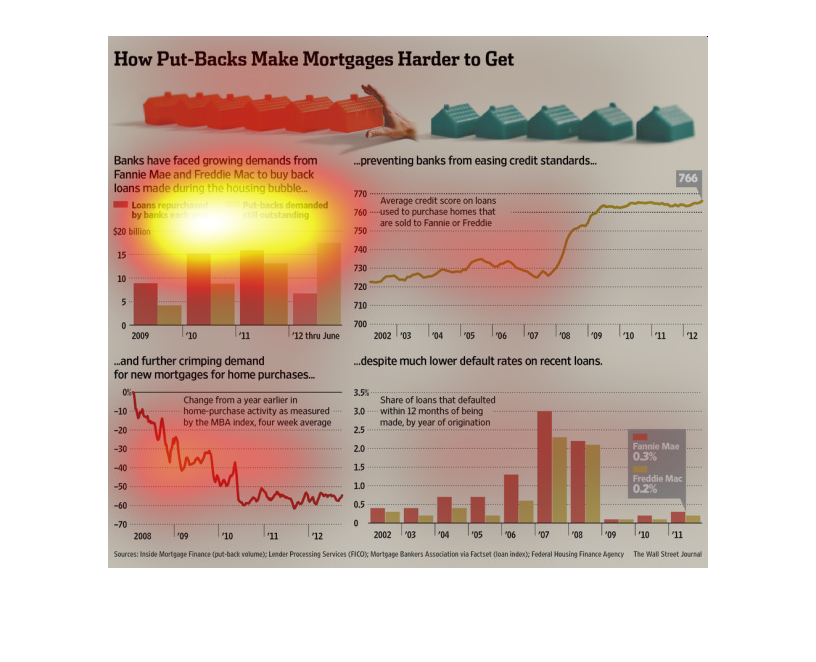
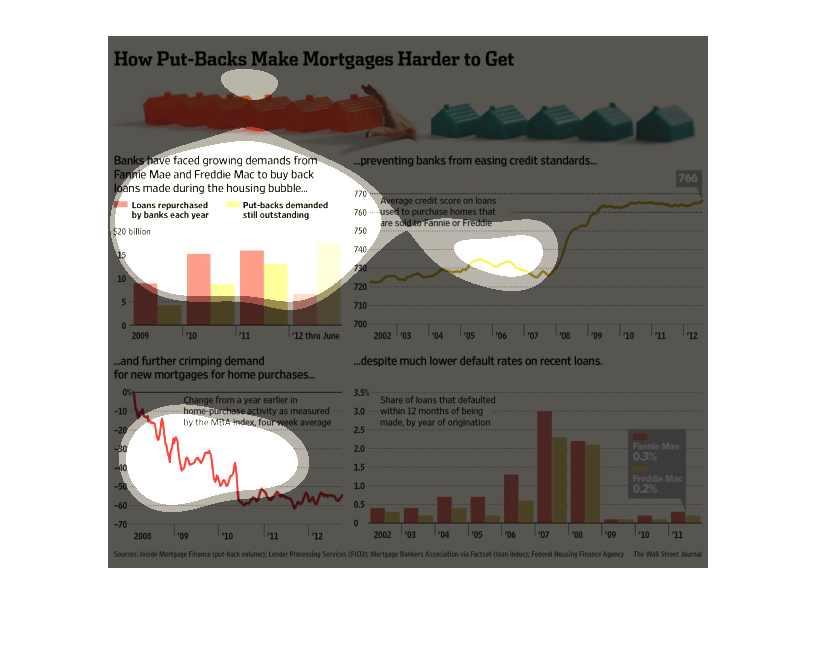
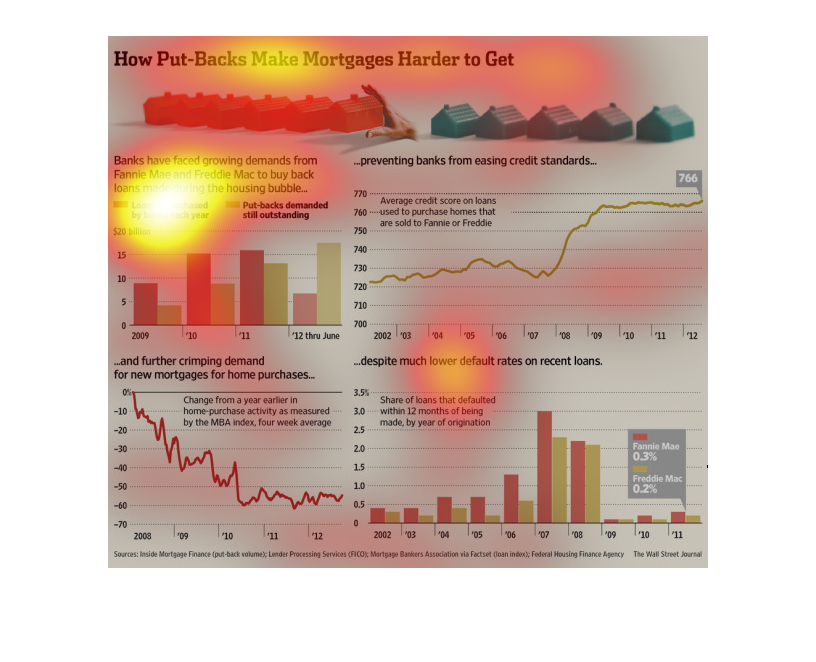
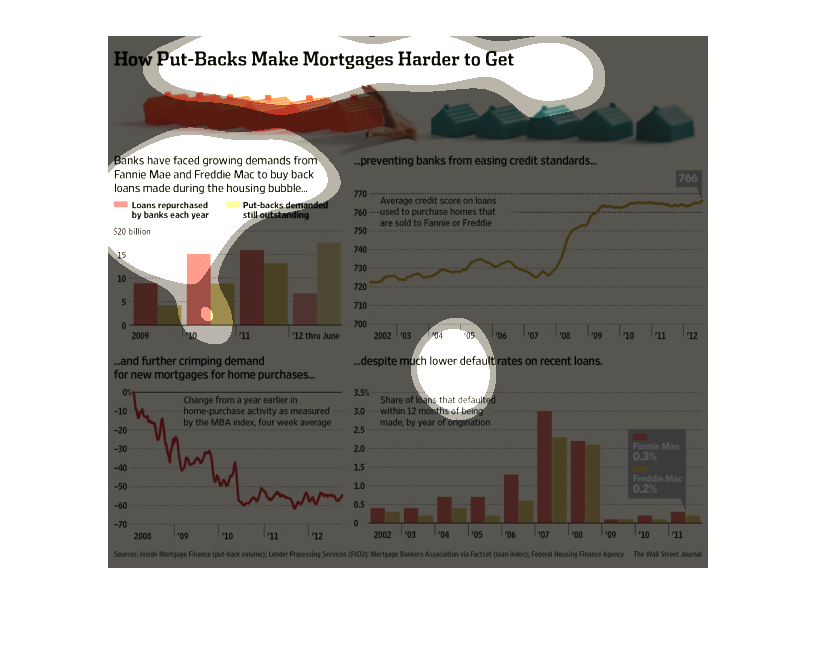
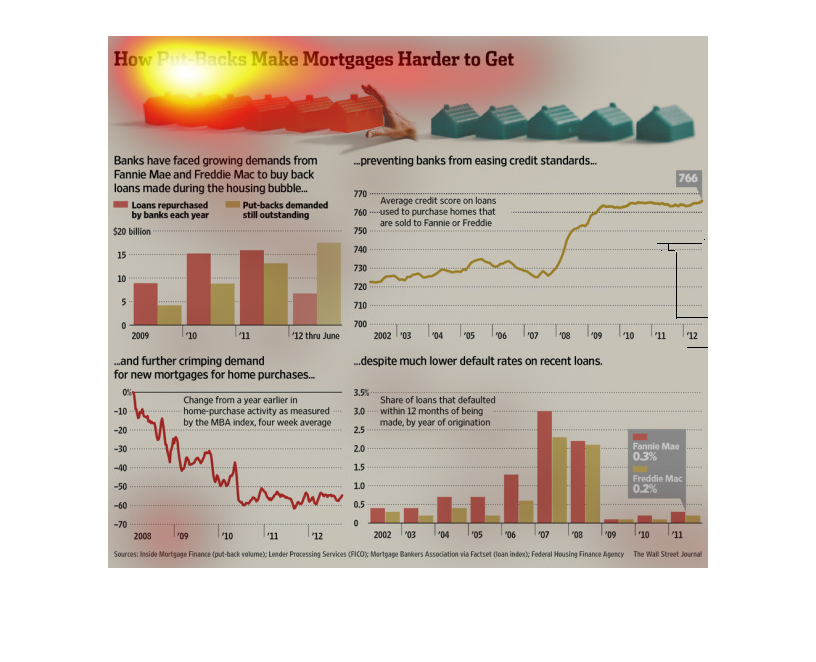
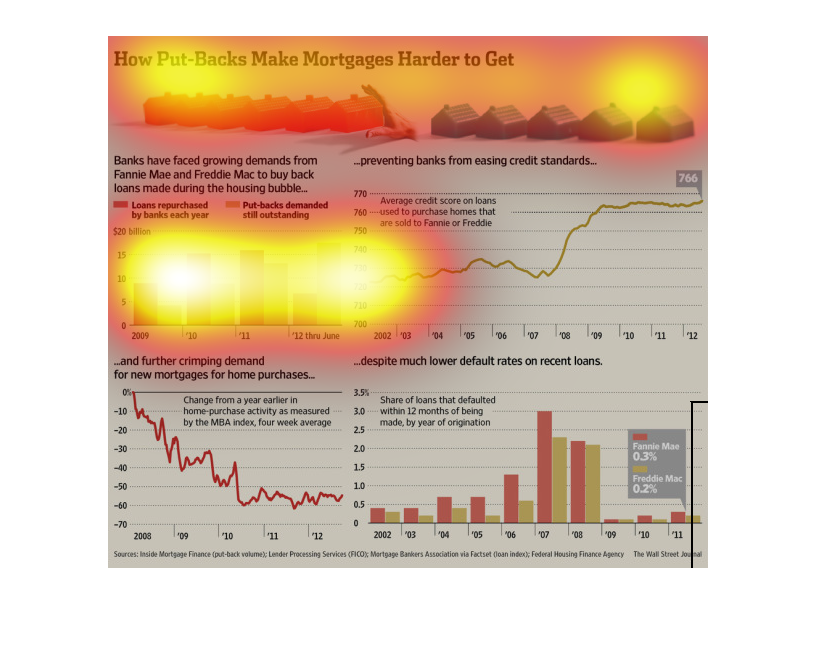
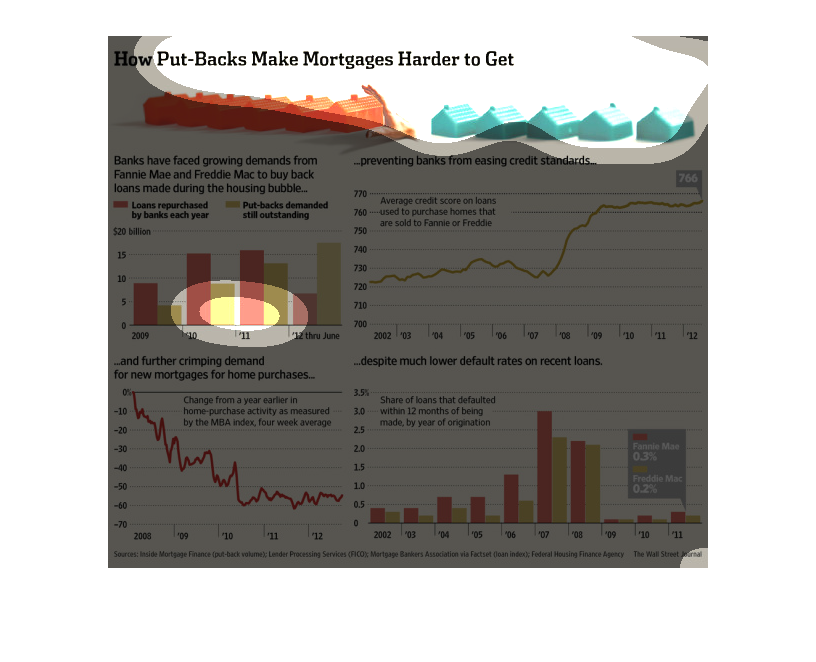
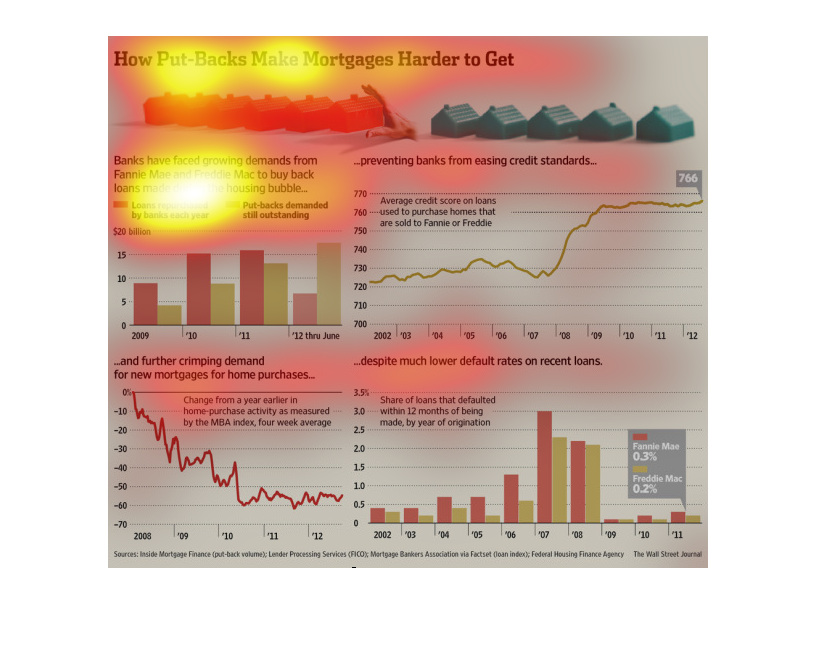
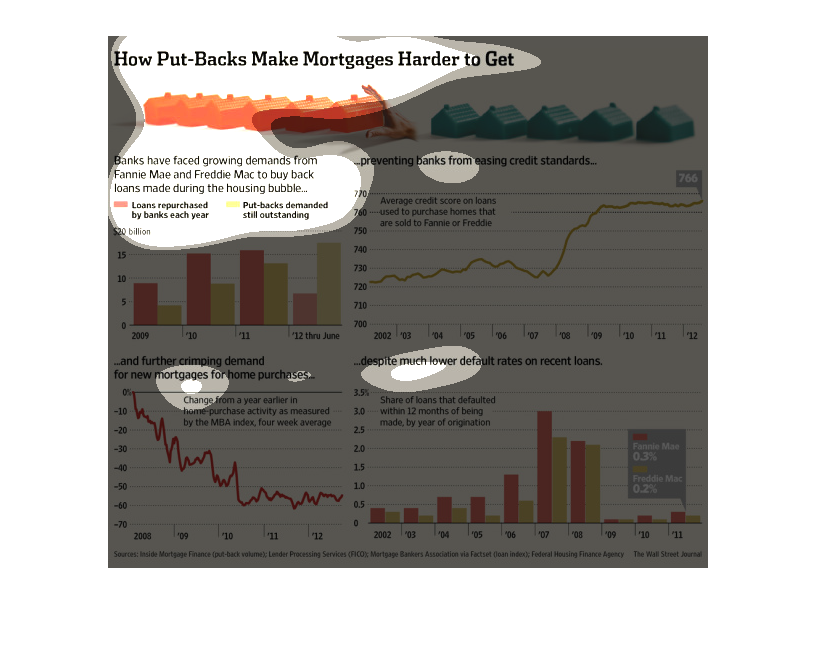
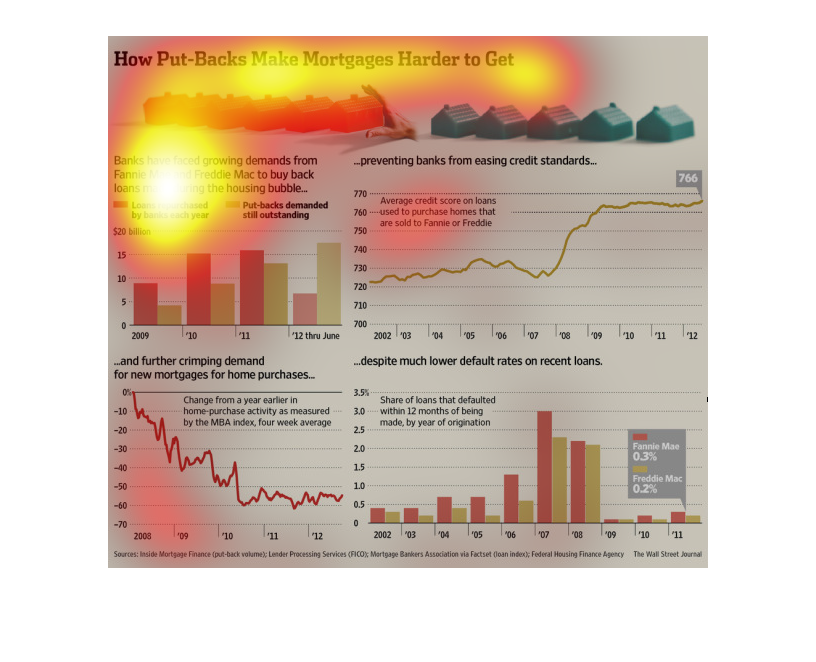
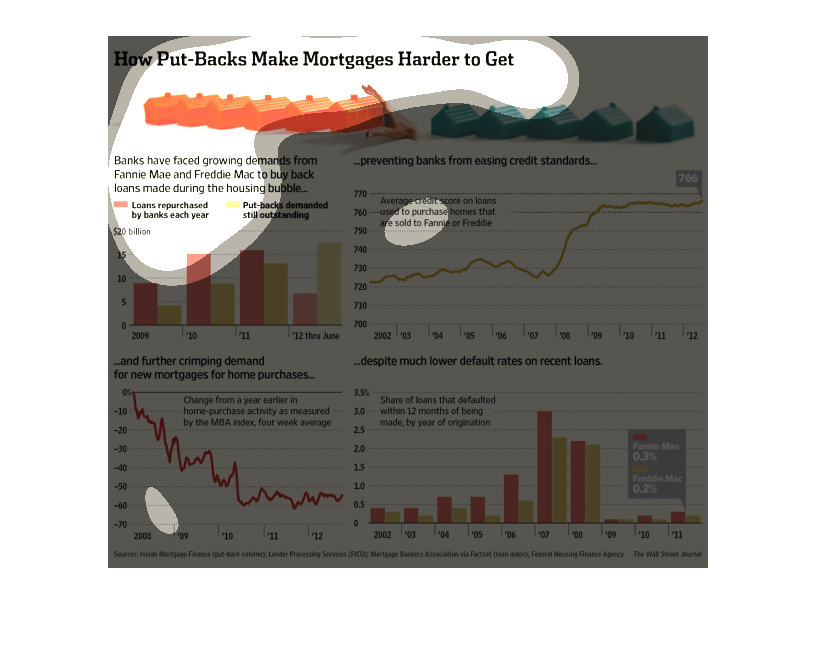
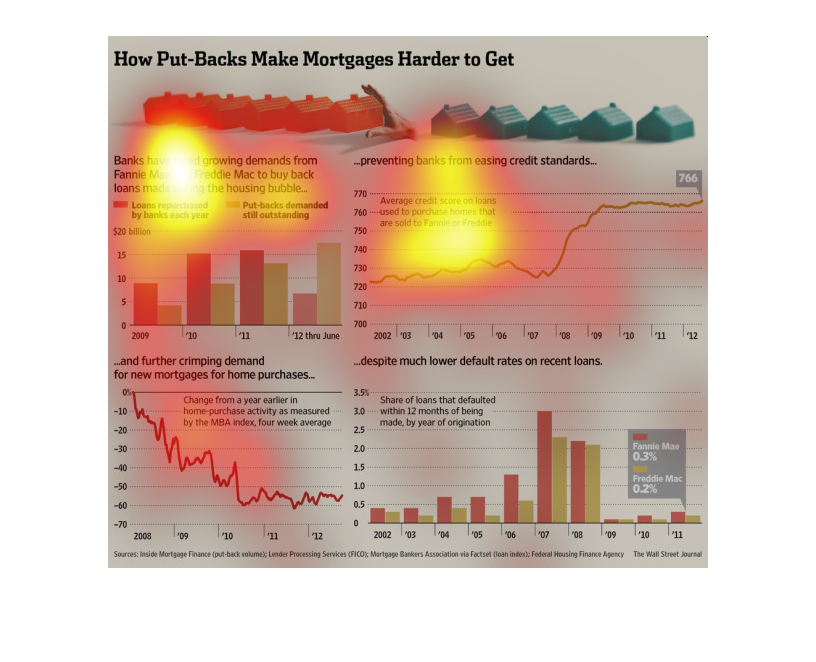
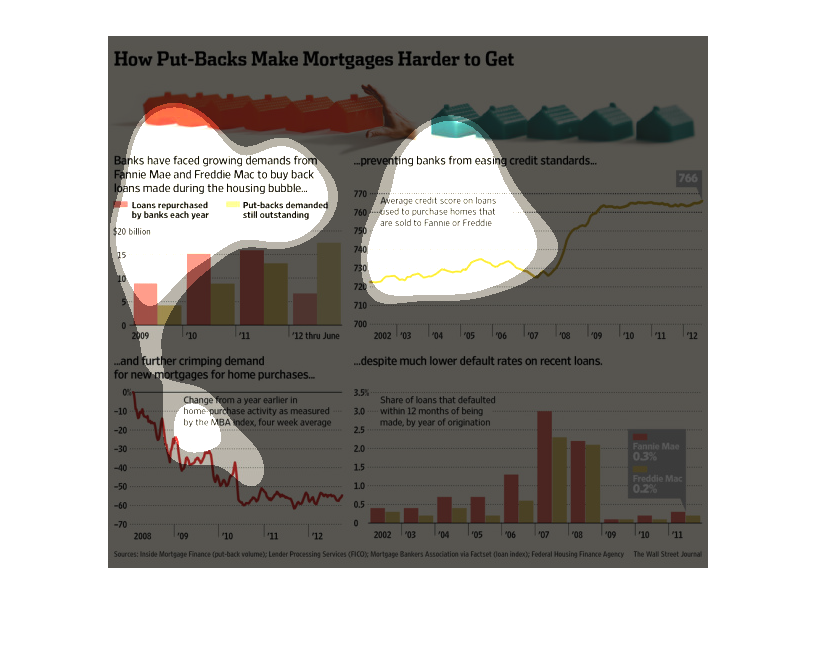
This chart is about how put backs make it harder to get mortgages. Banks have been pressured
to buy back the loans that were loaned out during the housing bubble.

This chart shows how put backs make mortgages harder to get. Fannie Mae And Freddie Mac lost
money on loans during the housing bubble. They now want banks to buy back the defaulted loans.
The more of these bad loans banks buy back the harder it is for credit worthy customers to
get a loan today.
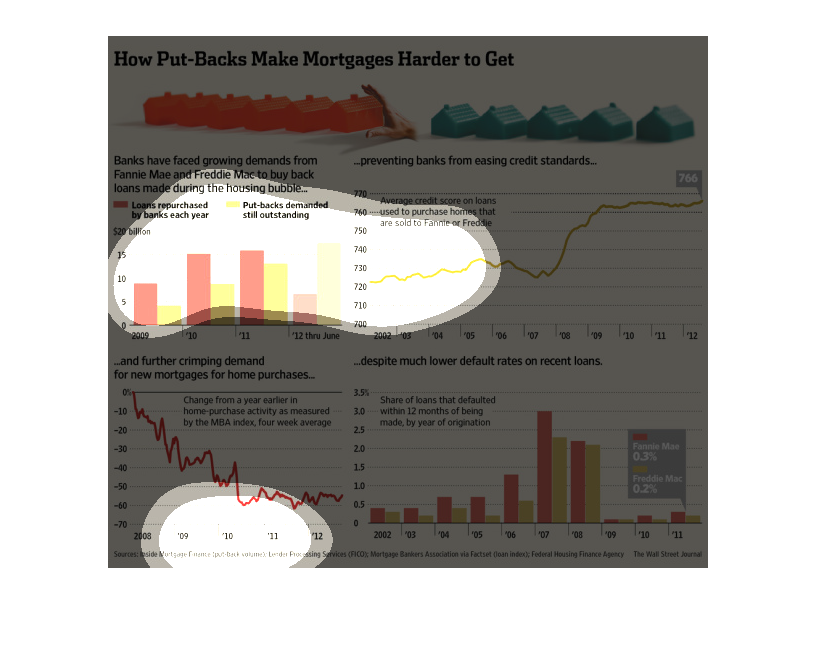
The image features a variety of graphs detailing how put-backs make mortgages harder to get.
 Two bar graphs and two line graphs work to prove the point.
The Wall Street Journal conducted this study in which it shows that- because of the economic
recession from a few years ago- push-backs are becoming very difficult to ensure.
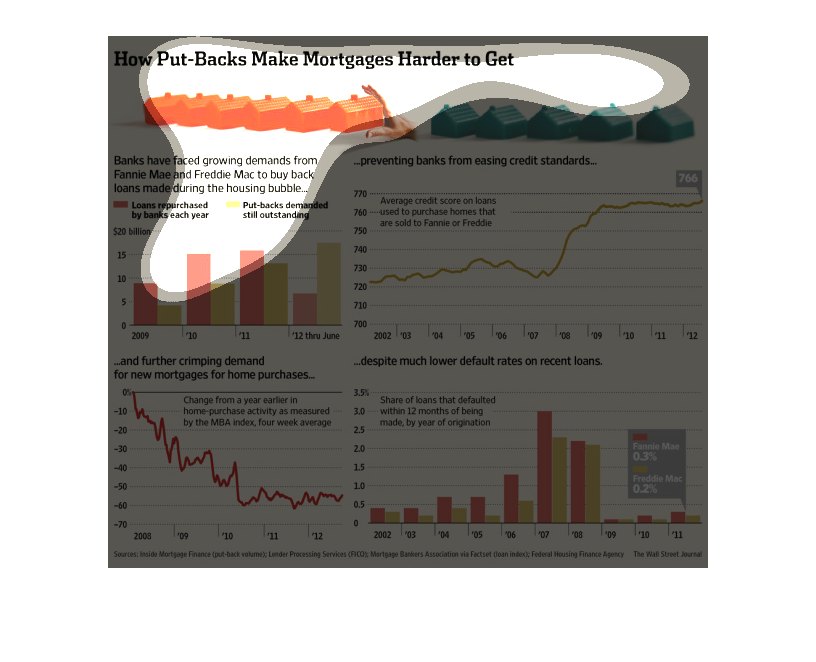
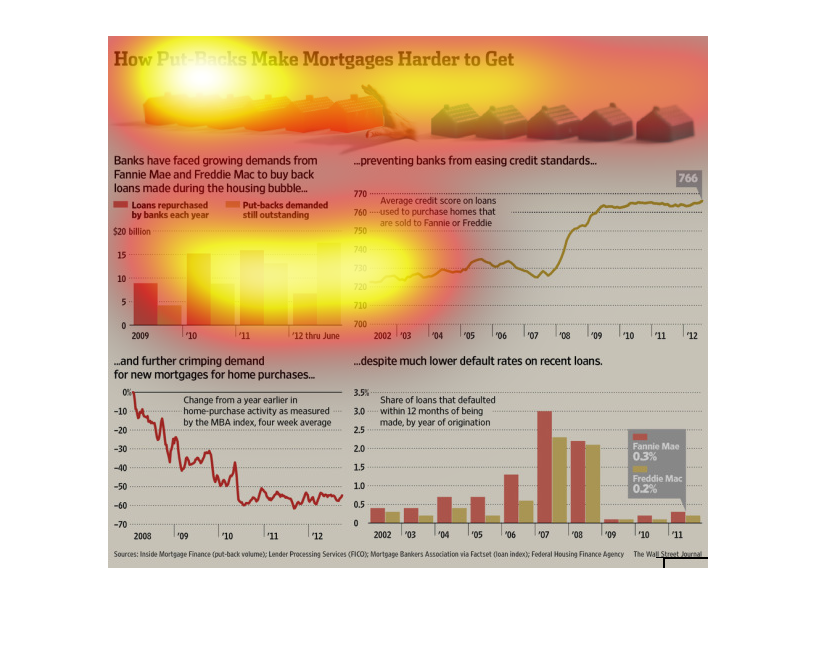
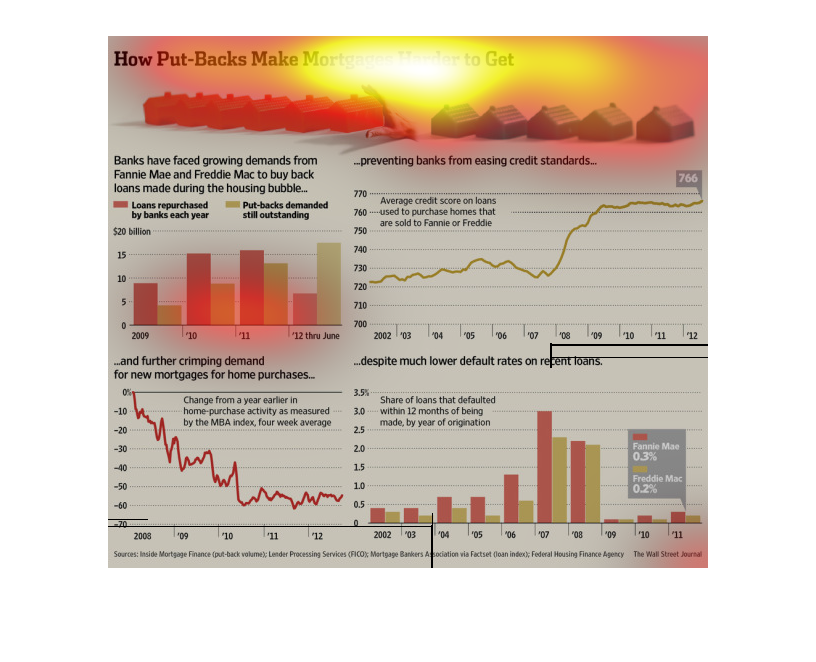
The following chart shows how put backs made it much harder for people to get a home loan.
Showed how banks have faced a growing demand to Fannie Mae and Freddie Mac to buy back loans
made during the housing bubble.
This is a series of charts, graphs and statistics depicting how put-backs make mortgages harder
to get. This comes with increasing pressure on the banks to purchase back loans.

 It is about Fannie Mae loans that can be bought back and things are receiving pressure  it
is measuring credit scores by here it also has the impact on loans in home purchase
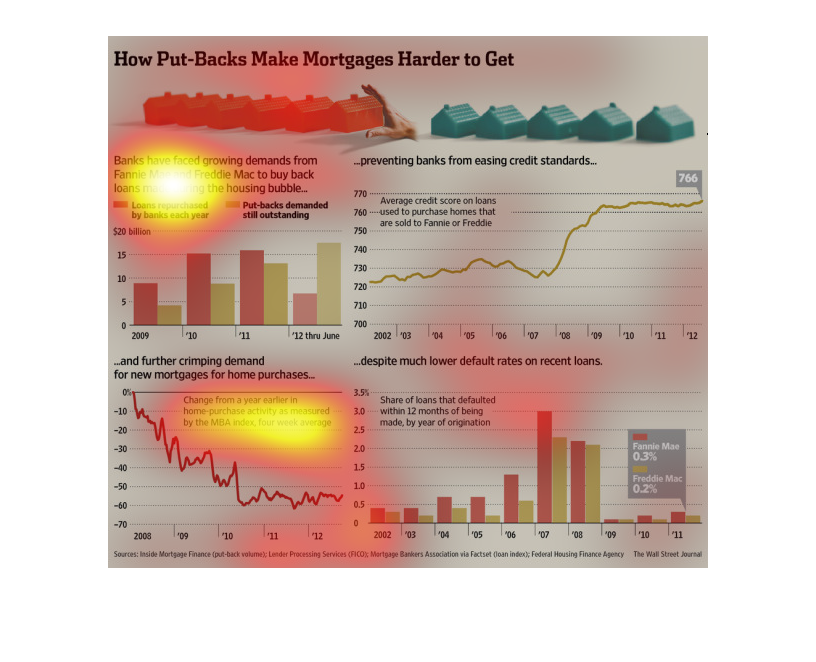
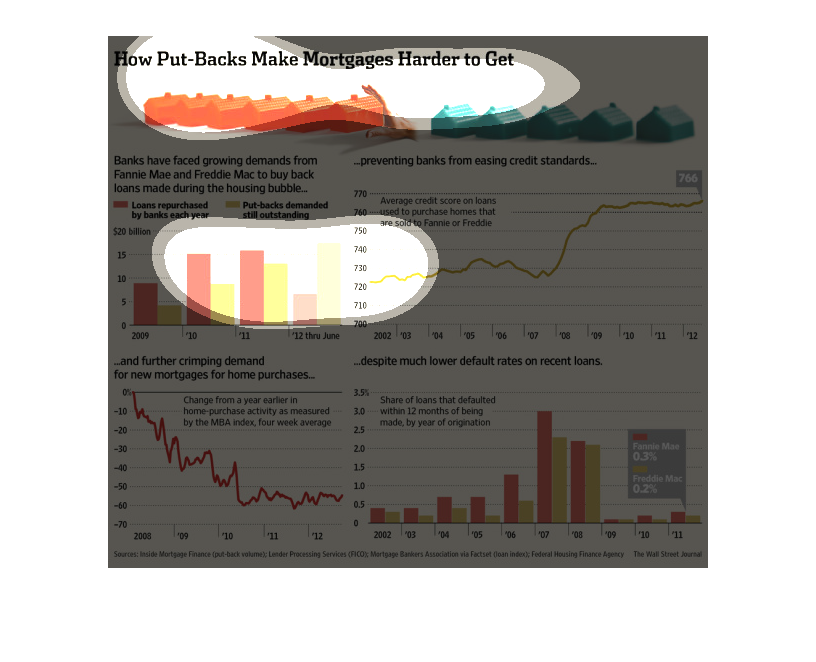
This chart describes how put backs make mortgages harder to get. Different categories on the
chart are represented by different colors, such as orange and blue.
The image is about how put-back morgages are hard to get and explains the financials crisis
that the bank had to faced due to the mortgages. 1st paragraph is about loans repurchased
from the banks and  the oustanding loans.
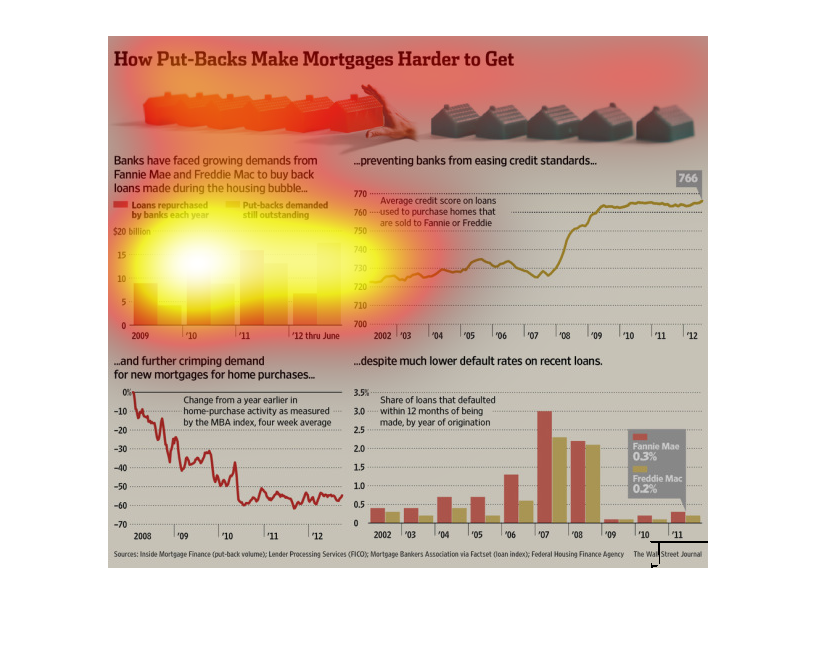
This chart shows information about put-backs. It describes how they make mortgages more difficult
to acquire. There are four charts at least showing information about this stuff.
This pages shows a variety of charts that show how fanny May and Freddy Mac bought bad default
loans from morgades . It also breaks down how the credit ratings of buyers increased due to
the default
This chart describes how put backs make mortgages harder to get.Different categories on the
chart are represented by different colors on the bar graphs.