This chart describes three battlegrounds. Specifically, new polls show Barack Obama building
a lead over Mitt Romney in New Hampshire, with the race nearly even in Nevada.
This chart describes three battlegrounds. Specifically, new polls show Barack Obama building
a lead over Mitt Romney in New Hampshire, with the race nearly even in Nevada and North Carolina.
This graph shows Barack Obama is building a lead in the polls over Mitt Romney in New Hampshire.
But the race is nearly even in North Carolina and Nevada. Still, Obama has a 49% to 47% edge
over Romney in Nevada.
the name of this graph is called three battlegrounds.and the graph is about where the different
battlegrounds or and where you can find them. north carolina
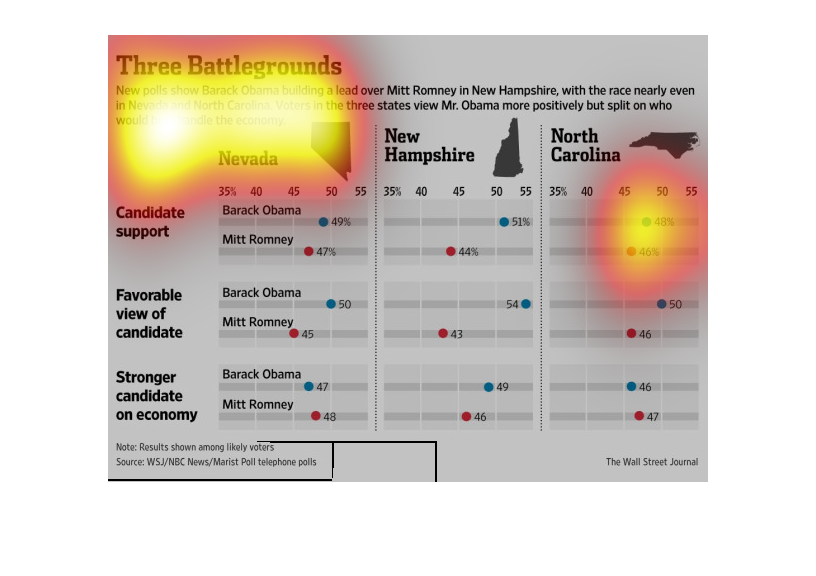
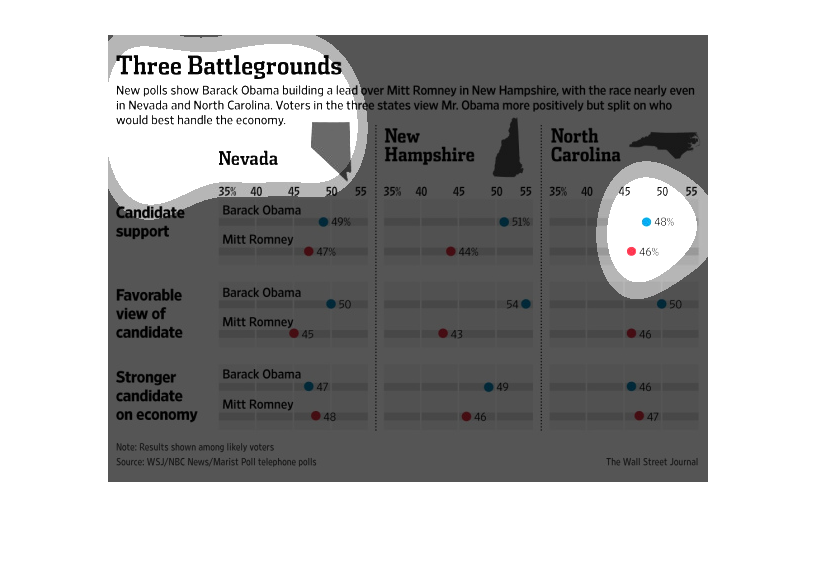
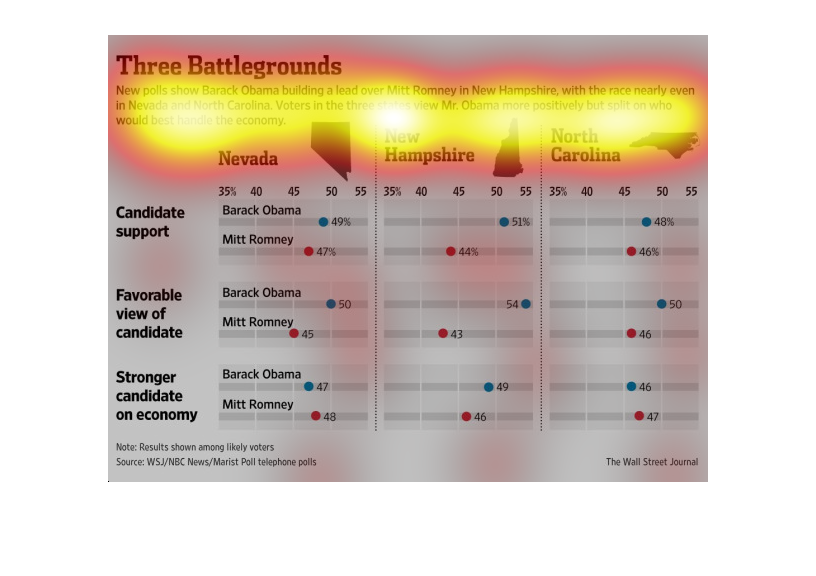
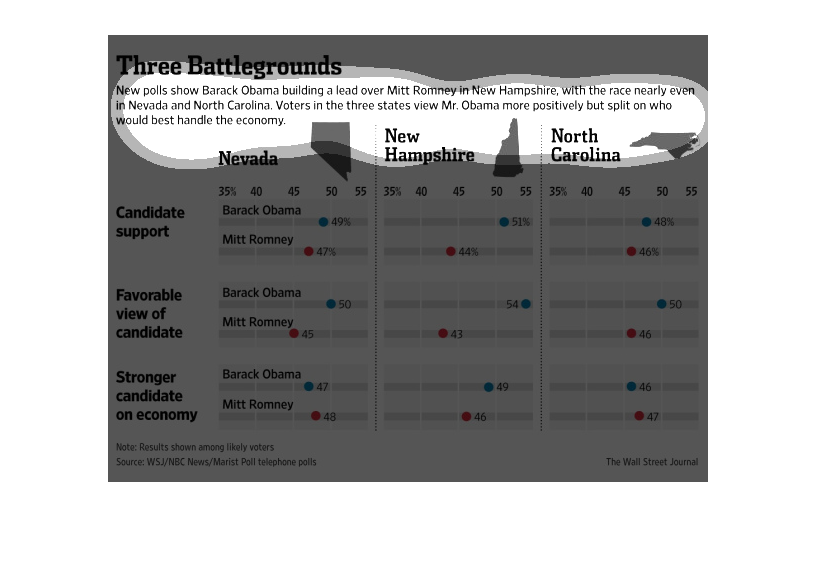
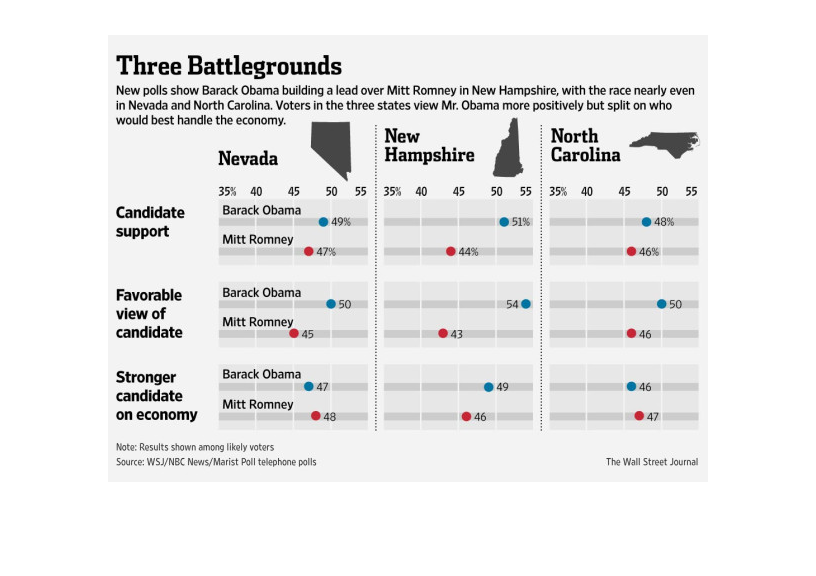
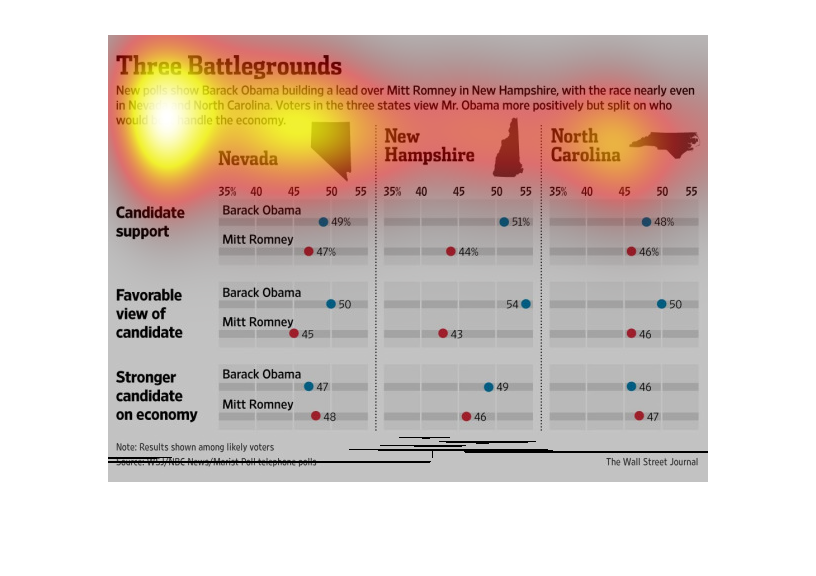
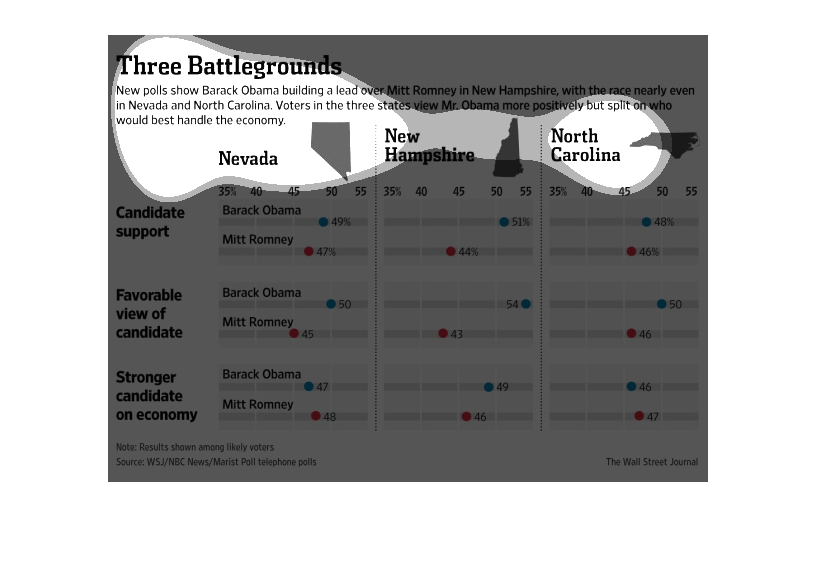
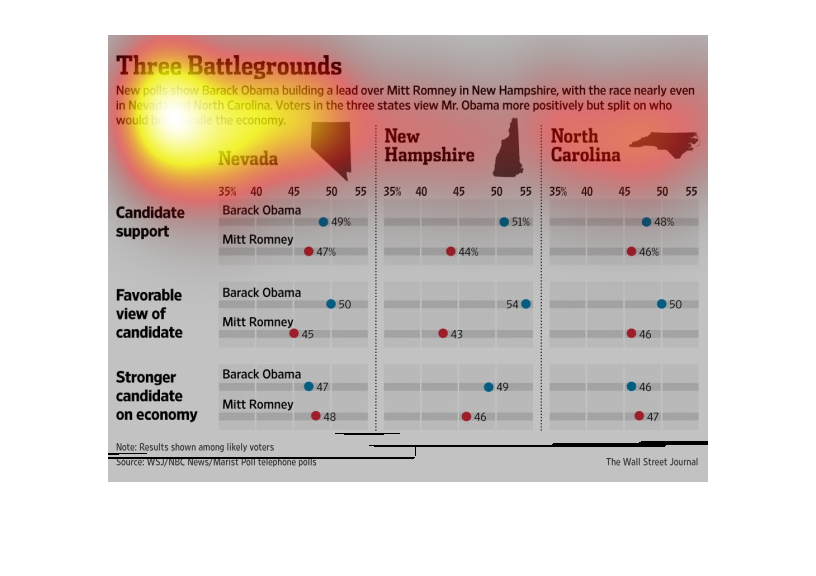
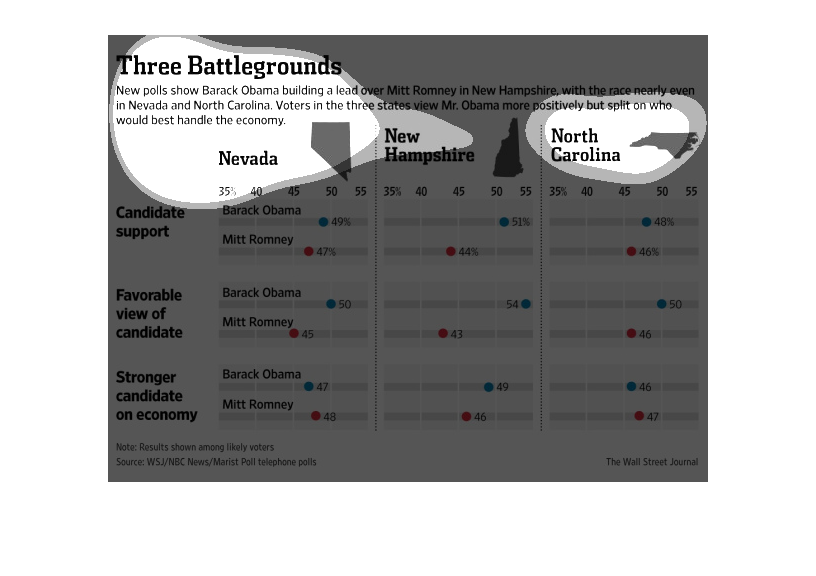
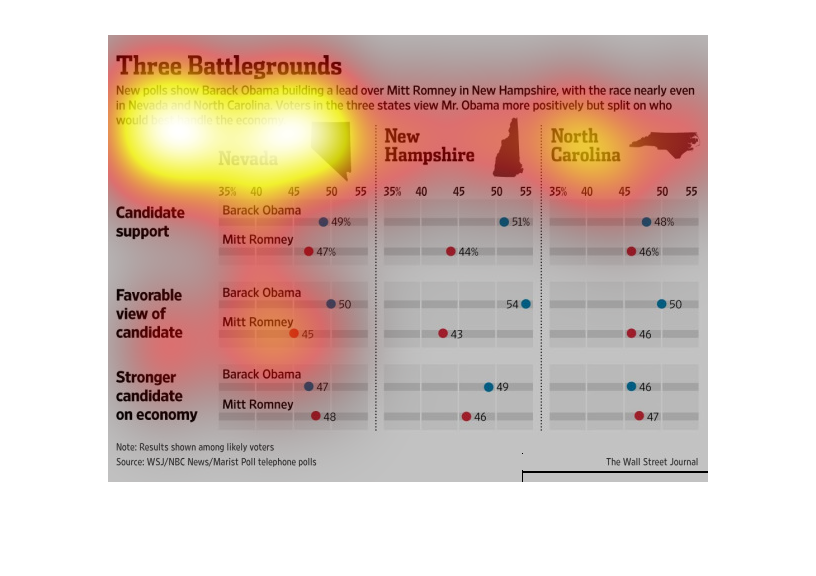
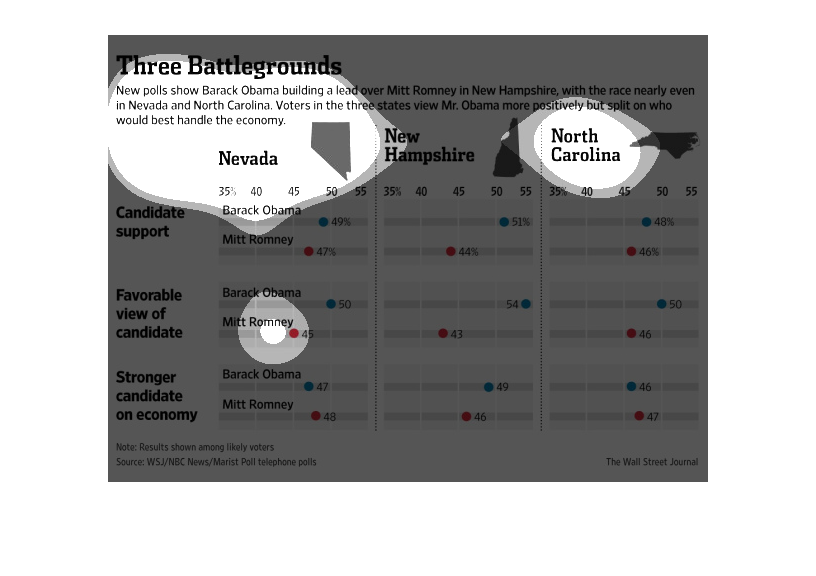
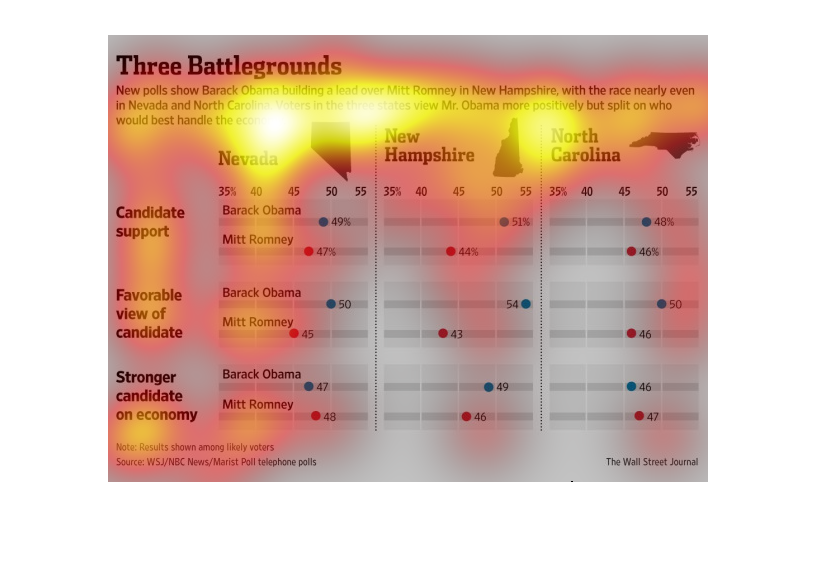
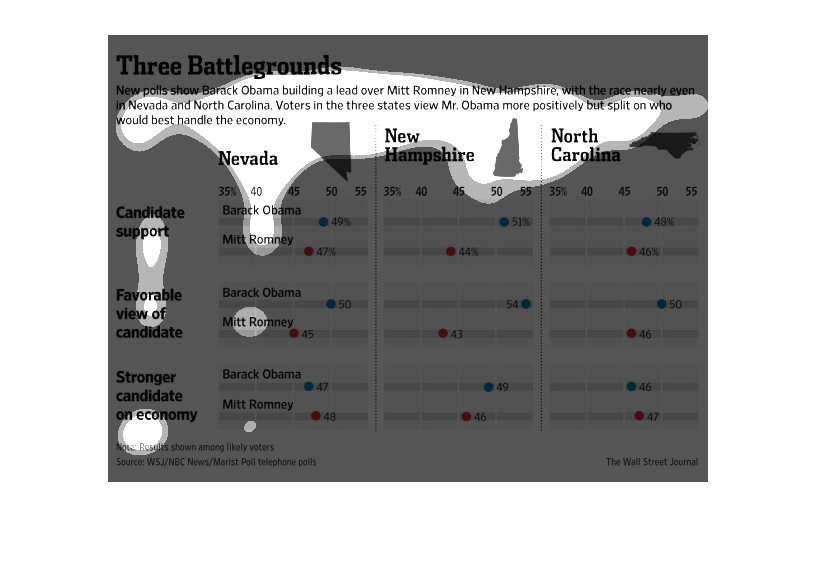
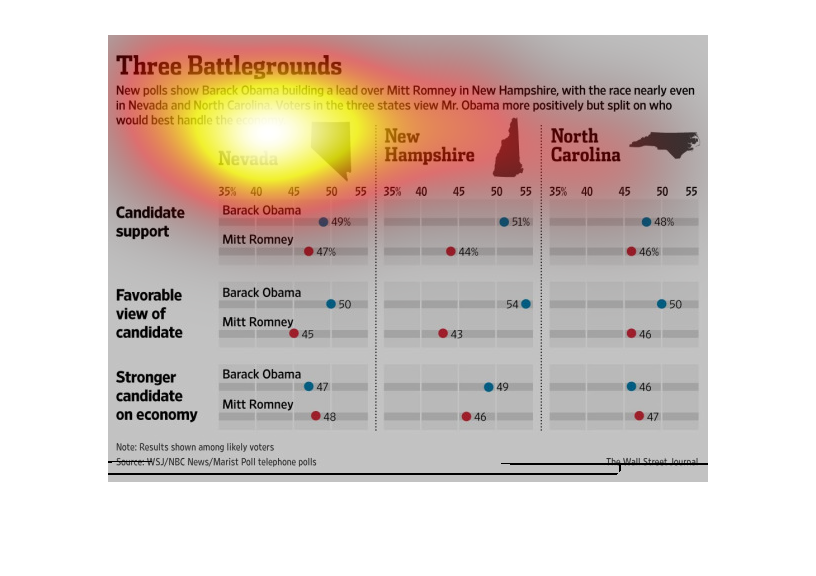
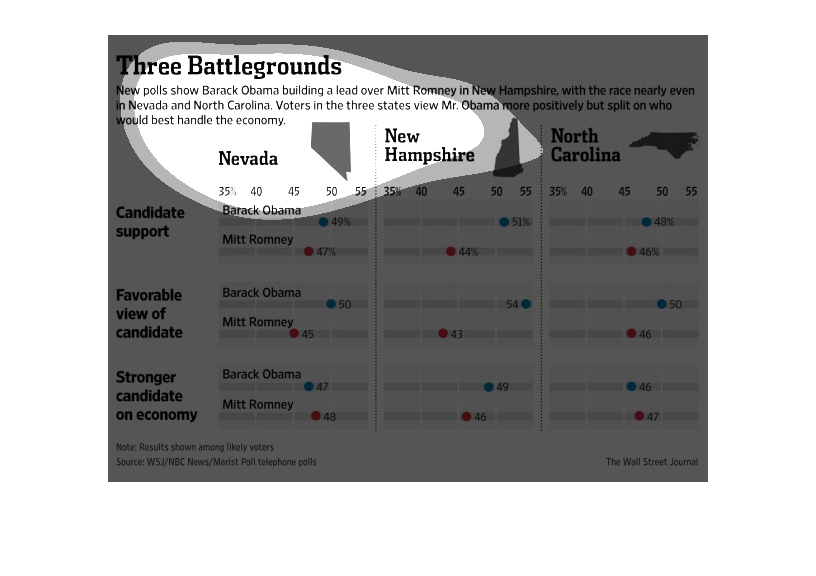
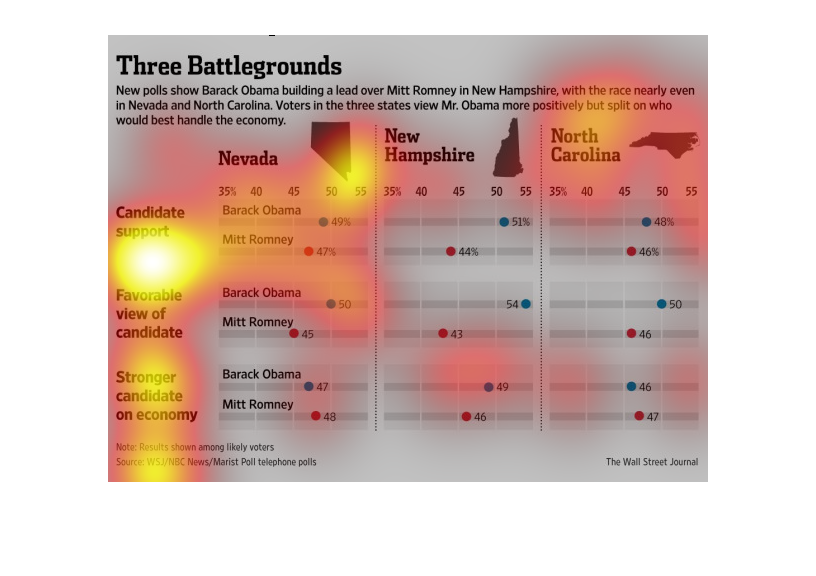
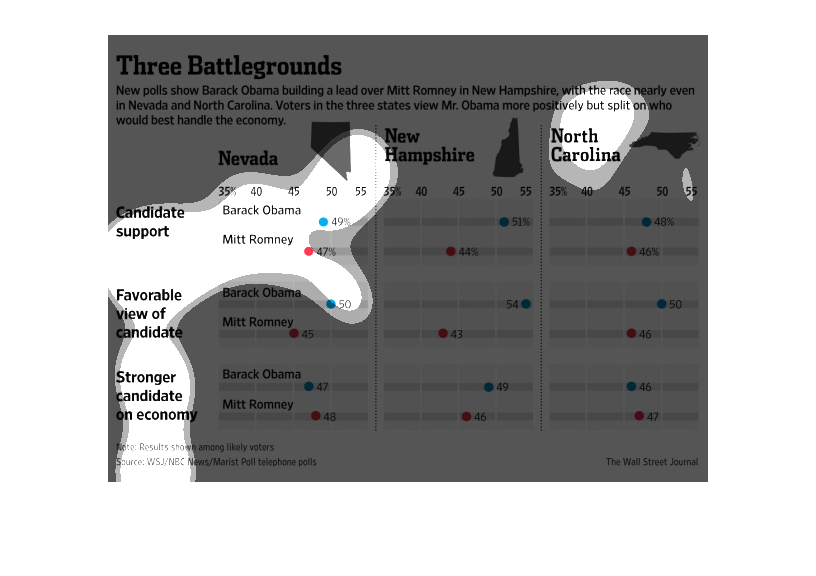
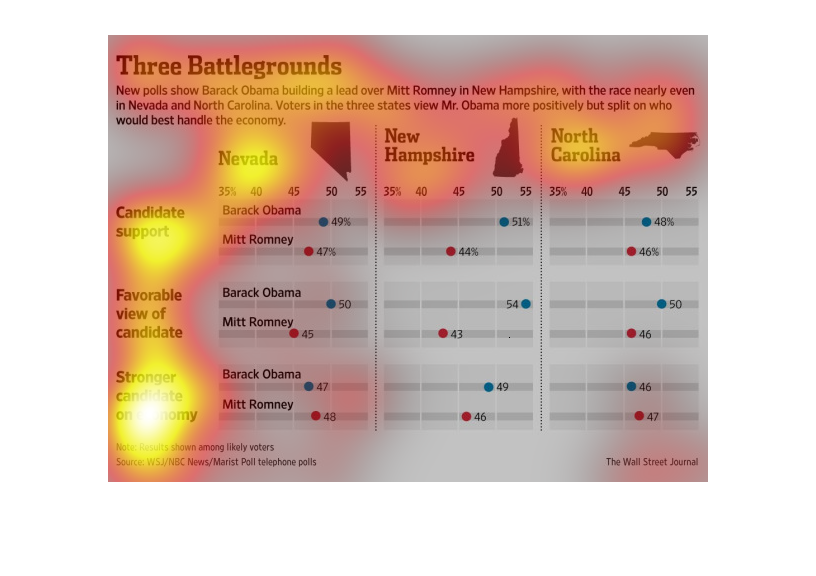
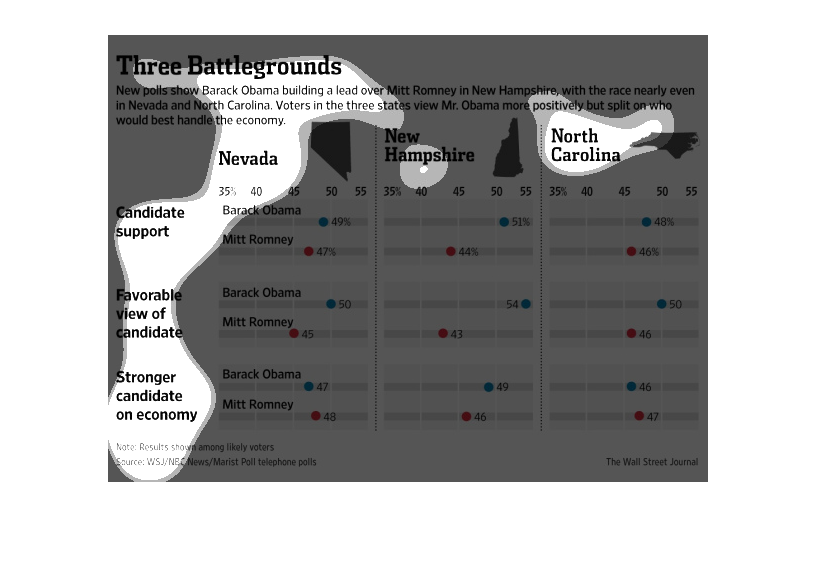
This shows three states - Nevada, North Carolina, and   New Hampshire, in political contention
between Obama and Romney and charts their position in each state according to three criteria
- Support, Favorable Views of Candidate, and who is stronger on economic issues.
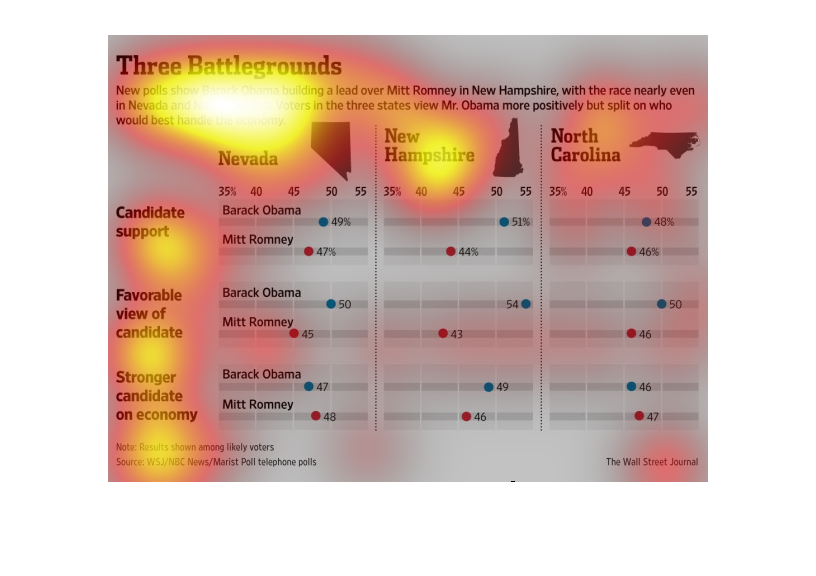
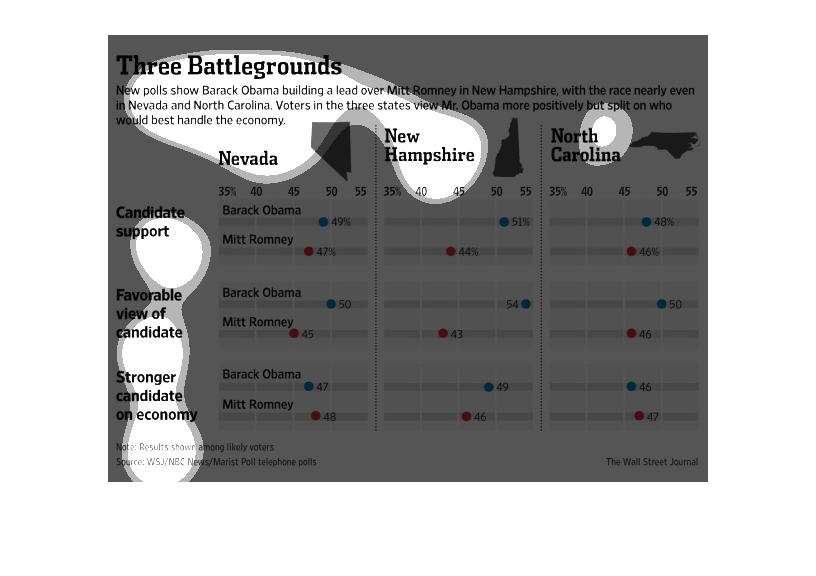
This chart shows presidential candidate Barack Obama gaining leads over Mitt Romney in the
polls in battleground states Nevada, New Hampshire, and North Carolina in the 2012 presidential
election. Obama led among pollers in overall support and favorable view of the candidate,
while Romney held a tight lead in most states when it came to the economy.
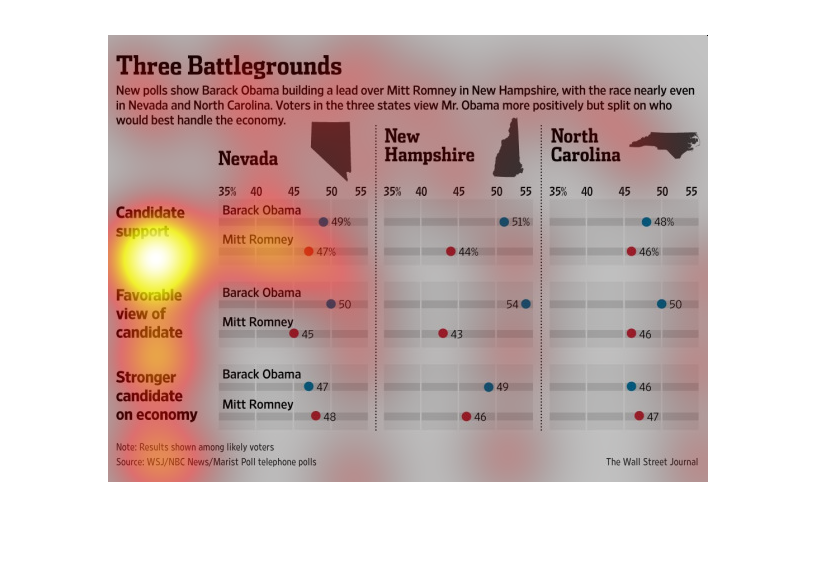
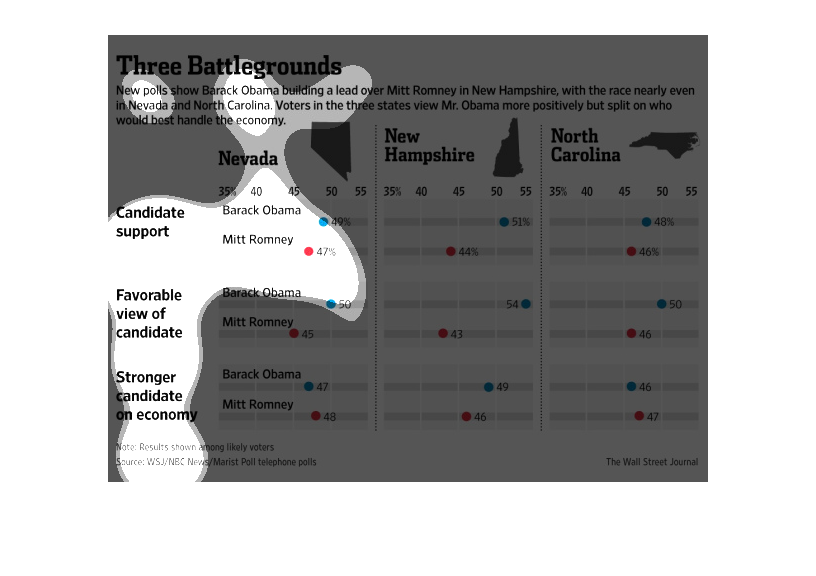
This graph compares the voters' views of Mitt Romney and Barack Obama in the states of New
Hampshire, Nevada, and North Carolina. In both Nevada and North Carolina, Obama was viewed
as more positive while Romney was viewed as stronger based on his views of the economy. In
New Hampshire, Obama was viewed as more positive all around.
This graph depicts states that were considered battle ground states between Barack Obama and
Mitt Romney. This graph was illustrating these area during the last election.
This chart shows the candidates support between Barak Obama and mitt Romney in select states.
The graph breaks the amount of support down into three categories
This image shows a graph that compares the support for Barack Obama and Mitt Romney for three
different states - Nevada, New Hampshire, and North Carolina. There are three categories -
candidate support, favorable view of the candidate, and which candidate is stronger on economic
policies.
This is a chart depicting the lead Barak Obama held in three key battleground states over
his opponent Mitt Romney in the 2012 presidential elections.
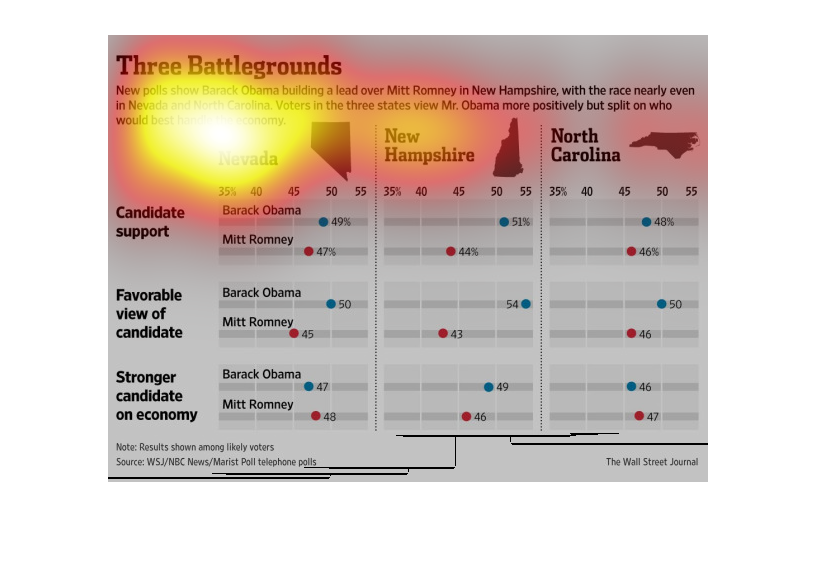
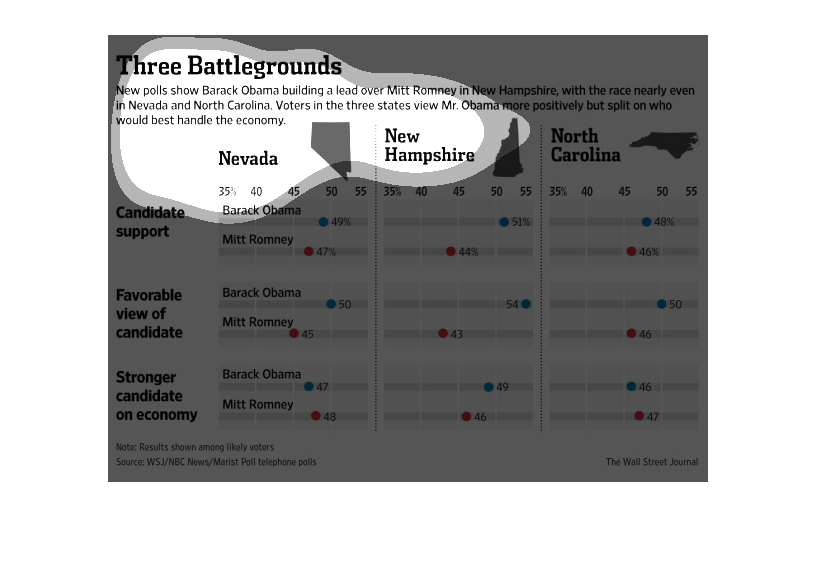
The image depicts new polls showing Barack Obama building a lead over Mitt Romney in New Hampshire,
with the race almost even in Nevada and North Carolina.Voters in the three states view Barack
Obama more positively but are split over who would best handle the economy. The data indicates
that Obama is in a good position to win these battleground states.