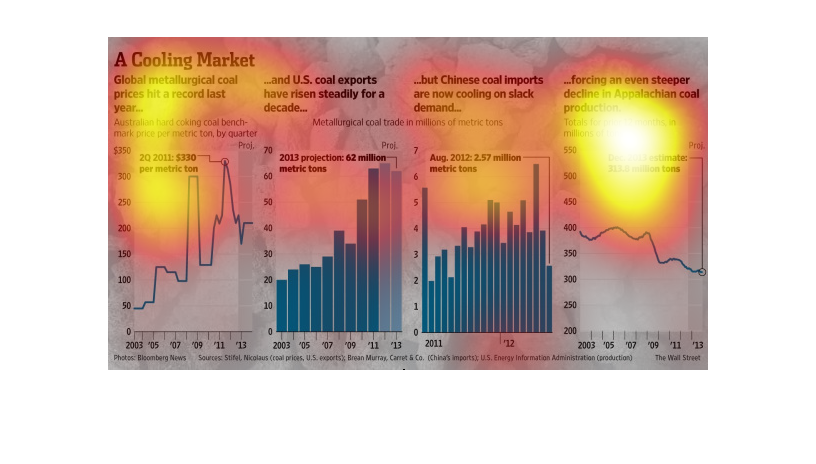
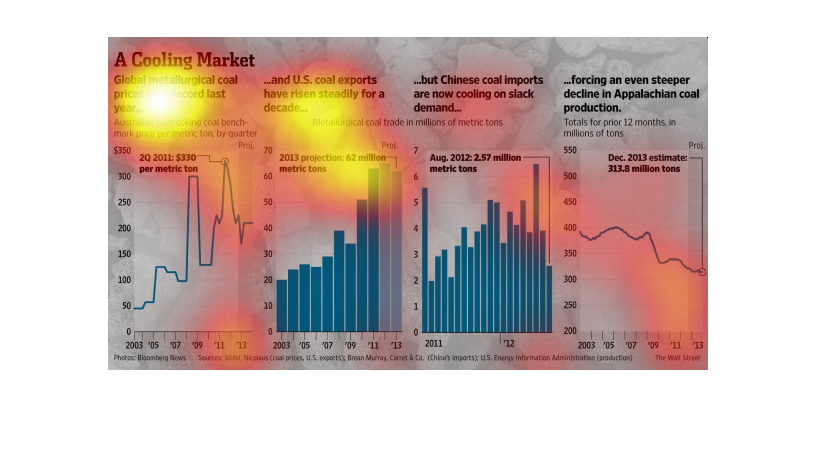
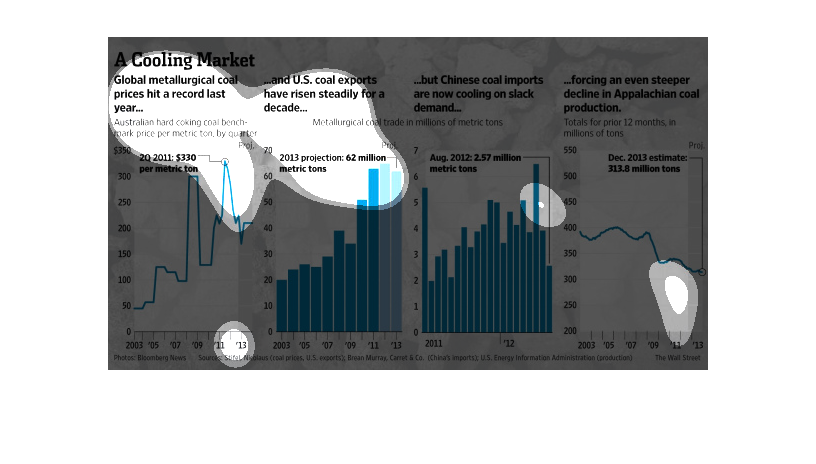
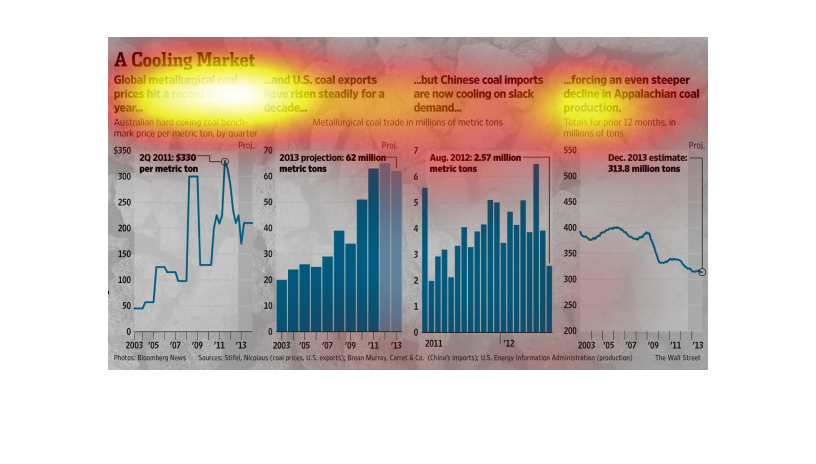
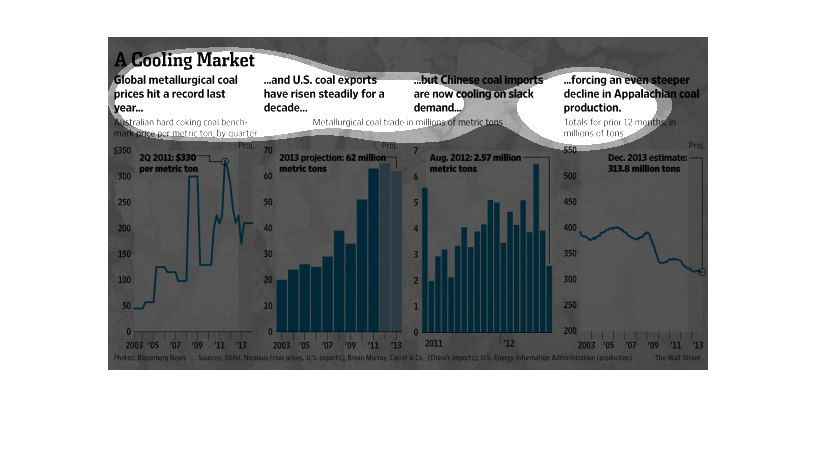
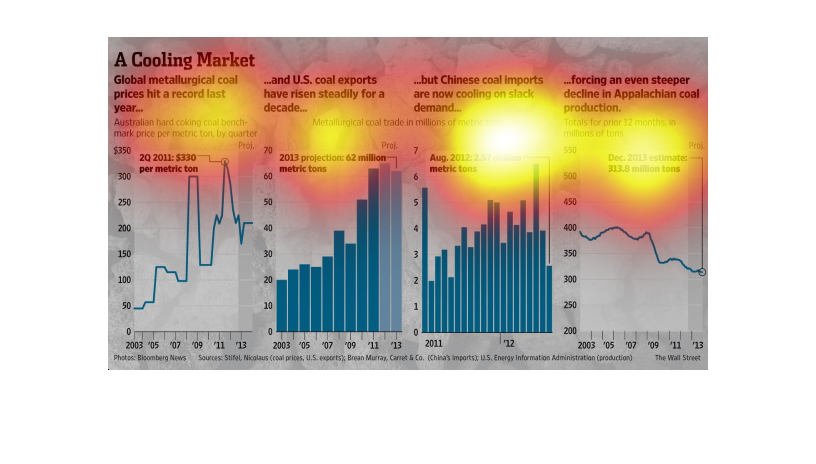
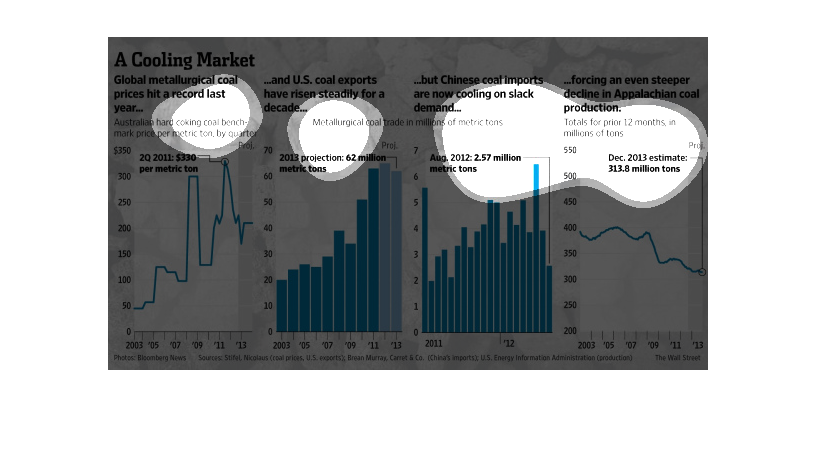
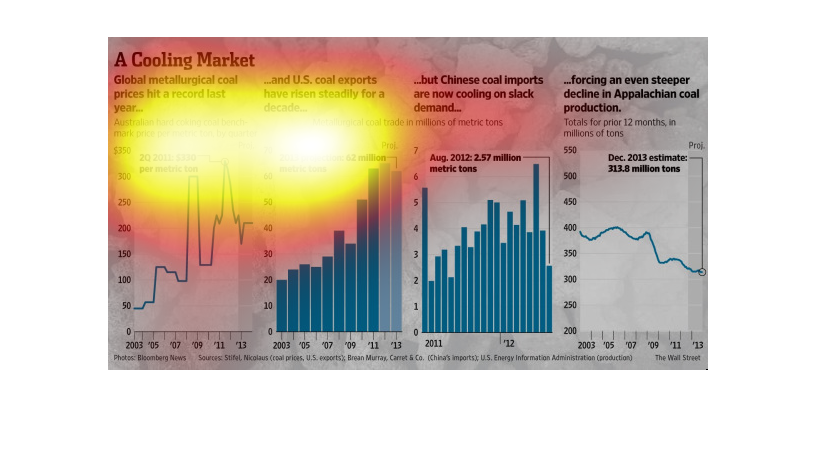
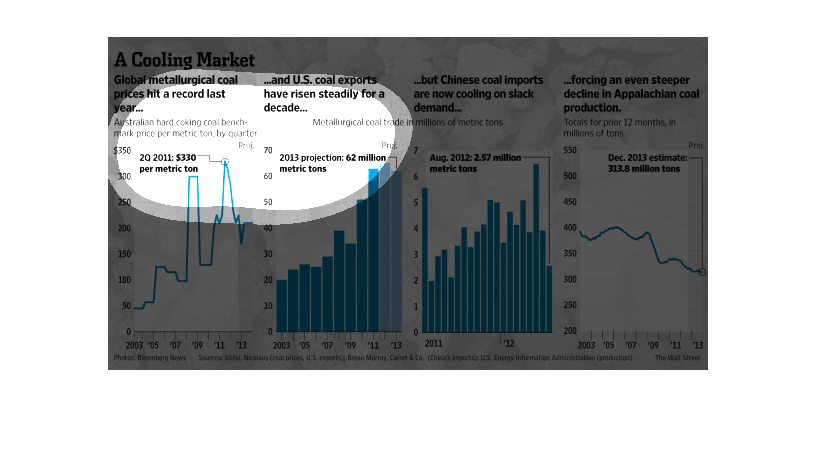
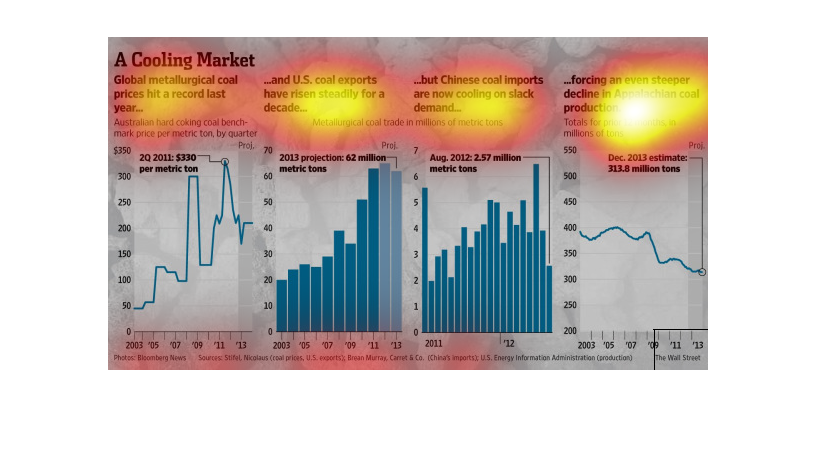
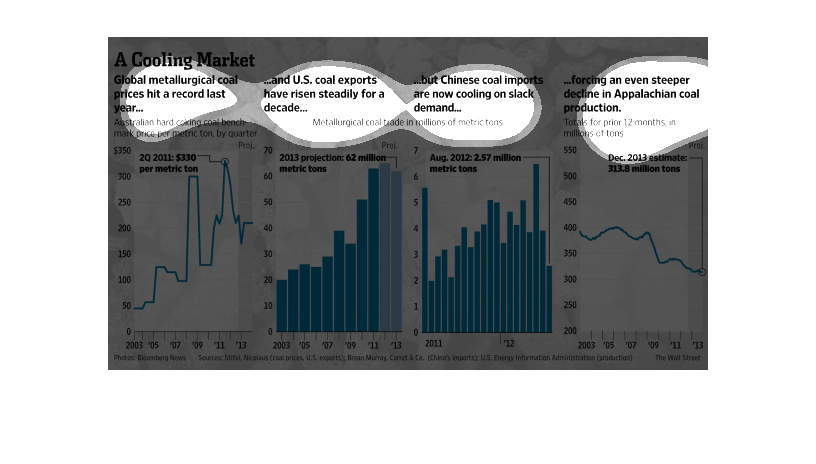
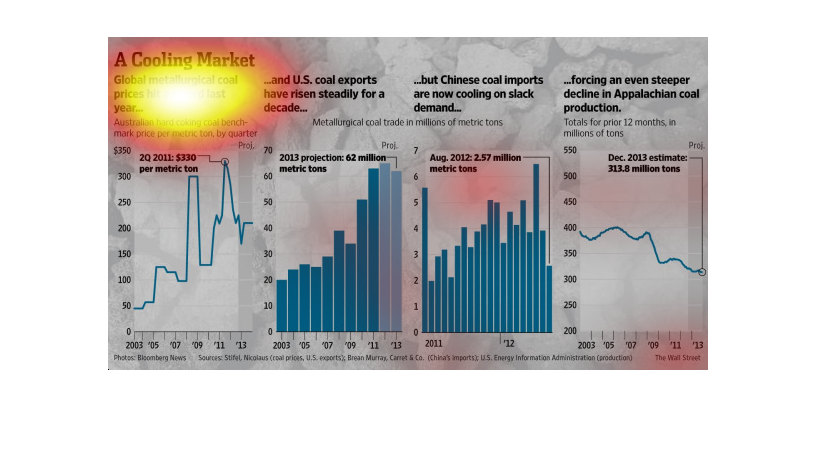
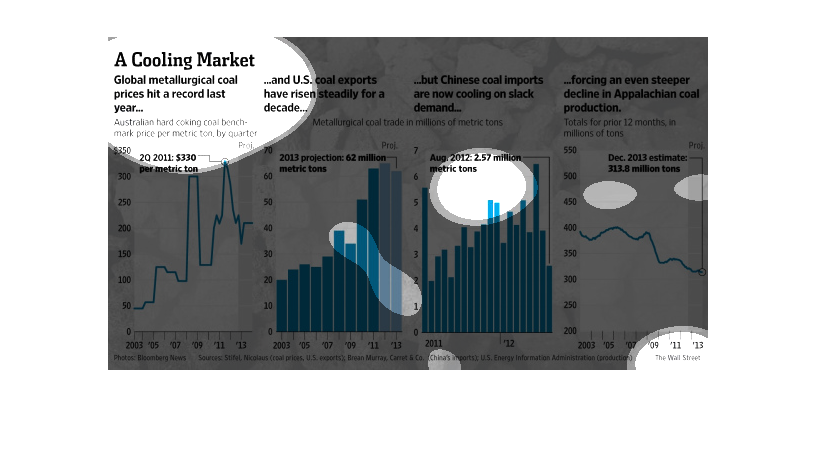
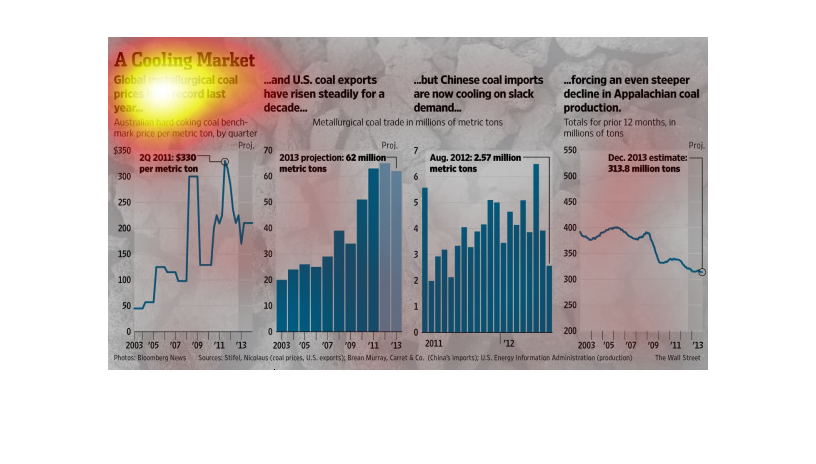
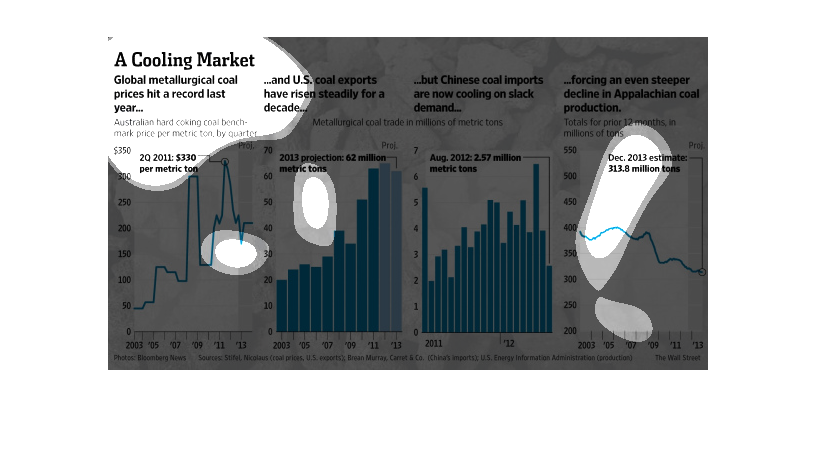
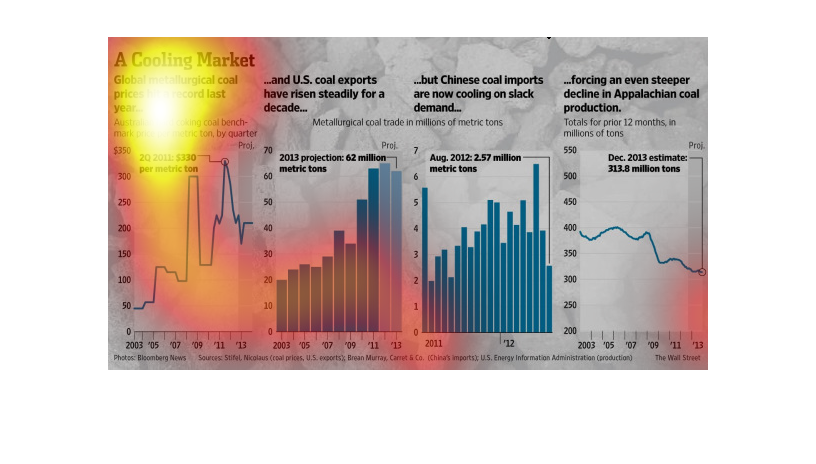
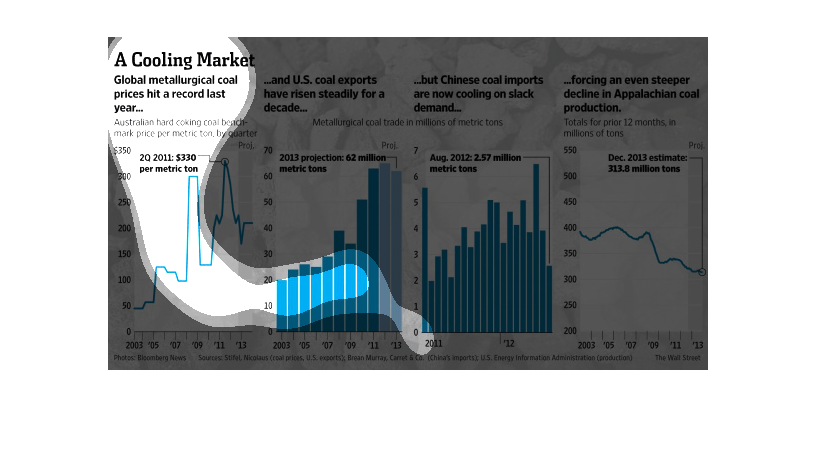
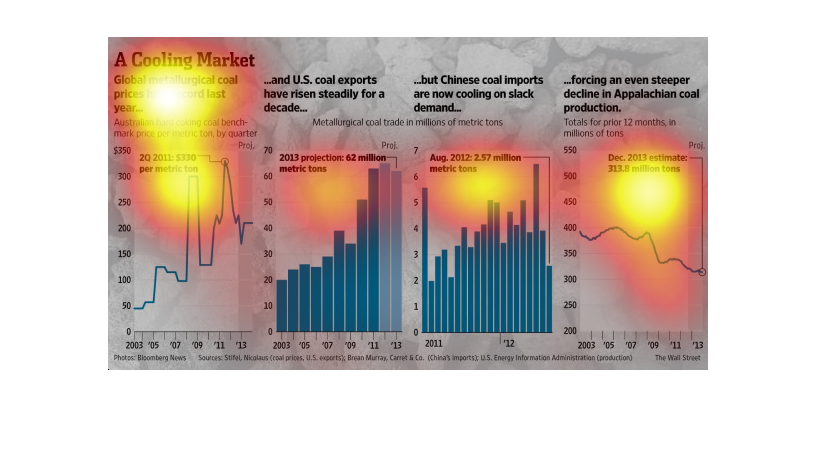
These series of yearly graphs show the record hit by coal prices in 2013. A chart shows production,
while two bar graphs shows the chinese projections for prior years. Finally a chart on the
right shows the falling production of US Appalachian coal.
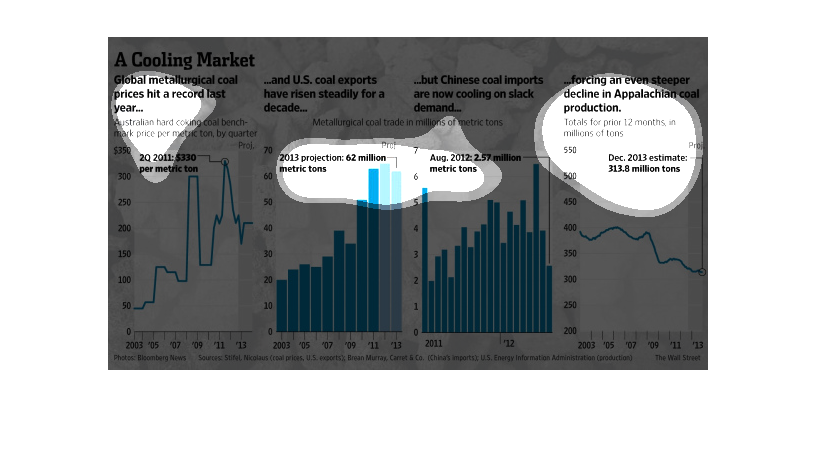
A cooling market... basically multiple sources of coal and demand for coal have declined after
a massive peaking within the last decade. A steady increase has started to decline, but not
yet plummet as new sources of energy are utilized.
This chart describes a cooling market. Specifically, global metallurgical coal prices hit
a record last year. The chart is divided into two categories.
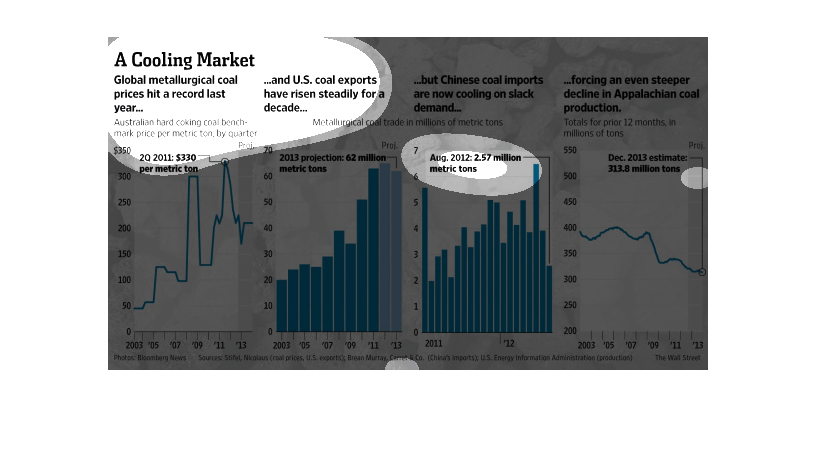
The image depicts the global metallurgical coal prices hitting a record in 2011/2012, and
then falling in 2013. US coal exports have also risen for a decade, while Chinese coal imports
are slowing due to lower demand.
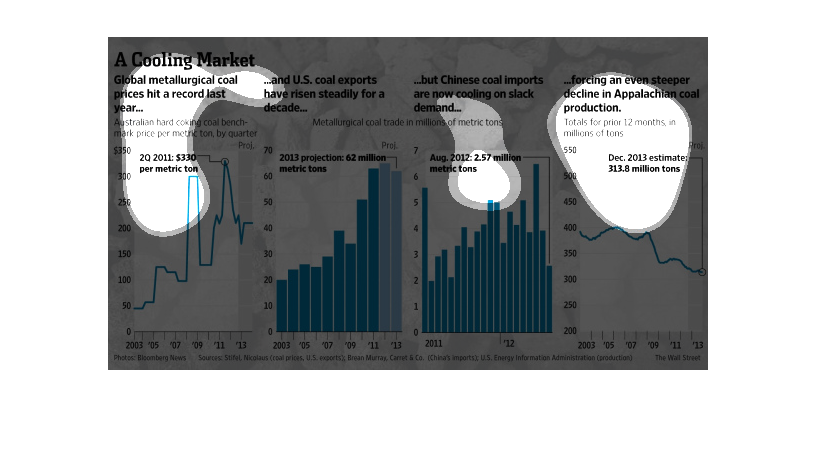
These two charts are depicting the rise of coal prices internationally over the past few years.
According to the charts, US coal exports have risen steadily for a decade, but Chinese imports
are now cooling on slack demand.
This is a series of graphs and charts depicting various aspects of the coal market and the
correlation with US output/production and the demand from China.
A cooling market global metallurgical coal prices hit a record last year. It is about australlian
coal and U.S coal exports have risen steadily for a decade.
The image describes a slowing of the metallurgical coal market mostly due to decreasing Chinese
demand which has led to fall in Appalachian Coal production.  This comes after a decade long
rise in metallurgical prices (and Chinese demand)
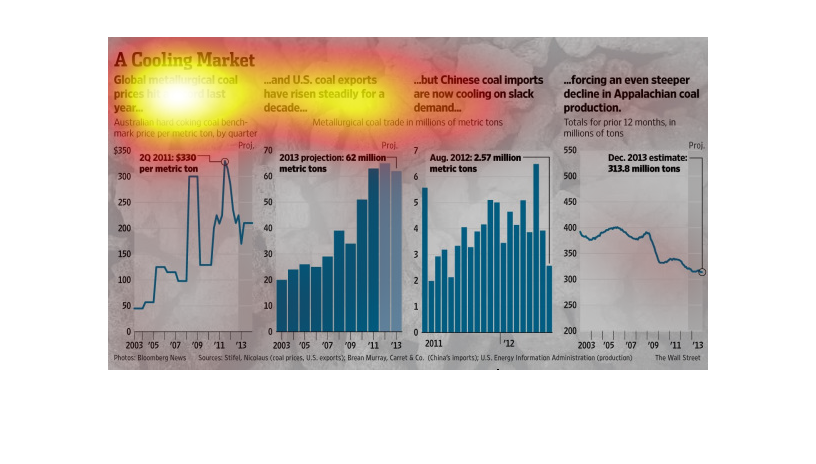
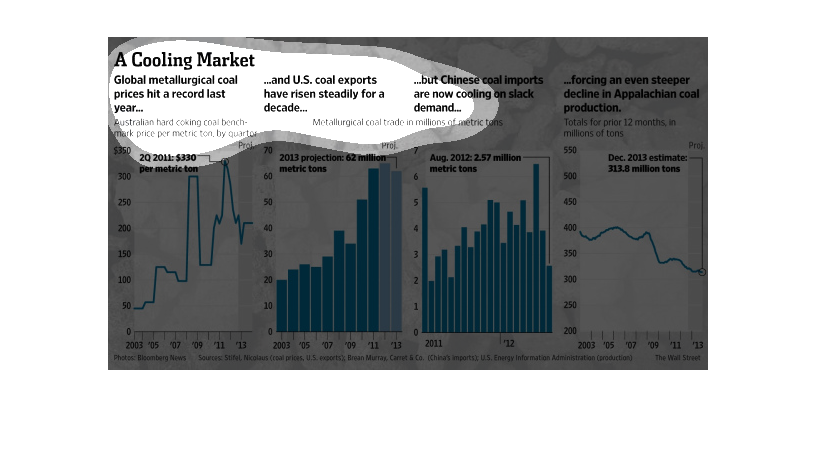
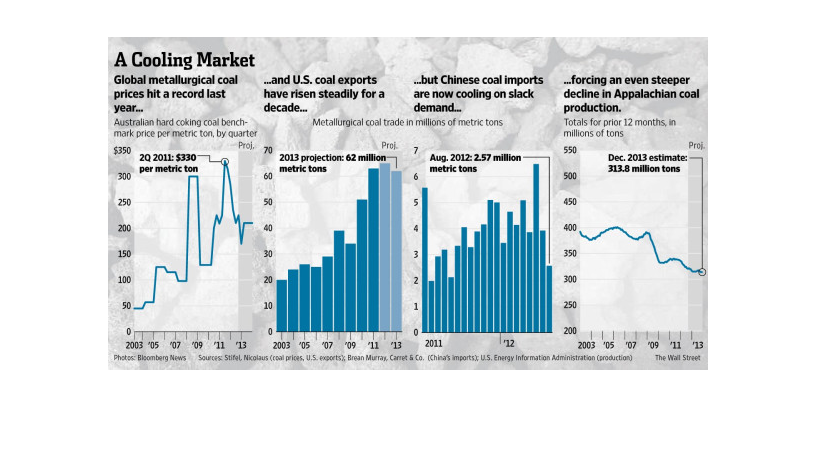
These charts show global metallurgical coal prices, number of US coal exports, Chinese coal
imports, and amount of Appalachian coal production from the years 2001 to 2013.
This chart describes a cool market. Specifically, global matallurgical coal prices hit a record
last year. The highest spike on the chart occurred in the year 2012.
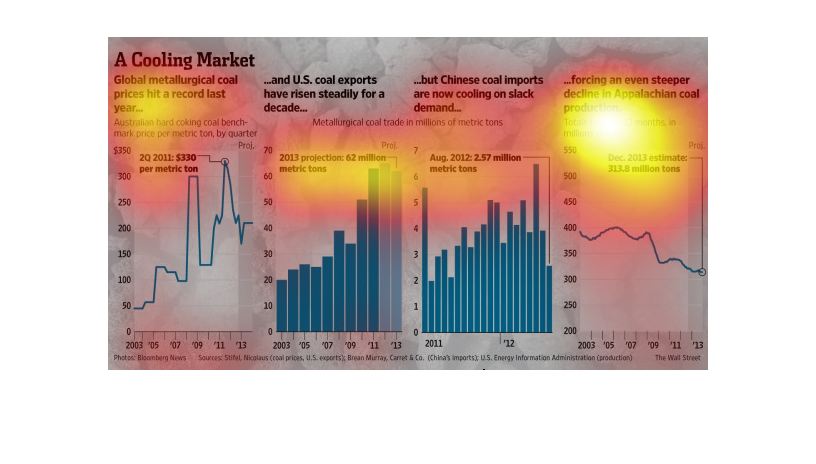
This image shows or depicts in line and bar graph statistical formats data concerning global
metallurgic coal prices hit a record ln recent times up to 2012.
the name of this graph is called a cooling market and the graph is a bar graph. there are
two line graphs and two line graphs. and there are two bar graphs
The caption for this graph is, "A Cooling Market, Global metallurgical coal hits a record
last year".  There are a total of four graphs, two bar graphs and two line graphs.  One graph
shows price per metric ton during a certain time period, another showing price projection
in metric tons, another showing pricing in metric tons during a certain time period, and yet
another showing estimates in another time period.
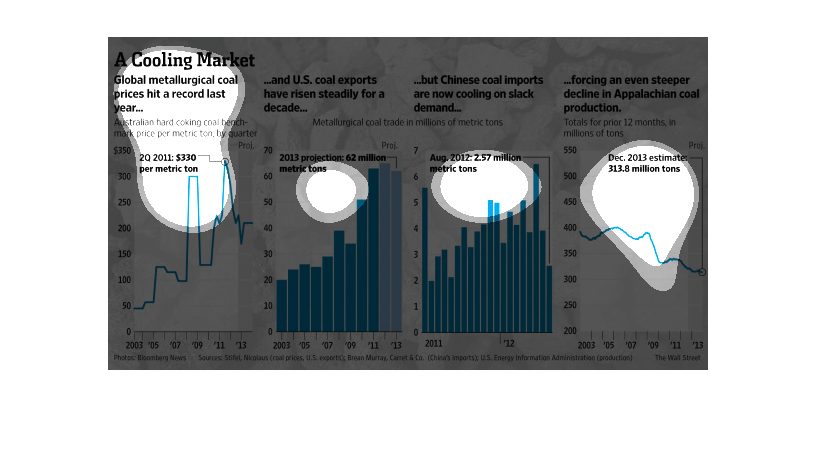
Cooling Market  Chinese Coal, US Coal, Global Coal Markets  This Graph is harder to read
2011 $330 per metric ton  2013 Projection 62 million per metric ton  2012 2.57 million per
metric ton  Steeper decline in Appalachian Coal