Drones are becoming more and more the go-to weapon for the United States military campaign
against their enemies overseas. The war on terror has become more and more digital, as this
graph informs us with great detail.
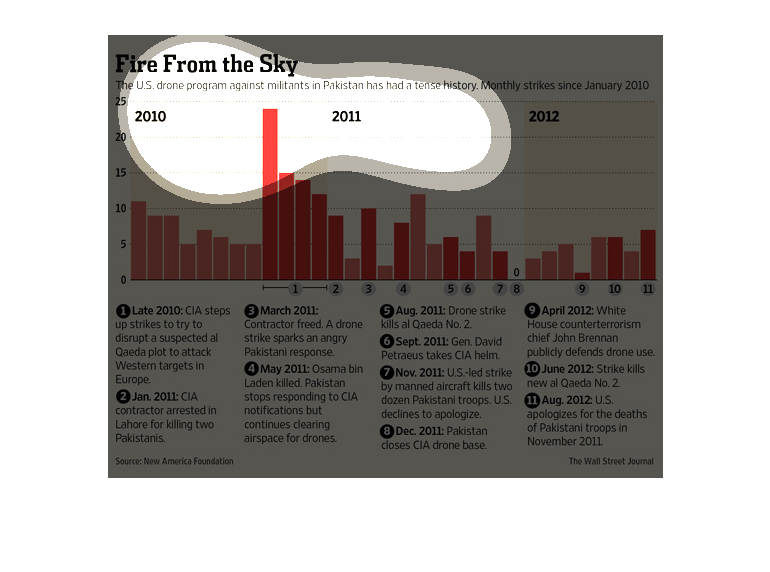
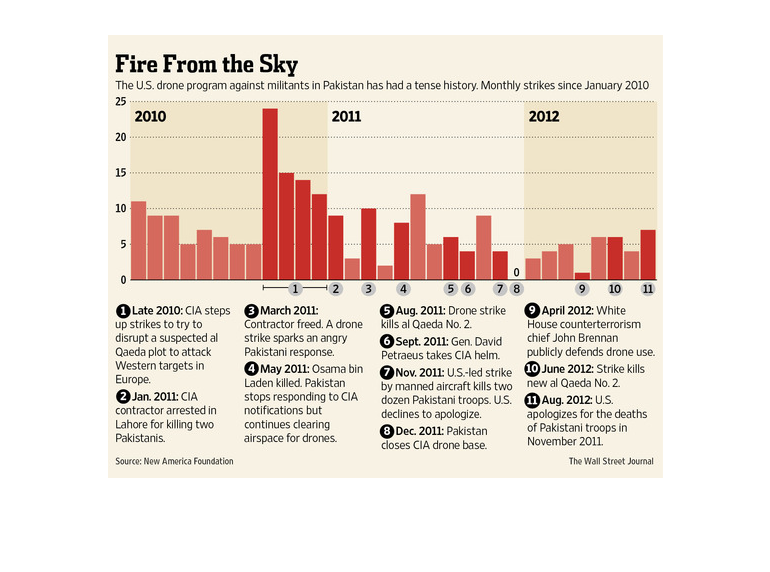
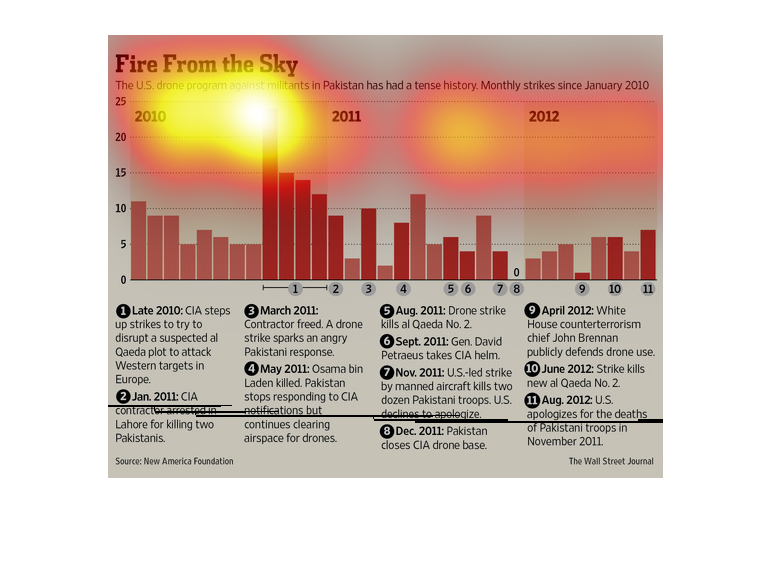
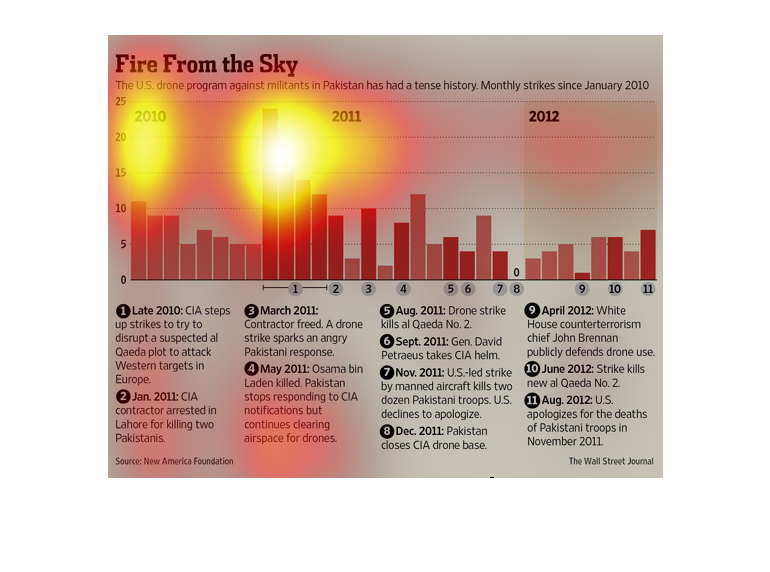
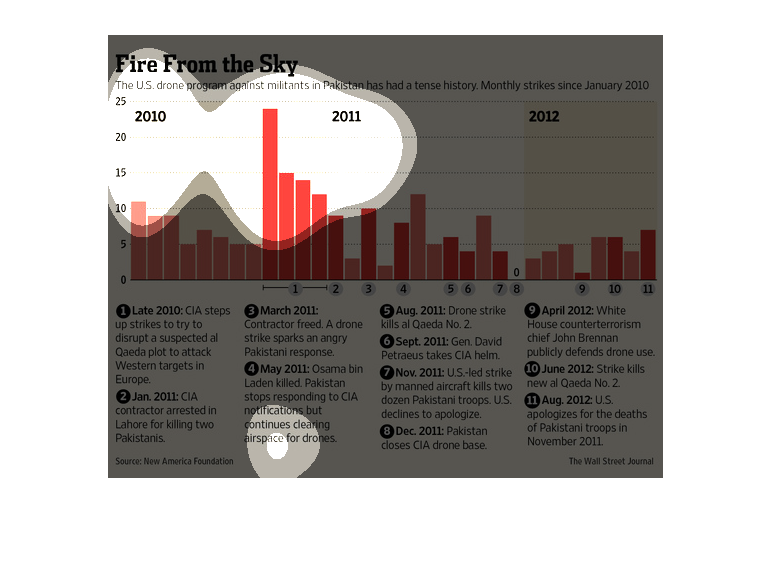
This chart documents the number of Us Military drones strikes against Pakistan since January
2010, and includes details of the incidents at the bottom of the chart

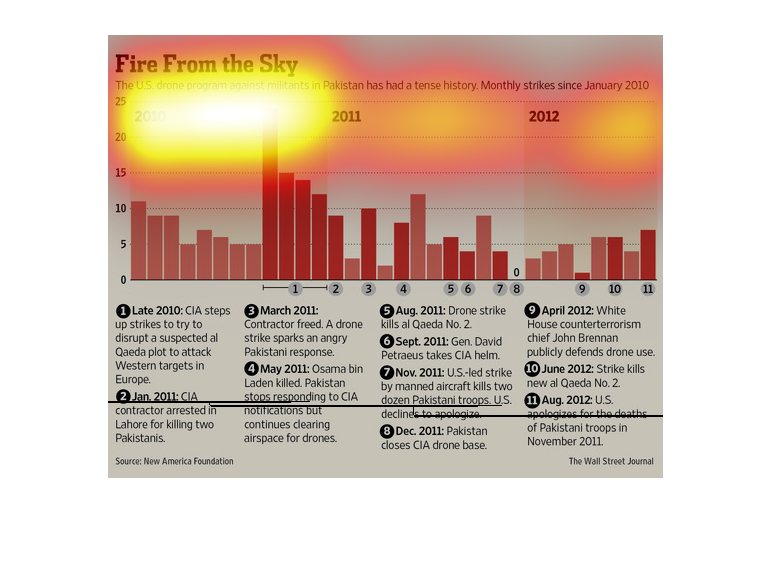
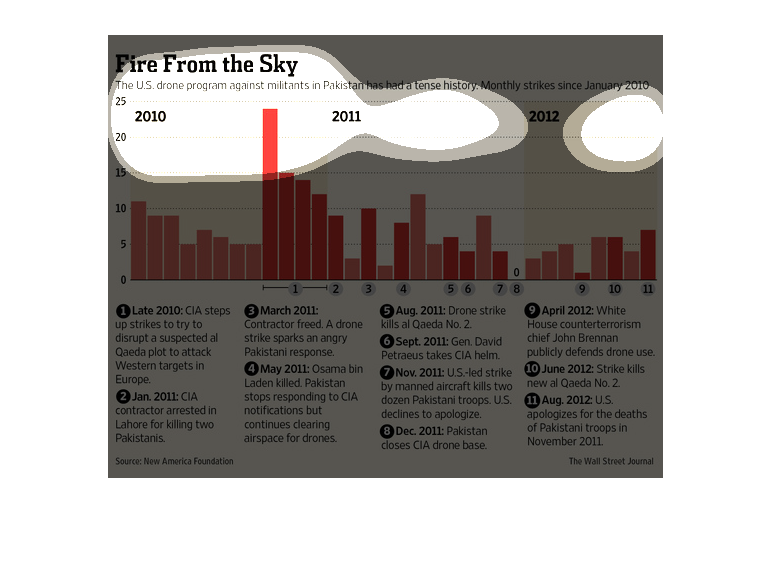
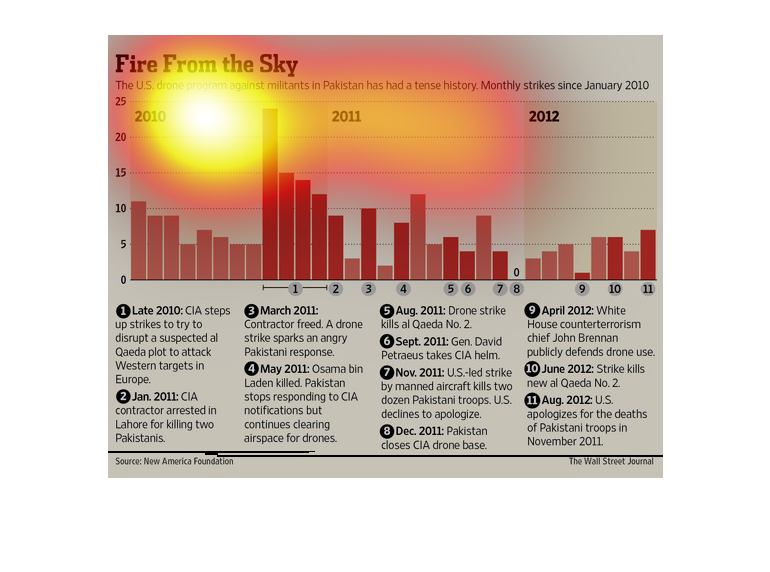
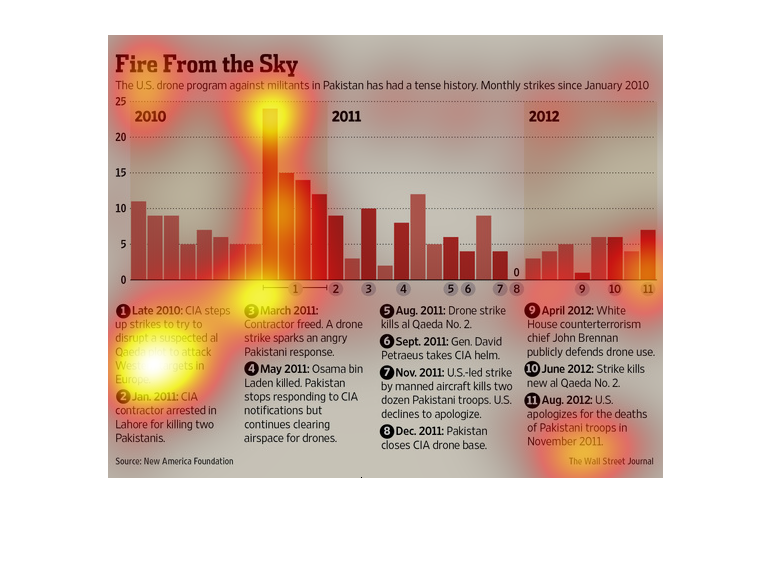
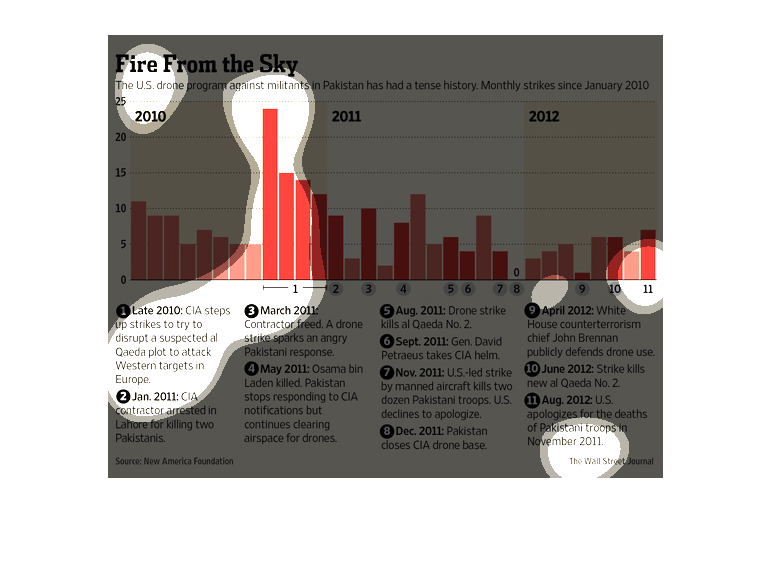
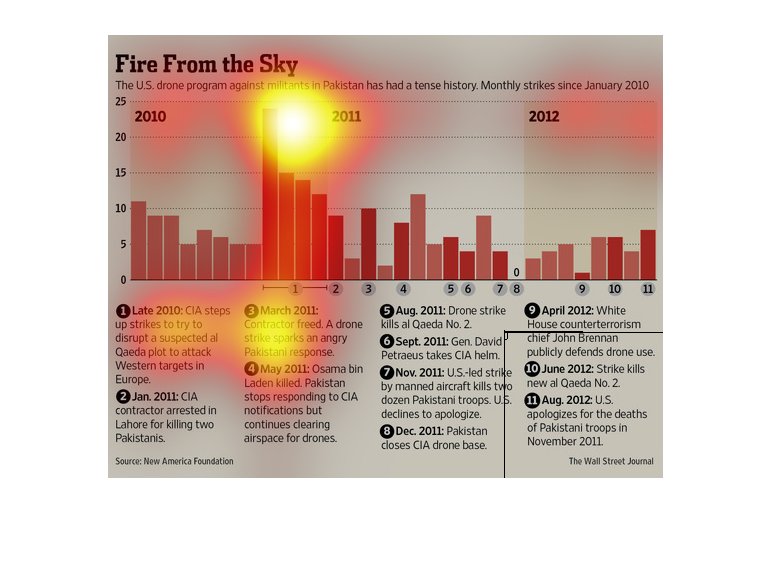
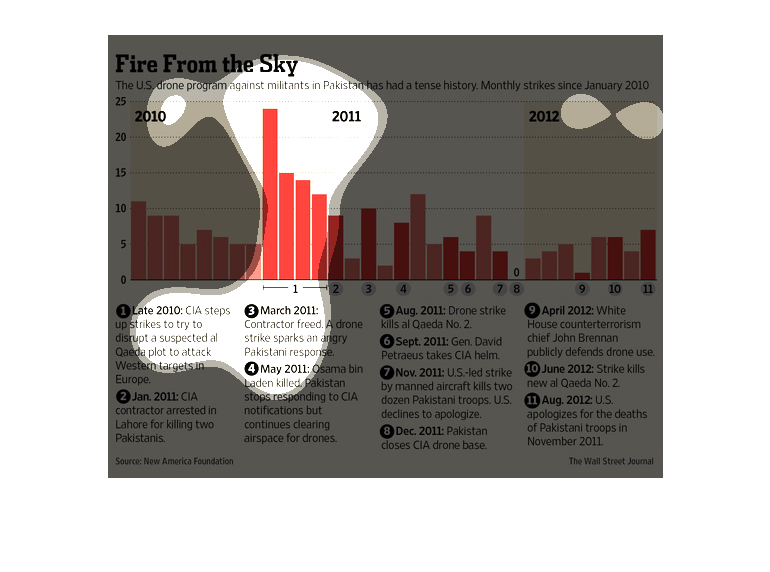
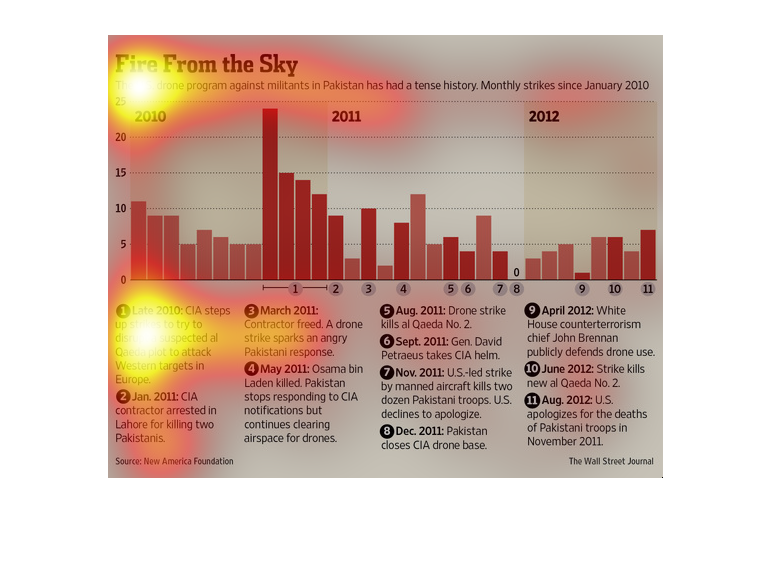
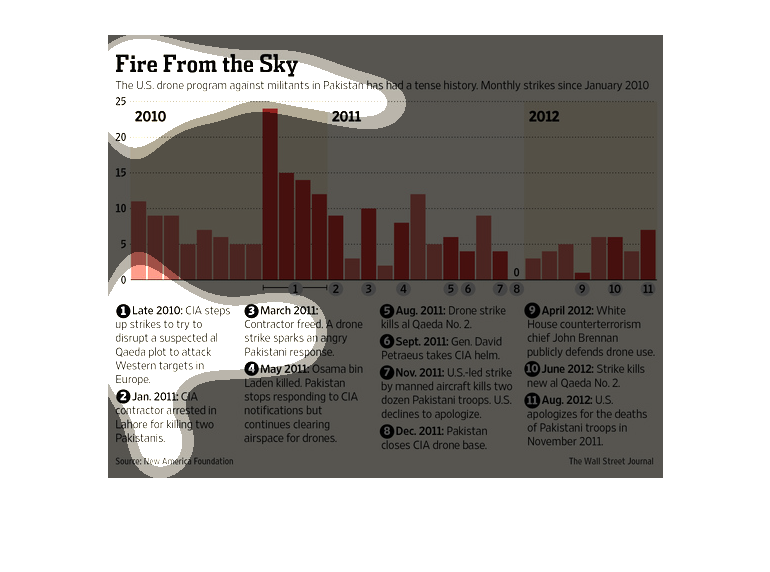
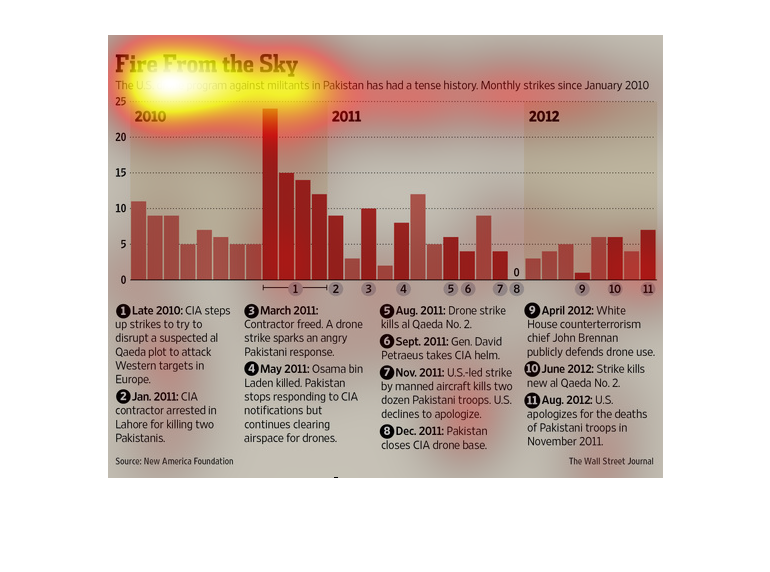
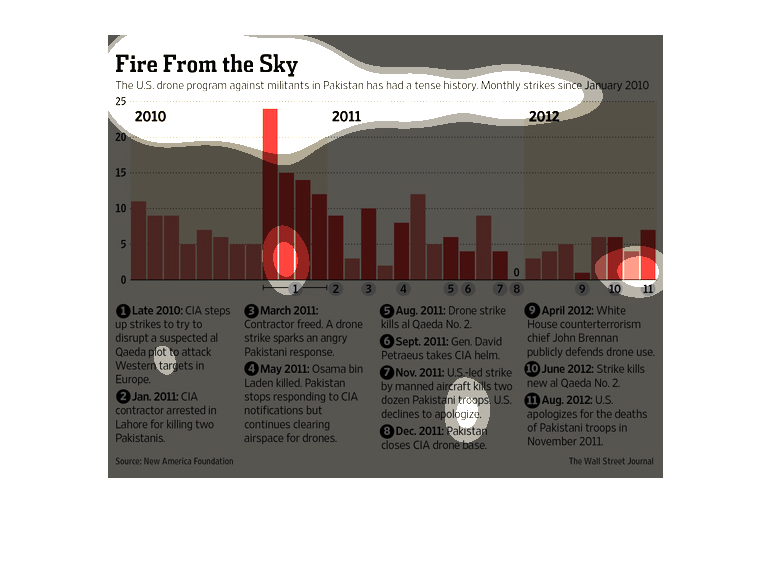
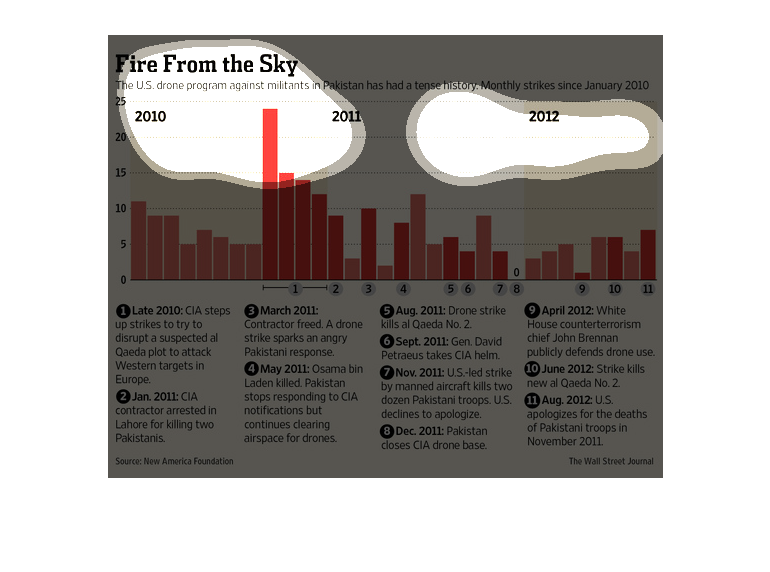
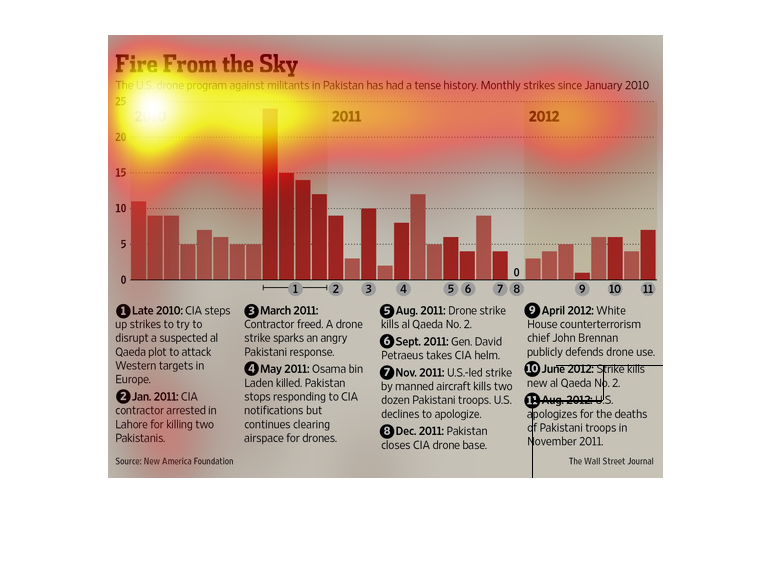
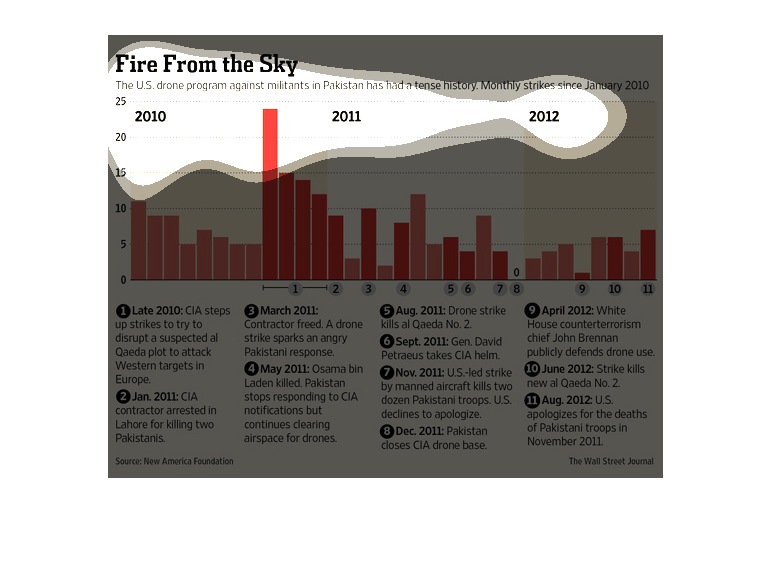
This chart describes fire from the sky. Specifically, the U.S. drone program against militants
in Pakistan has had a tense history. Monthly strikes since January 2010.
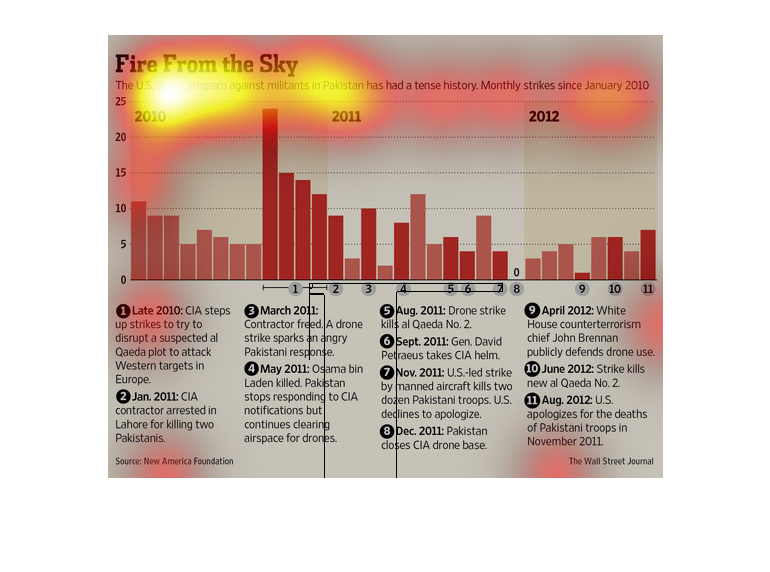
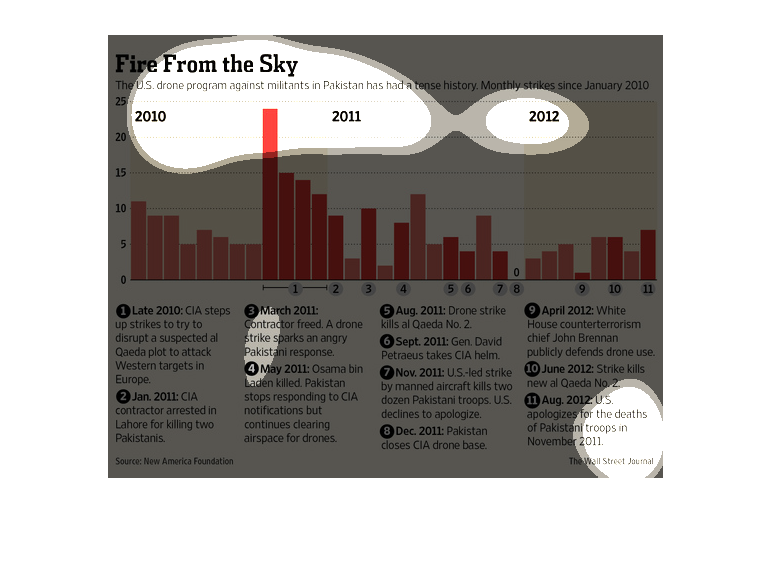
This is a series of bar graphs depicting the United States drone program against militants
in Pakistan and statistics showing it's tense history. It shows monthly strikes from Jan 2010
through 2011.
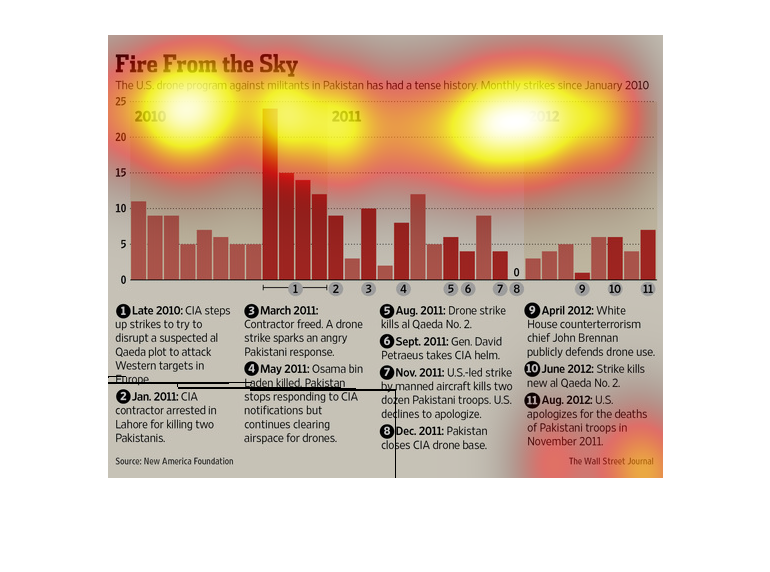
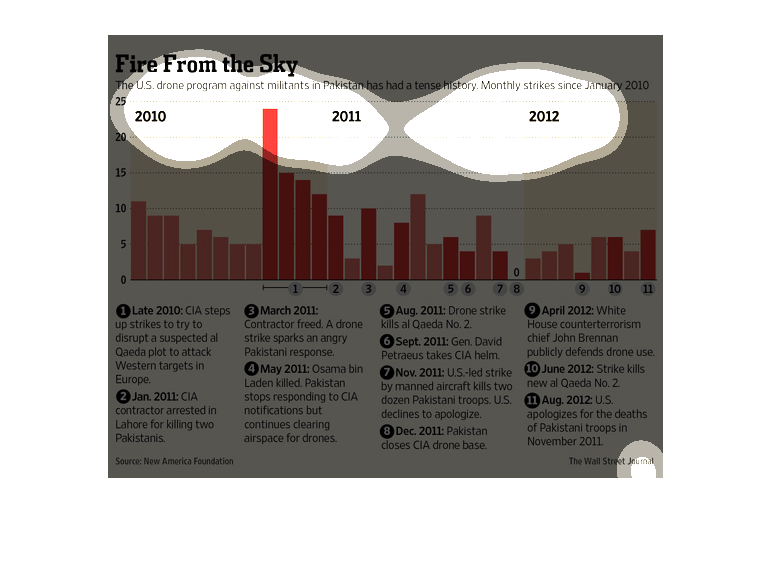
This chart shows month drone strikes by the US on Pakistan since January 2010. In late 2010
there were a lot of strikes, up to 25 in a month, when the CIA was trying to disrupt a suspected
Al Qaeda plot in Europe. There were very few strikes in 2012 and the US apologized for deaths
of Pakistani troops.
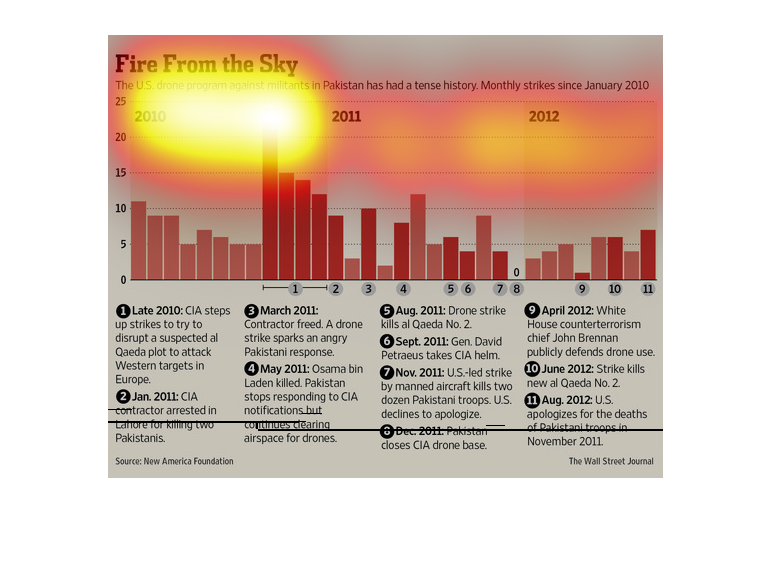
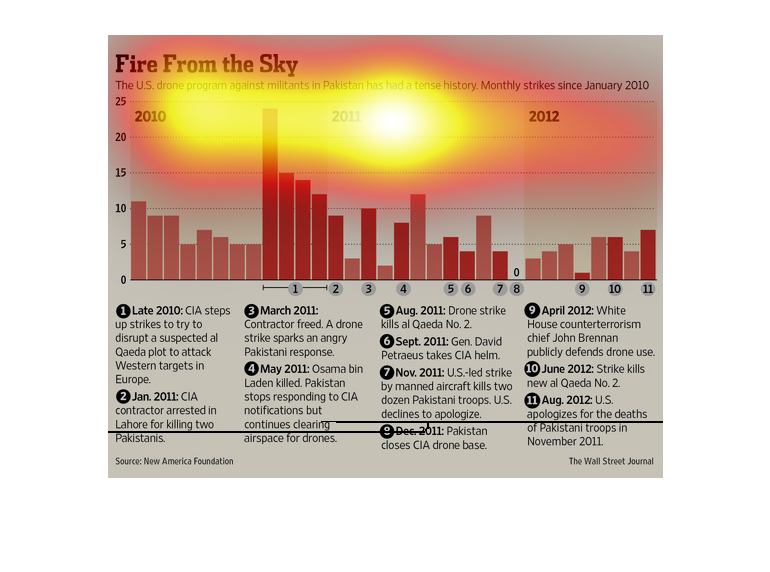
The title of this chart is "Fire From the Sky" and is about drones being use by the US against
militants in Pakistan. It runs from Jan of 2010 to the end of 2012 with  a spike in August
of 2010.
Article about United States drone strikes in Pakistan over time. There is a description at
the bottom telling further descriptions for each time frame between 2010 and 2012.
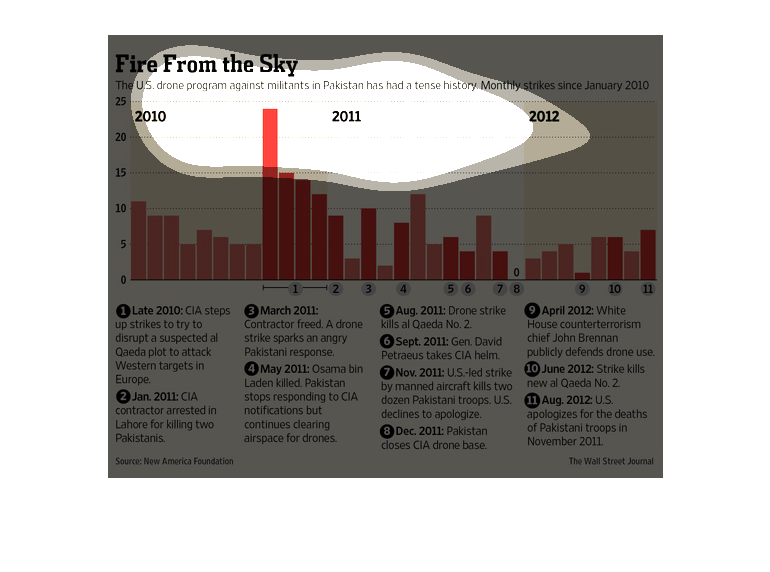
This image shows or depicts in statistical bar graph format data concerning the U.S. drone
program against militants in Pakistan has had a tense history. Monthly strikes sine January
2010.
This is a graph giving data about the United States's drone program. It shows that the US
drone program against militants in Pakistan's has had a tense history.
This chart describes fire from the sky. Specifically, the US drone program against militants
in Pakistan has had a tense history. Monthly strikes since January of 2010.
The following chart shows the number of missiles strikes from UAV or UAS systems against militant
groups in Pakistan from JAN 2010 to jam 2011. Shows a spike in the summer months.
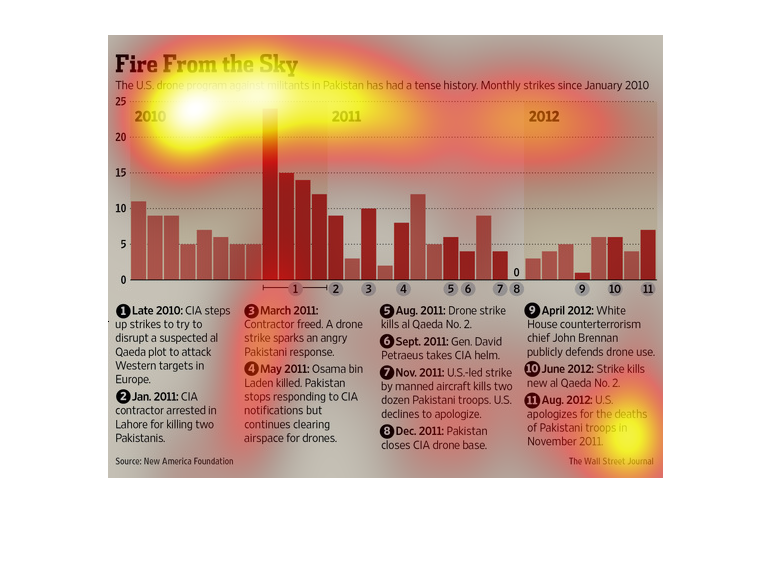
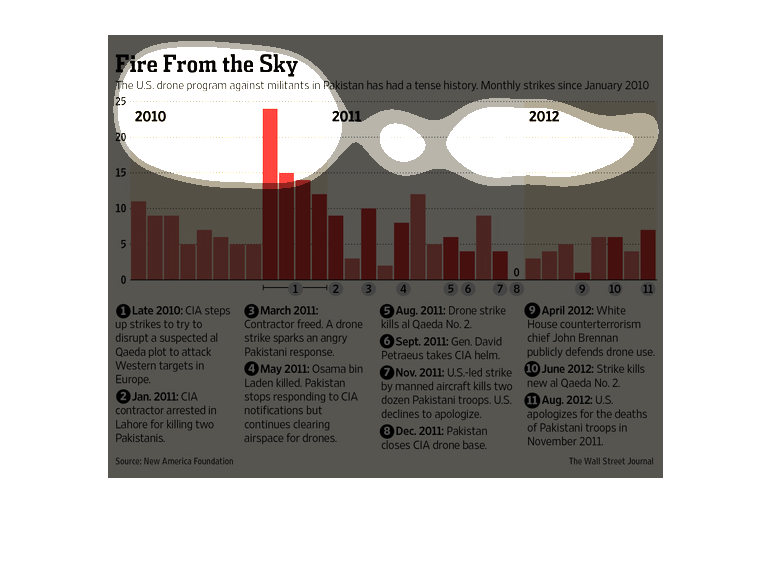
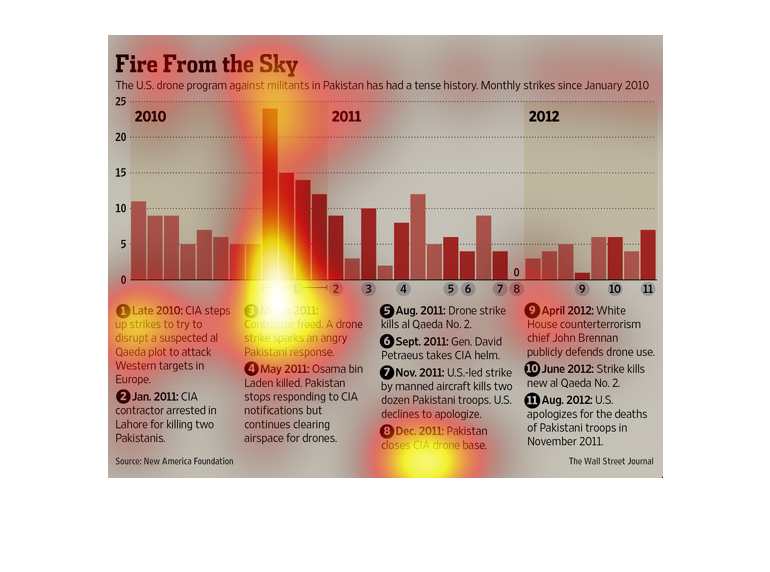
This chart titled "Fire From The Sky"  shows the number of monthly strikes from 2010-2012
against militants in Pakistan by the  U.S Drone program.  The program has had an intense history.
This is about US drone strikes in Pakistan since 2010. The biggest peak was in late 2010 by
the CIA and the smallest was Dec. of 2011, when Pakistan closes the CIA branch in their area.
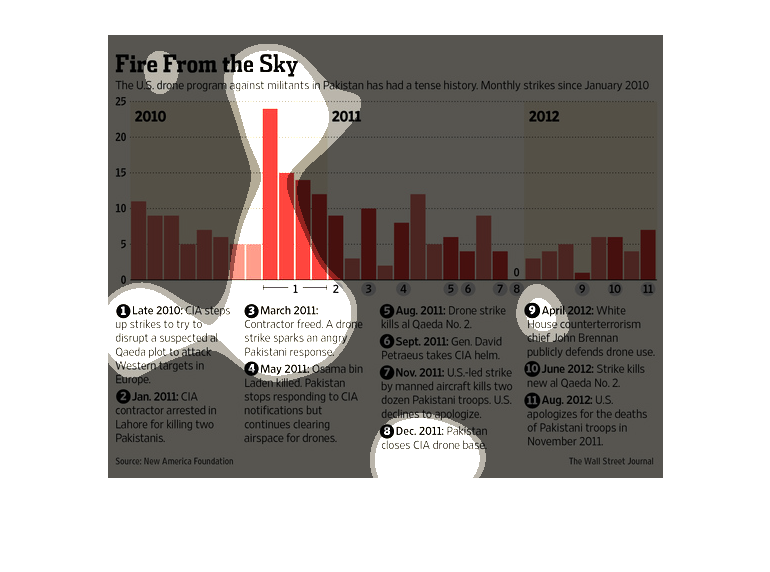
The chart is showing the monthly strikes from the U.S. drone program on the Pakistan militants
since January 2010. In 2010 they had the highest drone strikes.
This is a graph that is showing the performance of the United States drone program against
militants based in Pakistan. It shows that this program has had a tense history since January
2010.