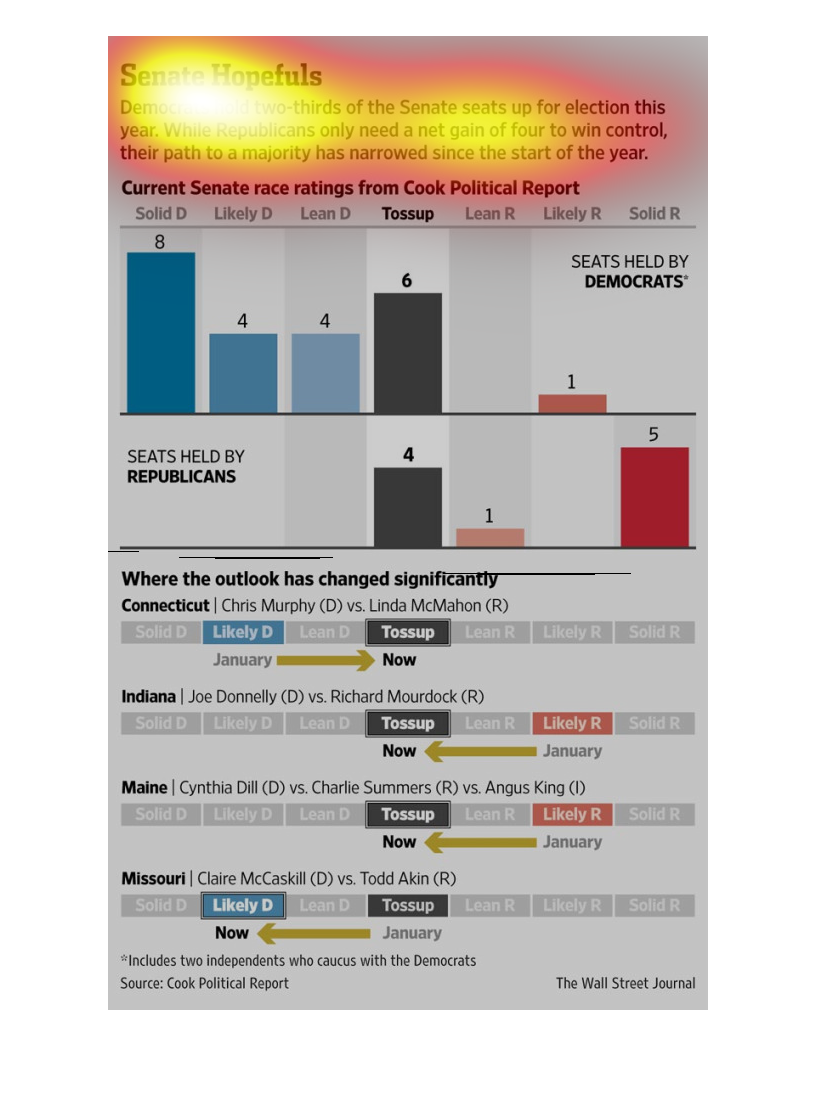
As this graph points out in a Wall Street Journal study, the Democrats are on the losing end
of things as congress is only for seats shy of being controlled by the Republicans.
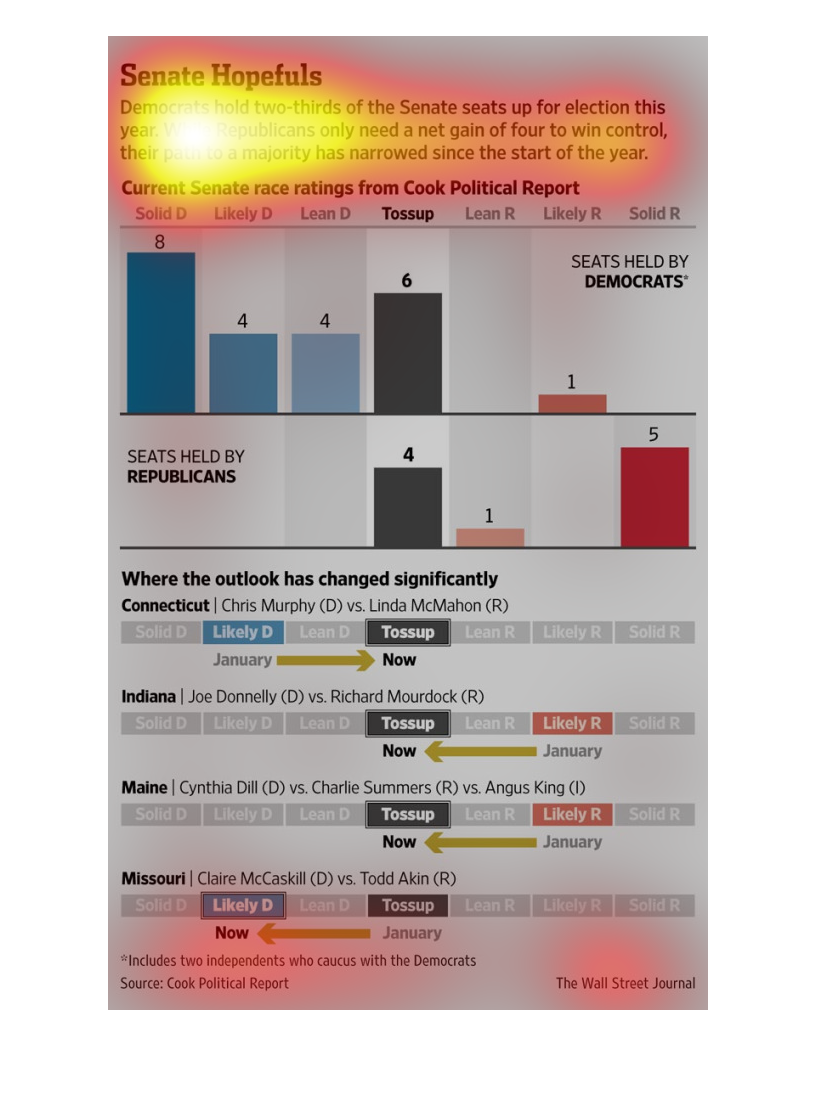
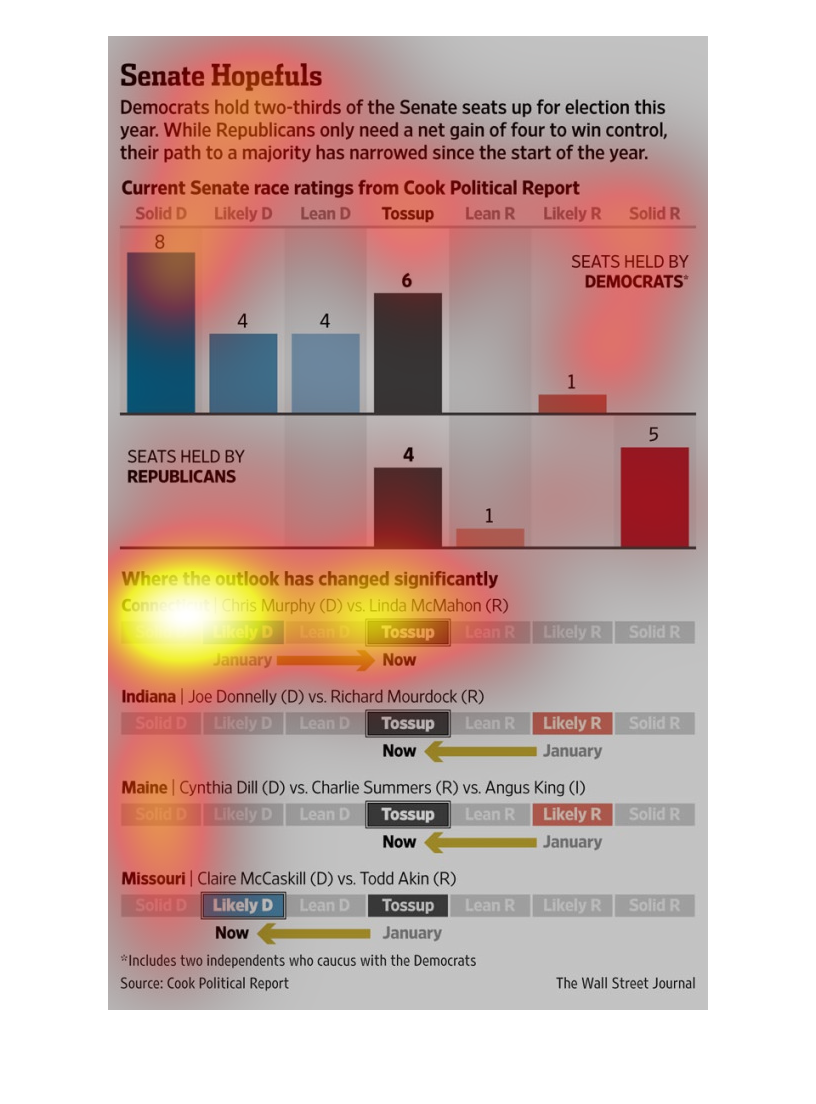
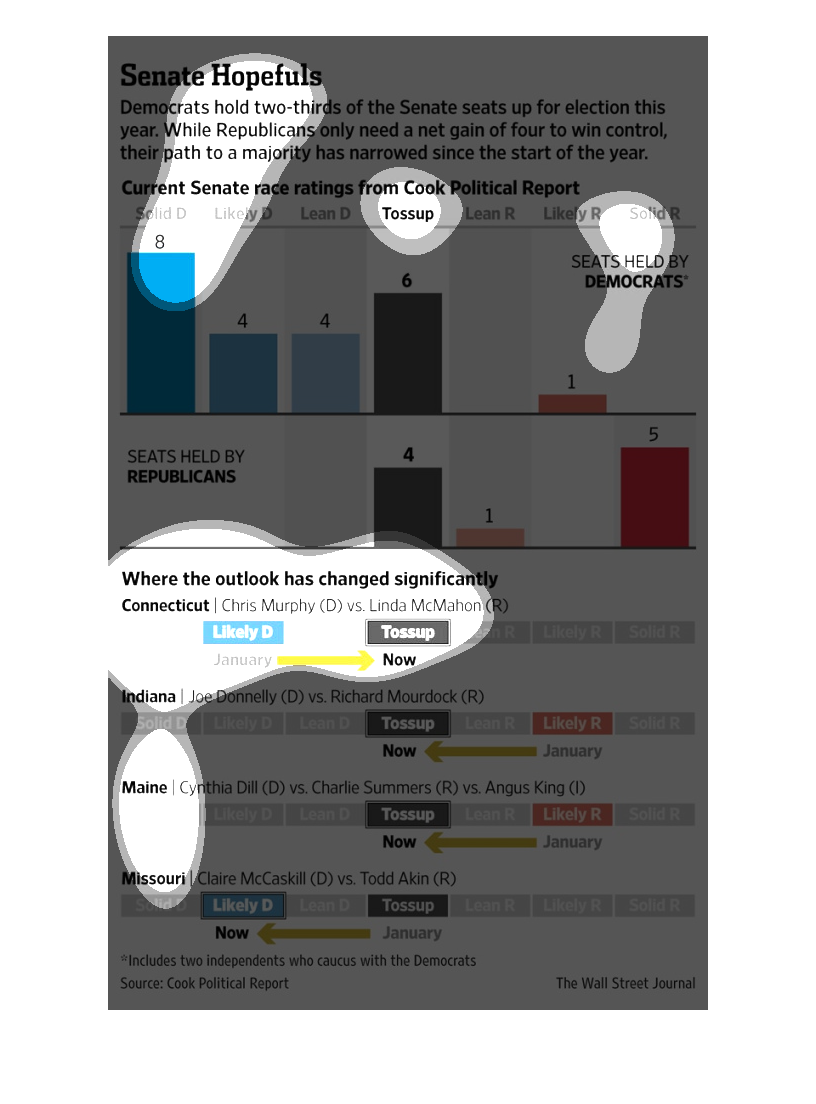
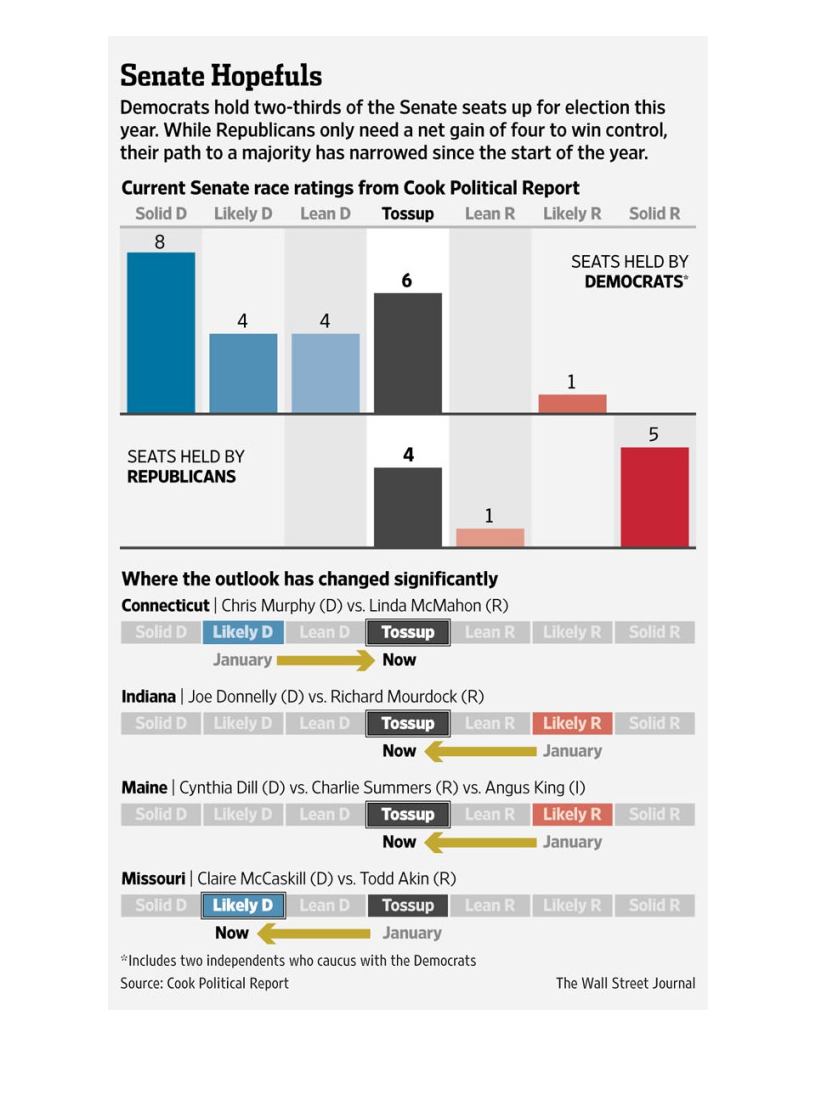
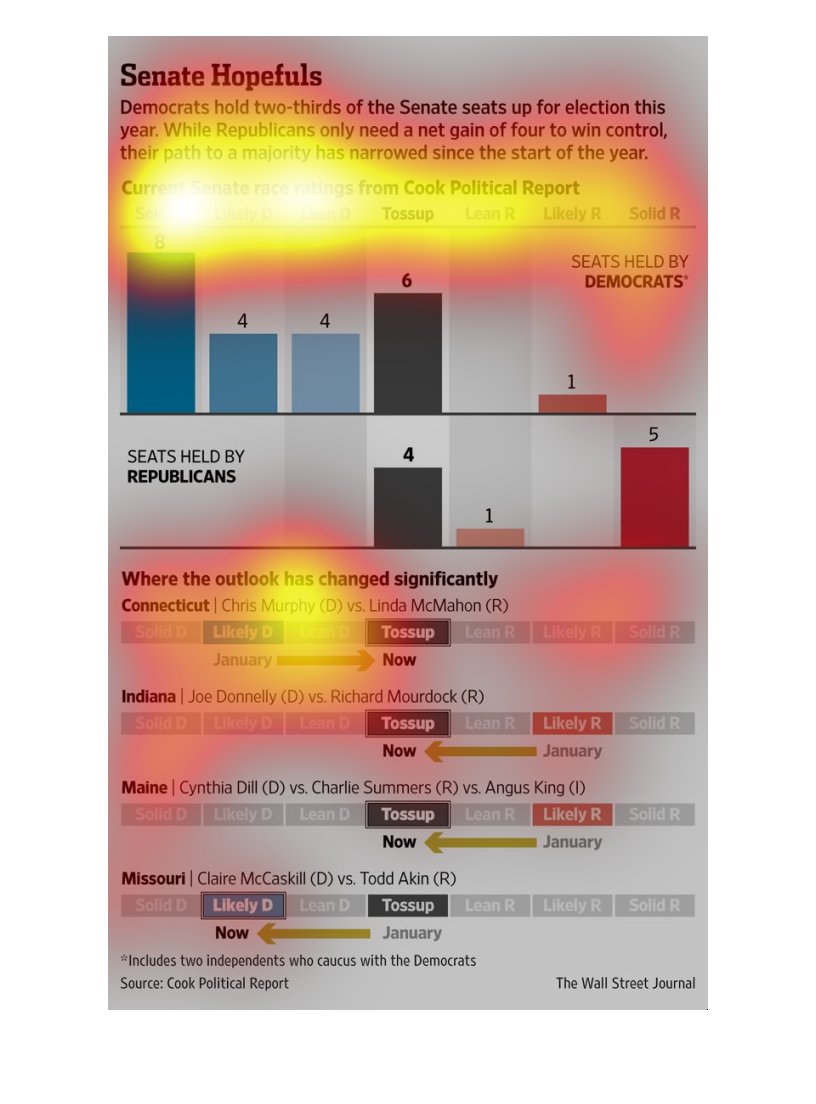
The chart compares the current ratings of the senate race for the republicans and democrates,
and states where the outlook of voters has changed since January
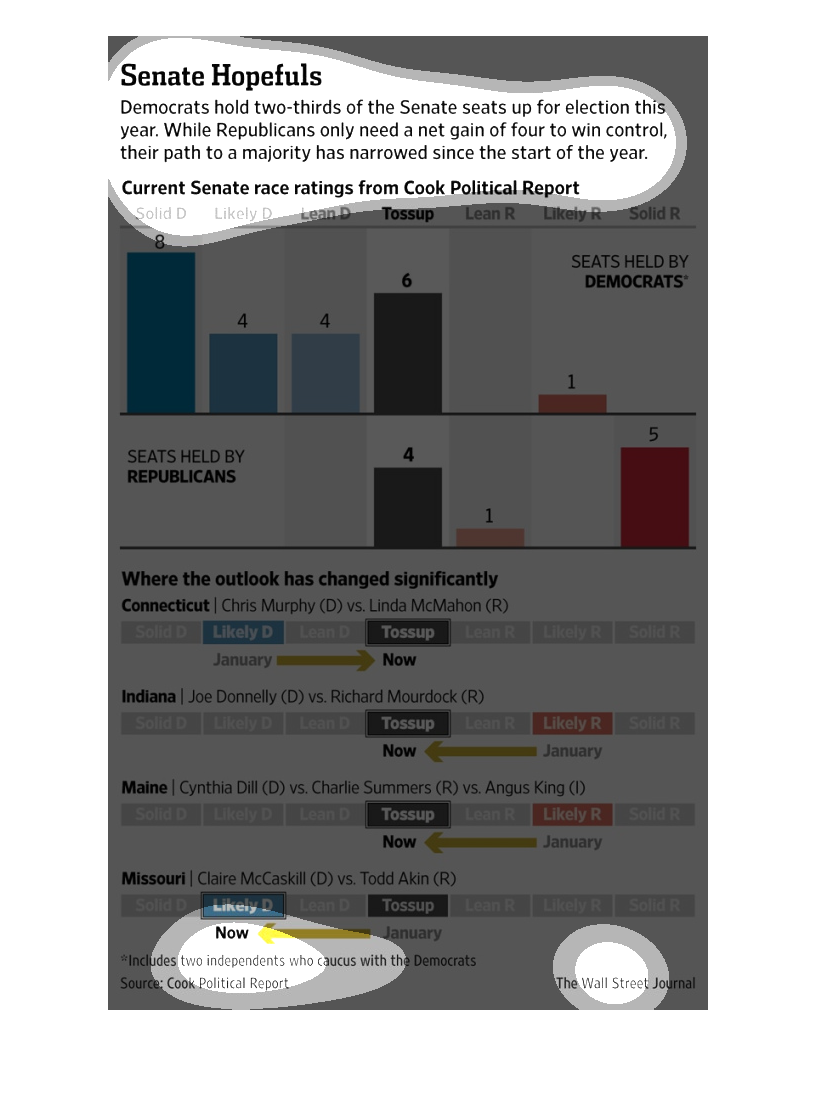
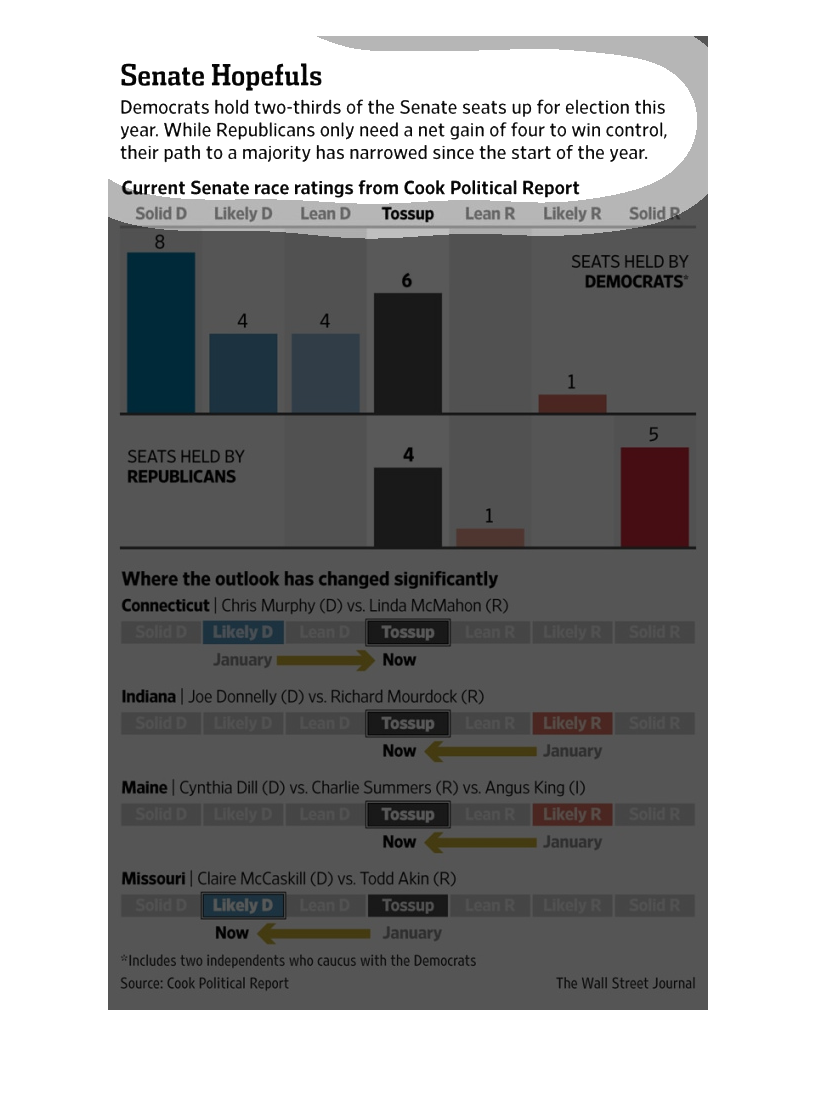
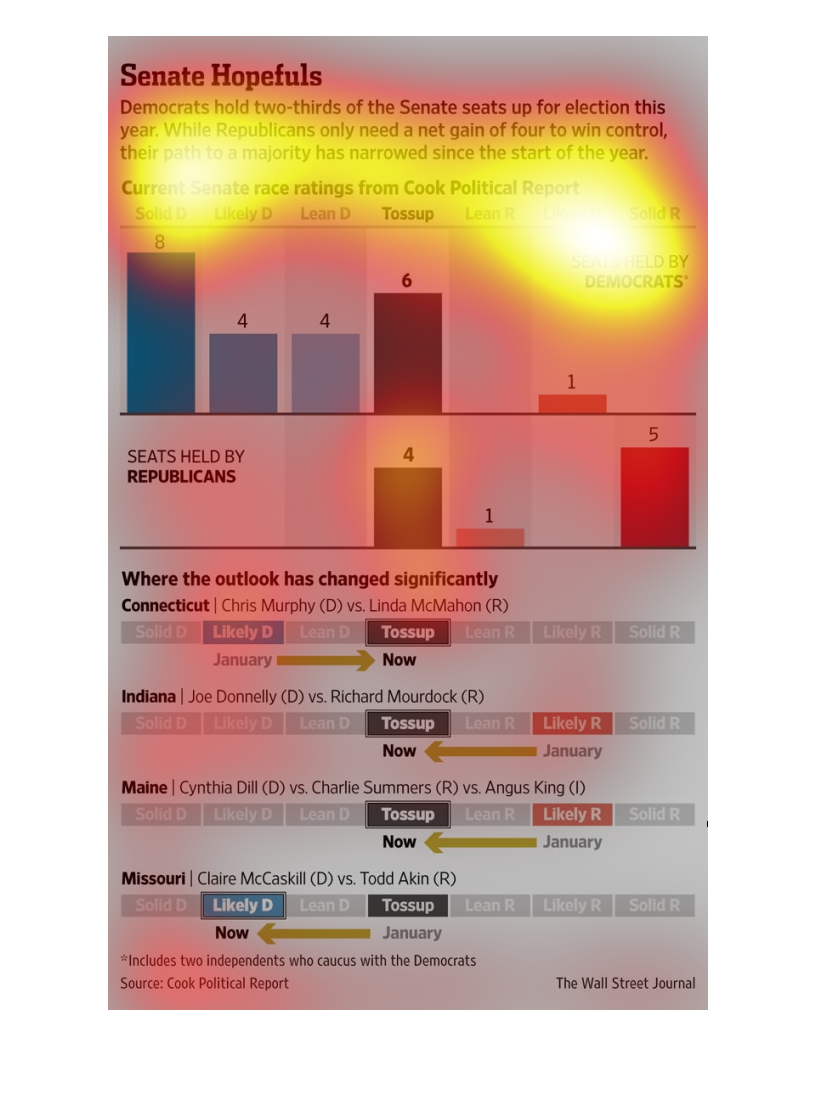
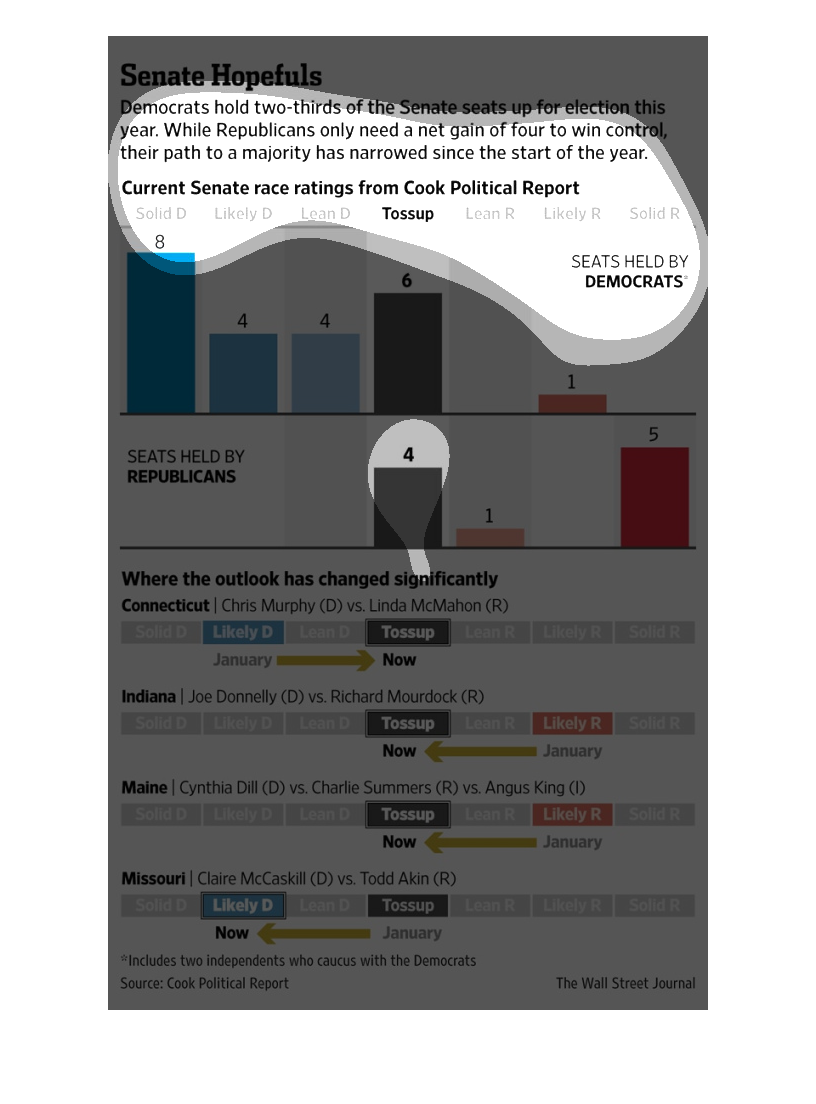
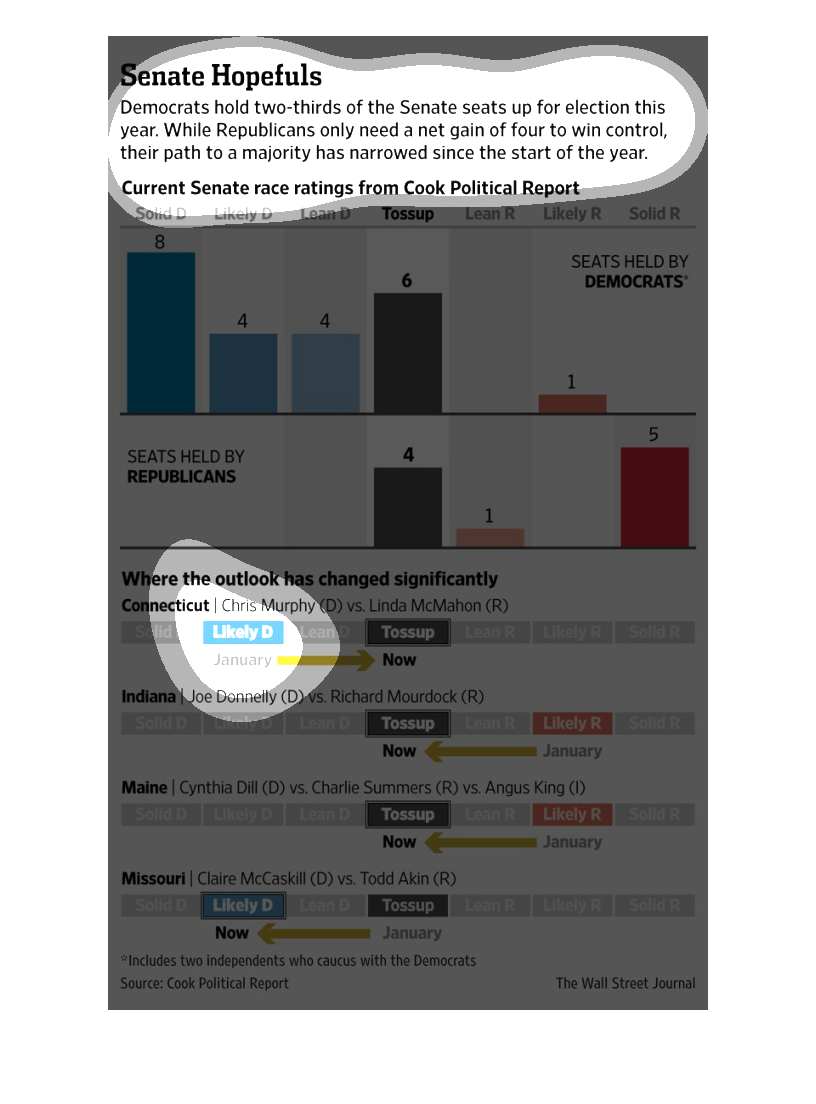
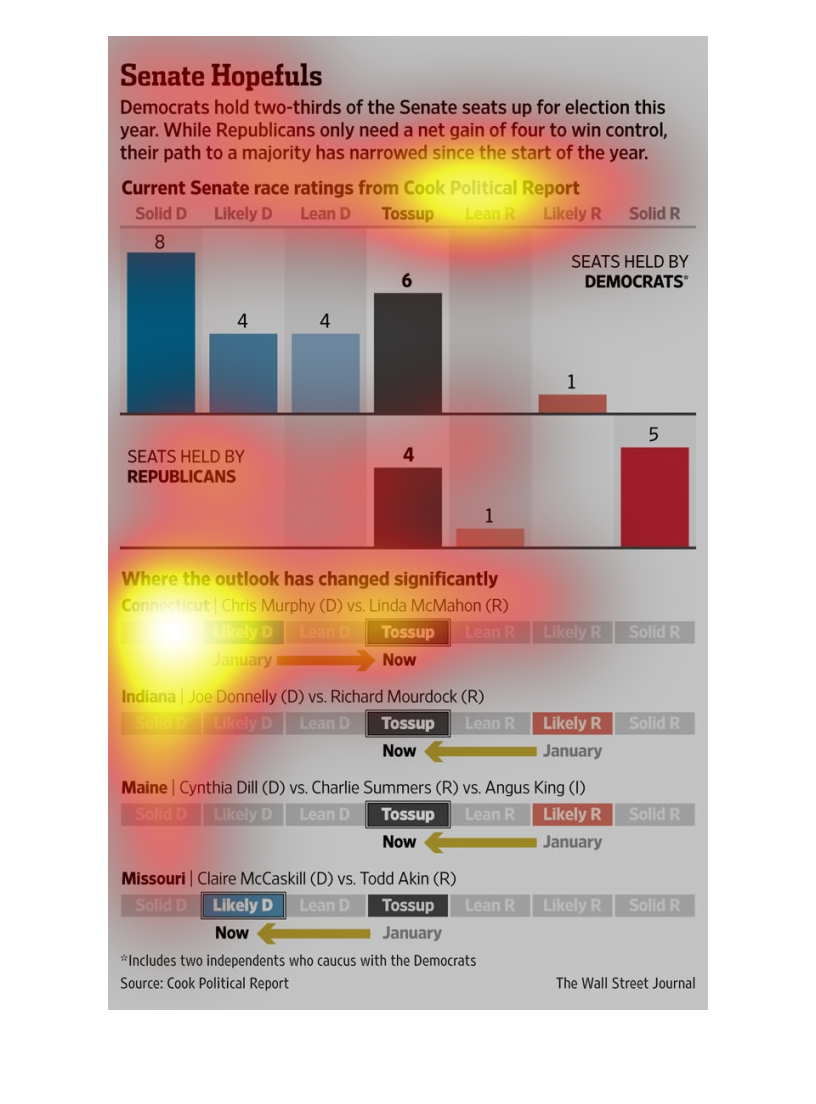
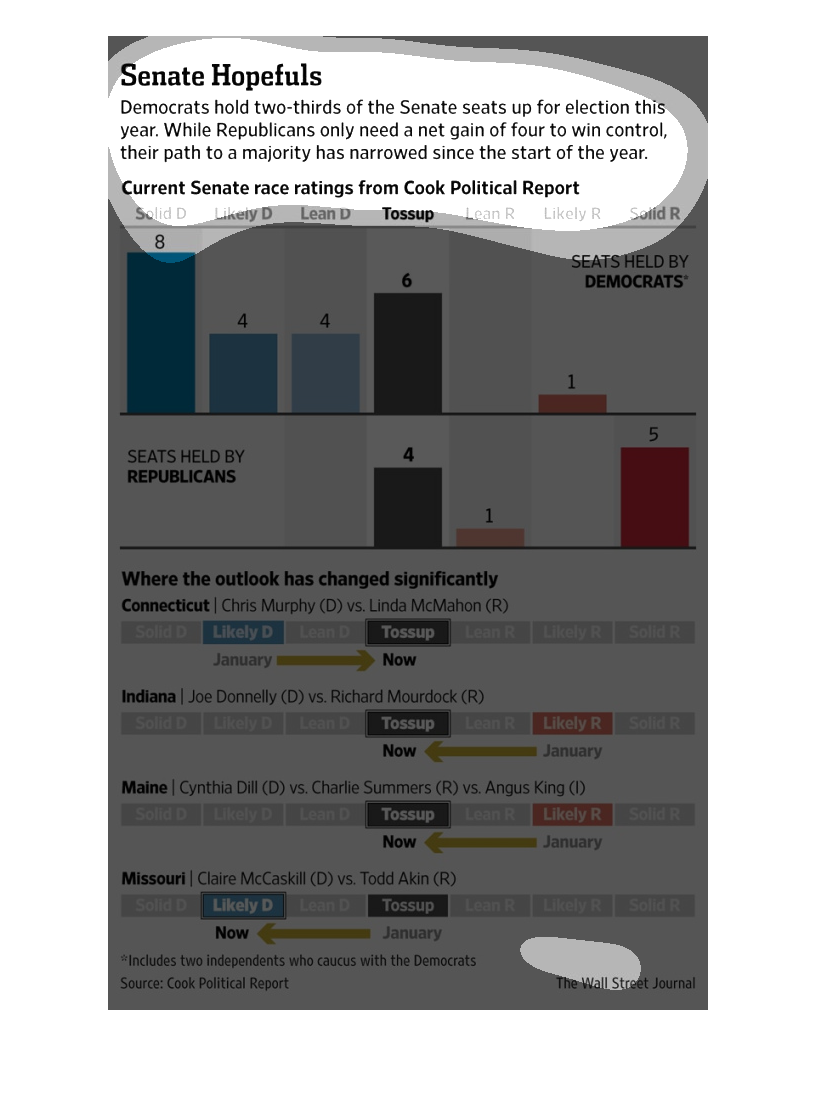
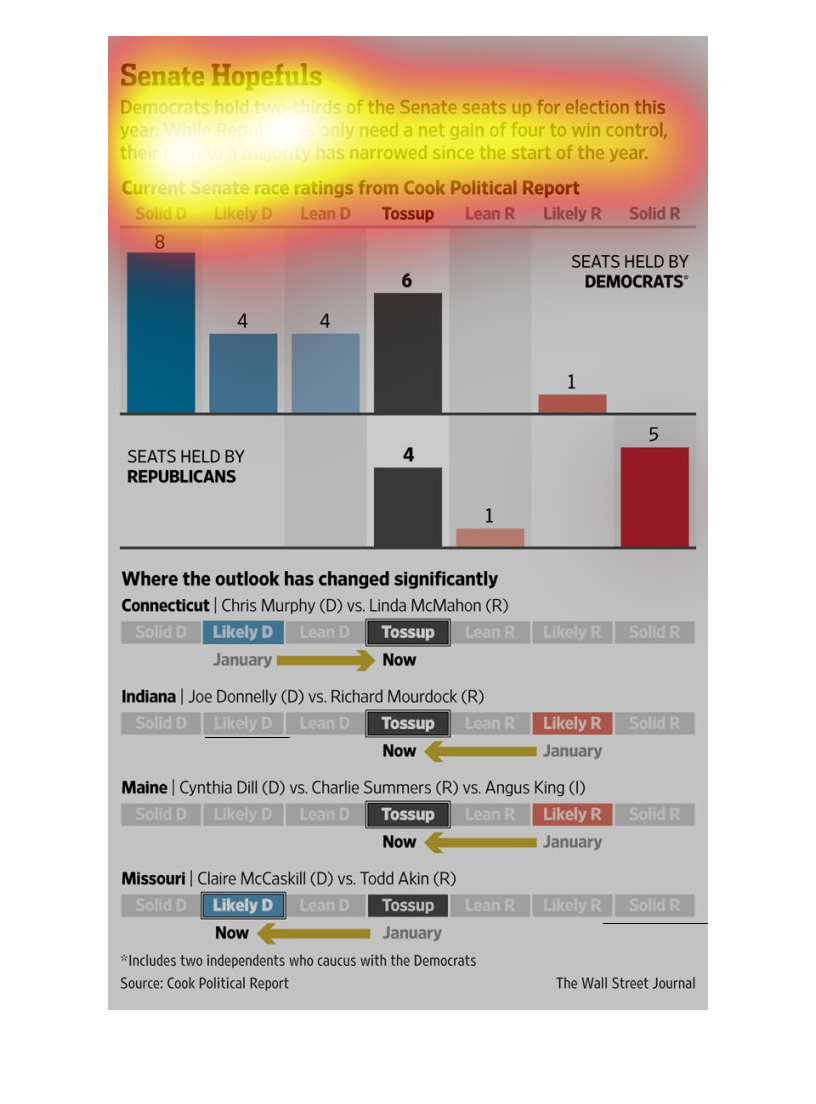
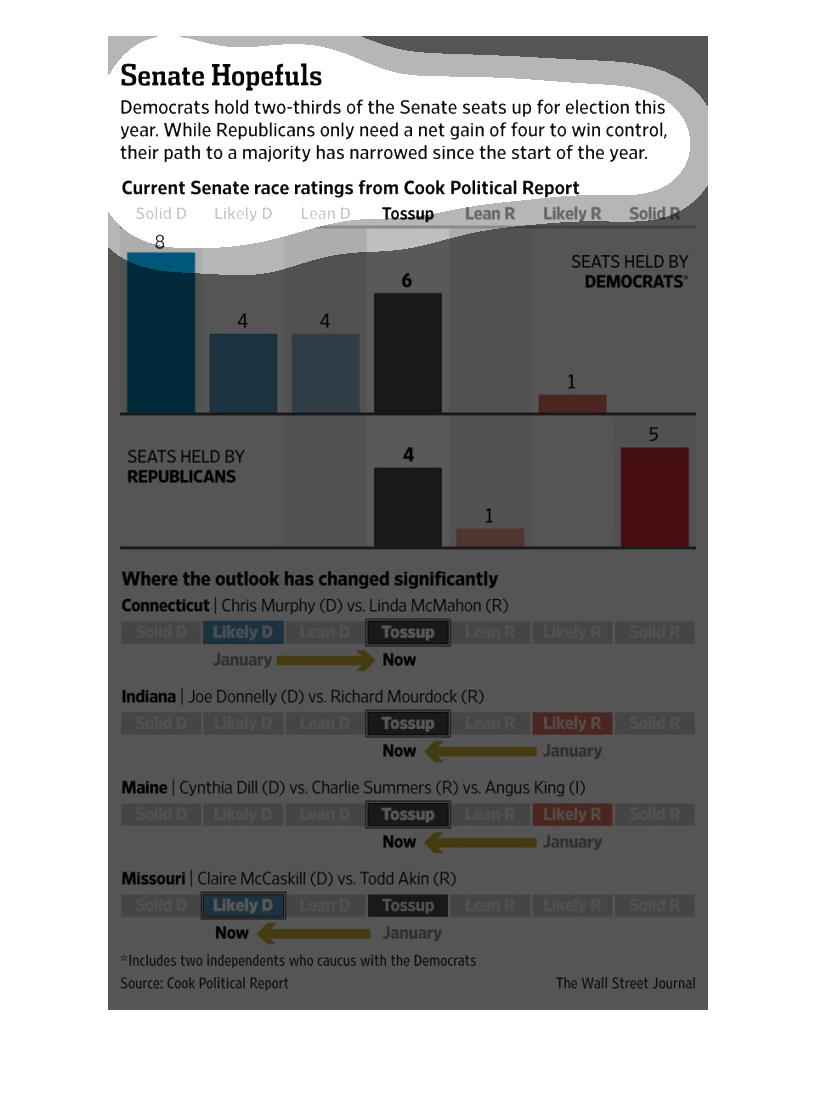
This chart describes Senate hopefuls. Specifically, democrats hold two thirds of the senate
seats up for election this year. While republicans only need a net gain of  four to win control.
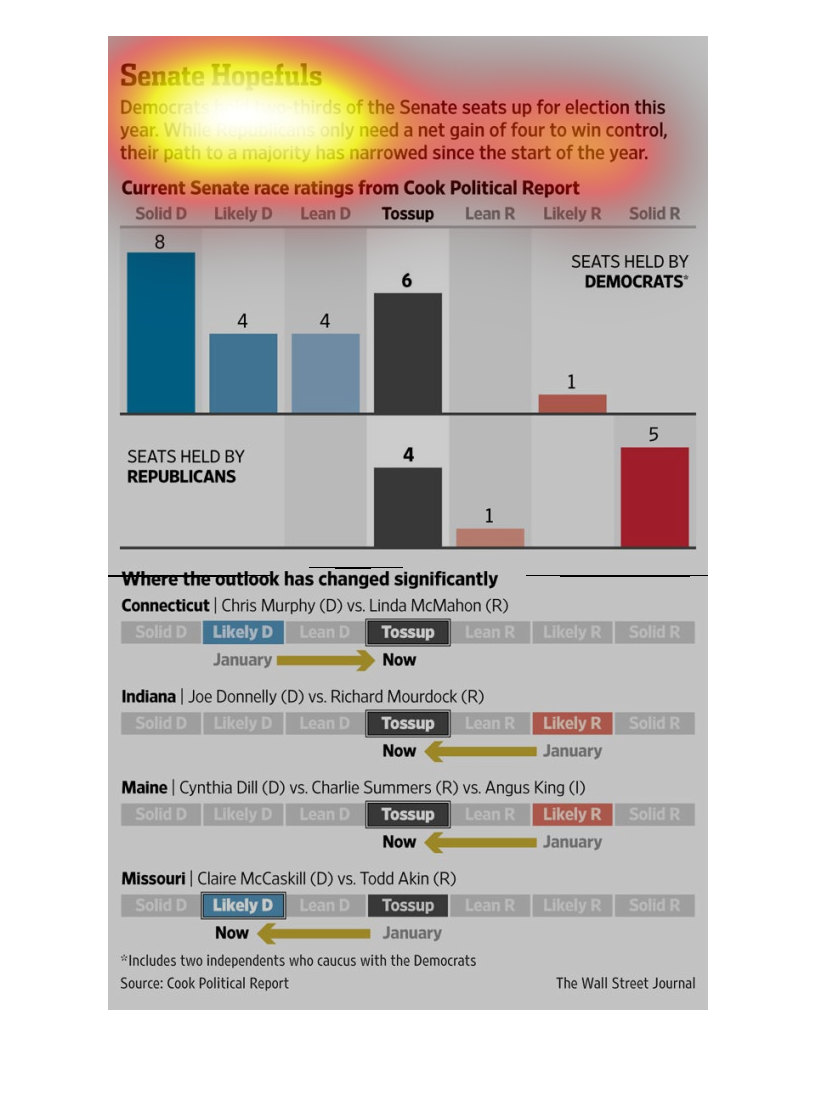
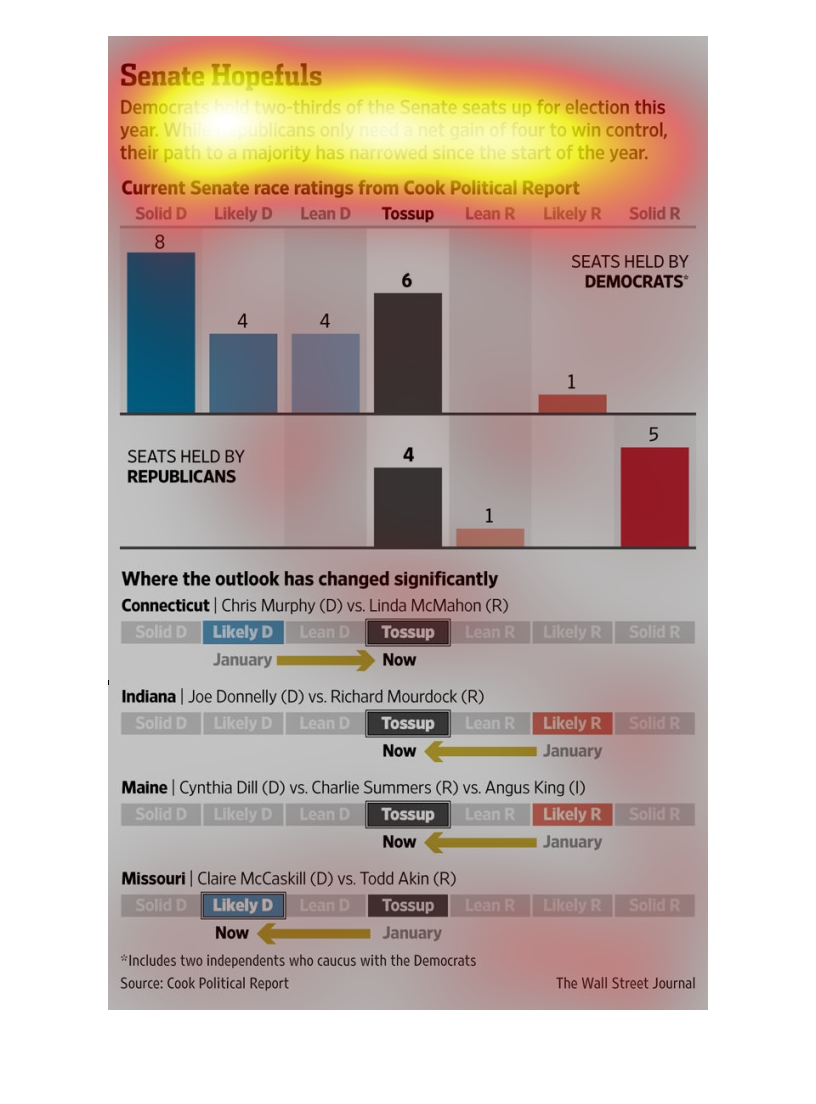
This chart shows how likely it is that the Republicans will gain a senate majority in the
upcoming election based on voter preferences. Many more voters lean Democrat than Republican.
Several states where voters were likely to vote Republican are now toss ups.
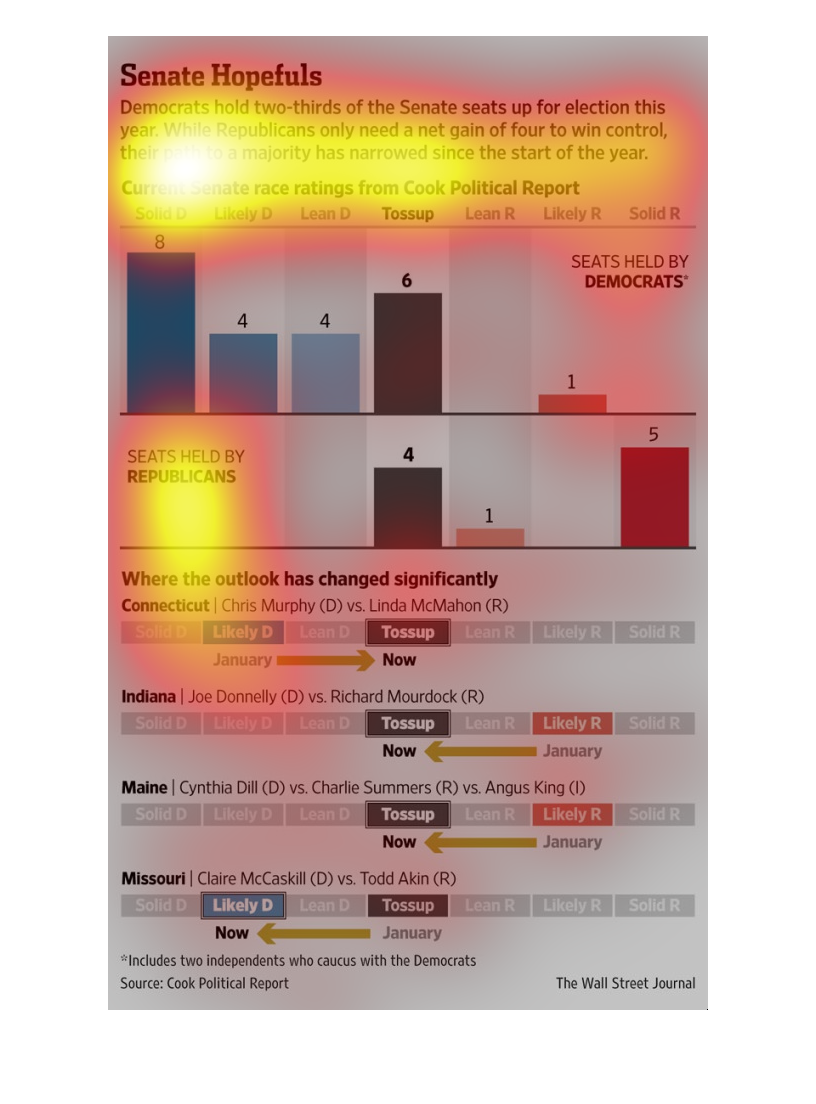
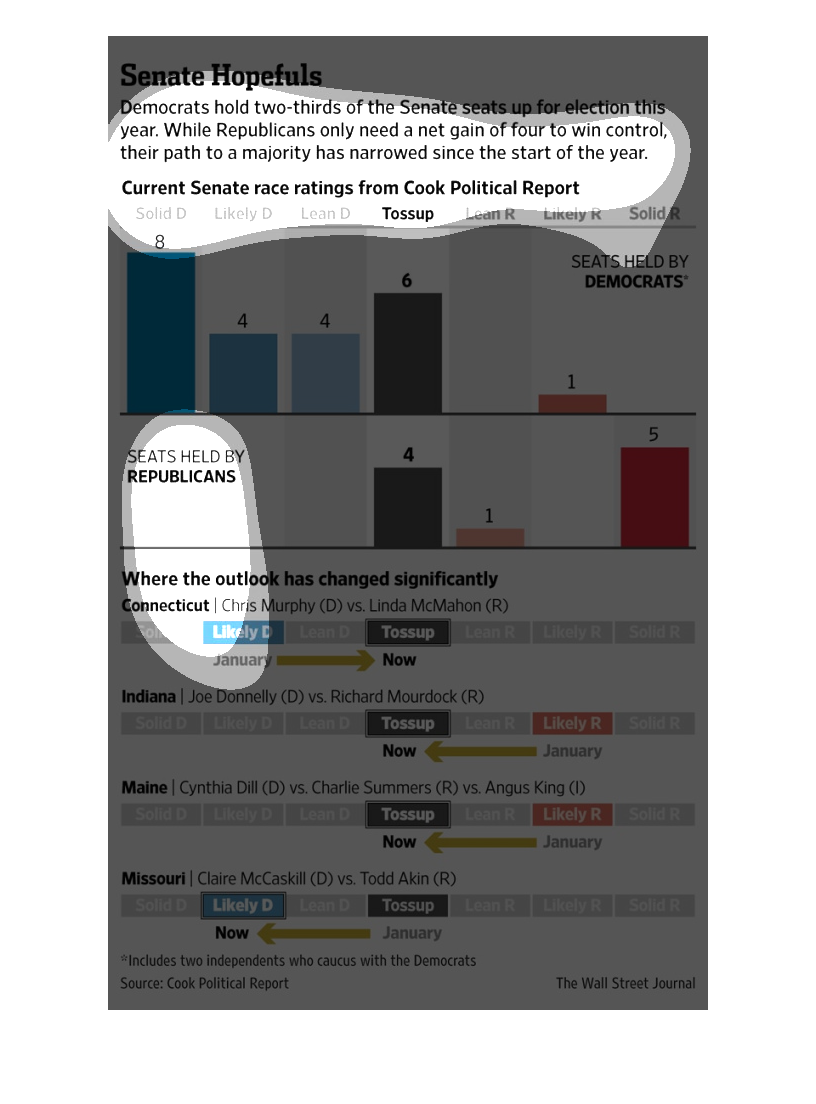
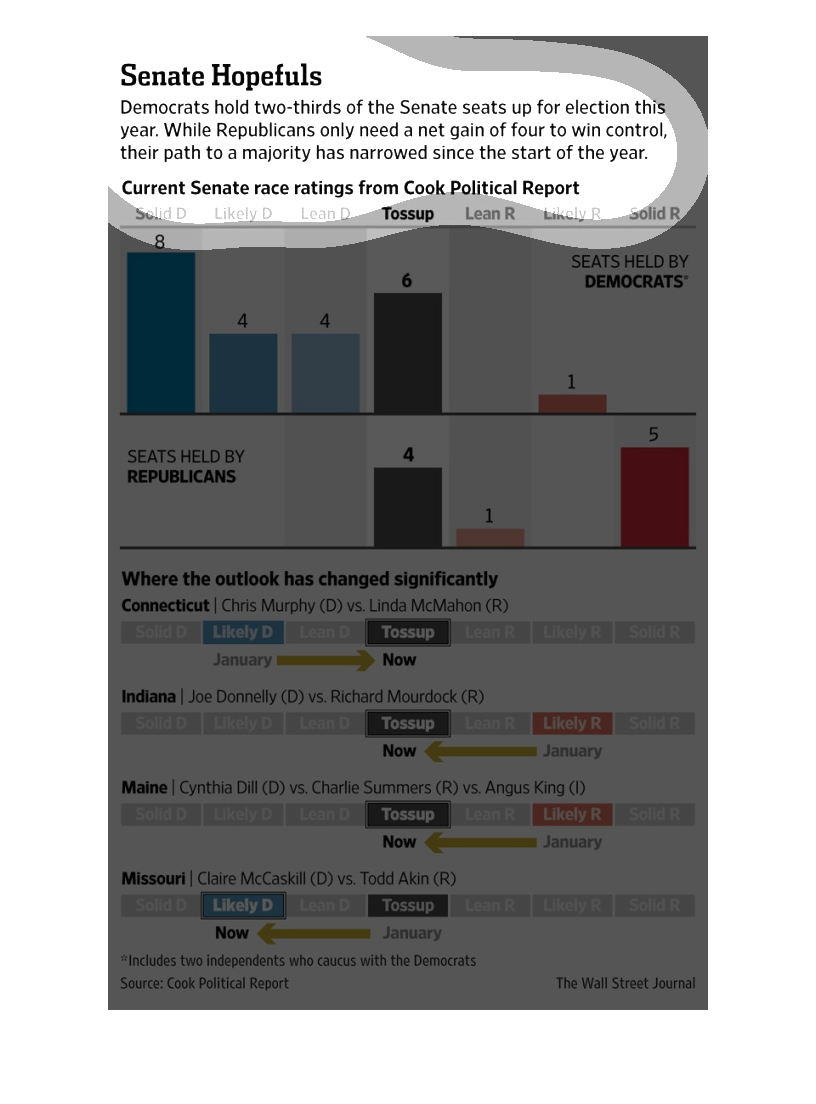
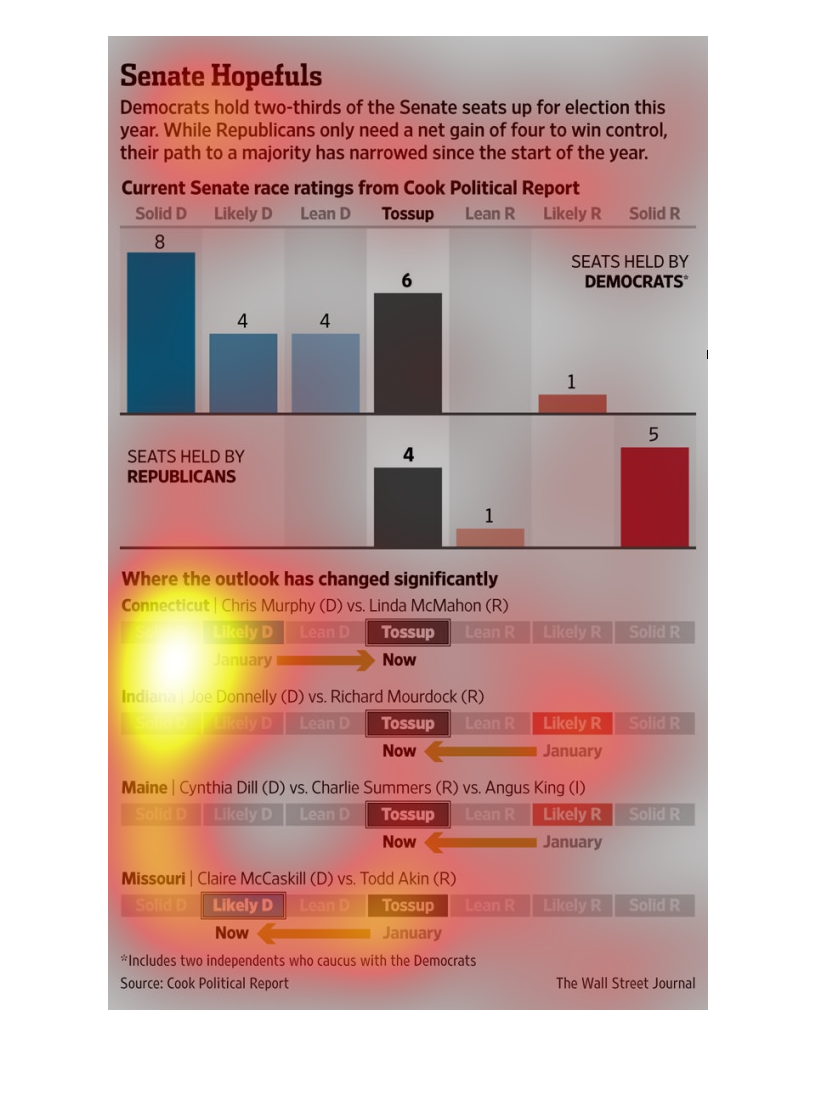
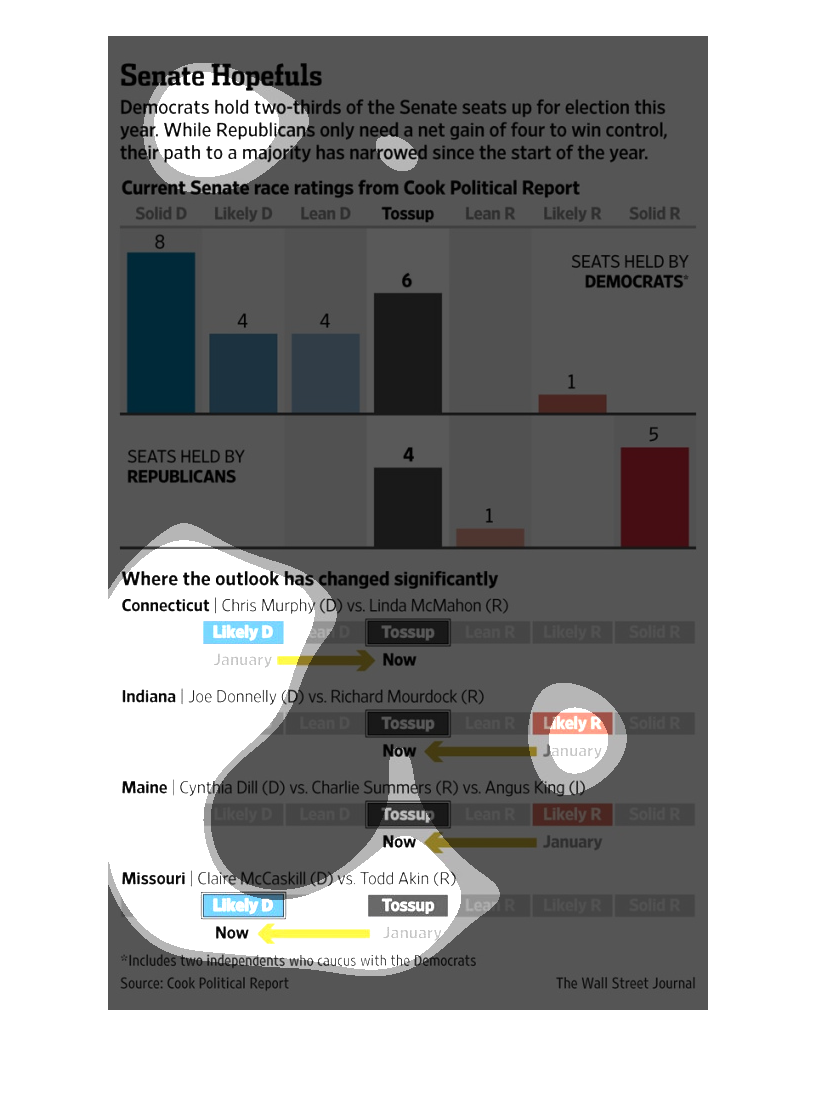
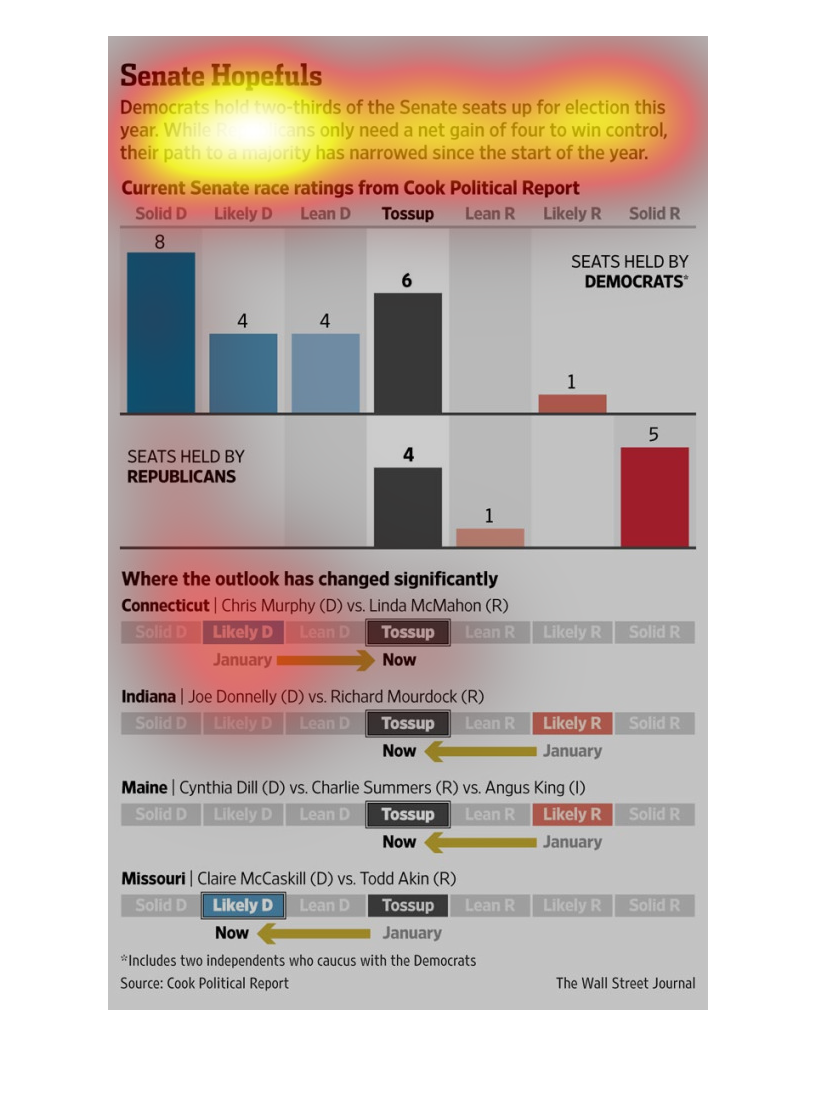
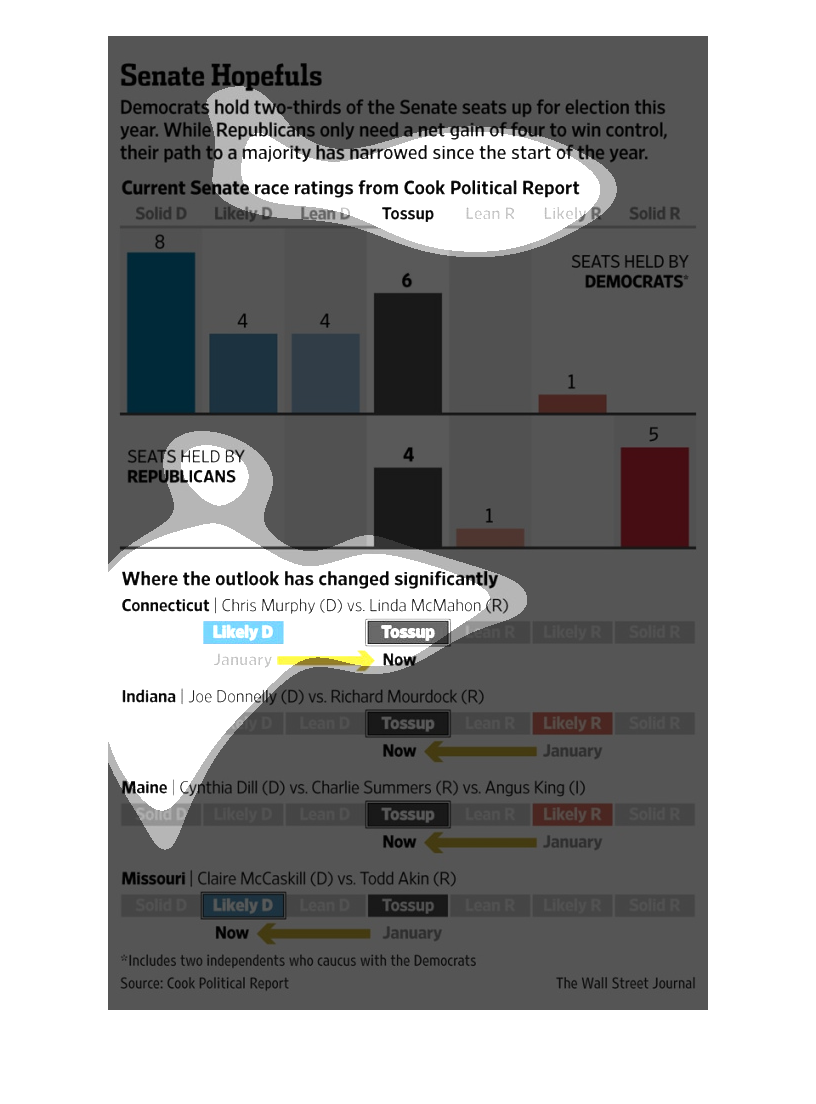
This is a chart about The senate and how republicans only needed 4 seats to gain control.
Democrats had 8 solid seats, 4 likely, and 4 lean, 6 were a tossup, and Republicans 5 solid,
1 lean, and 4 tossup.
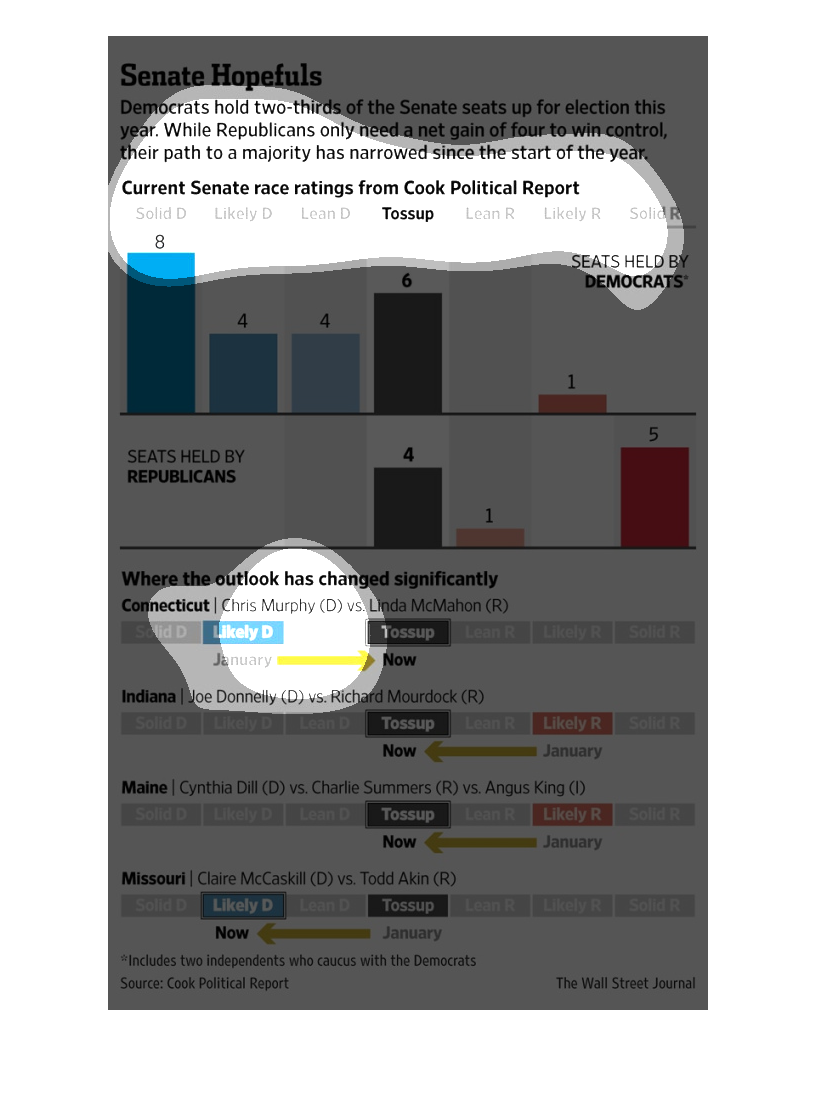
This graph is about which political party holds the majority number for the Senate. Currently,
The Democrats currently hold the majority of the Senate while the Republicans only need a
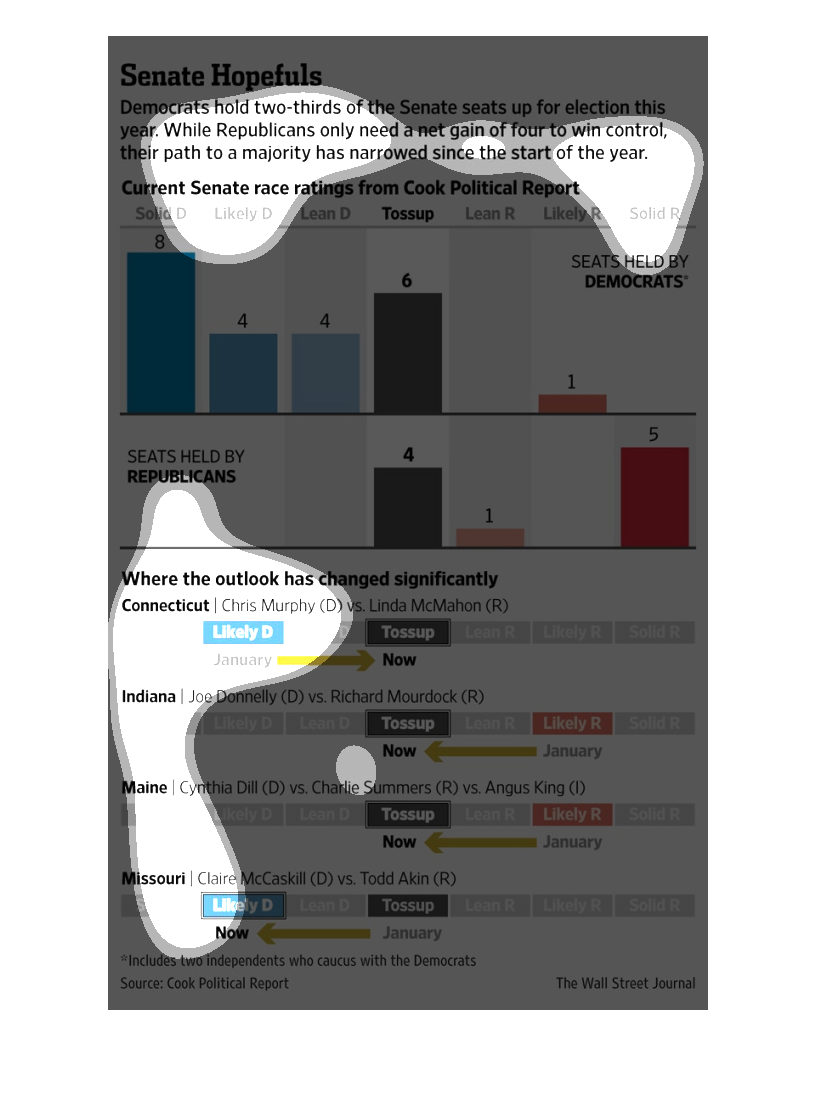
net gain of 4 to take over control. In Connecticut, Indiana, Maine and Missouri, it is a tossup
as to which party will win.
This graph is illustrating the amount of Senate seats between Republicans and Democrats. This
is depict the amount of seats each will have to achieve 2/3 seats
This image shows the political diversity of the senate congress. It also shows different senate
hopefuls for the states of Connecticut, Indiana, Maine as well as Missouri, and how the senate
hopefuls stack up against their opponent.
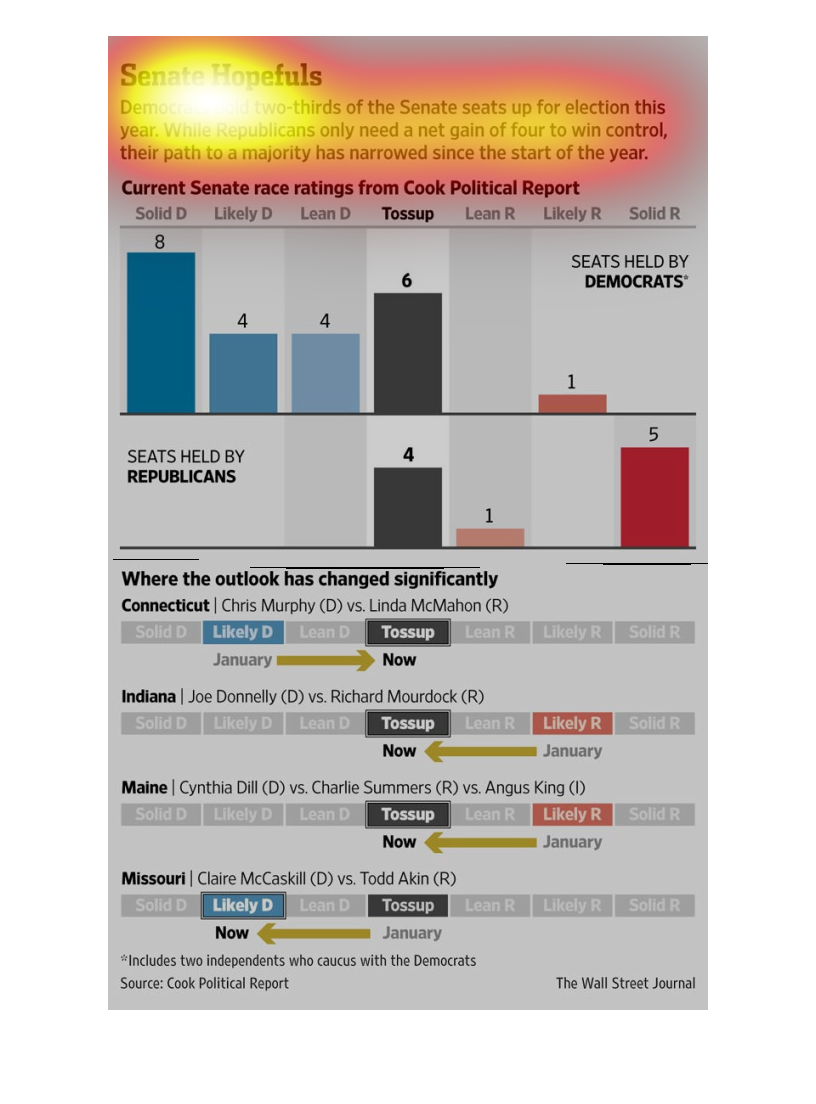
This is a series of charts and graphs with related statistics depicting the paths to control
of the Senate between Democrats and Republicans and related polling data.
This show that Democratic hold two thirds of the Senate seats up for election this year, and
republicans  only need a net gain of four seats to regain control.
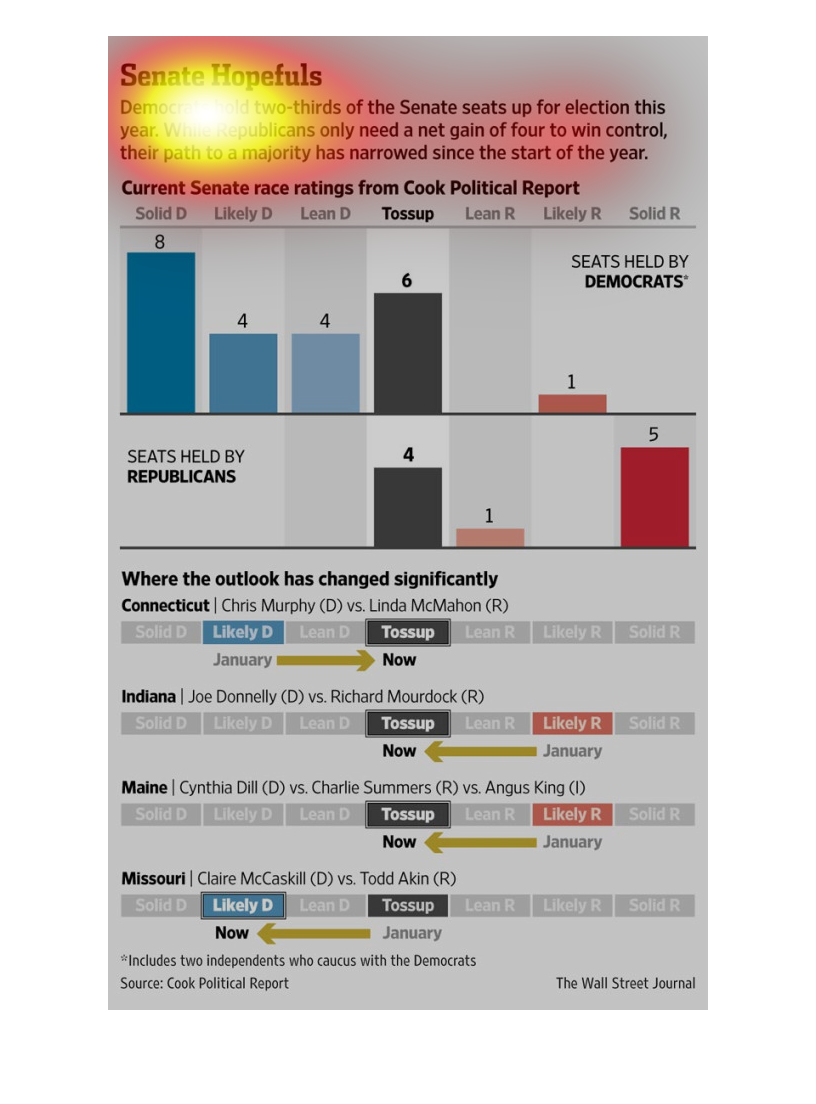
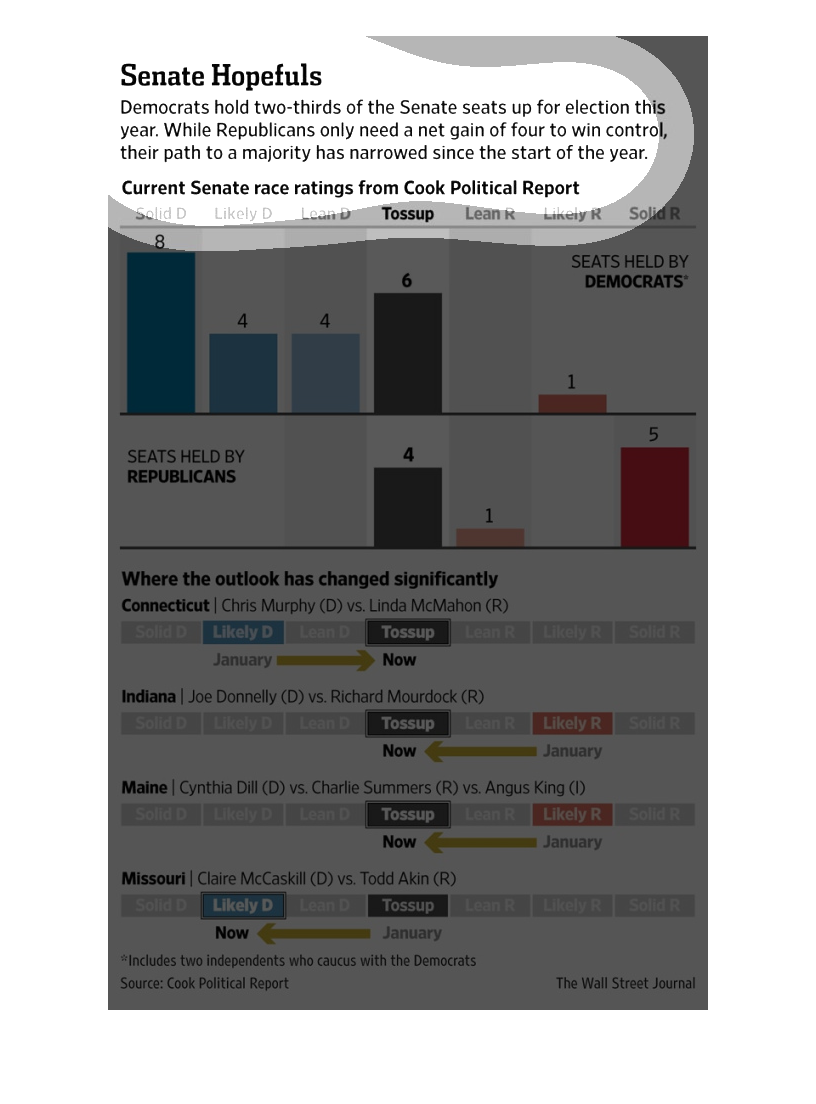
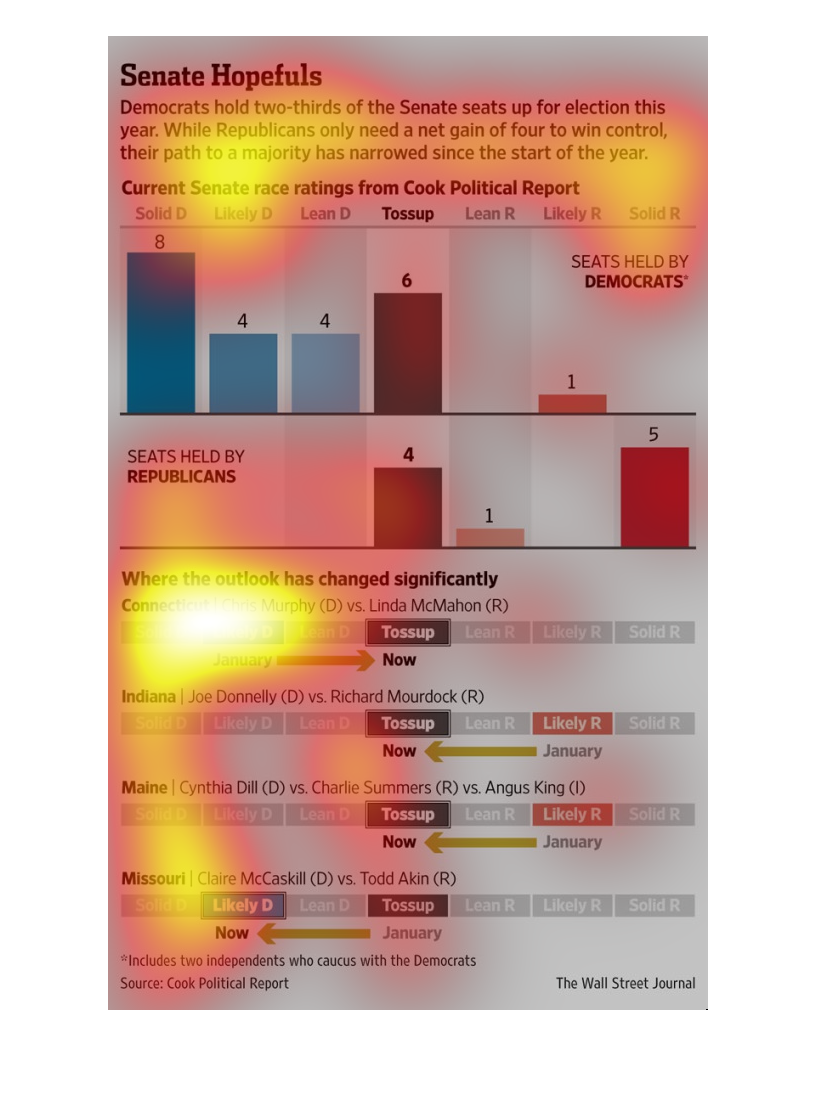
This graph illustrates Senate hopefuls with current Senate race ratings according to the Cook
political report and where the outlook has changed significantly in several illustrated states.
This chart describes senate hopefuls. Specifically, democrats hold two-thirds of the senate
seats up for election this year. While republican only need a net gain of four.
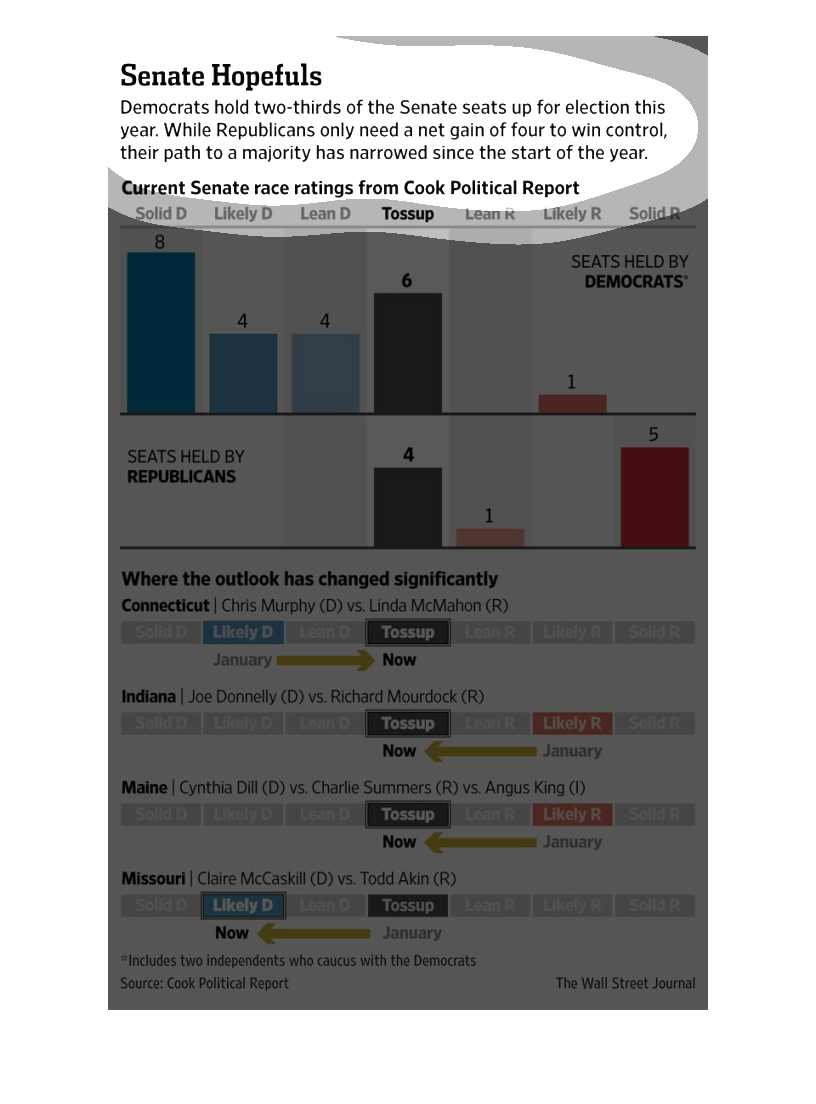
The following chart shows the number of senate hopefuls. Shows that democrats hold a 2 thirds
of the Senate seats that are up for reelection and gives the candidates political group that
they belong to.
This chart titled "Senate Hopefuls"  shows that the democrats hold two thirds of the senate
seats up for election while the rebublicans only need a net gain of four to win control.
This graph shows the seats held by democrats, republicans and the middle ground for predicting
senate seats in various states.  It shows the significant changes from one party to the other
in Connecticut, Indiana, Maine, and Missouri.