The fiscal ramifications of of the recession have been very severe. In this graph as shown
from 2007 to 2012 it shows that businesses have been taken aback because of the situation
and are more cautious.
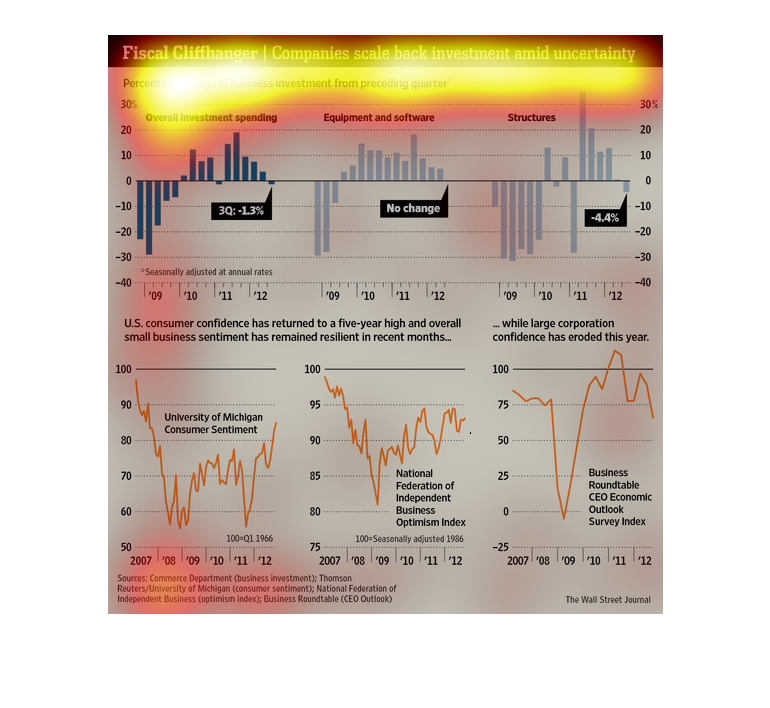
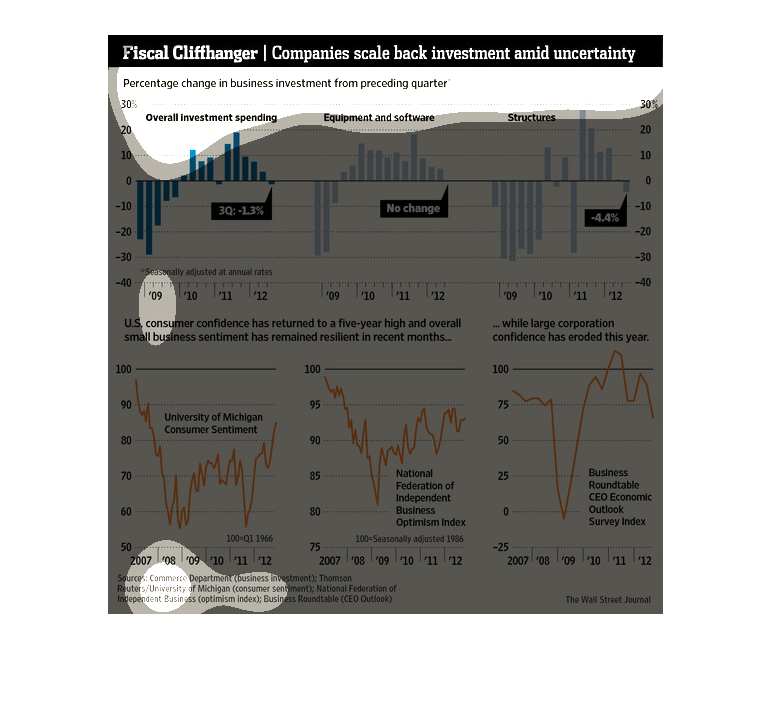
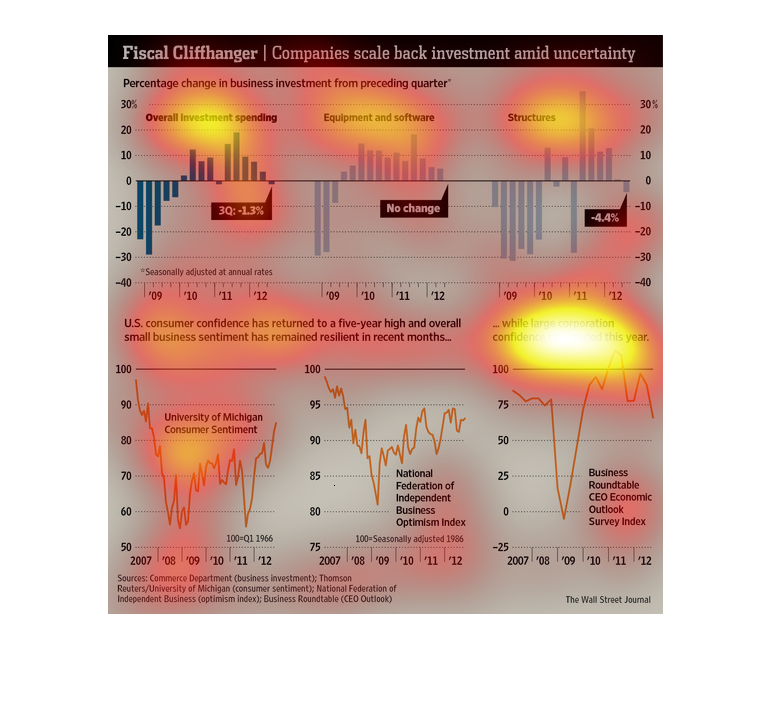
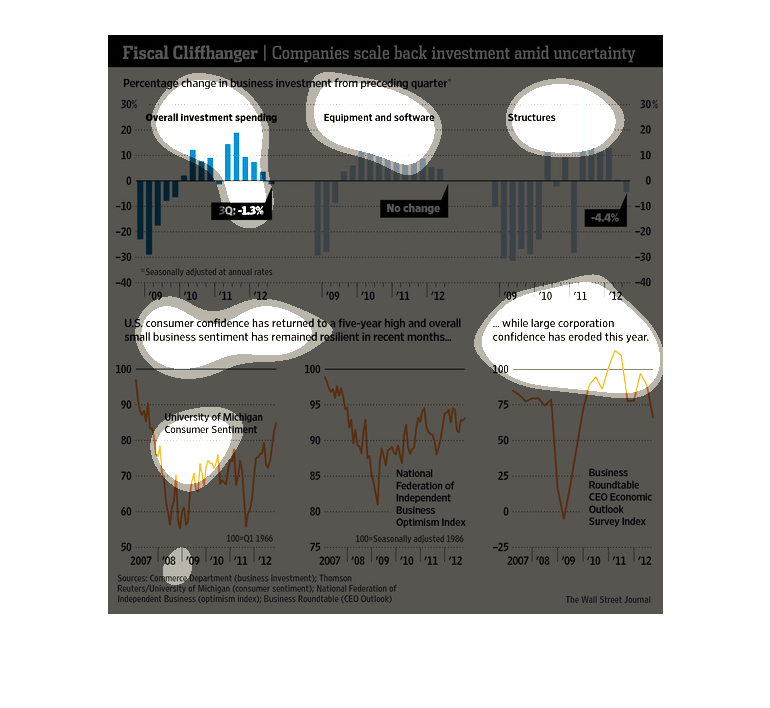
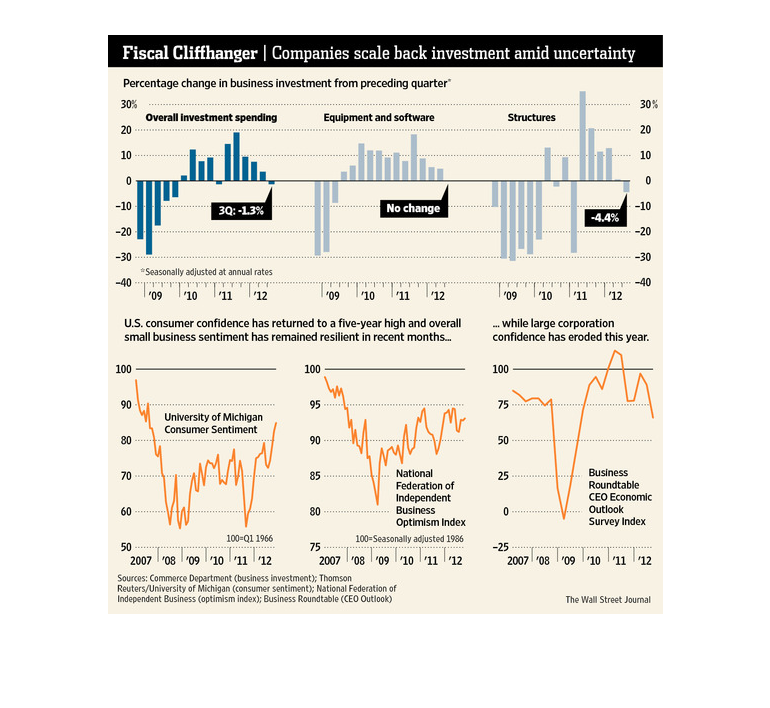
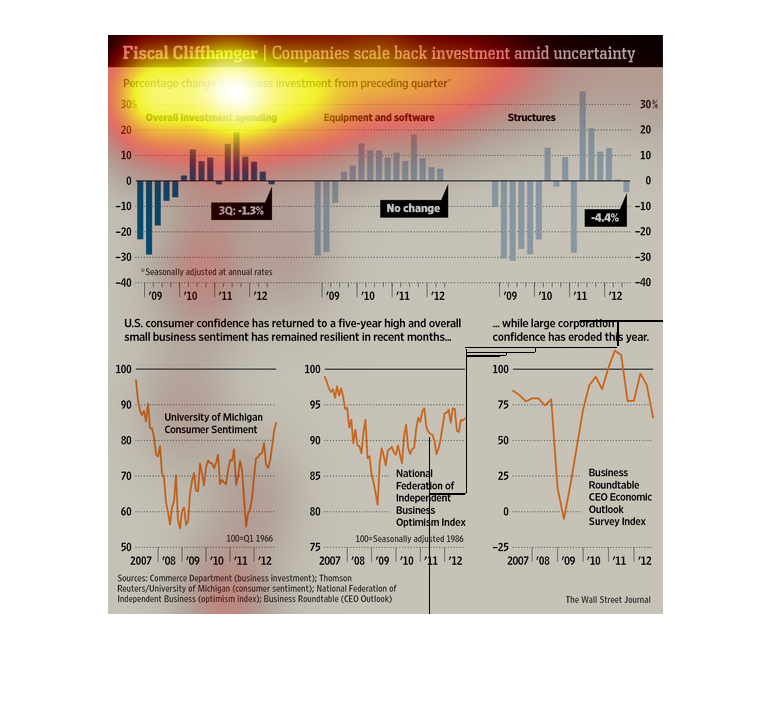
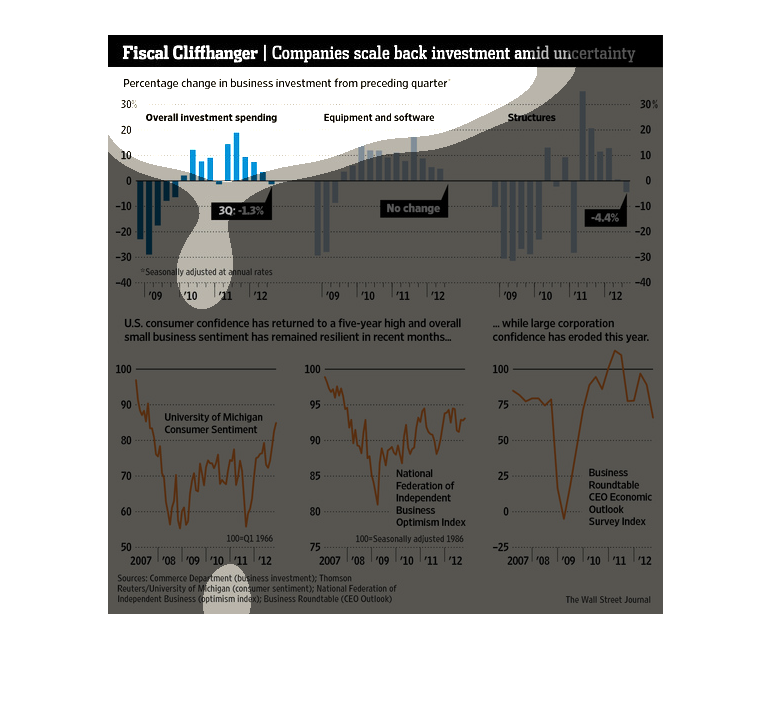
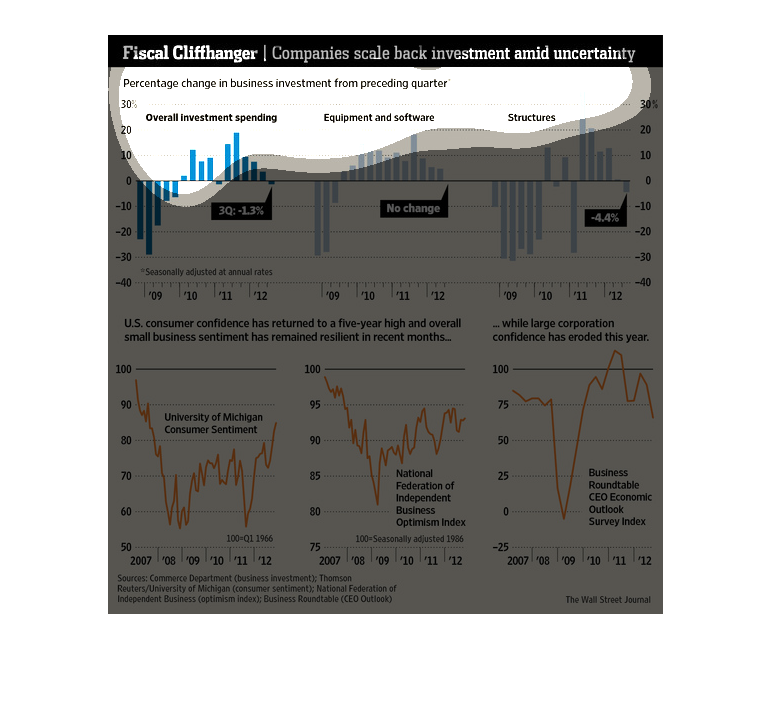
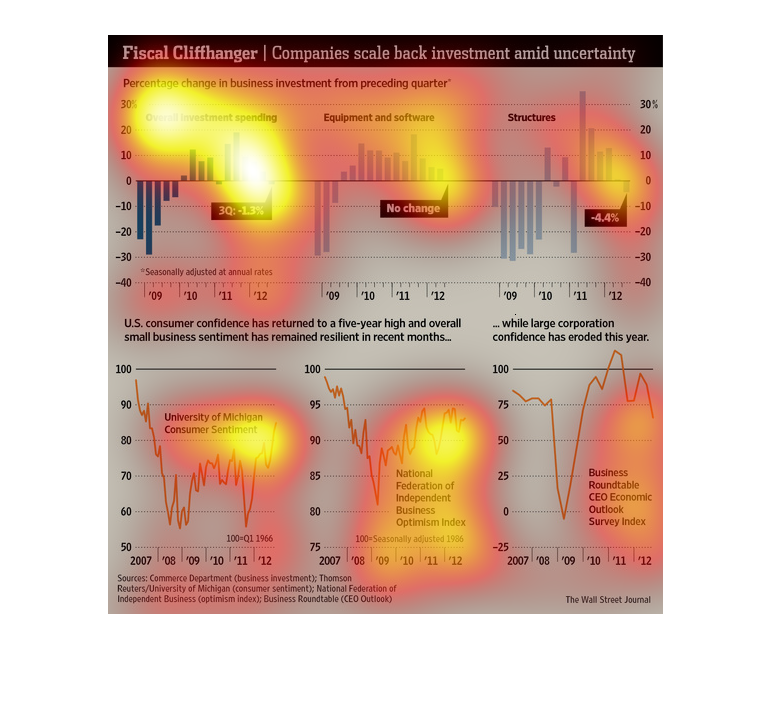
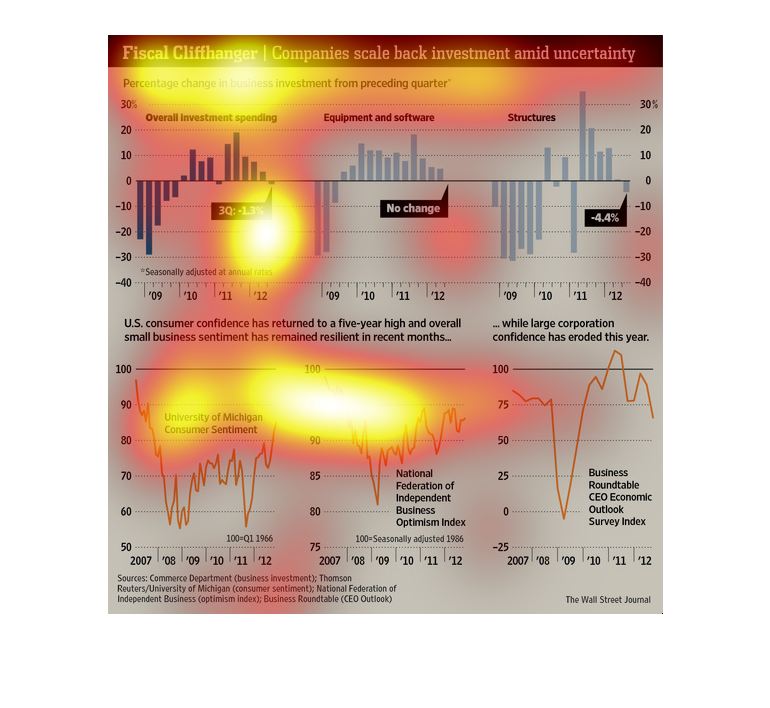
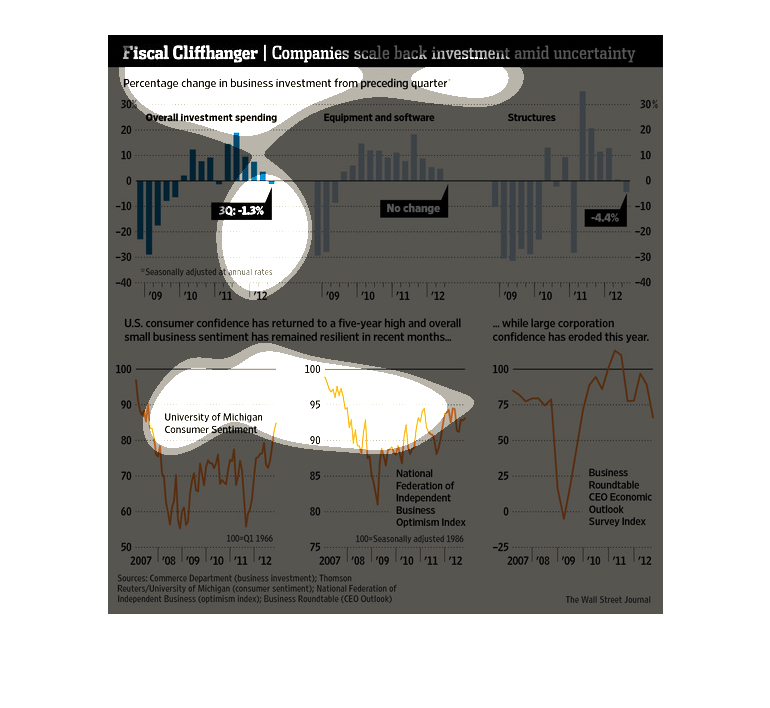
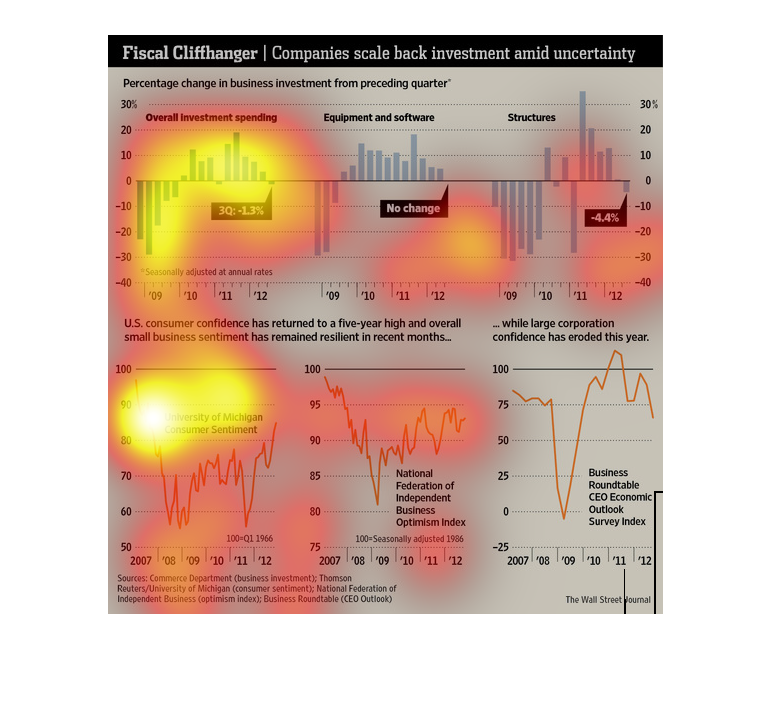
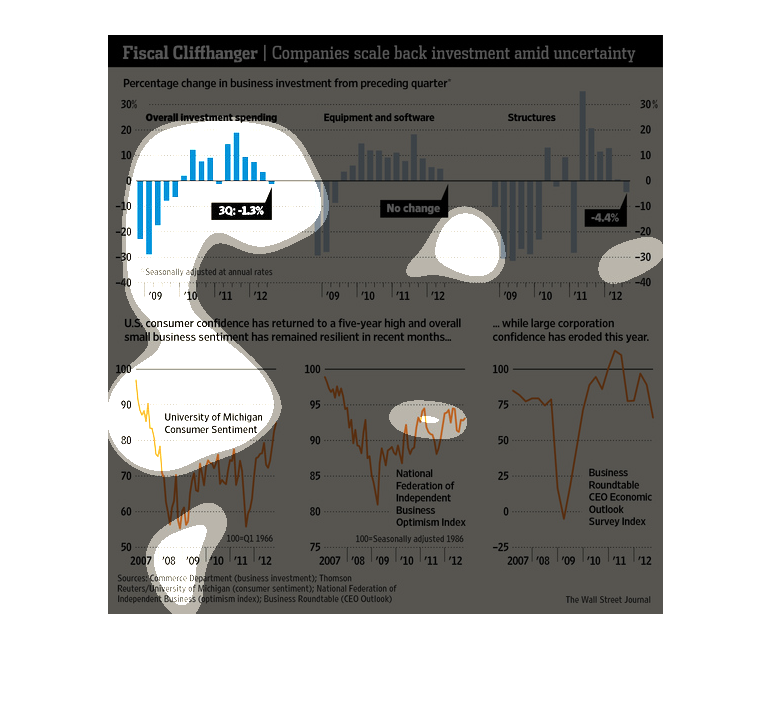
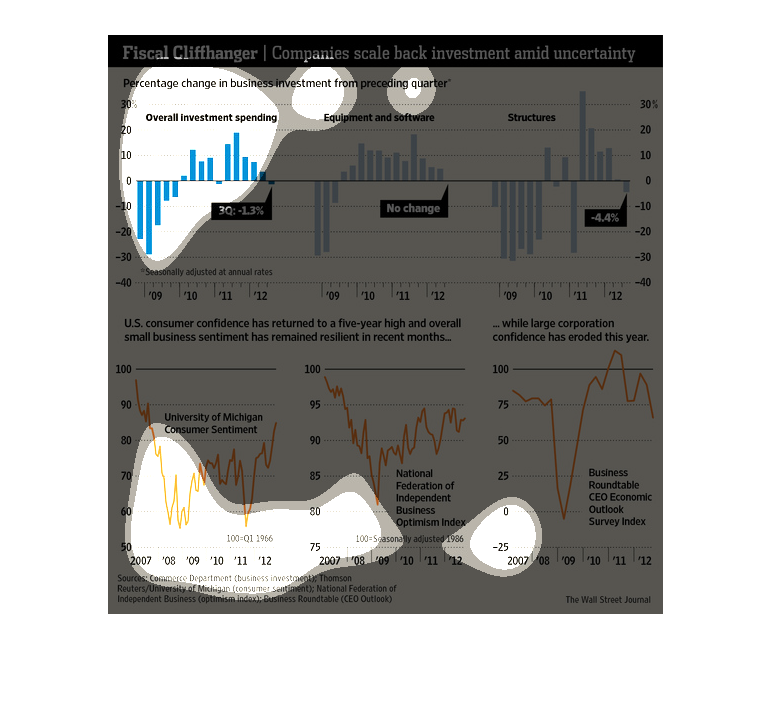
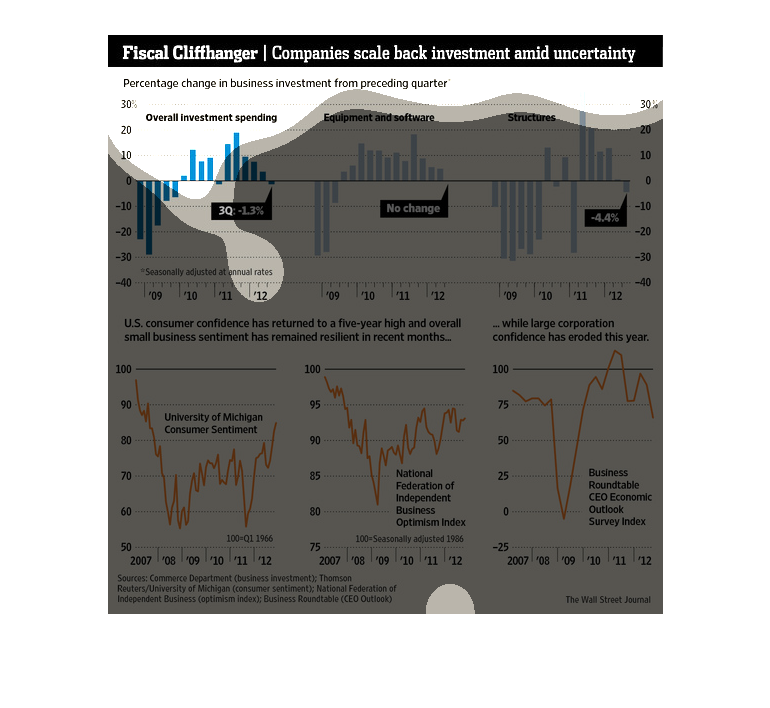
This graph shows, "Fiscal Cliffhanger. Companies scale back investment amid uncertainty. Percentage
change in business investment from proceeding quarter.".
This chart describes fiscal cliffhanger. Specifically, companies scale back investment amid
uncertainty. Categories on the chart include University of Michigan consumer sentiment.
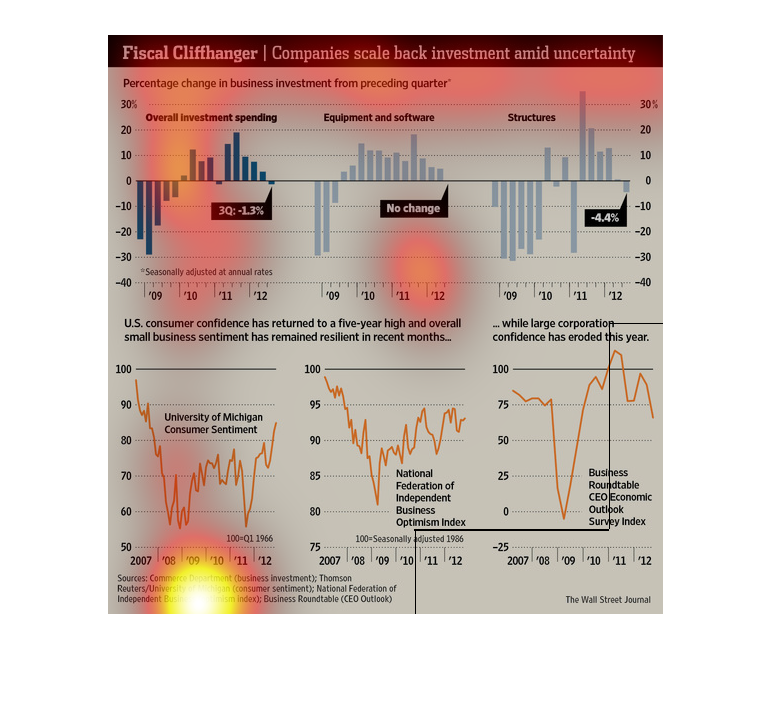
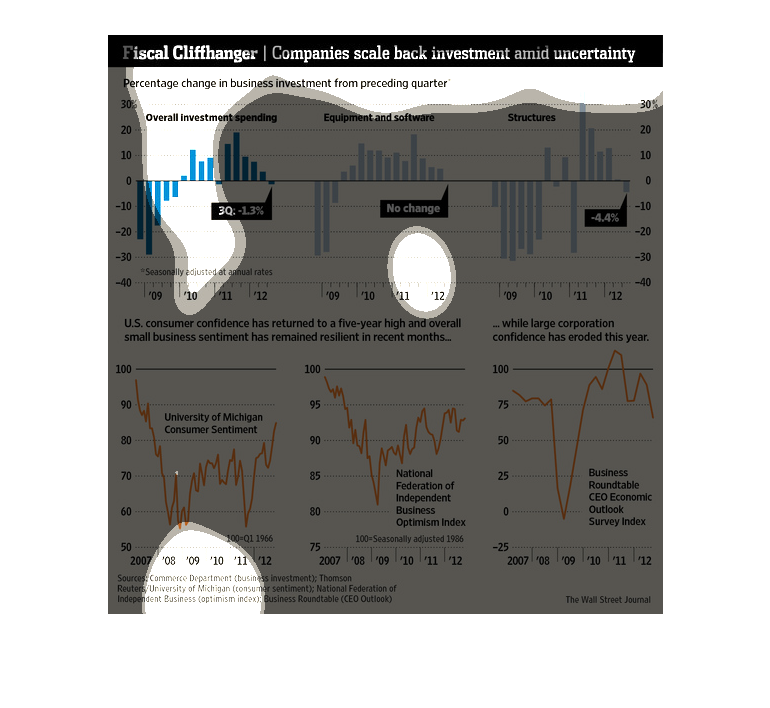
This graph shows the percentage change in business investments from the previous quarter.
The data shows that companies have cut down on investment amid uncertainty.
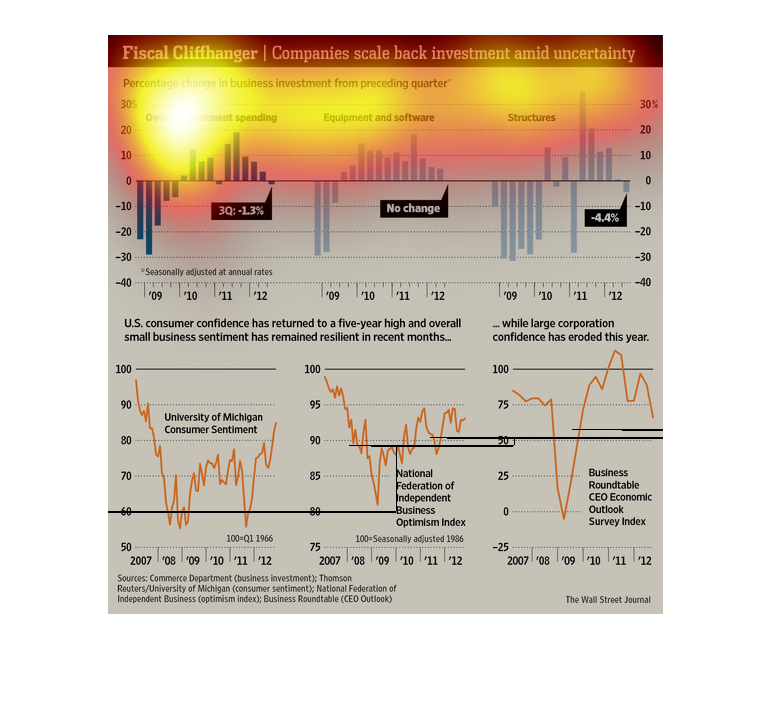
According to several indices, business optimism is fairly high and unchanging after a drop
in 2008 and 2009. Despite that, businesses are spending less on investments and equipment
in 2012 compared to a few years earlier.
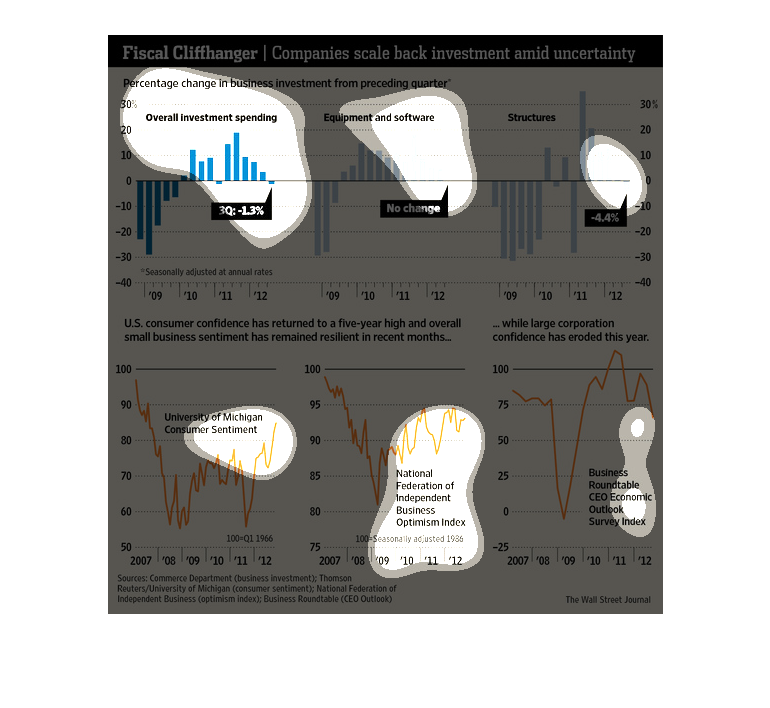
This chart shows the percentage change in investments from the previous quarter. It seems
to depict all investing in the US and is broken down into Overall Investments, Structures,
and Technology (from 2009 to 2012) on the top three charts. The bottom three lines graphs
represent studies from three different organizations that chart more "consumer sentiment"-type
information (from 2007 to 2012). The graph explains that while consumer confidence has grown,
confidence in corporations has actually decreased.
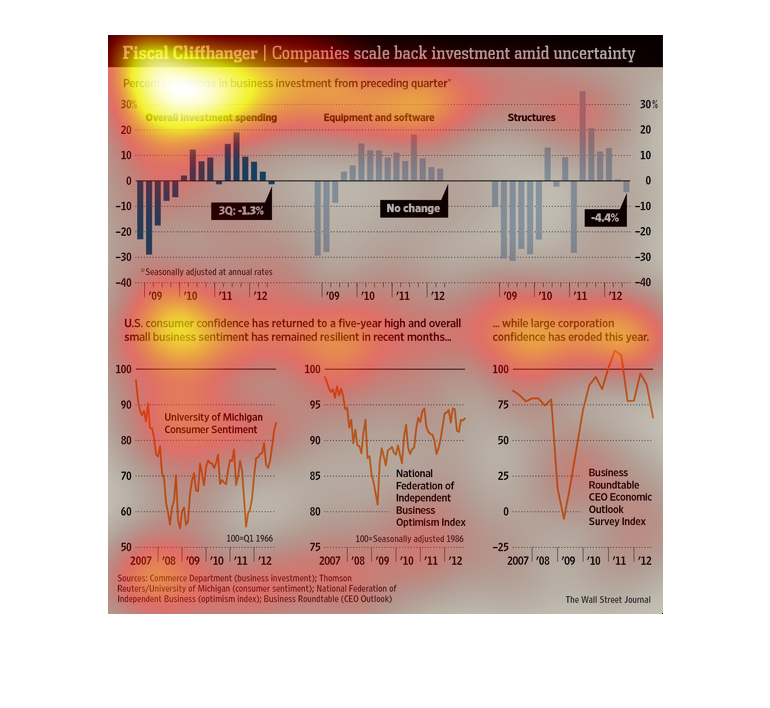
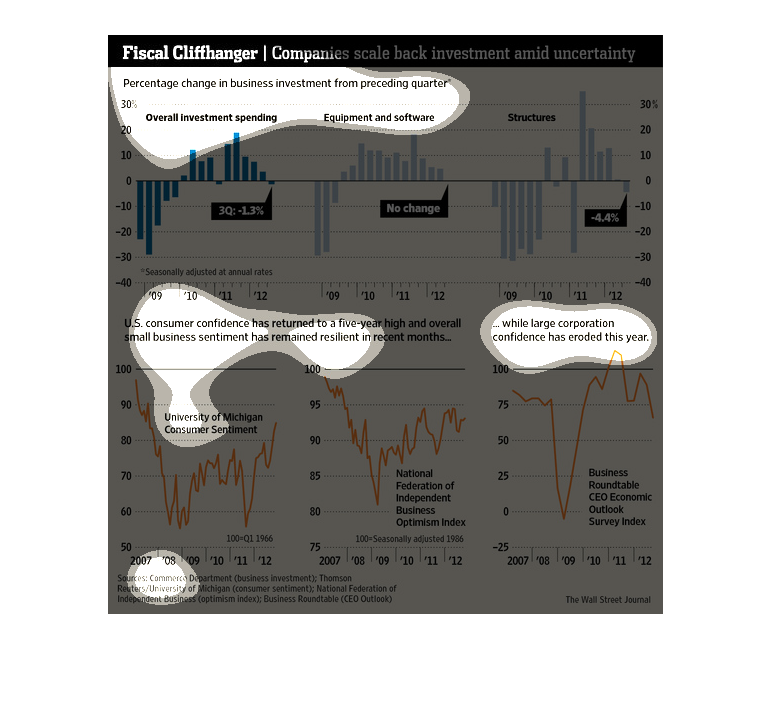
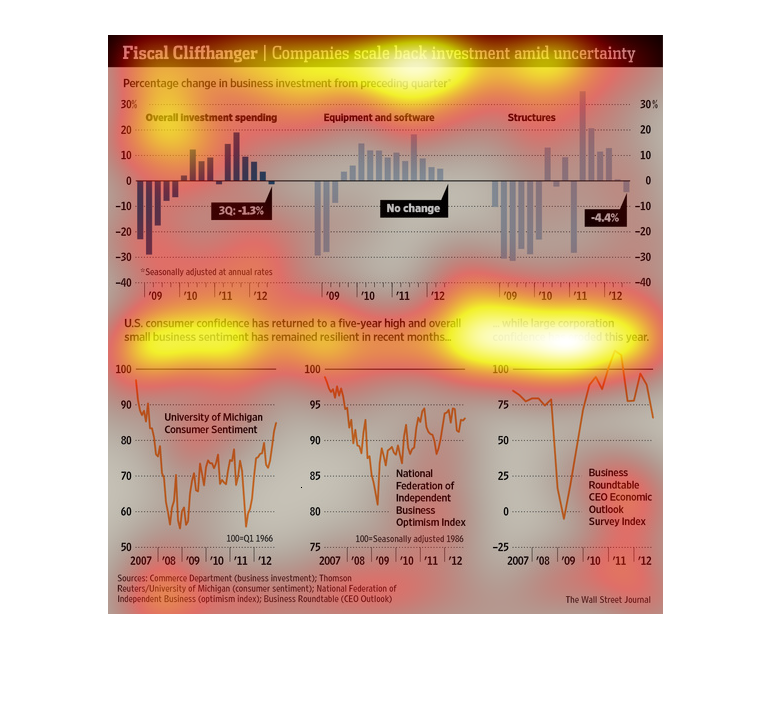
This image shows six graphs that depict companies scaling back investment amid uncertainty.
US consumer confidence has returned to a five year high and small business sentiment has remained
resilient in recent months. Large corporation confidence has eroded this year.
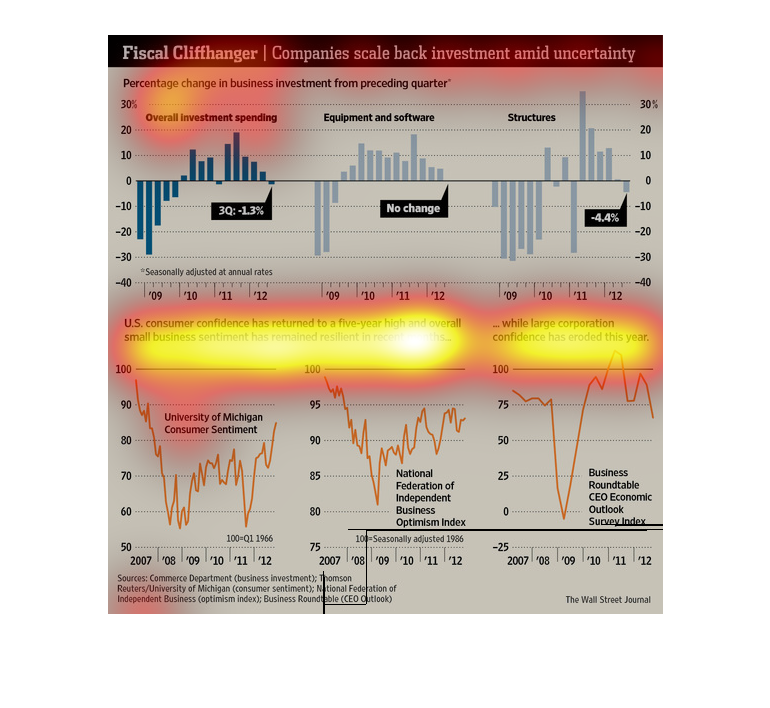
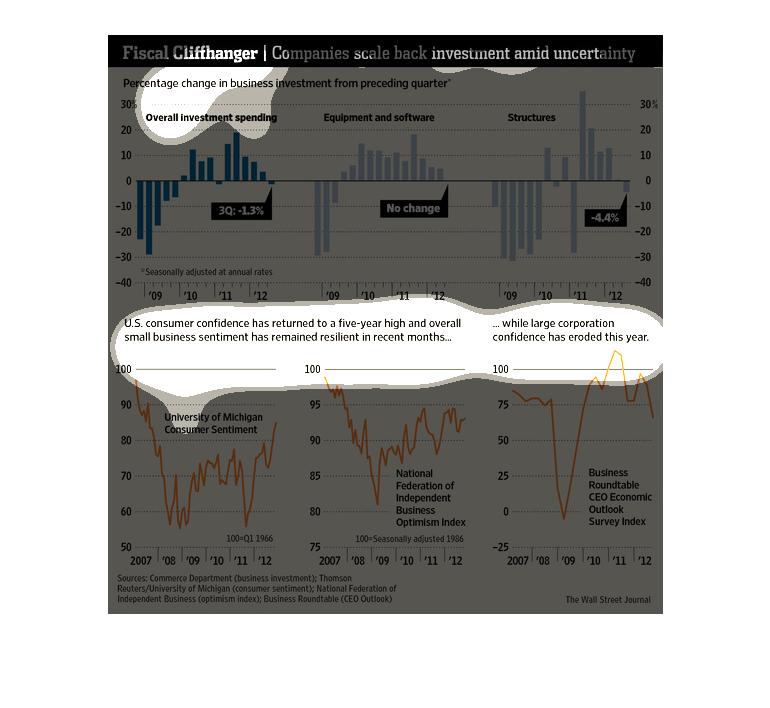
The image depicts how companies are scaling back investment amid uncertainty regarding the
fiscal cliff in the US. Overall investment spending is down to -1.3% in 3Q 1012. US consumer
confidence has in fact returned to a 5 year high, as well as small business sentiment remaining
resilient.
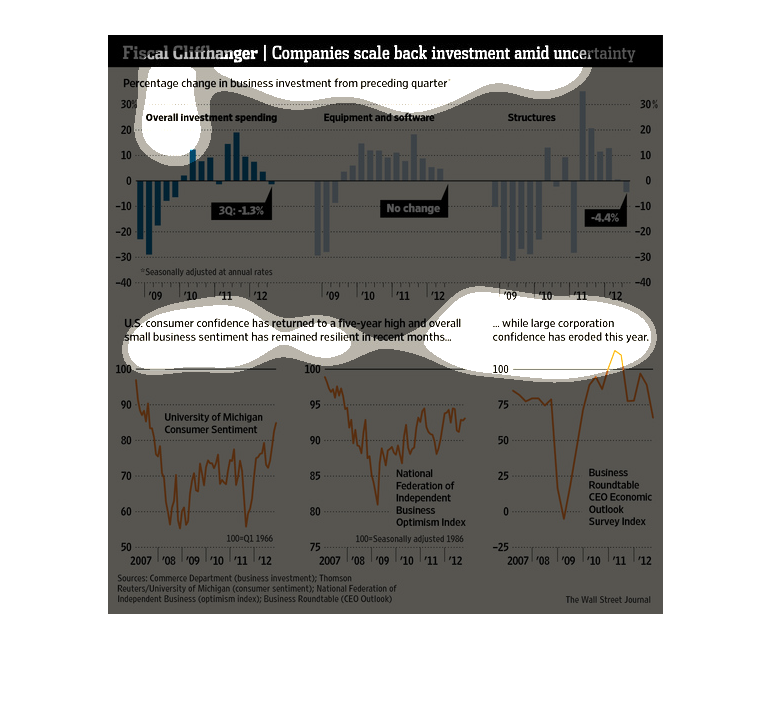
This chart shows information about the economy and consumer confidence and how it relates
to market trends. According to the chart,consumer confidence is returning
According to the chart, confidence in large corporations fiscal growth has been dropping while
individual confidence of the american public has been growing.
This chart shows the level of investments companies have made since 2009. Individual and small
businesses are investing more into the economy, while larger companies have held back.
Confidence for large corporations are low while consumer confidence and small business confidence
are high according to data gathered from 2009 to 2012. Large firms are lowering their investments.
This chart describes fiscal cliffhanger. Specifically, companies scale back investment amid
uncertainty. Different categories are represented by individual charts.
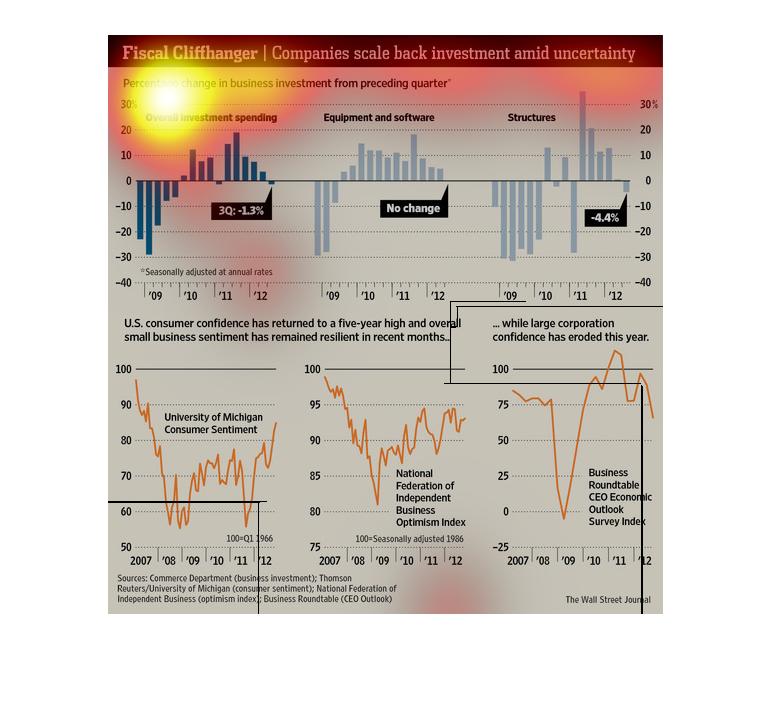
Companies scale back investments due to uncertainties. Consumer confidence is high while business
confidence is very low. In the 3rd quarter for overall investments, there was a 1.3% decrease.
There was no chance for the category looking at equipment and software. There was a 4.4% decrease
for structures.