This is a series of diagrams and charts with related statistics depicting the falling cost
for traditional essentials has freed consumers to spend more of their cash in other areas.
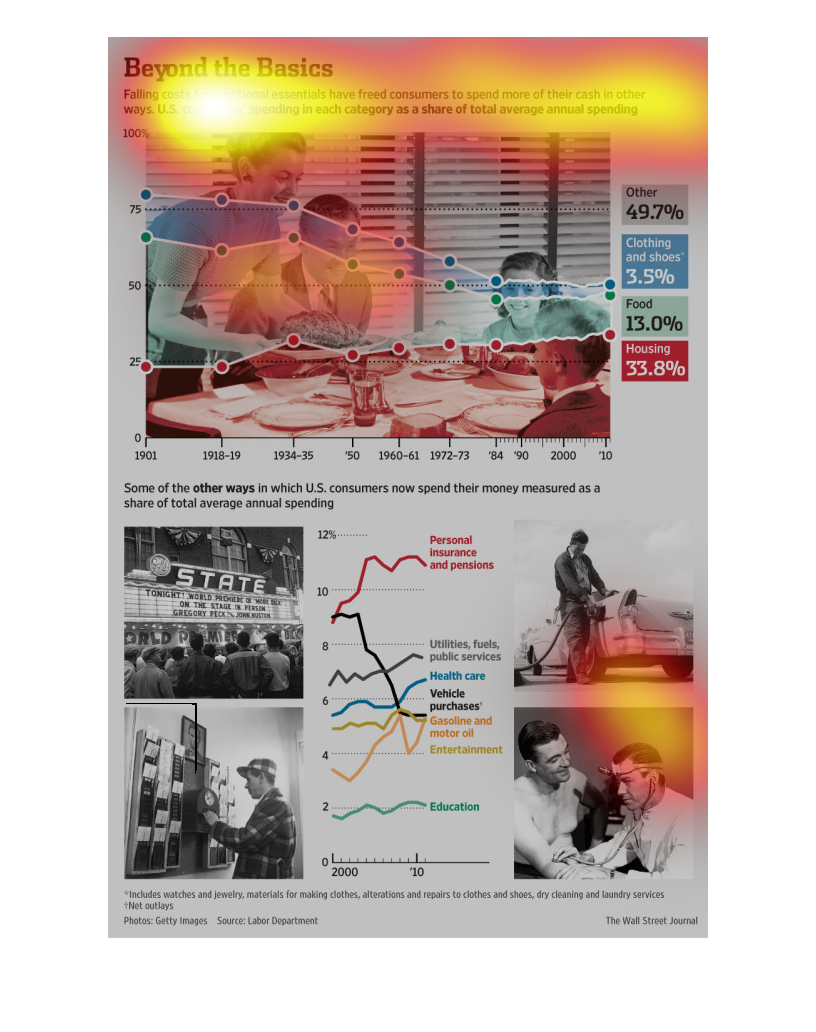
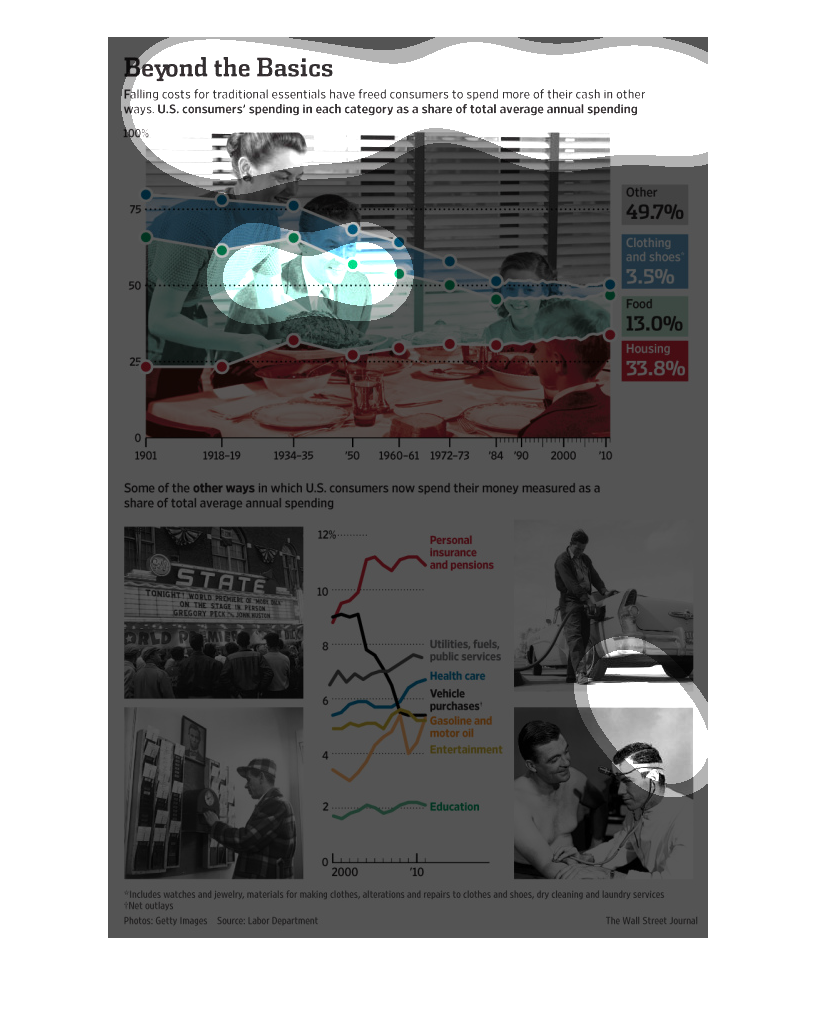
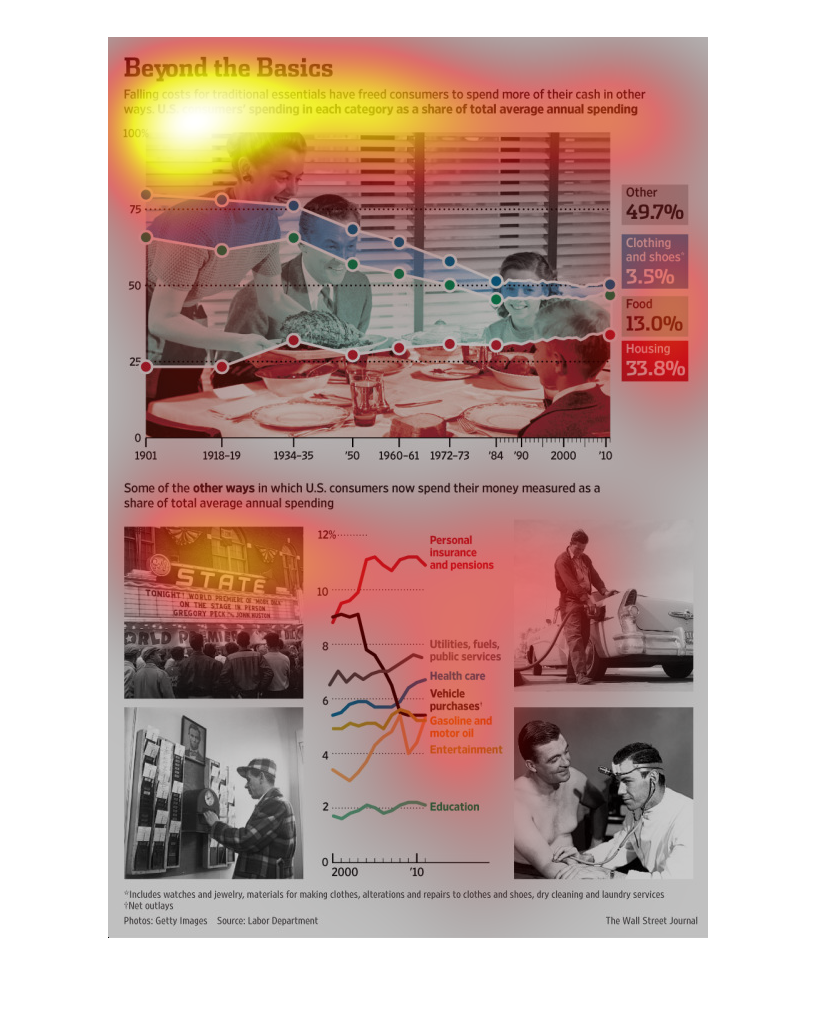
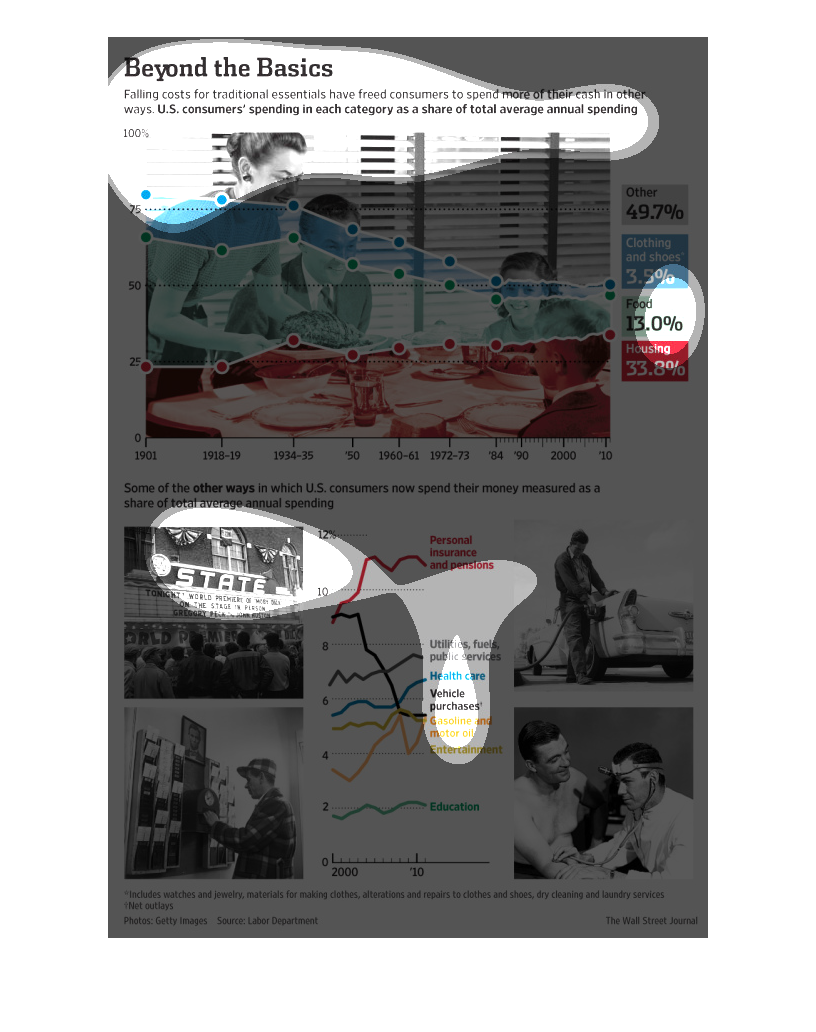
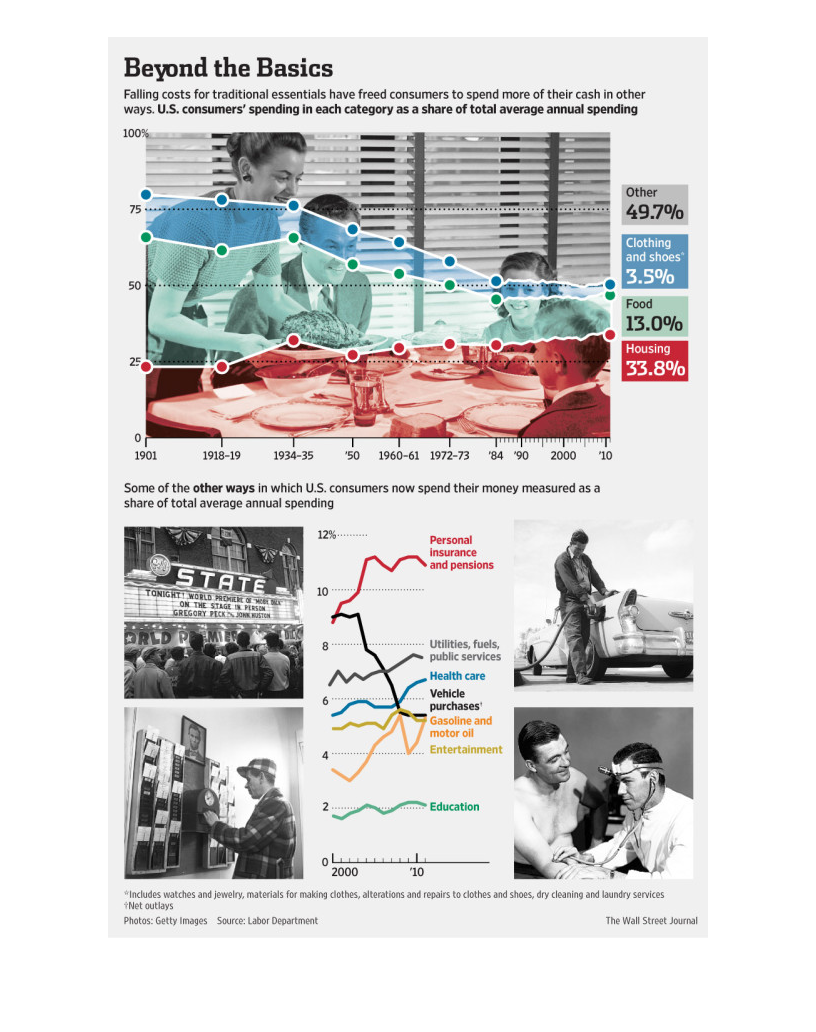
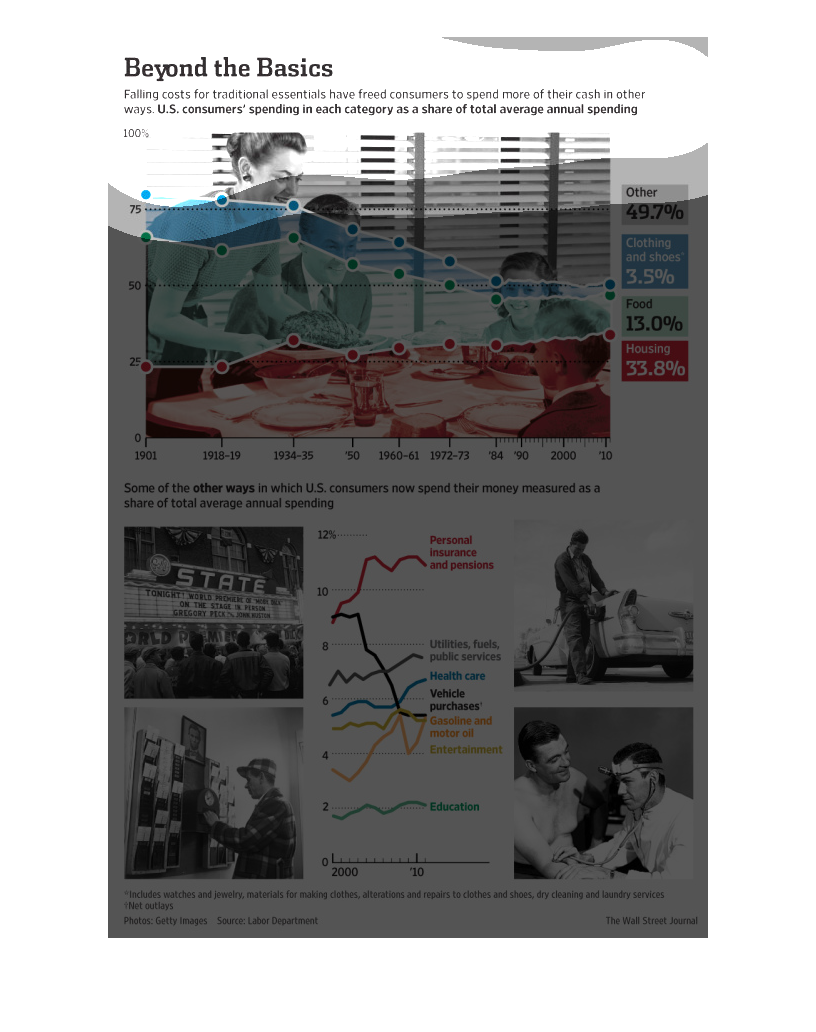
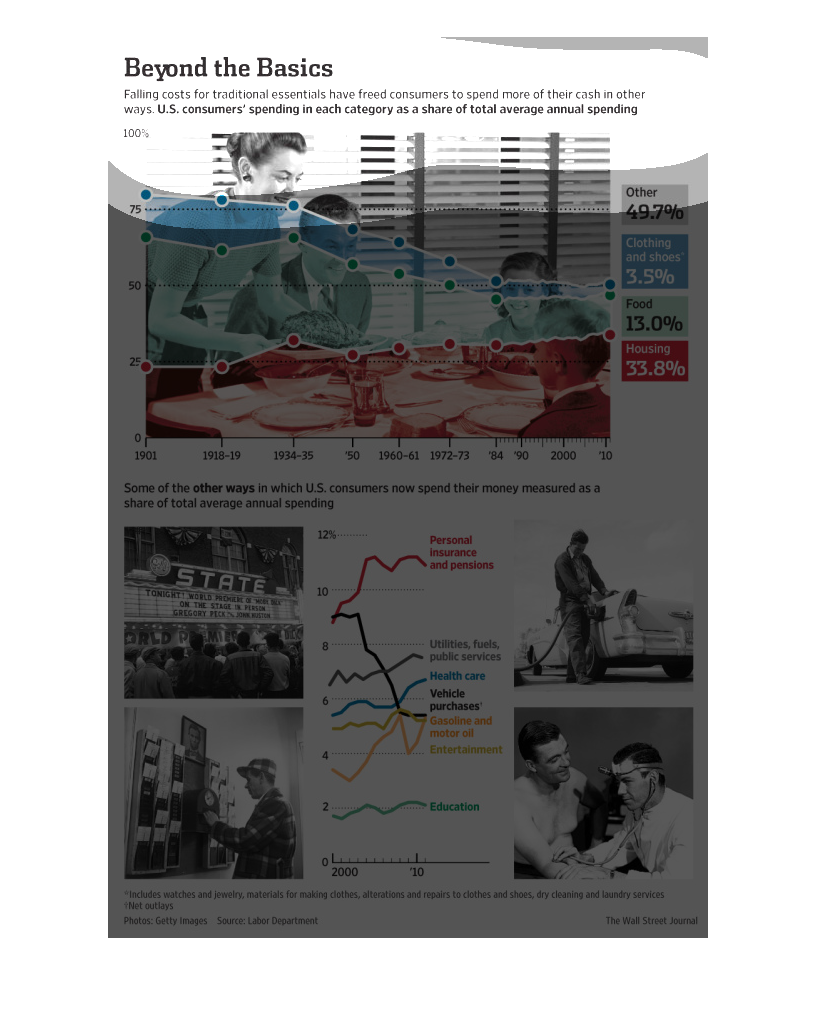
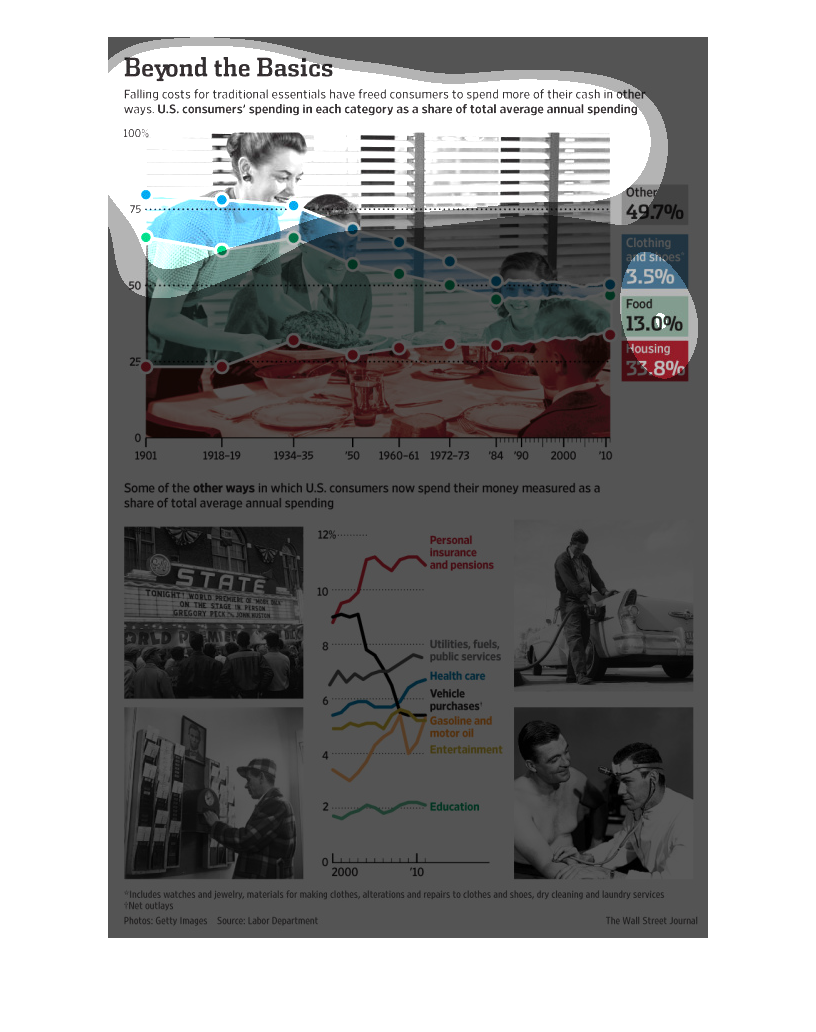
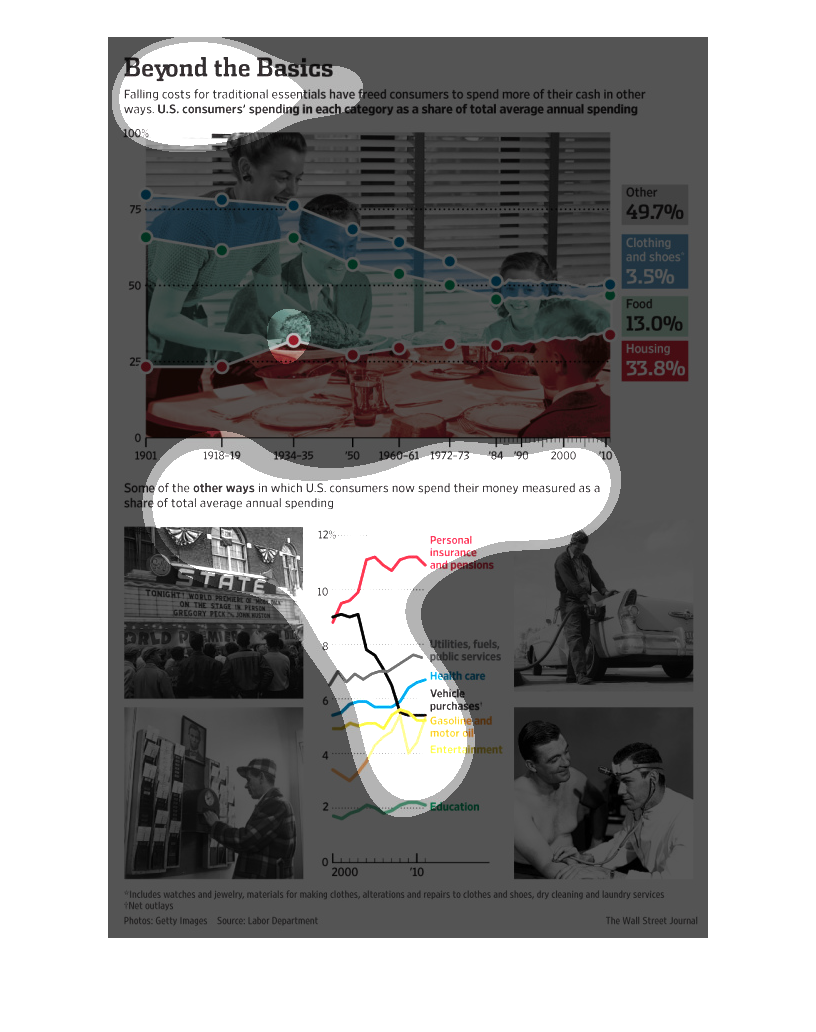
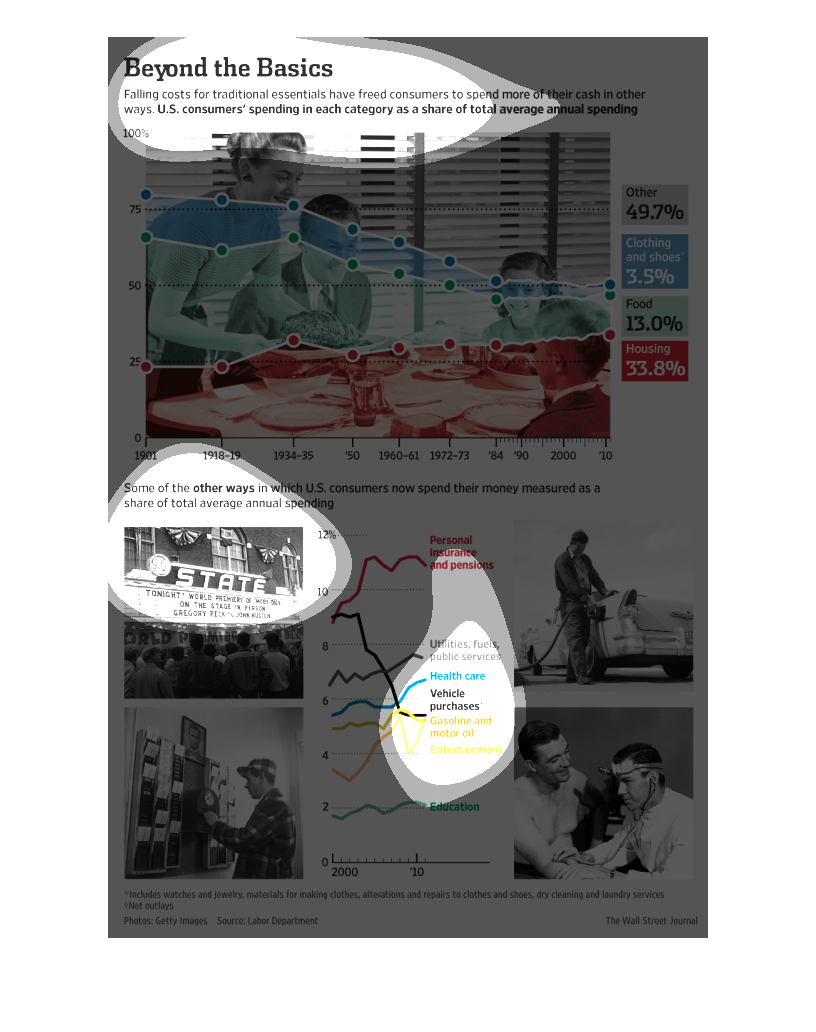
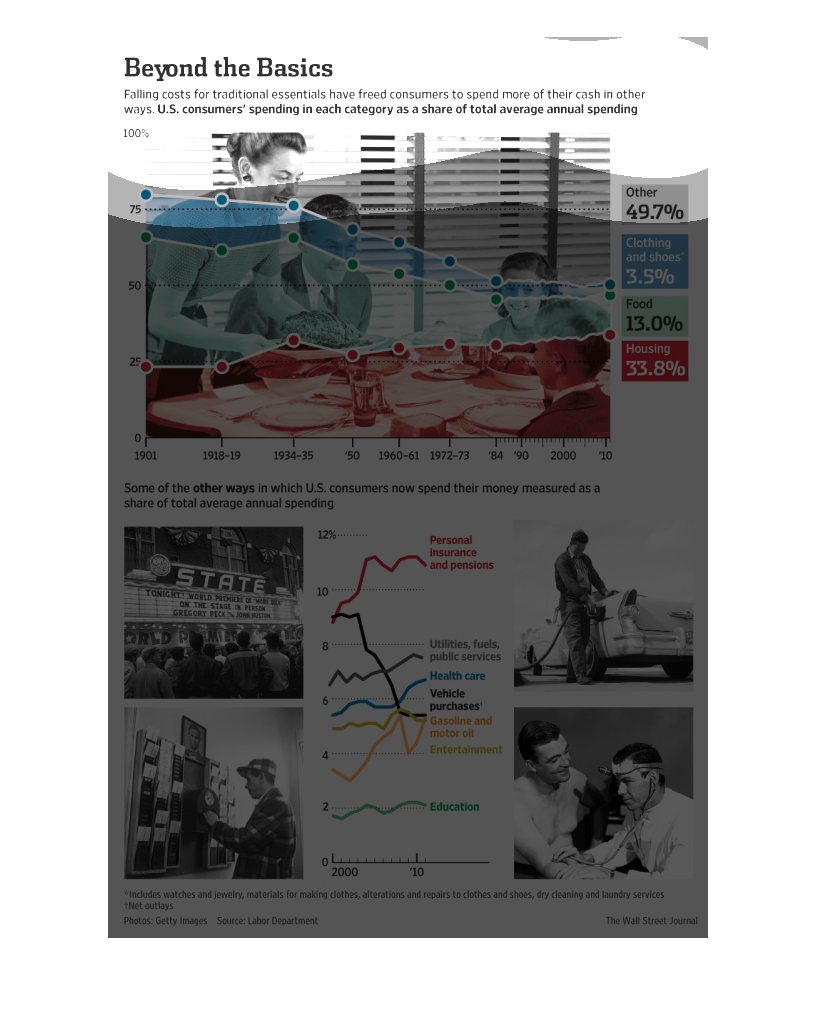
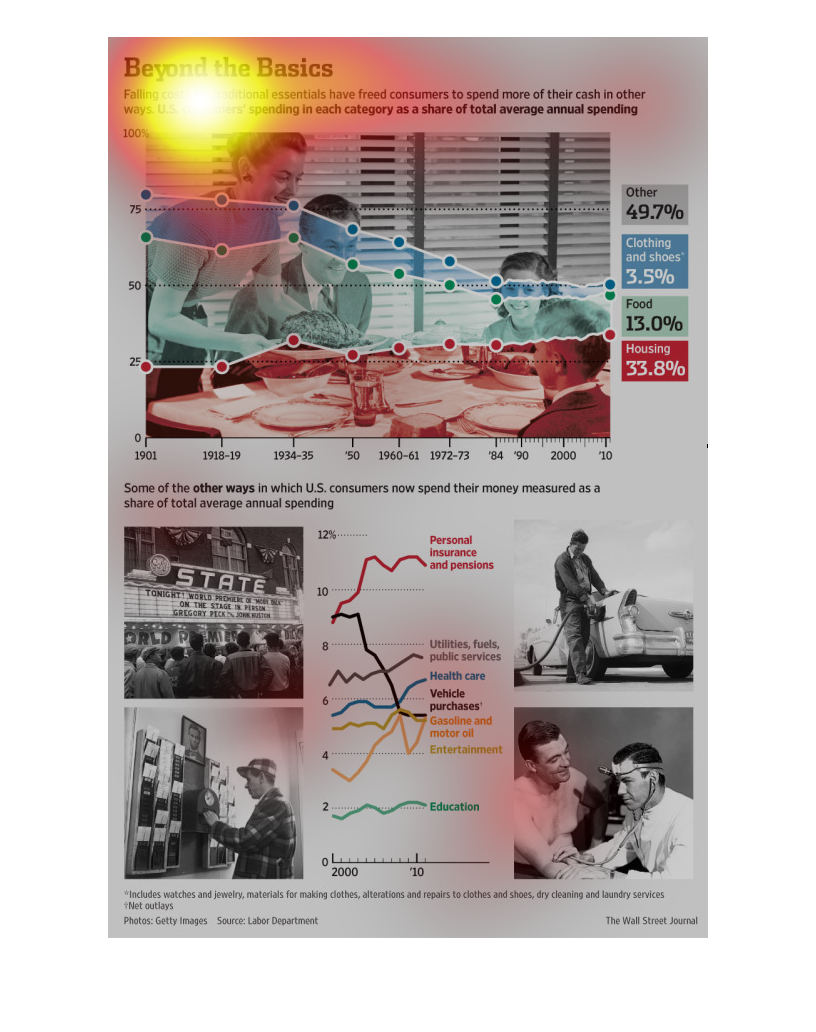
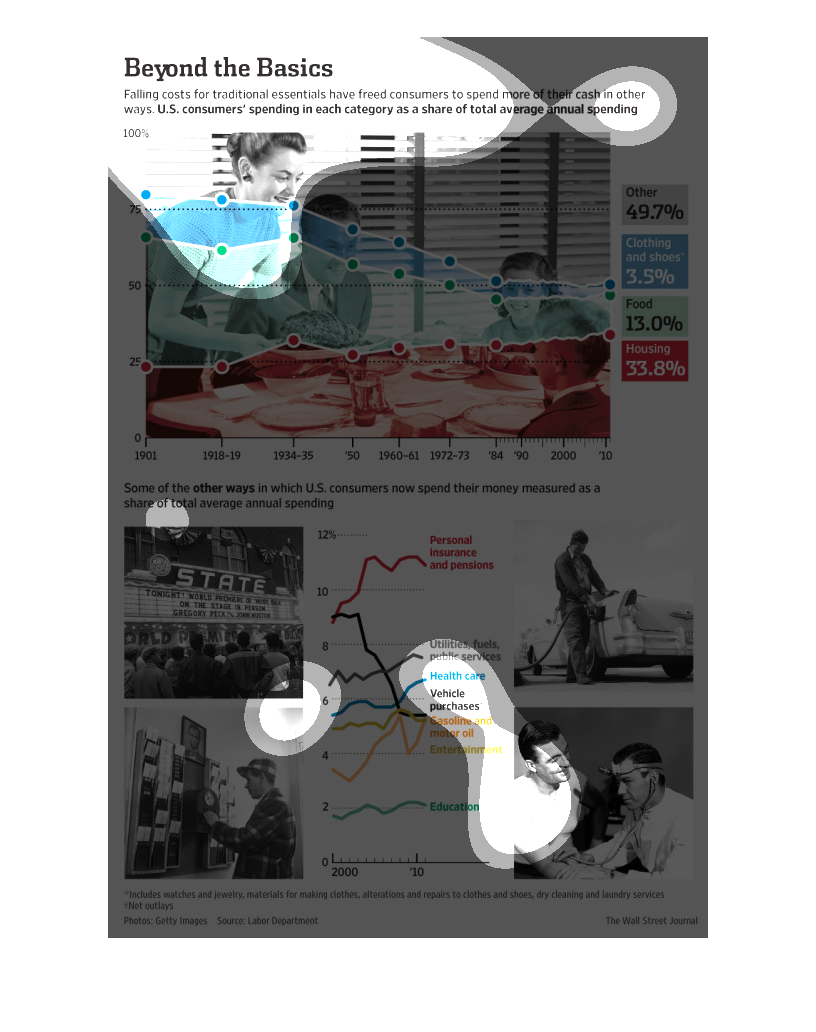
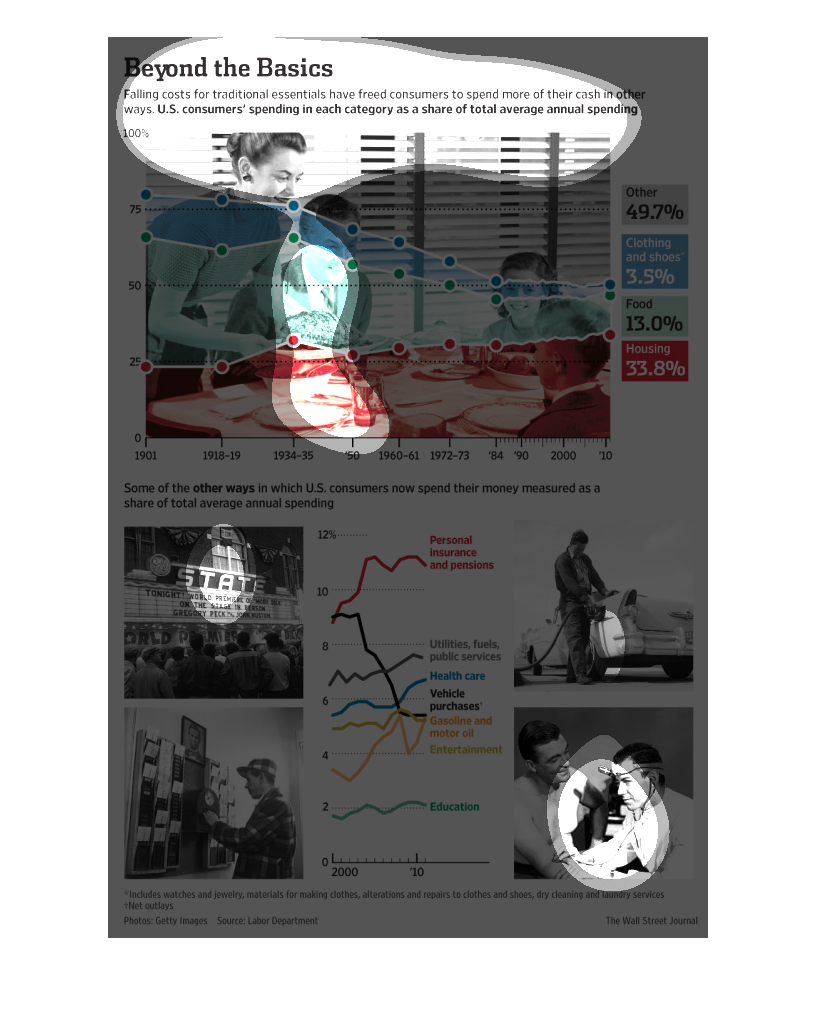
This chart describes beyond the basics. Specifically, falling costs for traditional essentials
have freed consumers to spend more of their cash in other ways.
This is a series of graphs, charts and statistics depicting that falling costs for traditional
essentials have freed consumers to spend more of their cash in other ways.
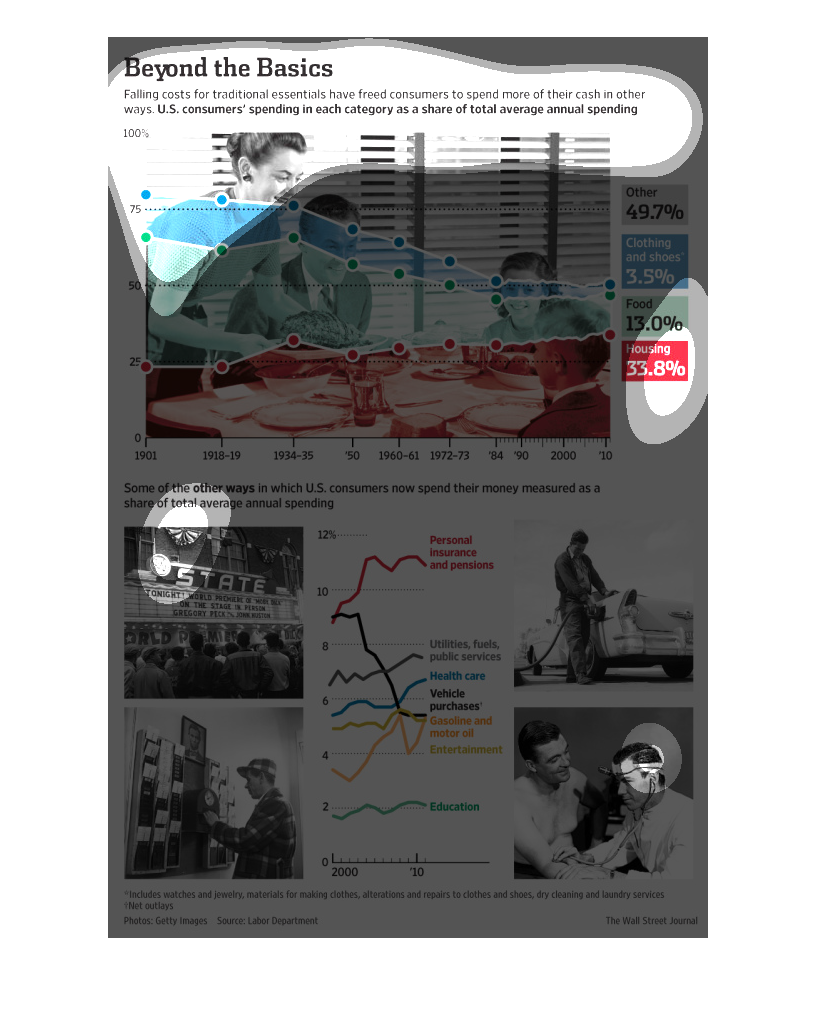
The following chart displays how the falling costs of essential products in the USA has freed
up income for people to spend money on other products. The information was shown from 2000-2014.
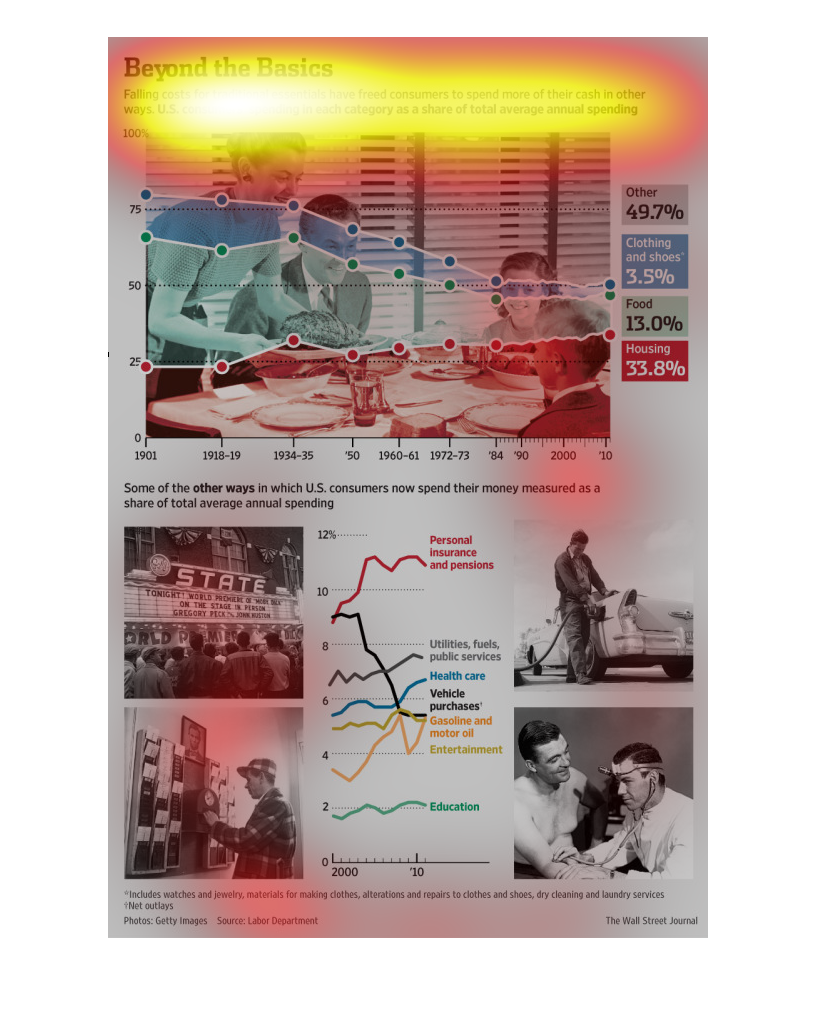
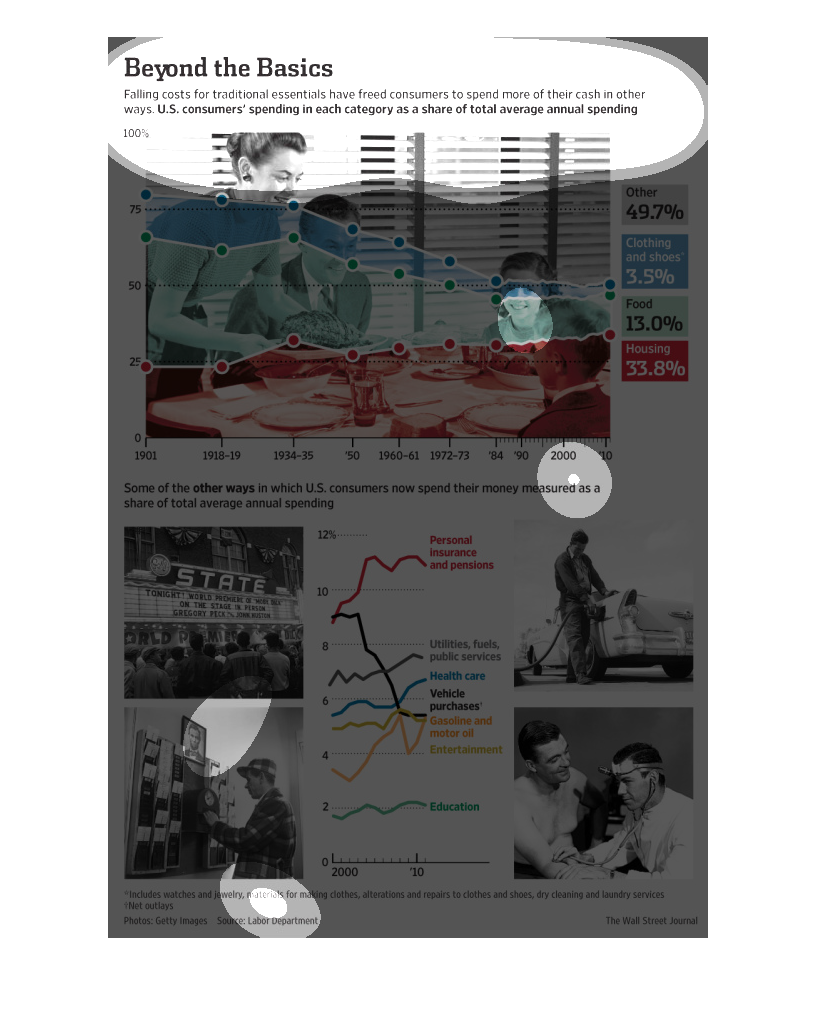
The image depicts how falling costs for traditional essentials are freeing people to spend
their money on alternative things. Clothing and shoes, as well as food costs have fallen,
allowing people to spend money on others things.
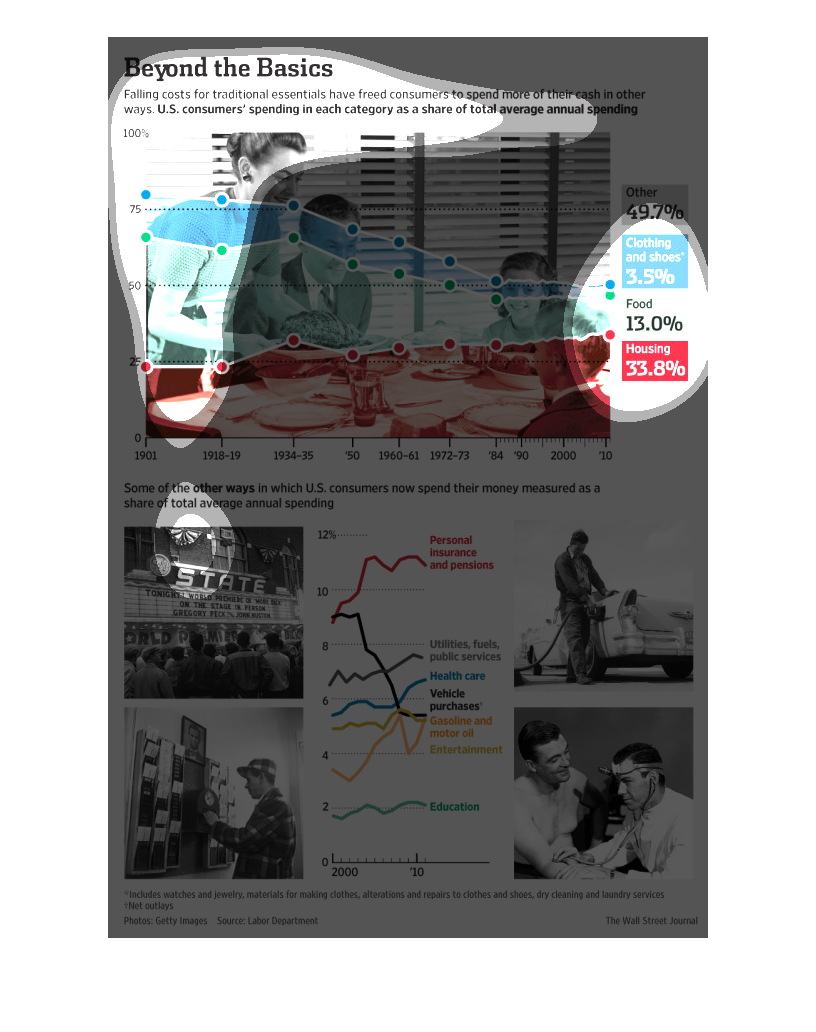
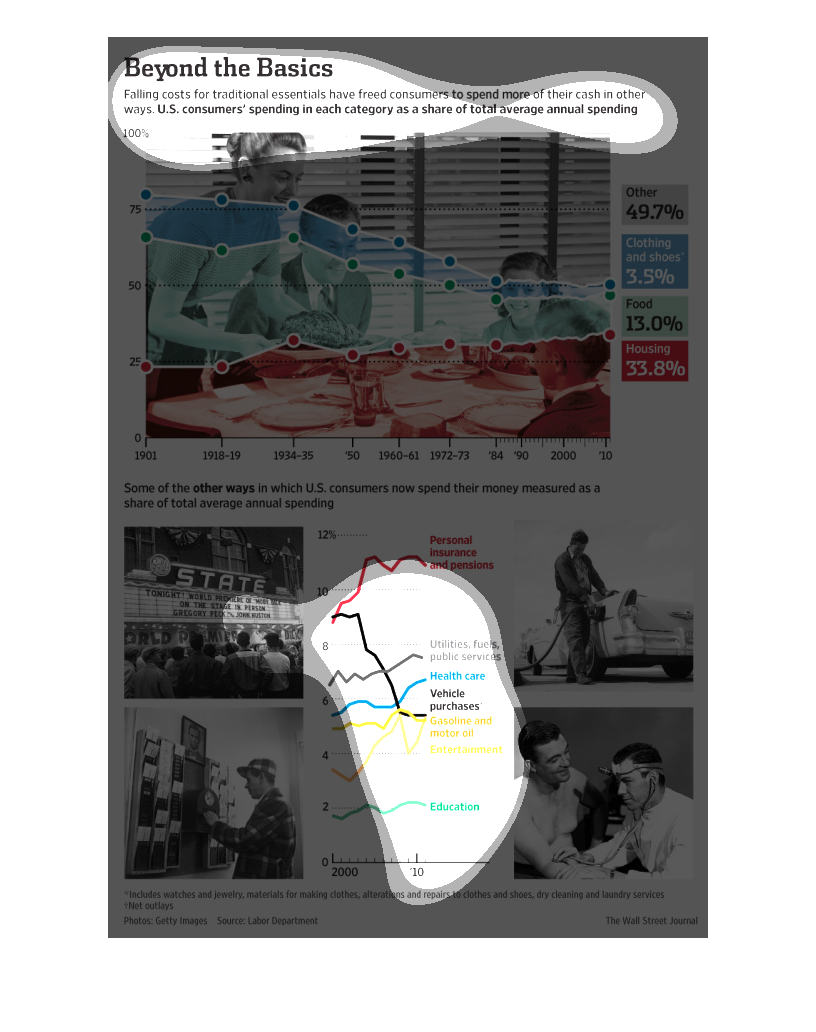
This is a Beyond the Basics Chart. The page suggest that falling cost of traditional essential
household needs   are freeing up Americans consumers to spend in other non essential areas
with spending on non-essentials being 49.7% and housing being at 33.8%
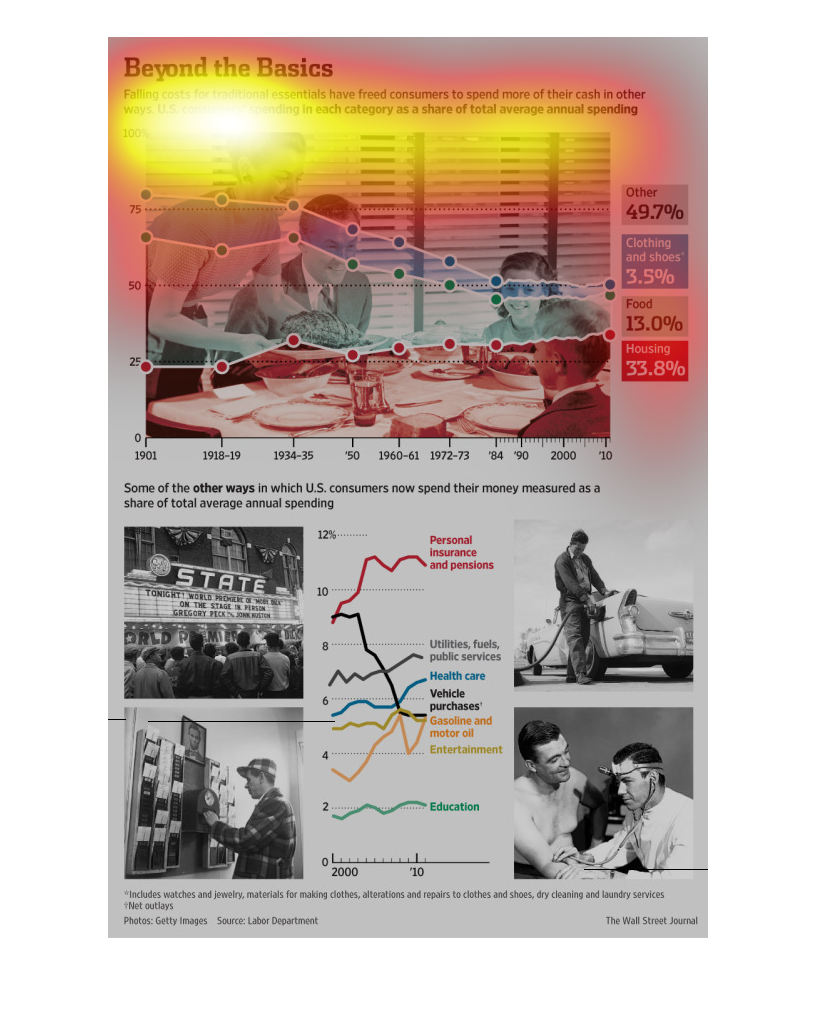
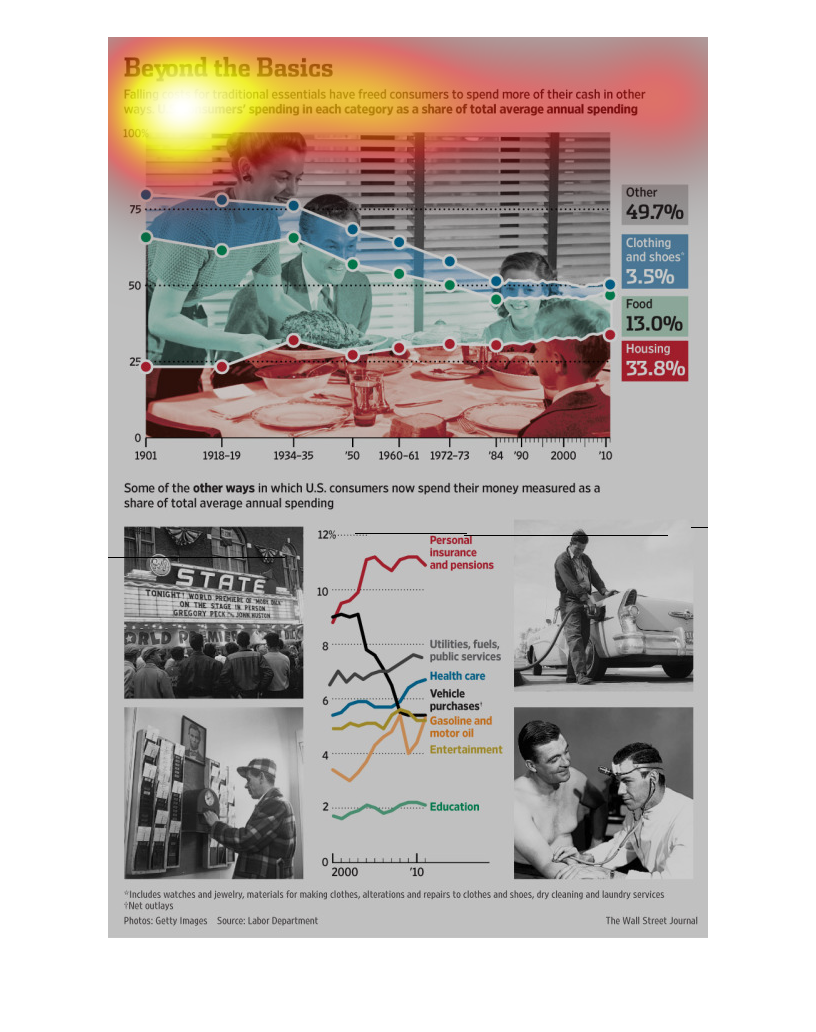
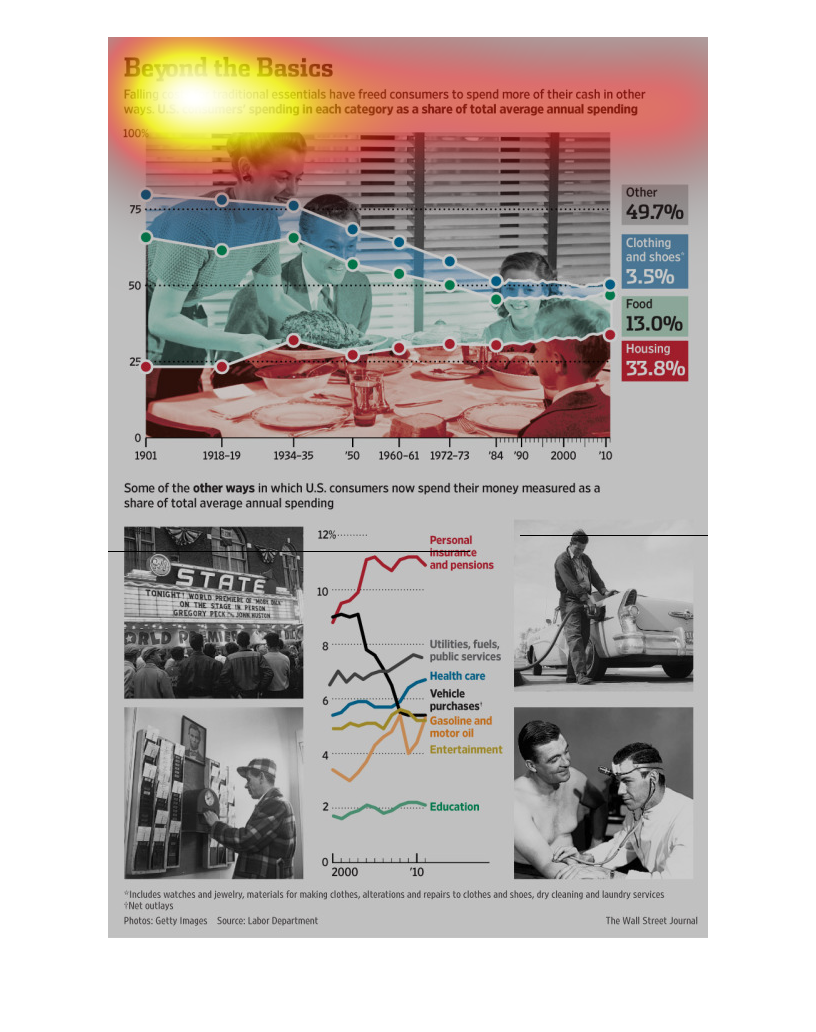
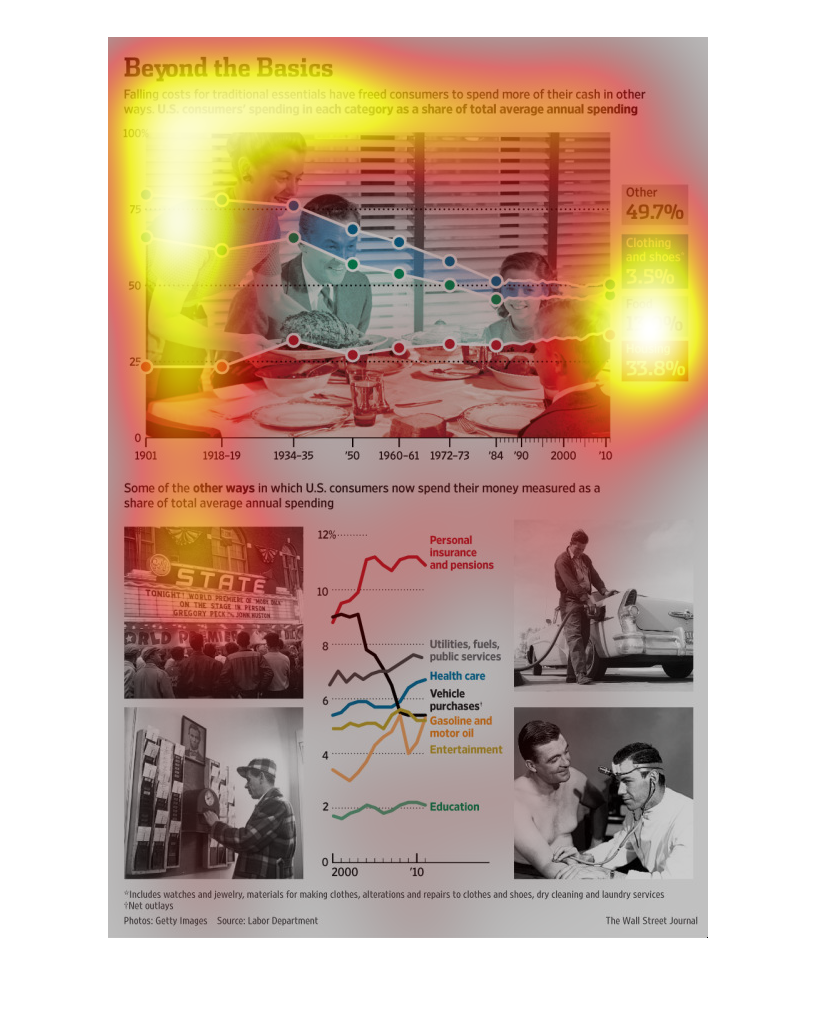
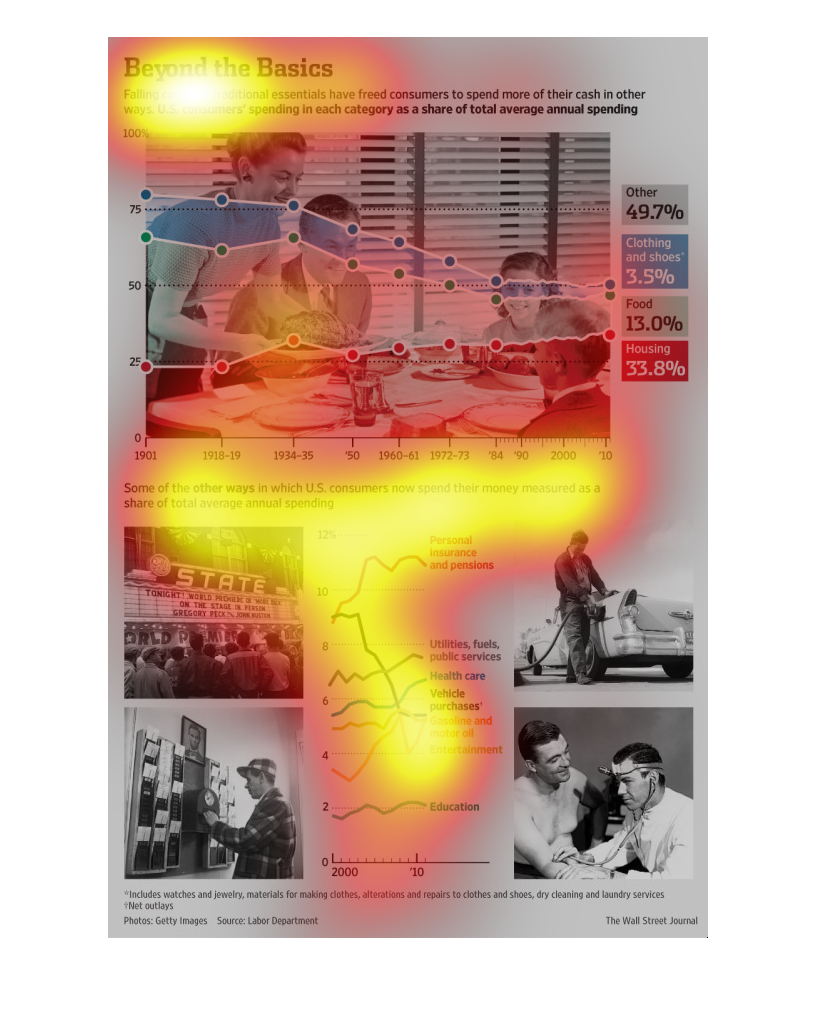
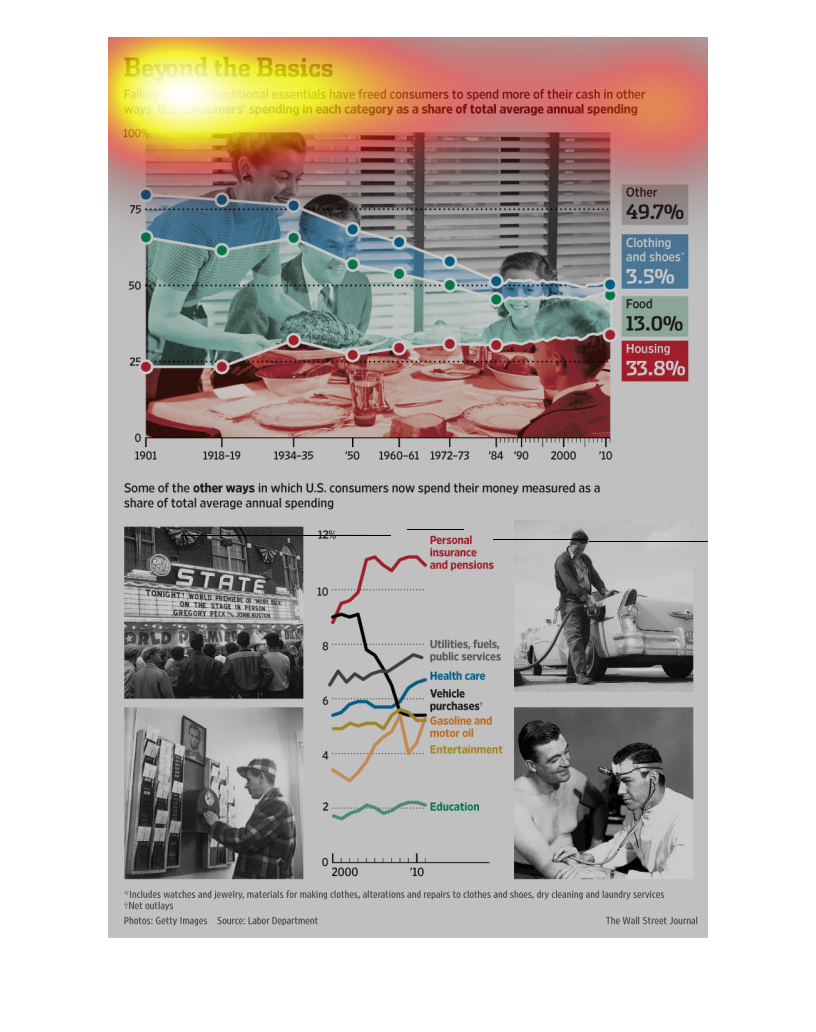
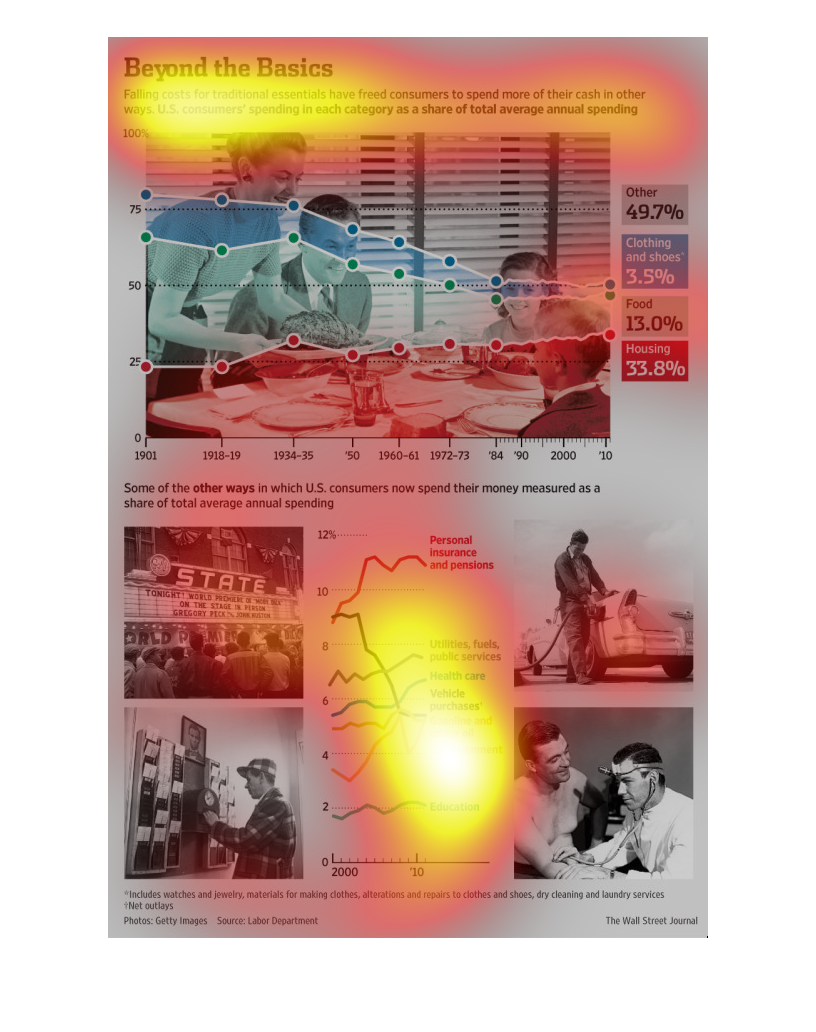
The image depicts the manner that consumer spending trends have changed for U.S. consumers.
It stands to be the case that the costs of necessities have caused consumers to be able to
allot more money toward other wants and desires. The images depicts a chart detailing the
trends for different areas on which money is commonly spent, over a span of decades in America
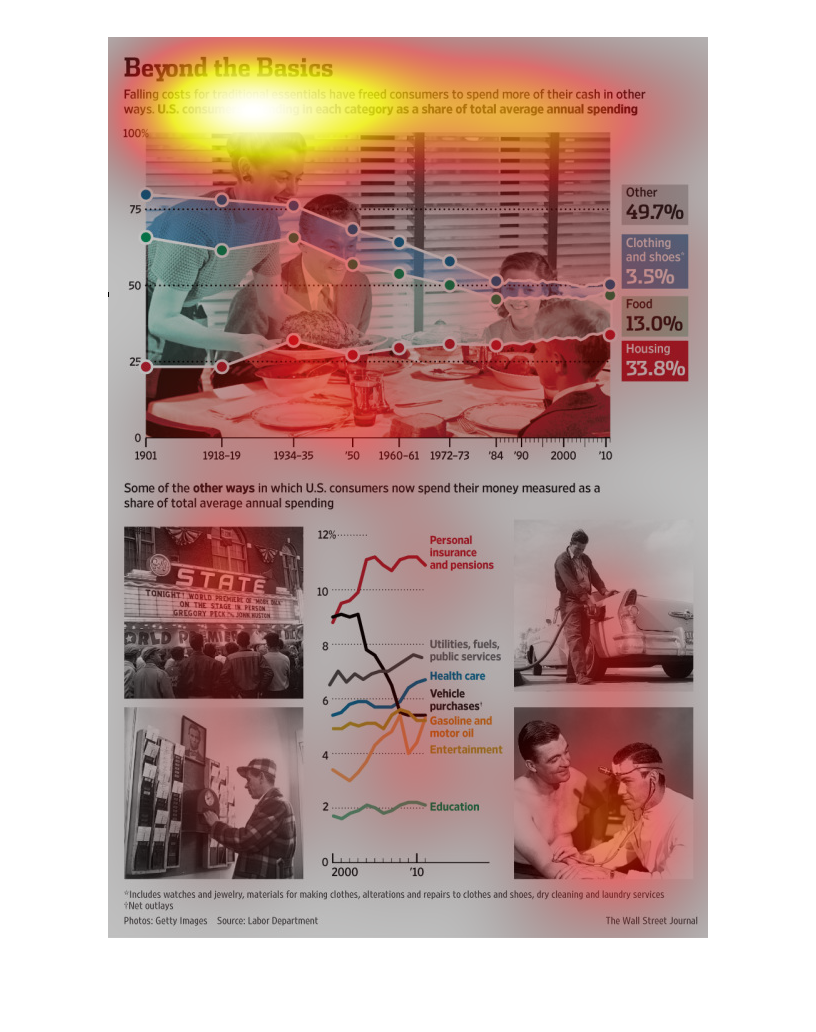
(from the 1900s through 2000s). In addition, another chart depicts the amount of money
consumers presently allot toward different areas, based on the total average annual spending--utilities,
healthcare, vehicles, education, entertainment, etc.
This chart is showing the ways americans are spending their hard earned cash in different
ways. Basic necessities such as food is only about 13% of how americans spend money.
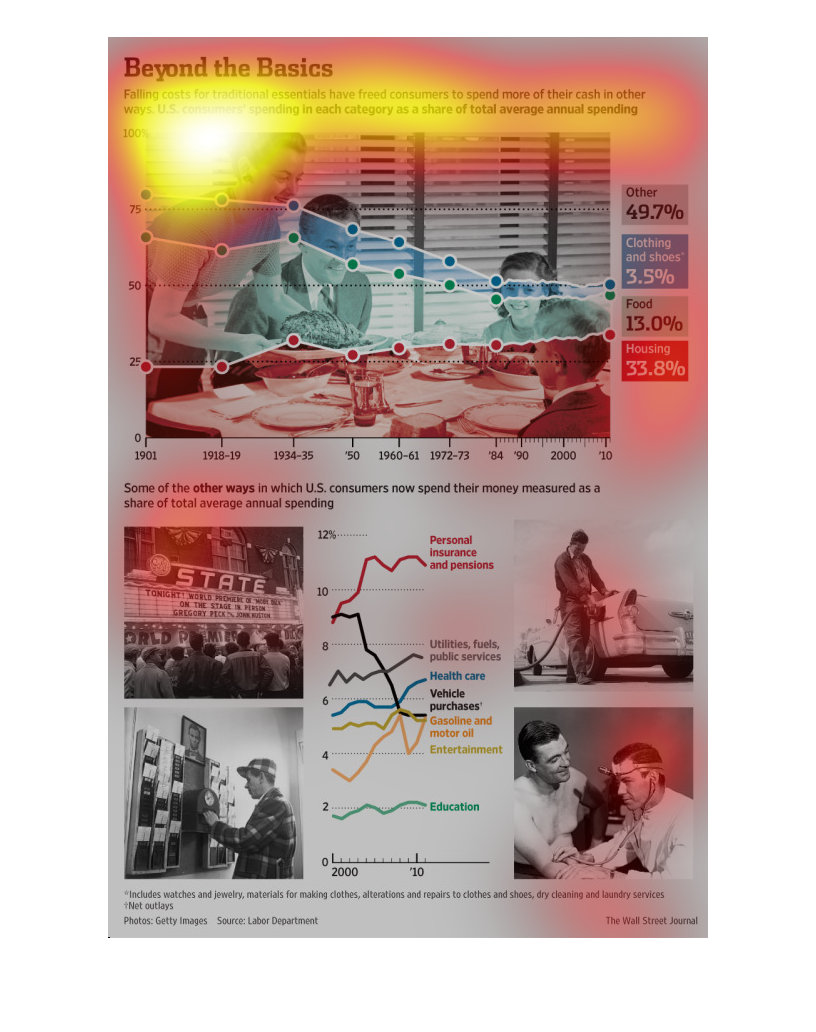
This chart shows how falling costs for essentials have caused consumers to start spending
more money.  It shows increases in utility costs, health care, and vehicle purchases.
This chart describes beyond the basics. Specifically, falling cost for traditional essentials
have freed consumers to spend more of their cash in other ways.
A couple of graphs called "Beyond the Basics". The graphs discuss and display how with the
cost of necessities being lowered, people are spending their money on other things.
This image shows or depicts in various statistical formats the data concerning the falling
costs of traditional essentials have freed consumers to spend more of their cash in other
ways
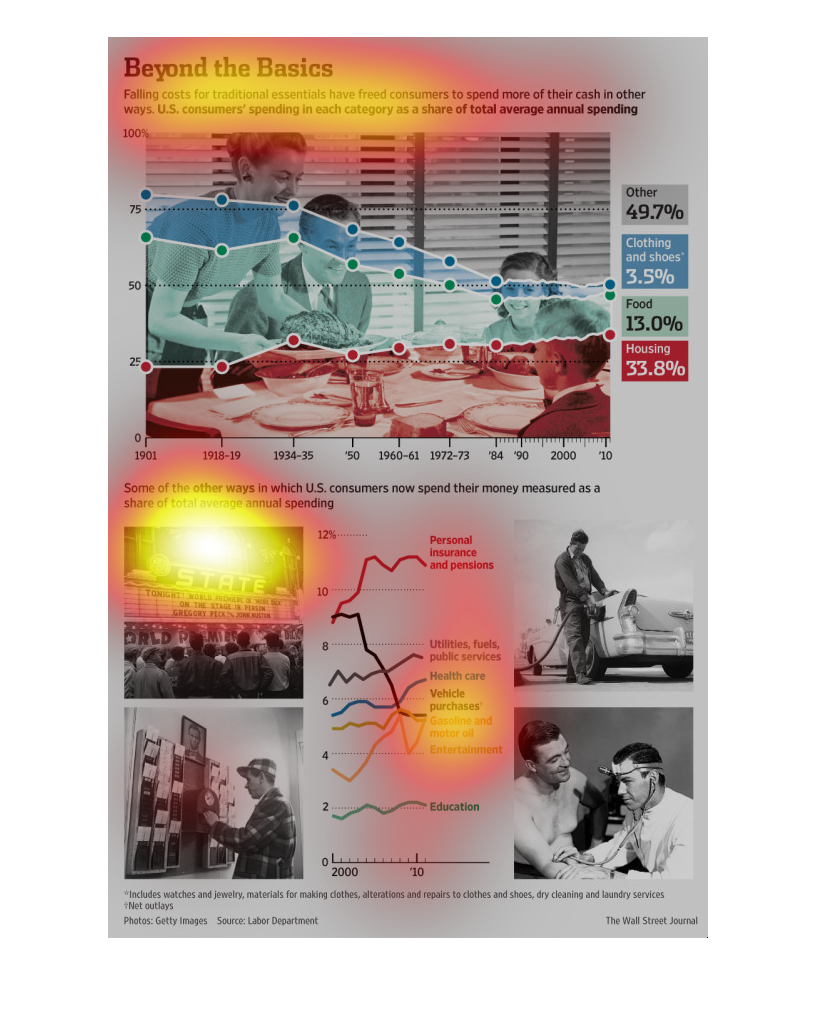
This graph depicts how Americans' spending has changed over the course of time. The costs
for essentials have dropped and therefore Americans are able to spend more on nonessentials
than before. It breaks down the percentage of American spending on different things such as
housing, food, cars, entertainment etc and plots the differences over time.
This shows what american consumers spend their money on since the price of essentials has
dropped. They spent their money mostly on housing followed by food and lastly on Clothing
and shoes.