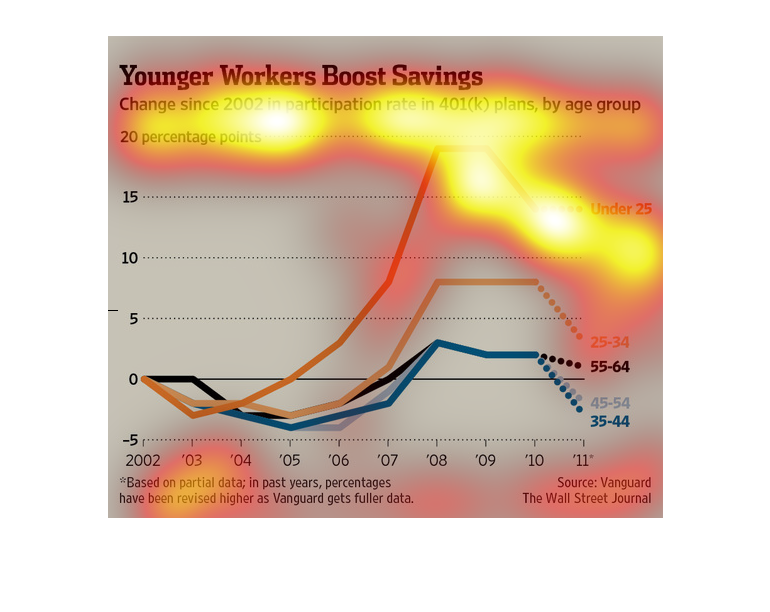
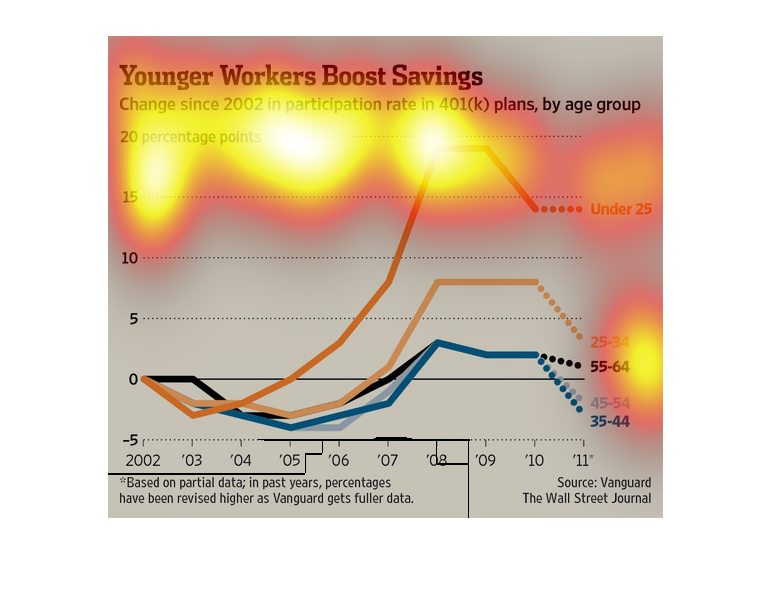
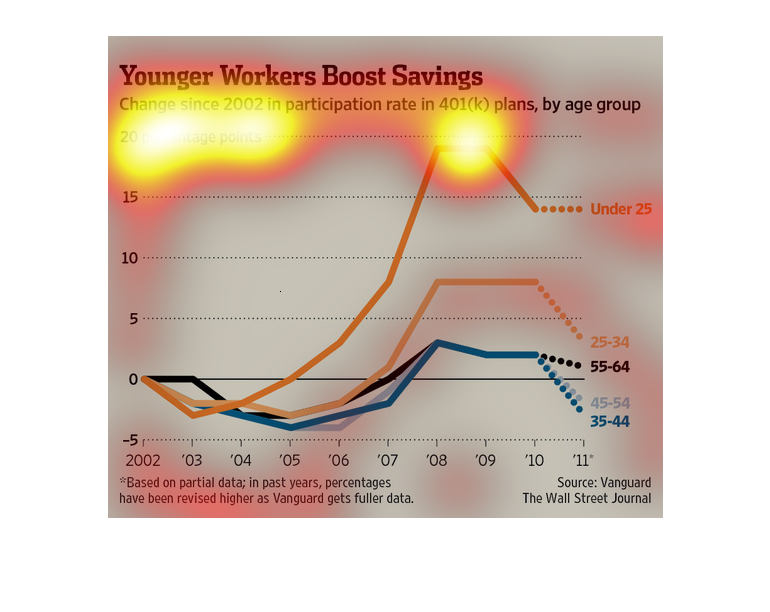
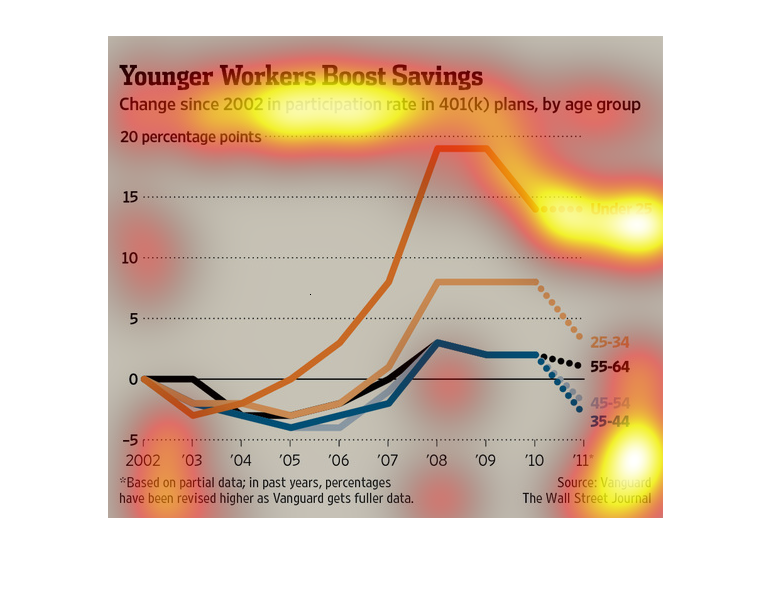
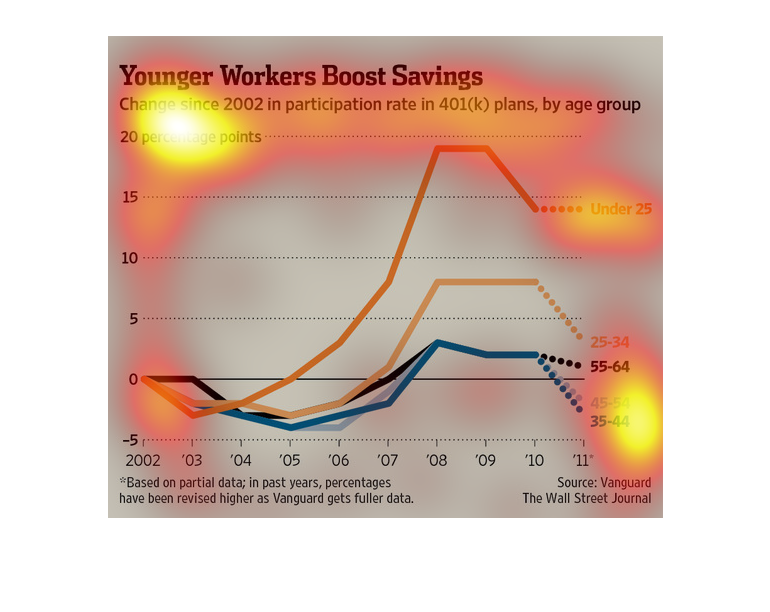
The chart is showing the difference in participation for 401K plan ranging by age group since
2002. There was a big increase over time through people under the age of 25.
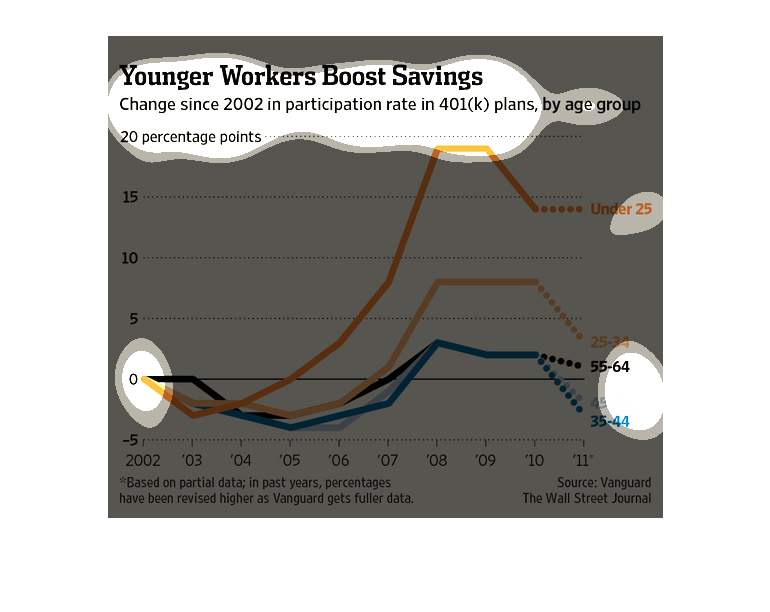
This chart describes younger workers boost savings. Specifically, change since 2002 in participation
rate in 401(K) plans, by age group, with twenty percentage points.
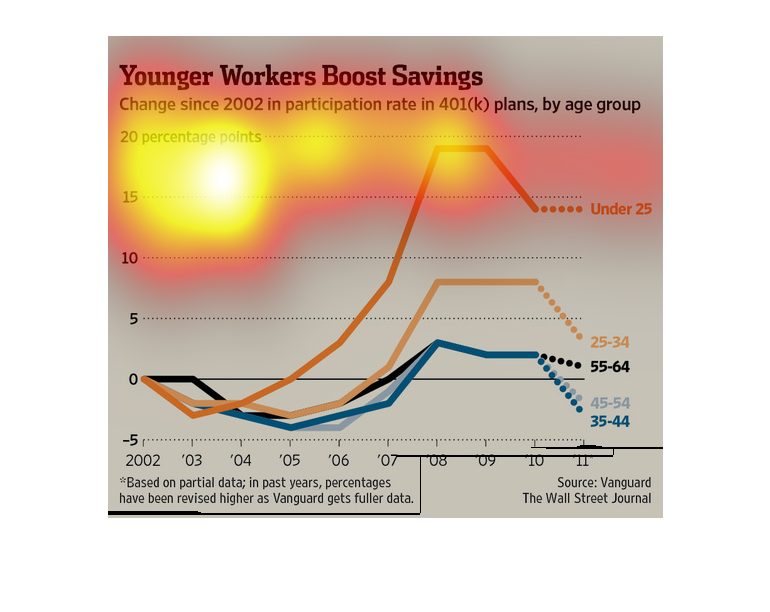
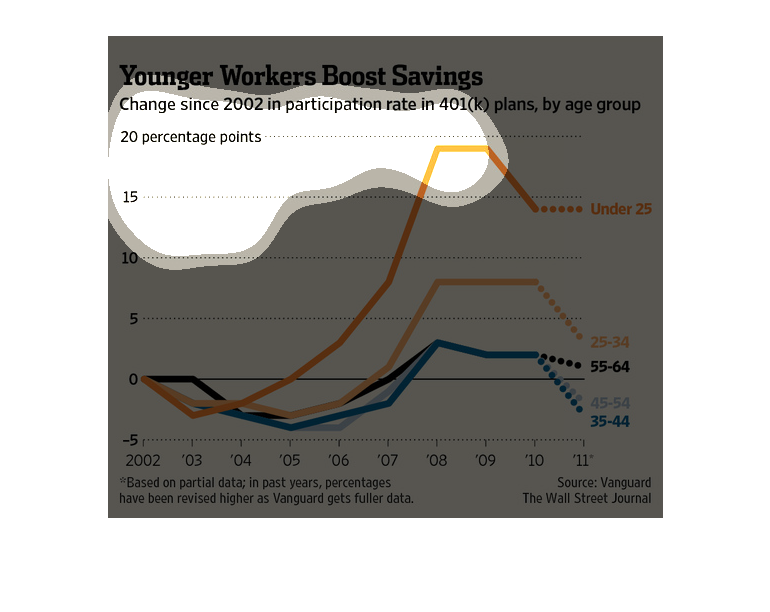
The caption for this line graph is, "Younger workers boost savings".  The information graphed
on this chart shows participation in 401k plans, broken down by age group, 2002-2011.

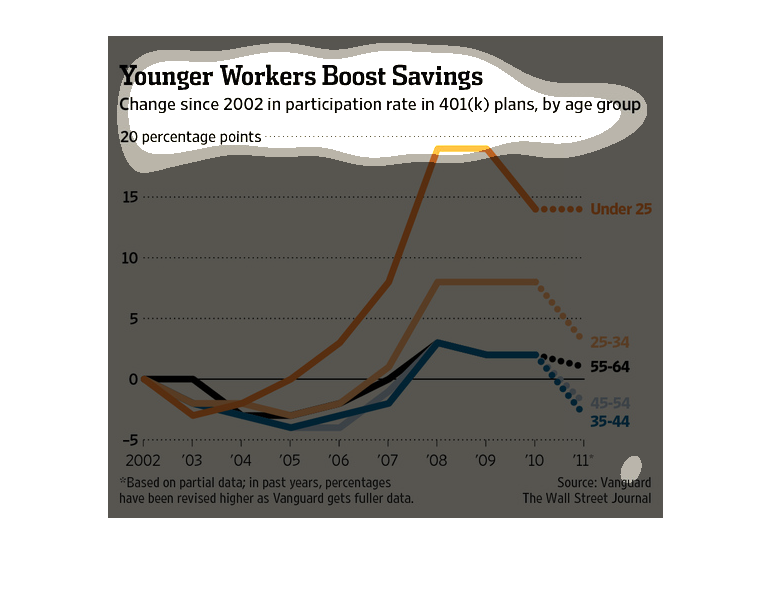
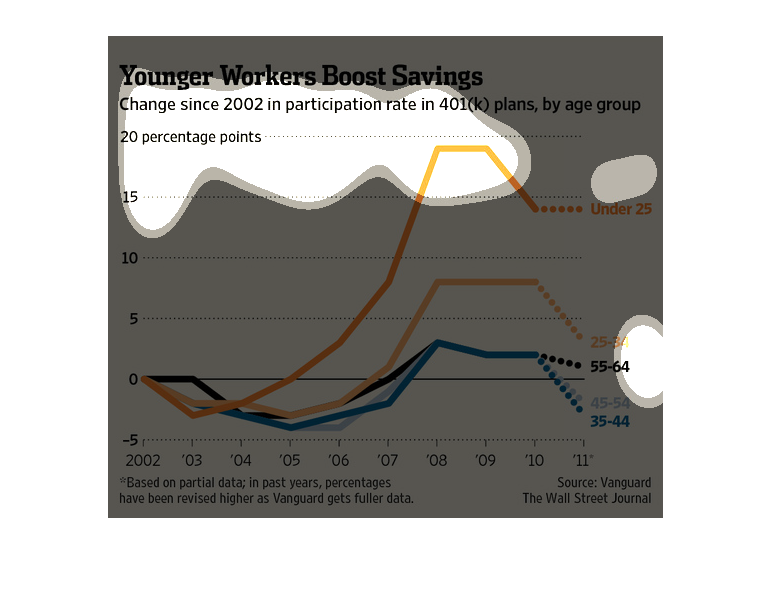
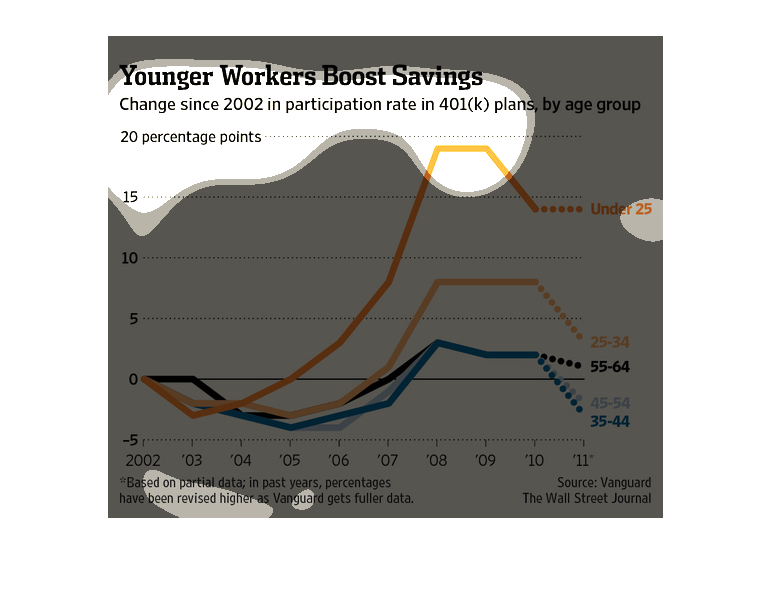
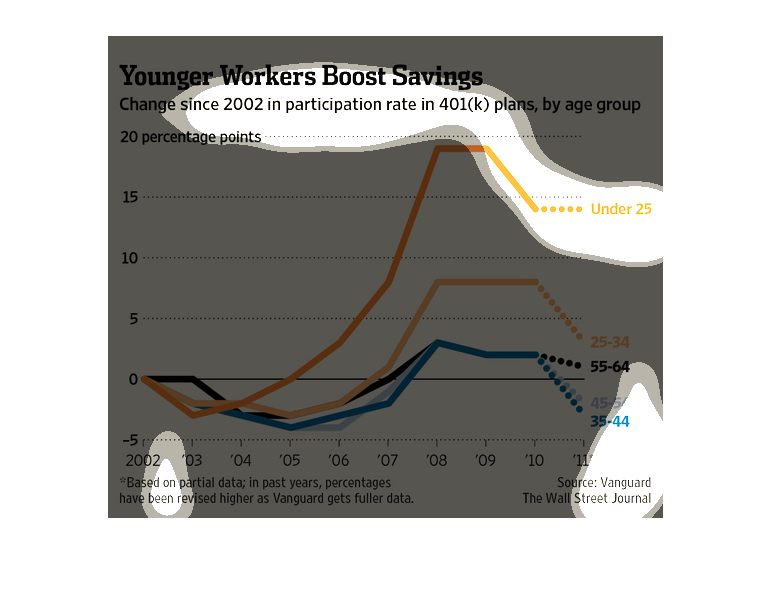
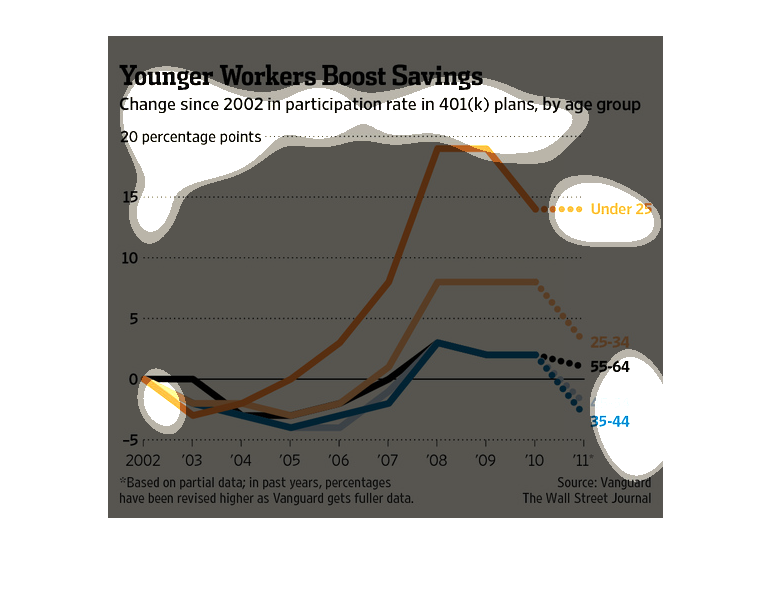
The image depicts the change in participation of 401k plans, by age group. All age groups
have seen a decline in participation of 401k plants, with the 25 and under age group having
highest participation overall.
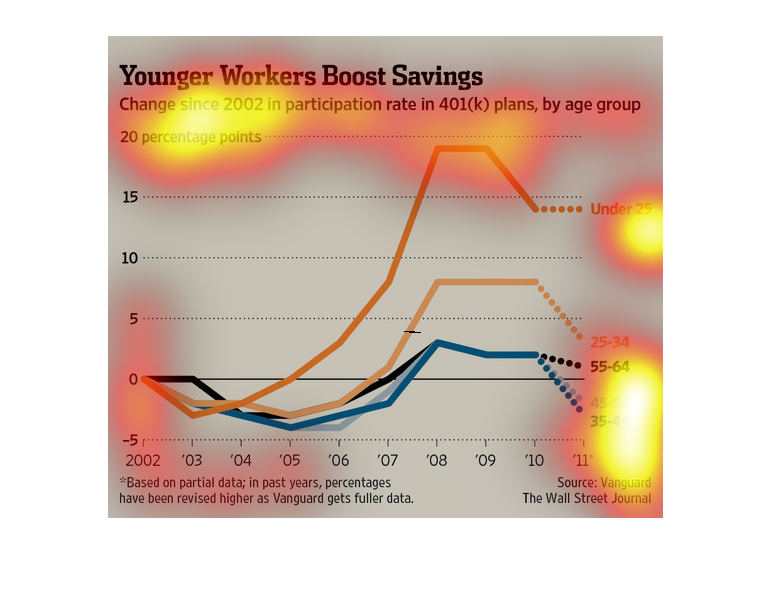
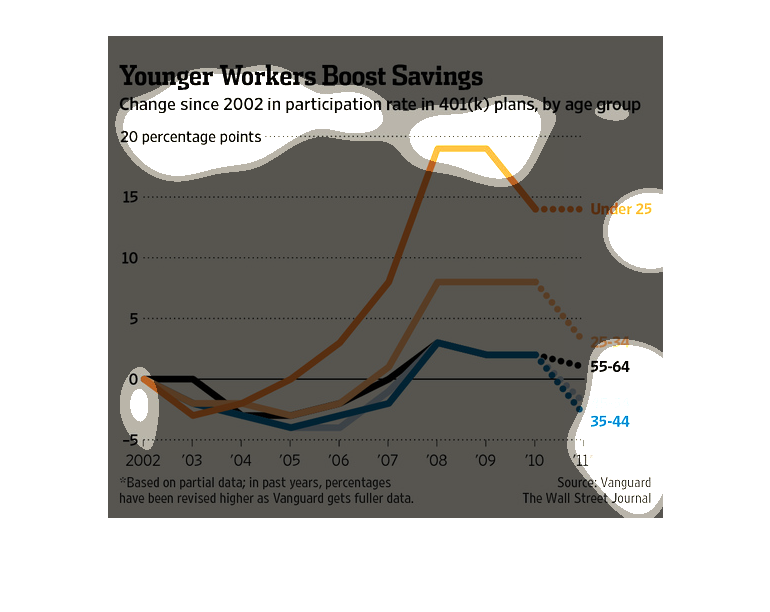
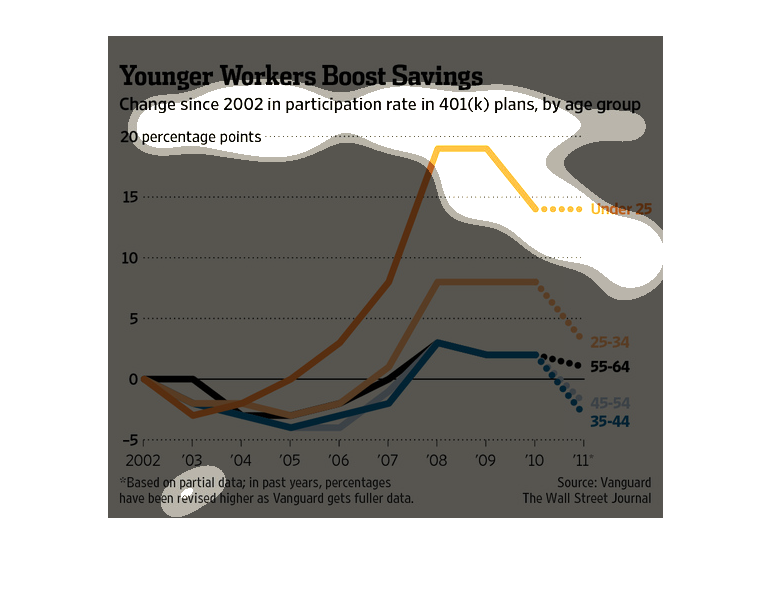
This is a graph of the number of participants in 401k plans by age group. The data shows that
there is a major surge among younger workers that participate.
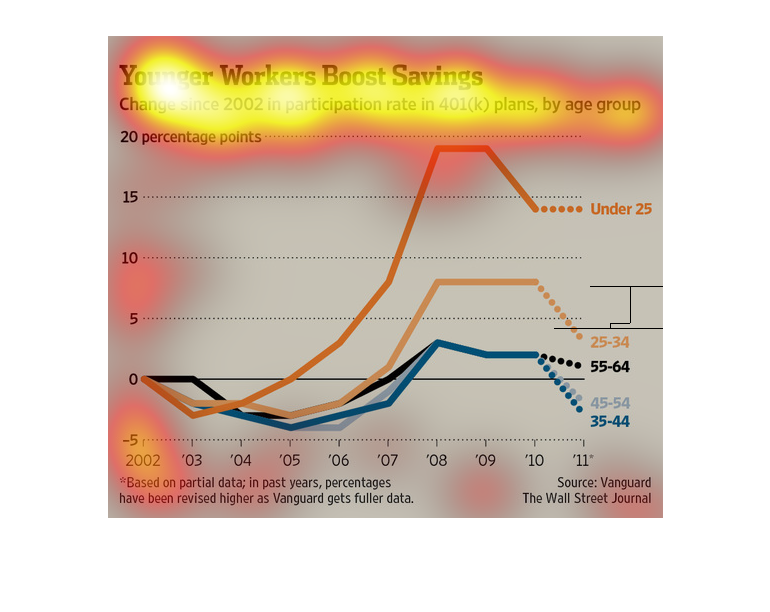
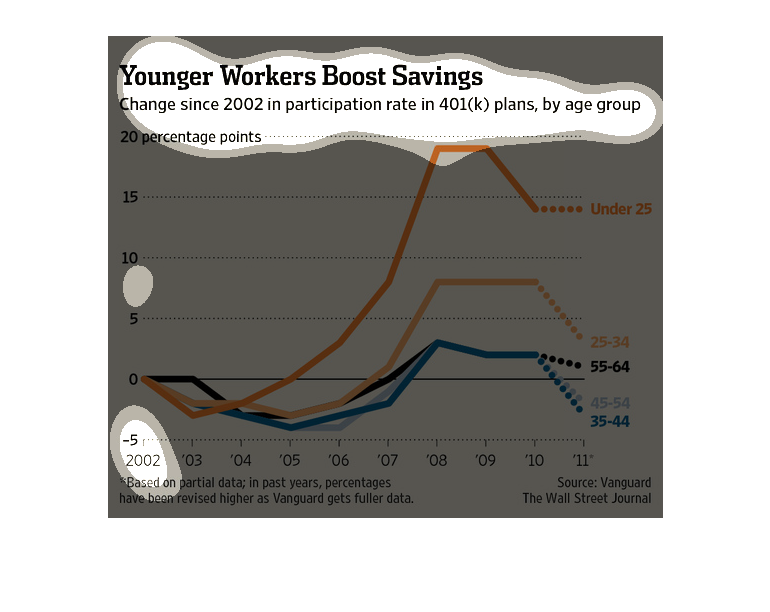
This is a color coded chart and related statistics depicting the change since 2002 in the
participation rate in 401(k) plans by age group and shows that the largest gains are in the
under 25 demographic.
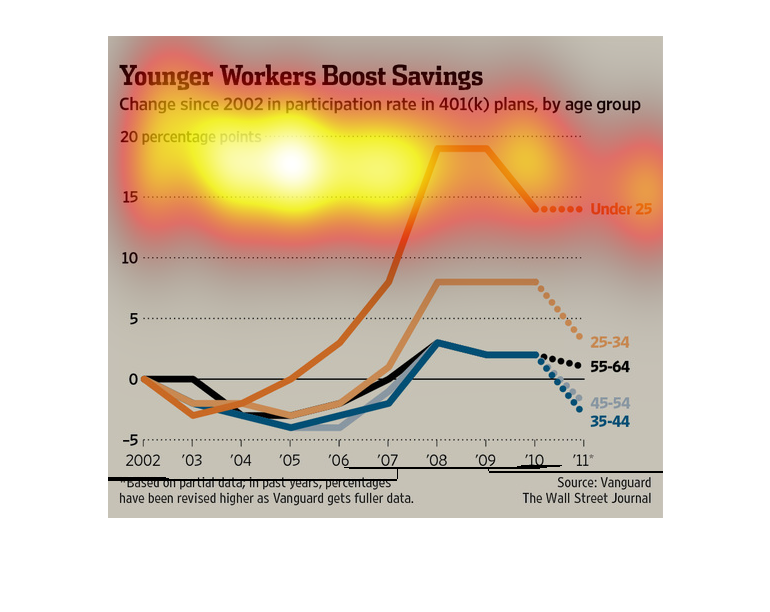
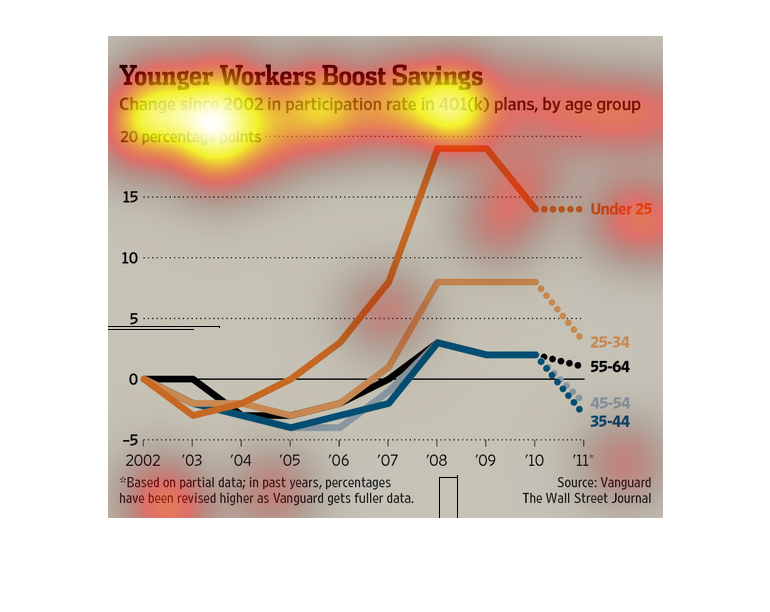
Since 2002, younger workers have added more to savings, now surpassing all age groups over
age 25. A full 20% contributed to a savings plan, in contrast to 2005 and earlier, when savings
rates among younger workers was essentially zero.
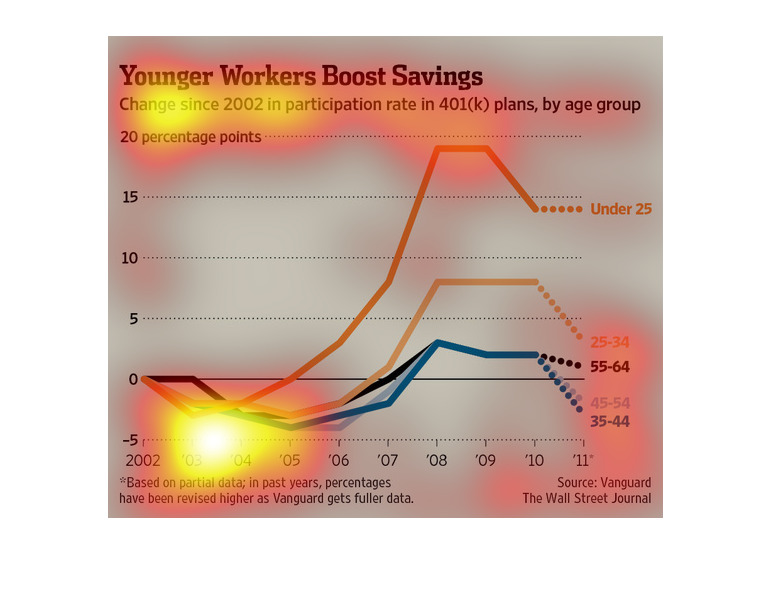
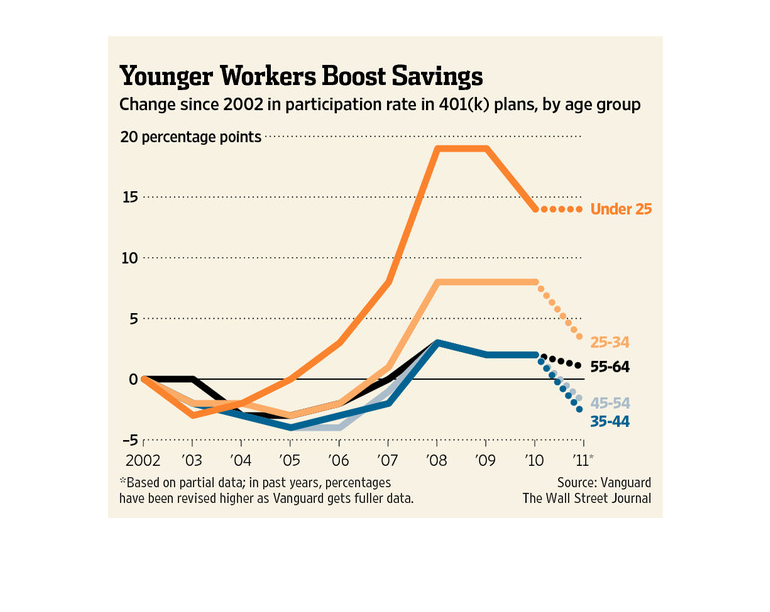
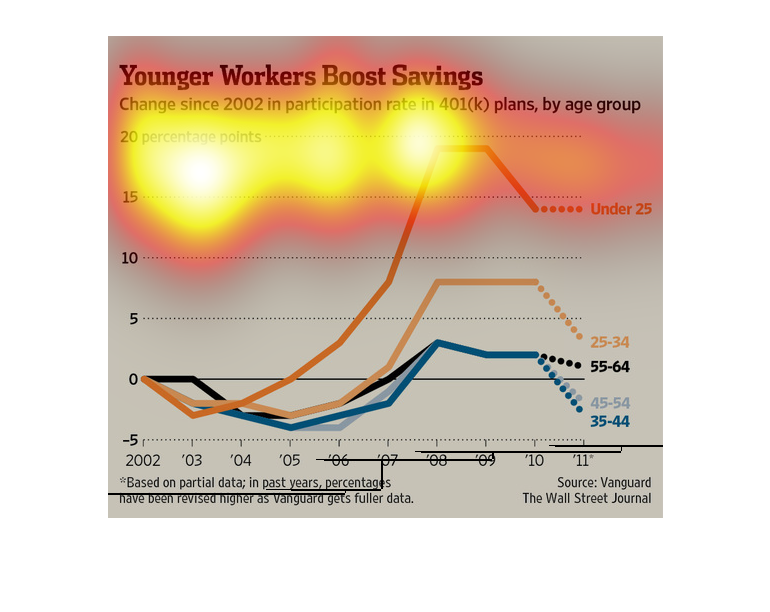
This chart describes how younger workers are participating in 401 (K) opportunities in the
workplace. In about 2008, the age range of under 25 contributed 20 percentage points to savings.
This graph shows the change in savings by young workers. The change is documneted and shown
since 2002. The changes are shown in the form of line graphs.
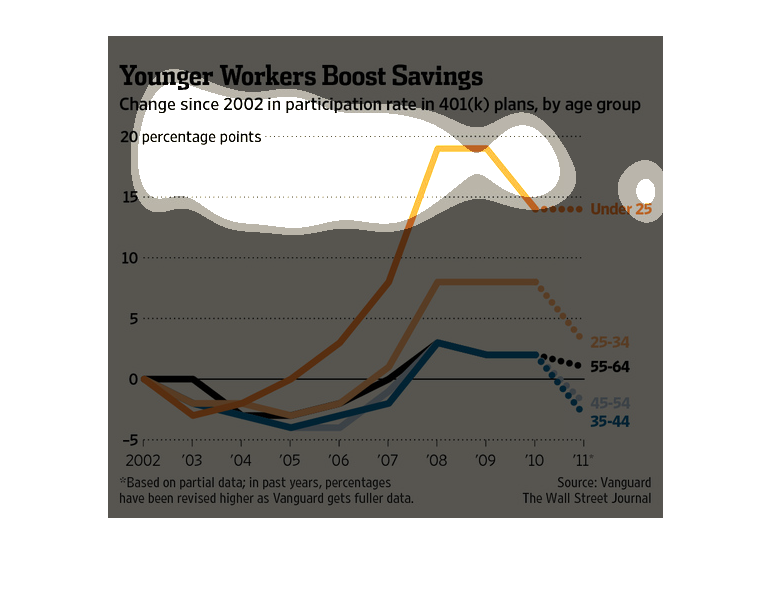
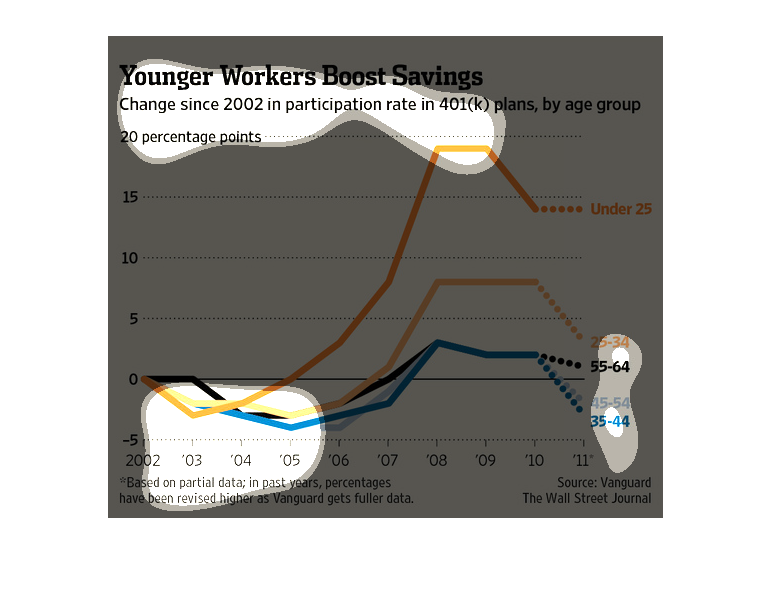
The image depicts changes since 2002 in participation rate in 401k plans, by age group. 401k
participation rates climbed from 2002-2008 for all demographics, and then steadily declined
for all demographics, with the Under 25 age group having an overall higher participation rate
than other age groups.
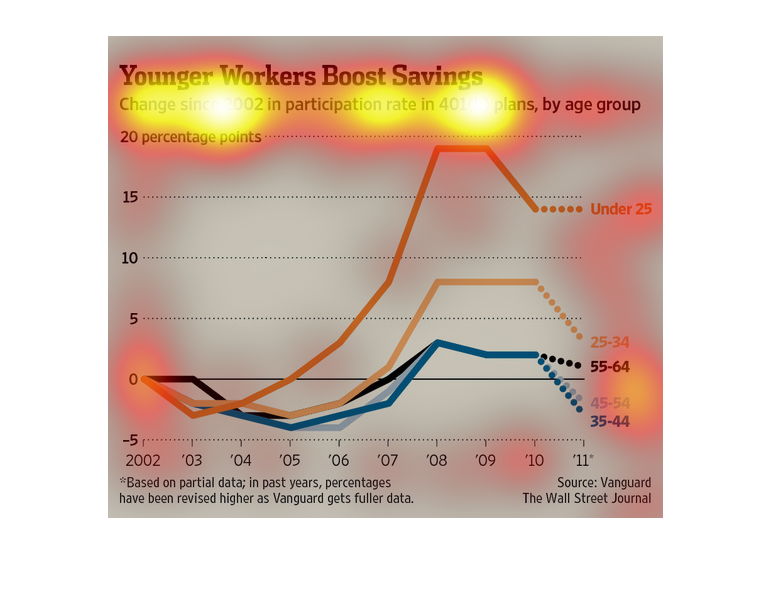
This chart  younger workers boost savings. Specifically, that the change since 2002 in participation
rate in 401(K) plans, by age group 20 percentage points.
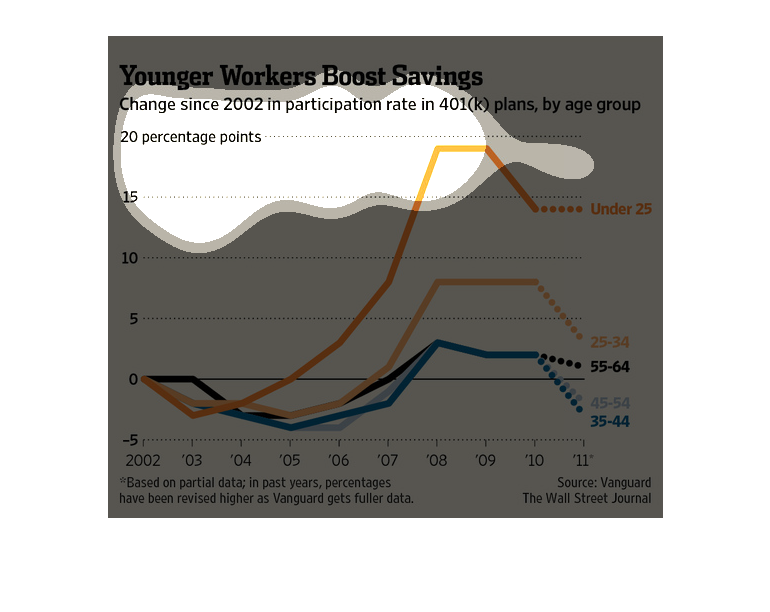
This is a graph showing the 401k distributions by age group and how they have changed since
2002. The "under 25" age group has seen a 15% change in contributions over time, by far the
most compared to the other age groups.
This is a color coded chart depicting the change since 2002 in the participation rate in 401(k)
plans by age group from the years 2002 to 2011. It shows the highest gains in the under 25
demographic.
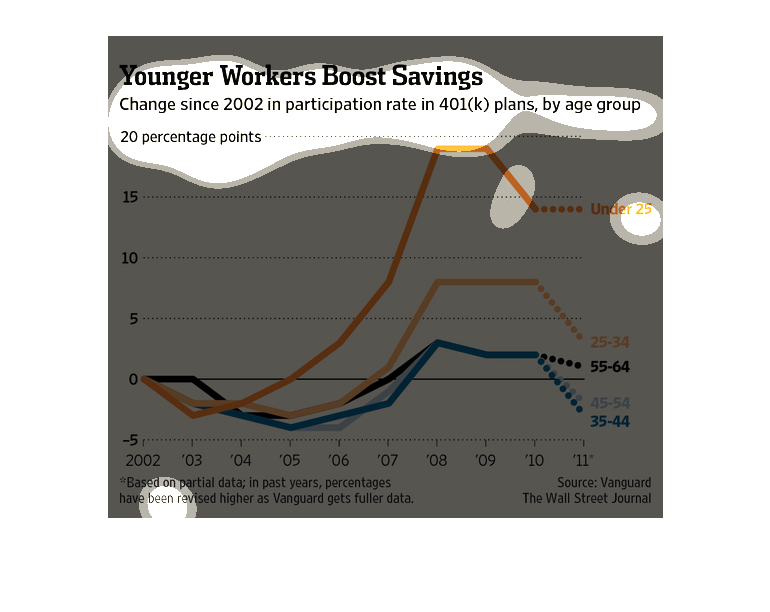
The following chart shows a huge increase in the amount of money that people under the age
of 25 are now putting into 401 Ks. Shows that the number has increase a lot over the last
10 years.