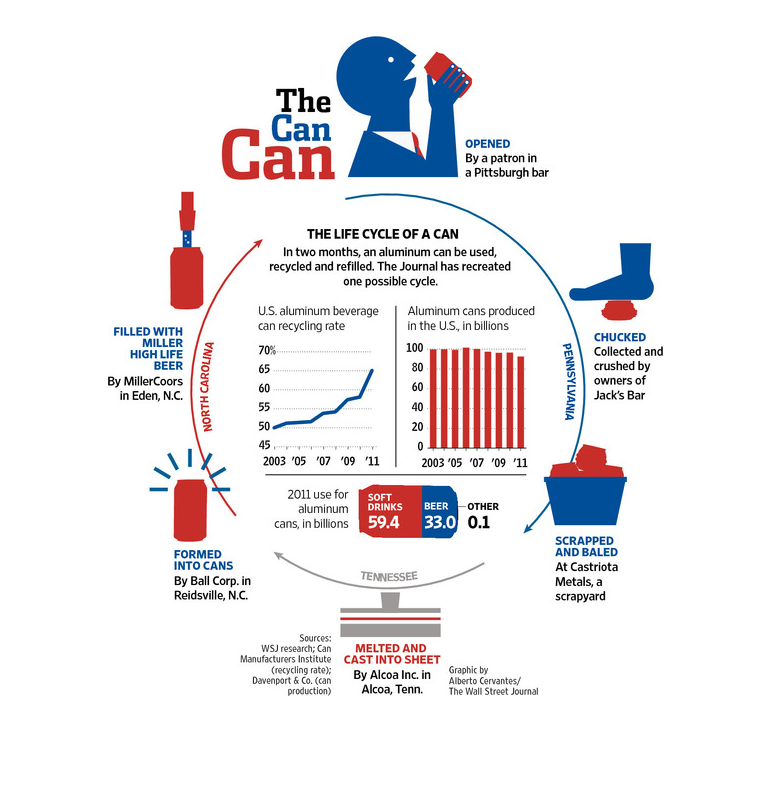
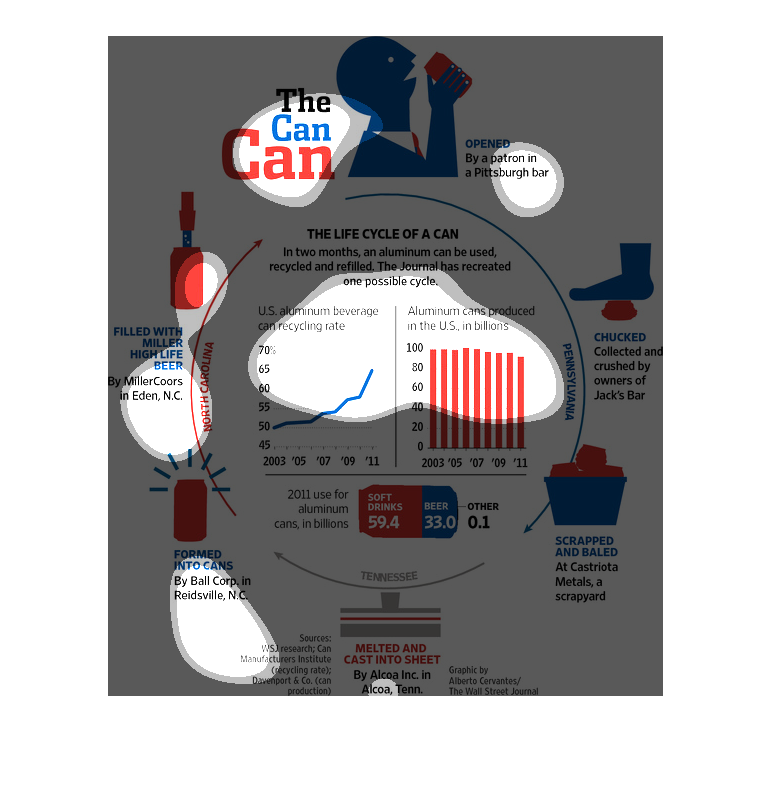
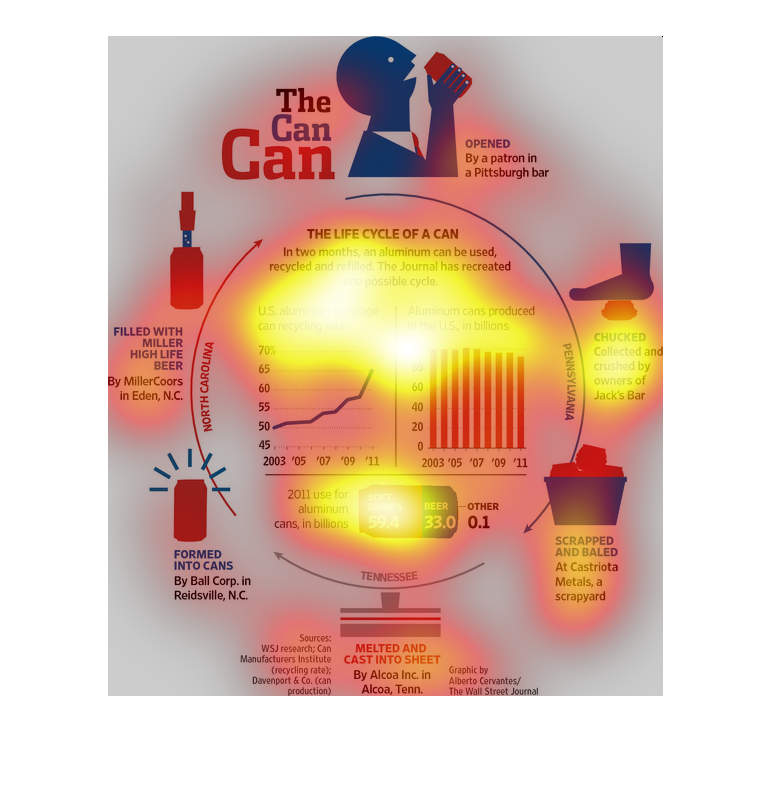
This chart shows the life cycle of a can. The cycle begins with the raw materials that make
the basic can that is filled with soda or beer. After the beverage is consumed, it is processed
and recycled back into a new can sometimes. The chart seems to indicate that most of the recycled
cans that reach Alcoa in TN are beer cans.
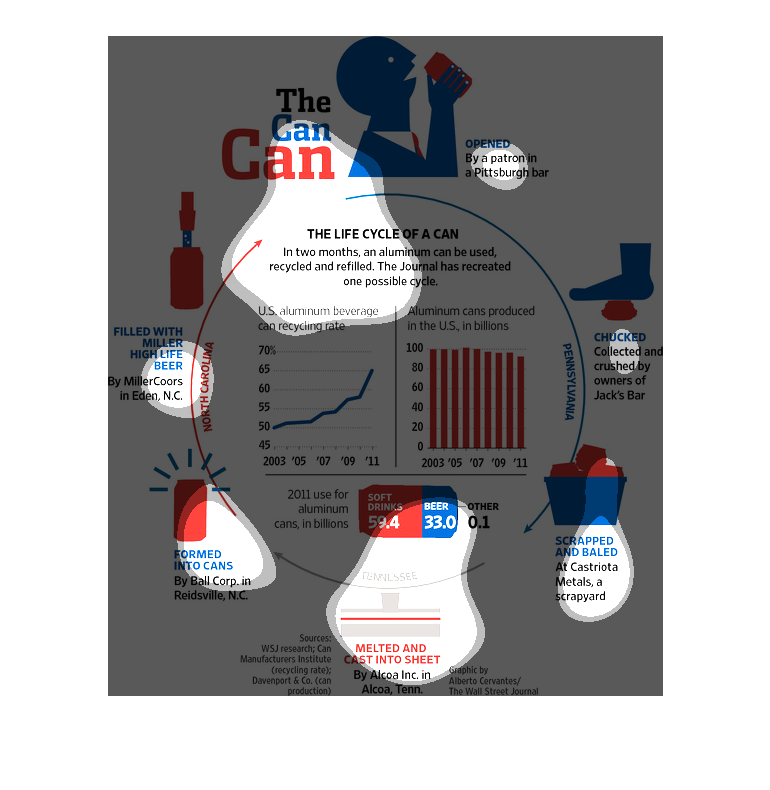
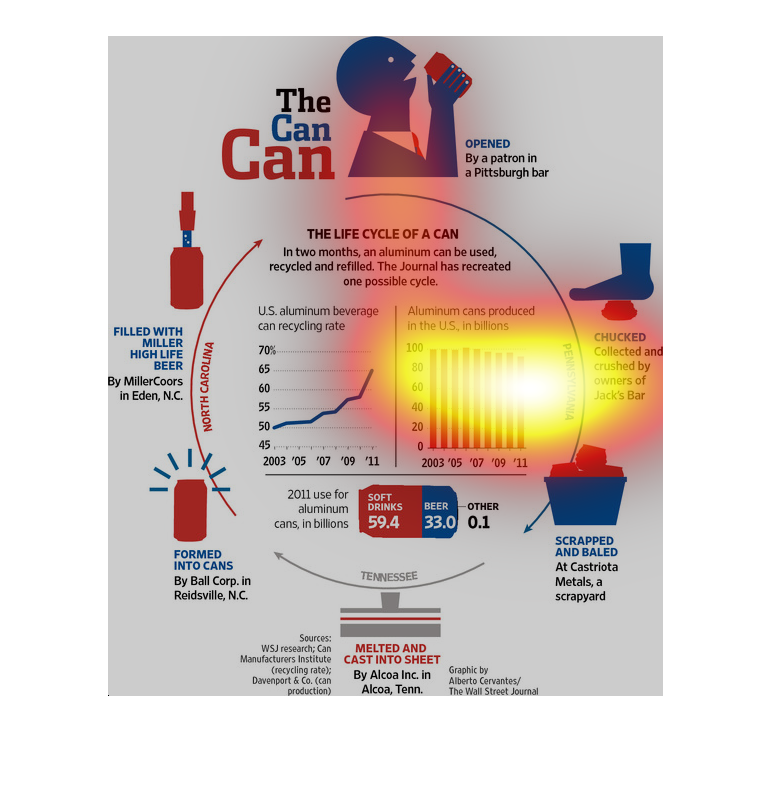
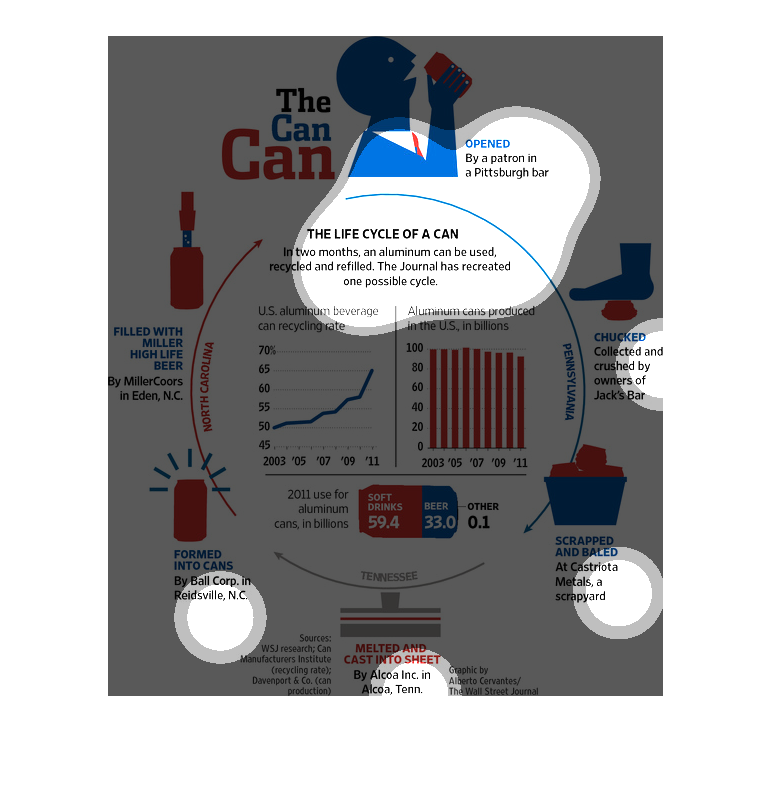
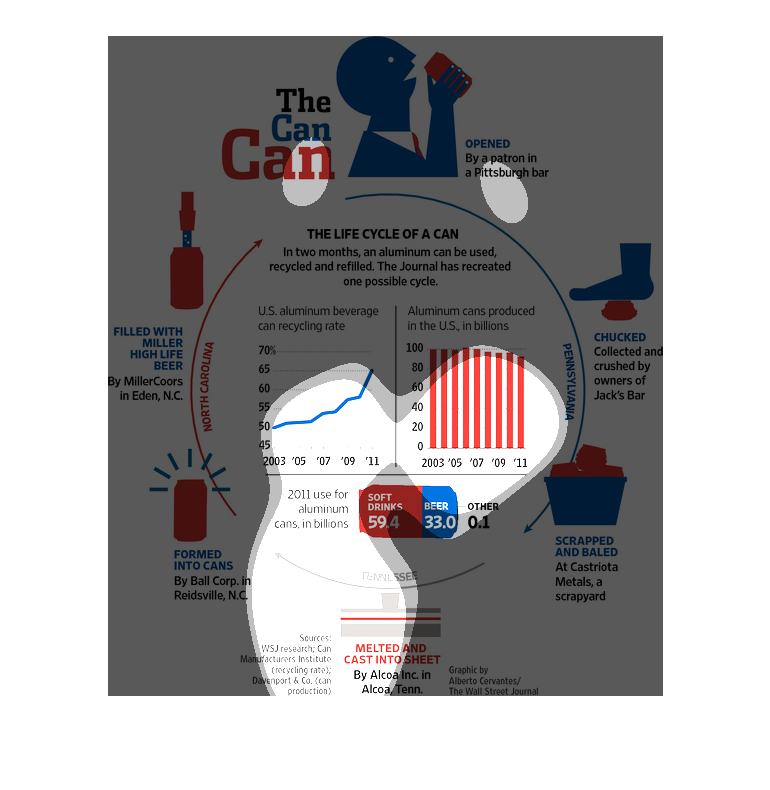
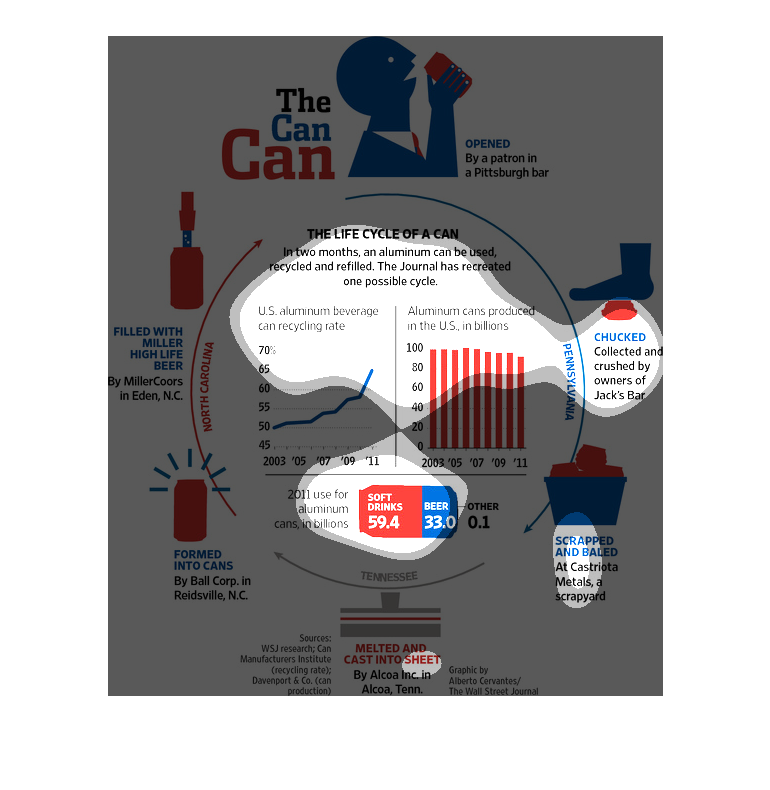
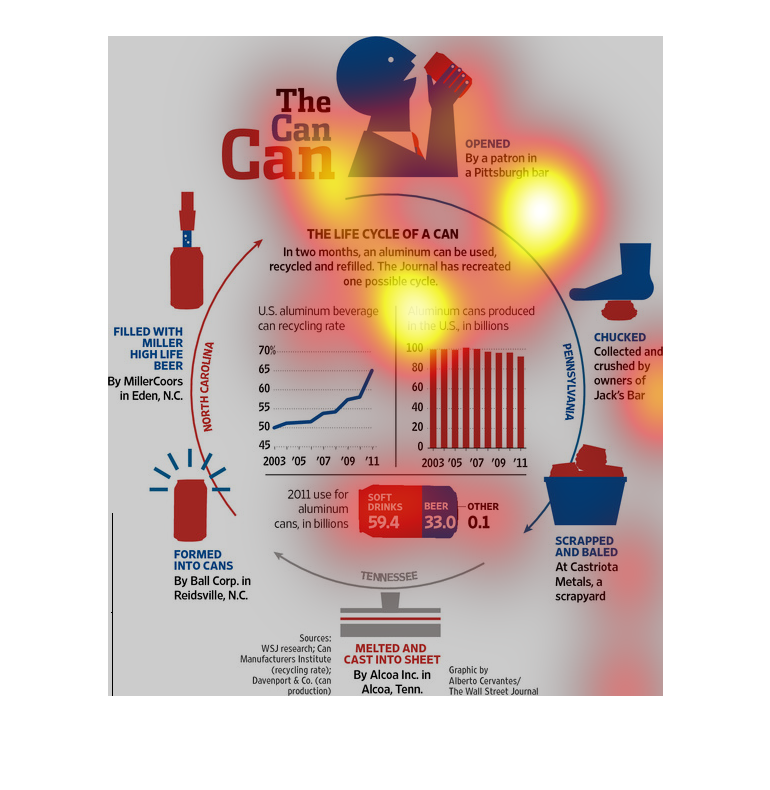
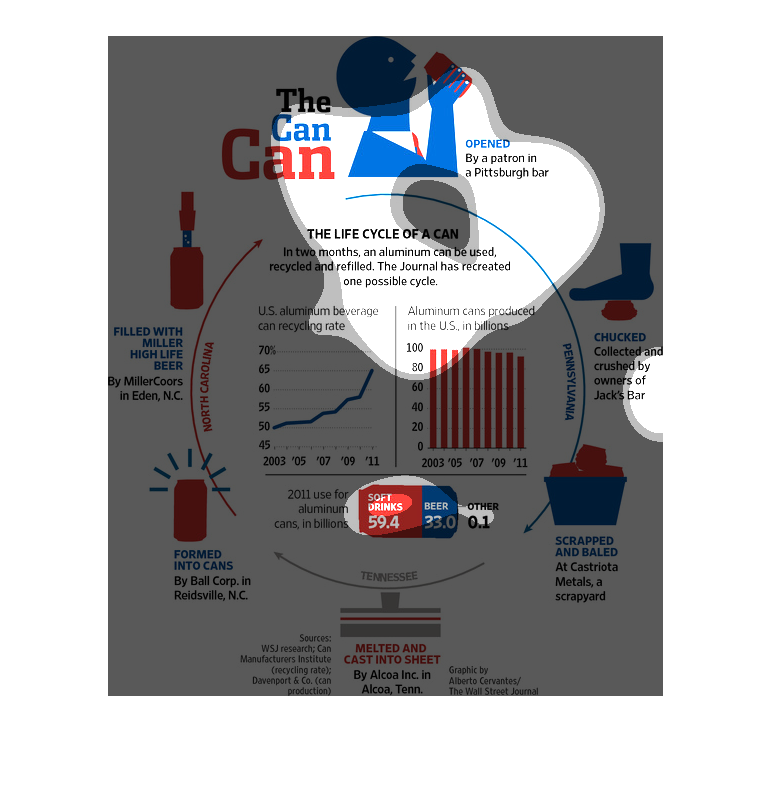
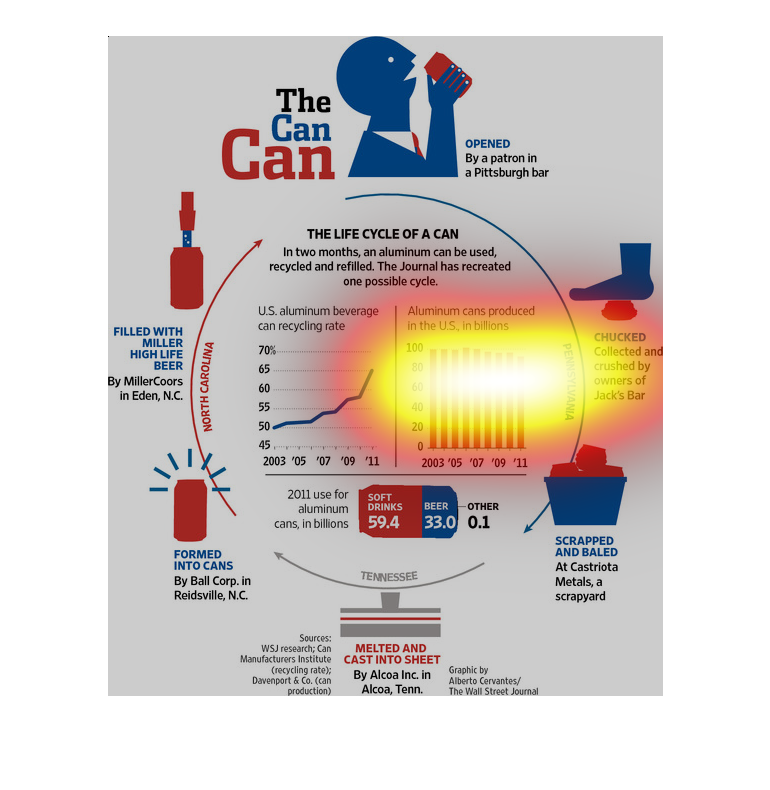
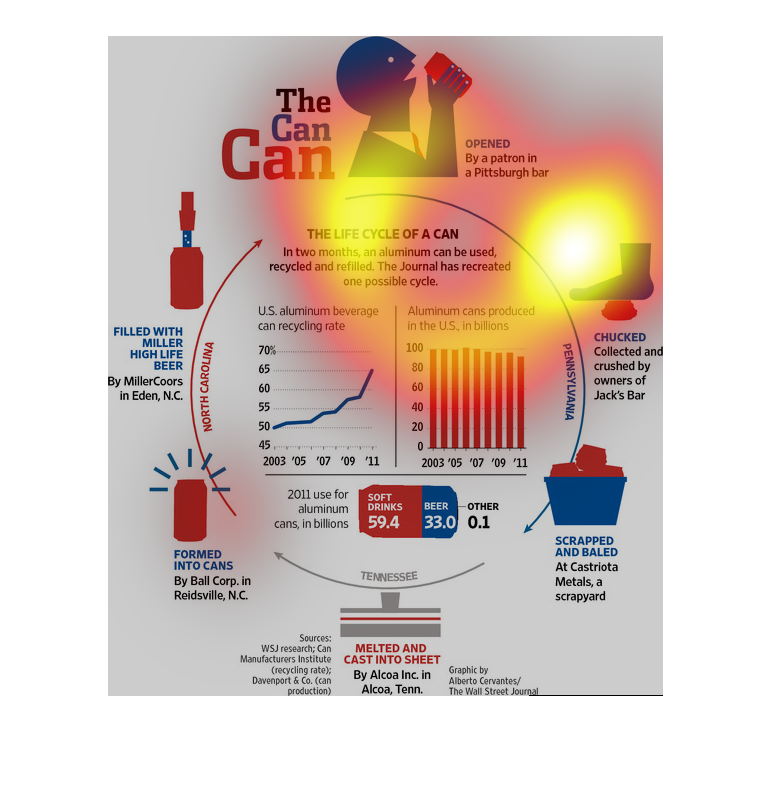
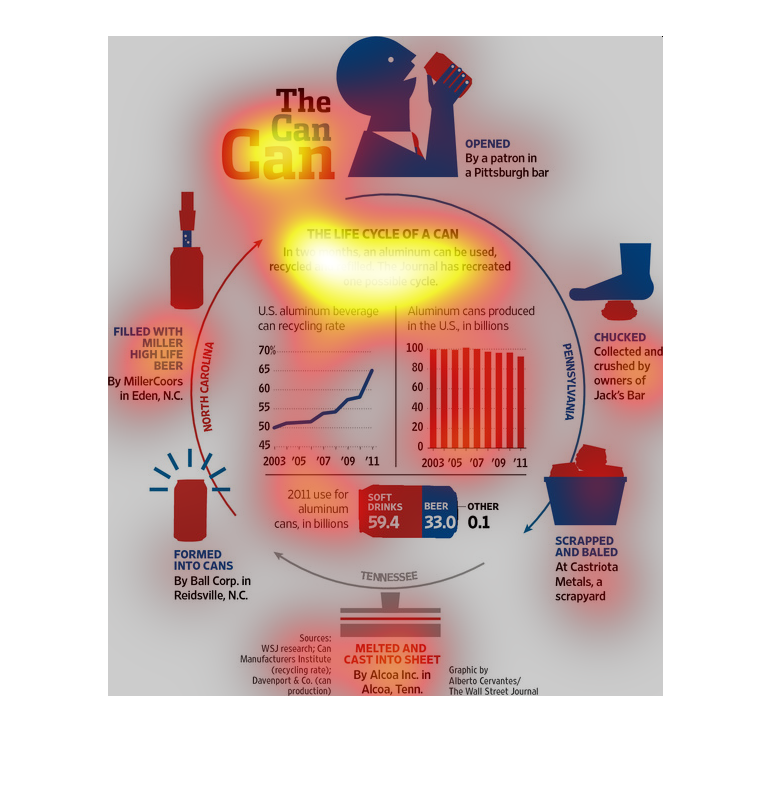
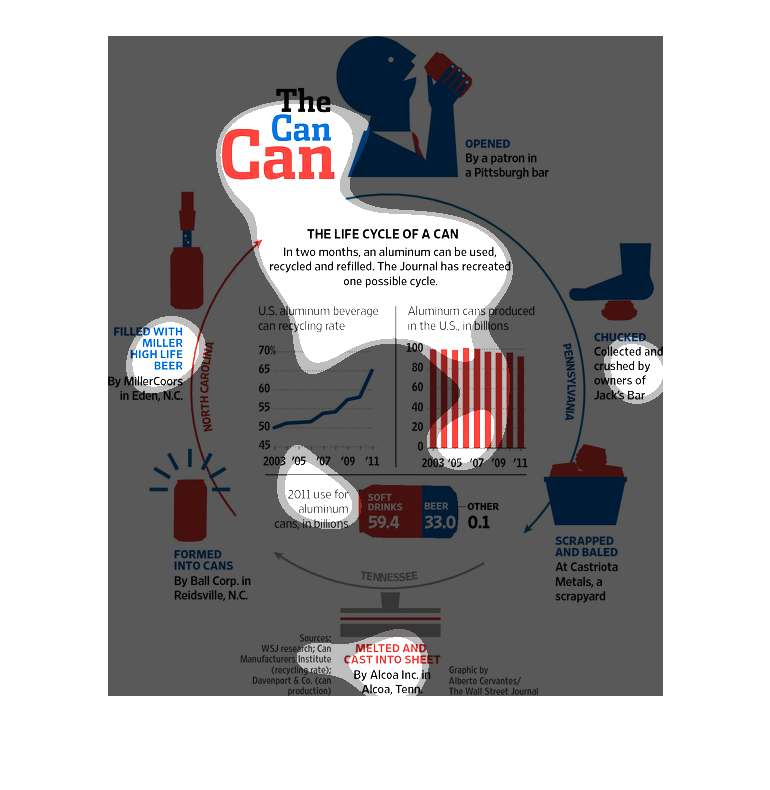
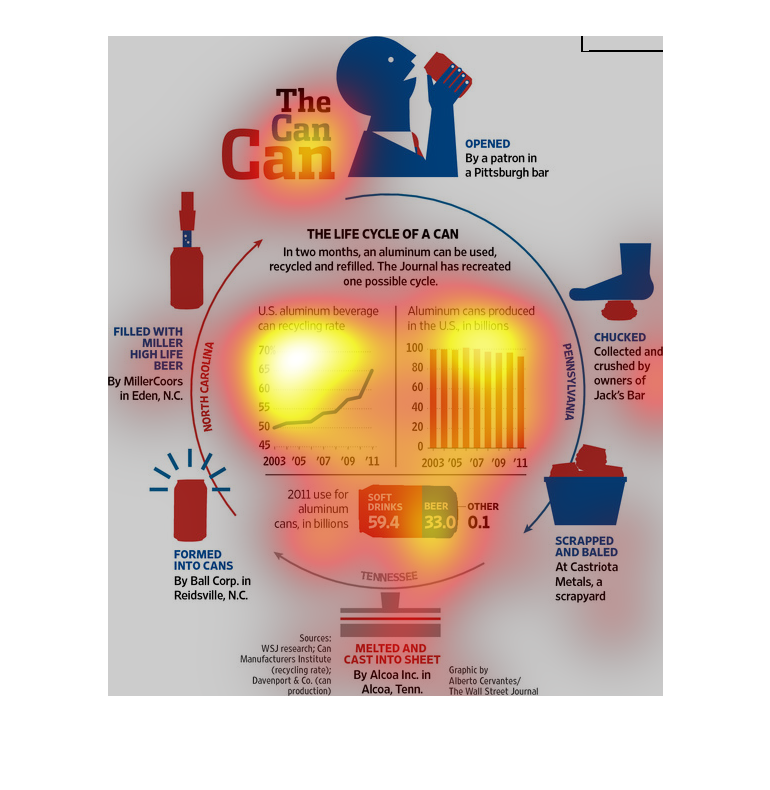
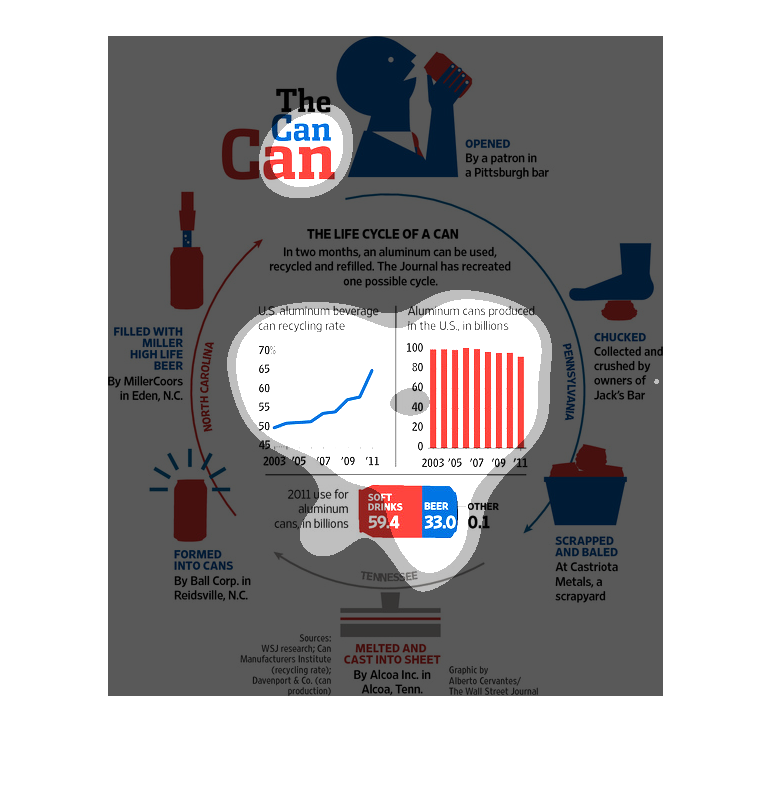
This infographic is explaining the life cycle that an aluminum can travels from being used
by the consumer,sent through the recycling and manufacturing process, and then back to the
consumer. Smaller graphs demonstrate the dramaticly increasing usage as well as the subtly
decreasing production of aluminum cans.
The life cycle of a can recycling.   Customer open can, drinks from it, chiucks, it and then
some poor ass homeless person retrieves it and then get money for it at the recycling place
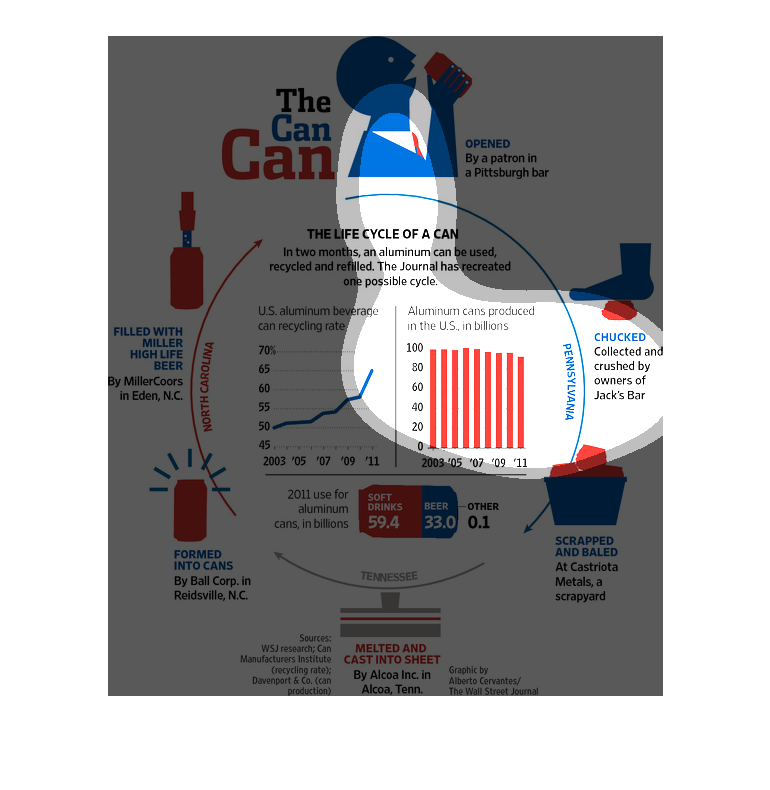
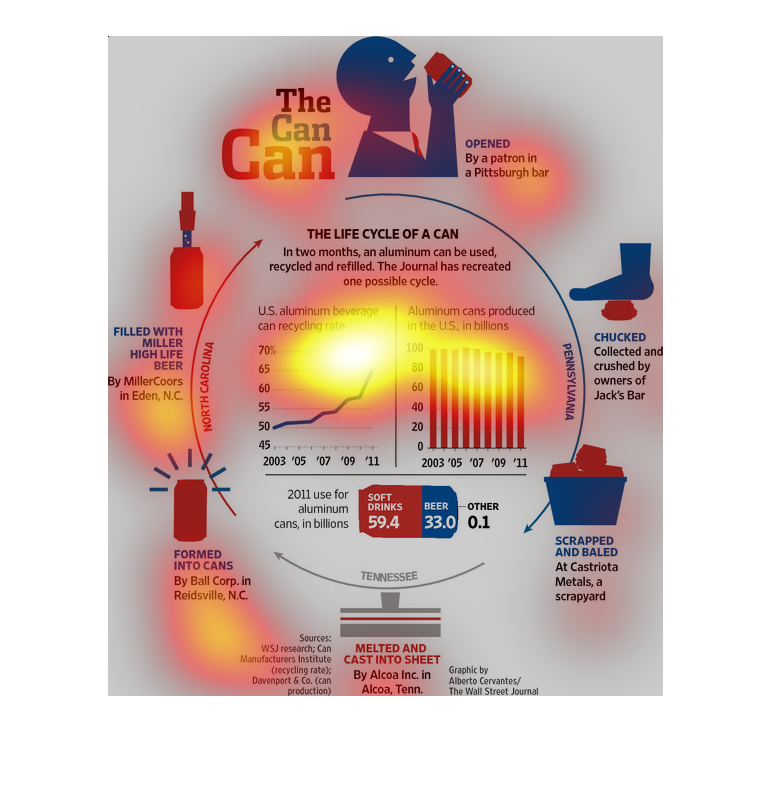
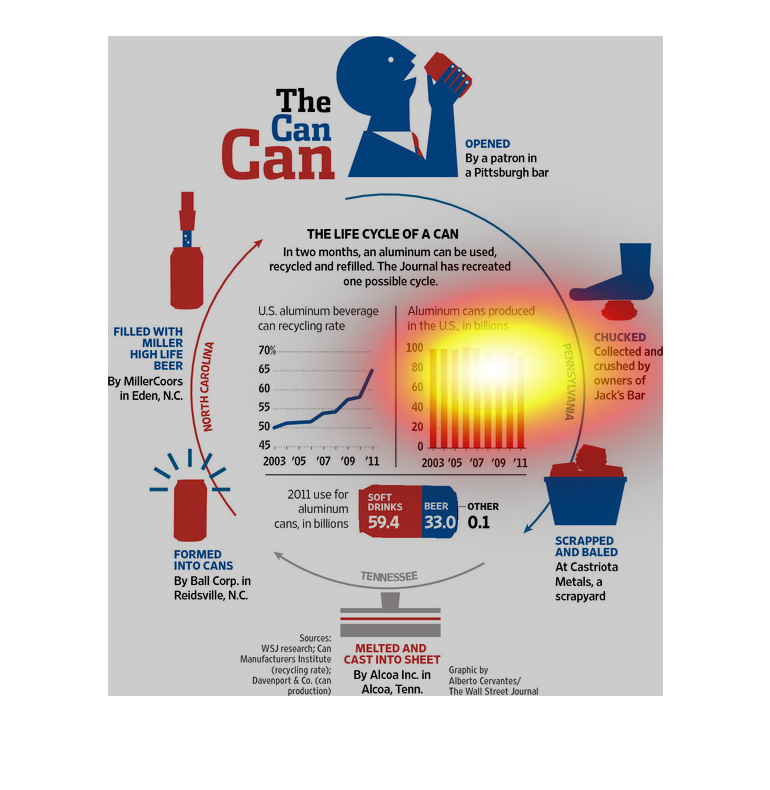
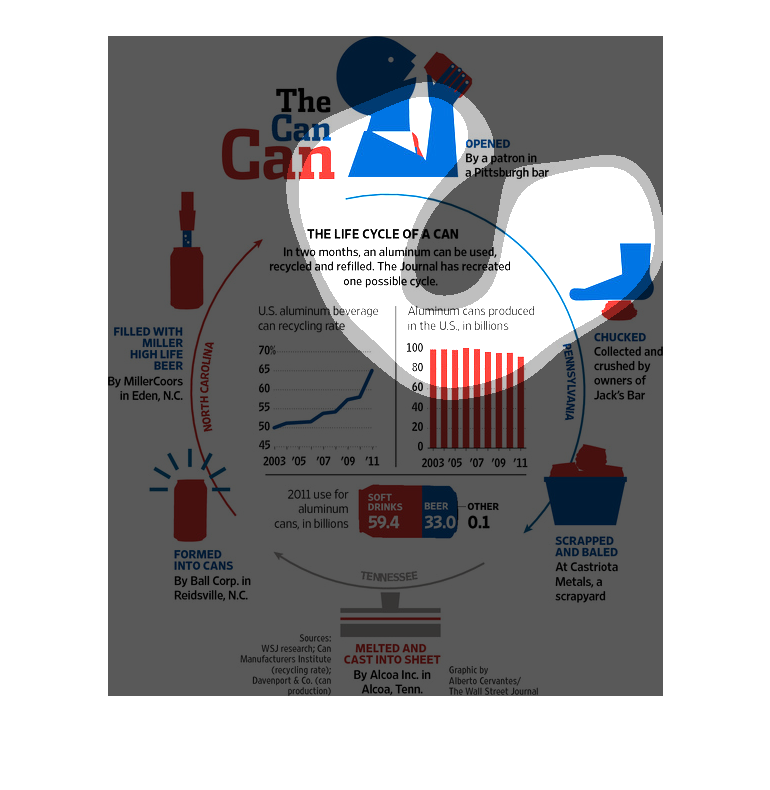
A infographic showing the life cycle of an aluminum can in the united states. Showing that
billions are produced each year and recycling of cans has increased exponentially

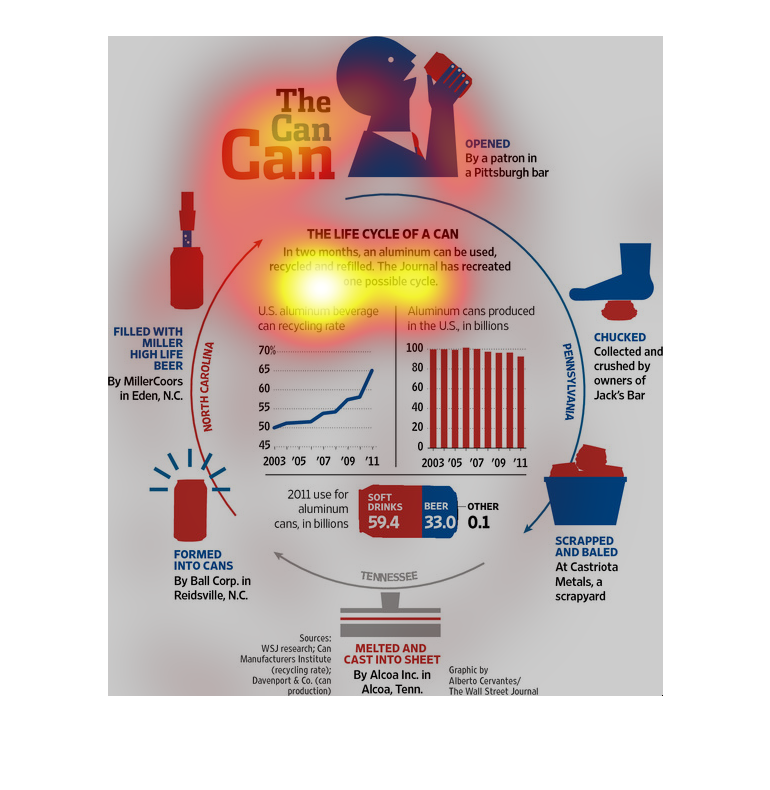
The image depicts the life cycle of an aluminium can, and shows one specific scenario in which
a can is used, recycled and then refilled. Statistics are also listed for the different things
for which cans are used.
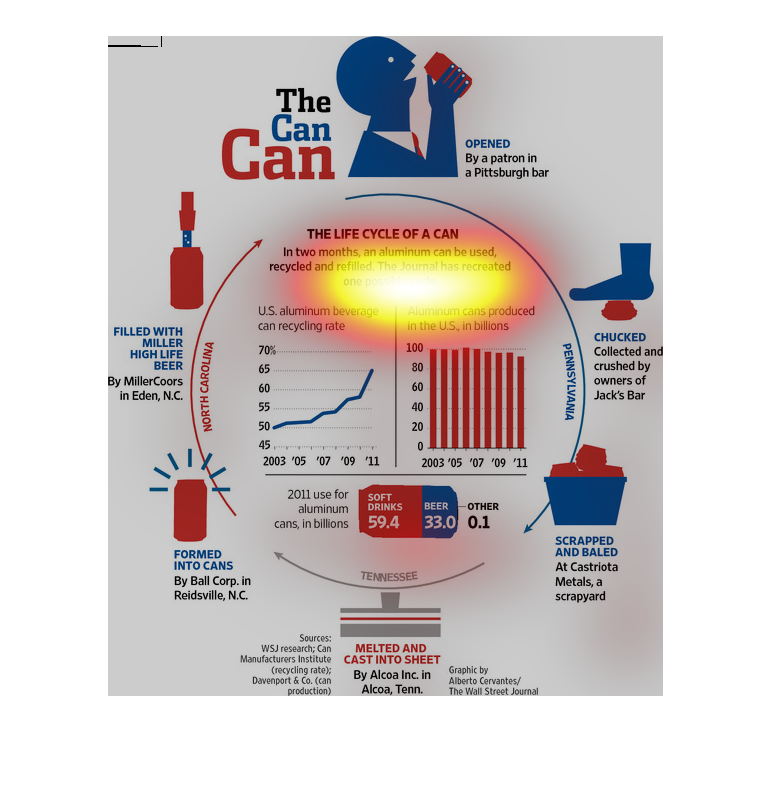
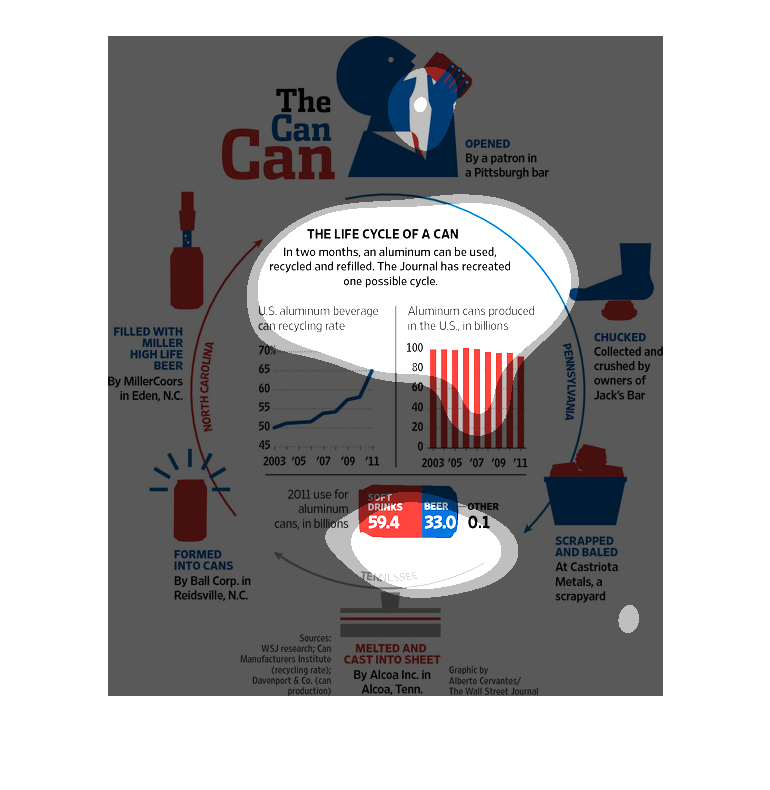
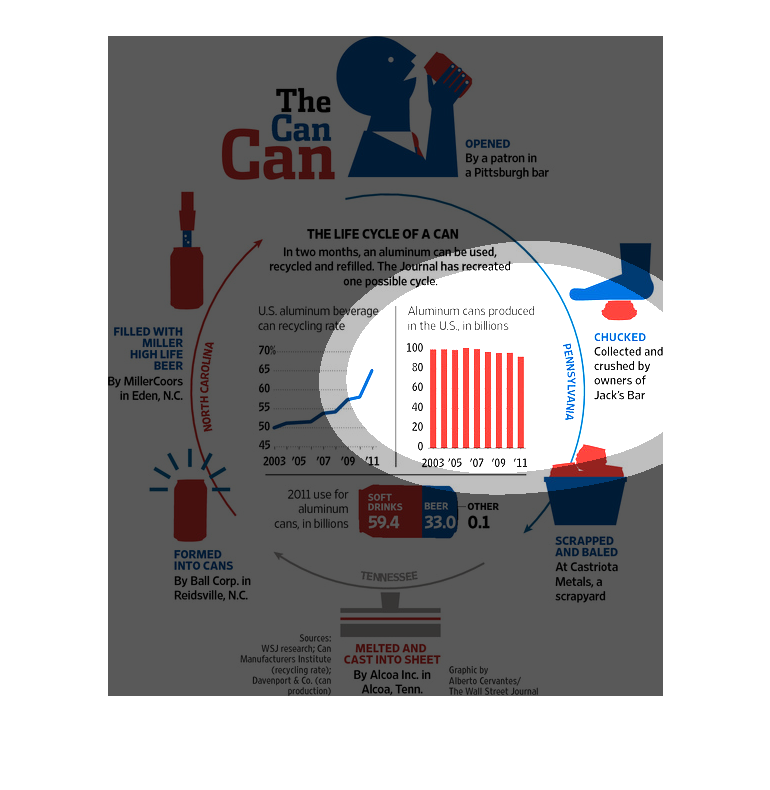
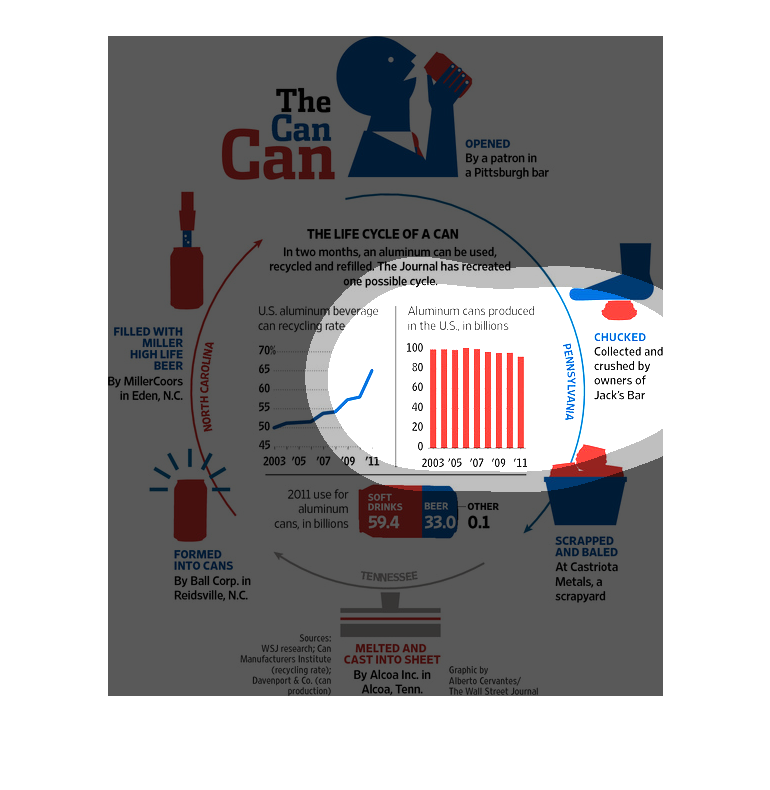
The image shows statistics up to 2011 for aluminum can use and recycling. The outer ring of
images shows how different companies and businesses use their discarded aluminum cans by recycling
or repurposing them. The inner three graphics show can production estimates since 2003, the
rate of recycled cans since 2003, and that percentage of cans that were used for soft drinks
or beer in 2011. Interestingly, can recycling has gone up while can production has gone down.
While beer makes up about a third of aluminum can use, soft drinks dominates most of the remaining
two thirds,
This is a very cool circle graph. It shows the life cycle of a can from being used to going
all the way around that chart being recycled and reused and refilled again. It show's each
step to the can being recycled and shows the benefits of this.
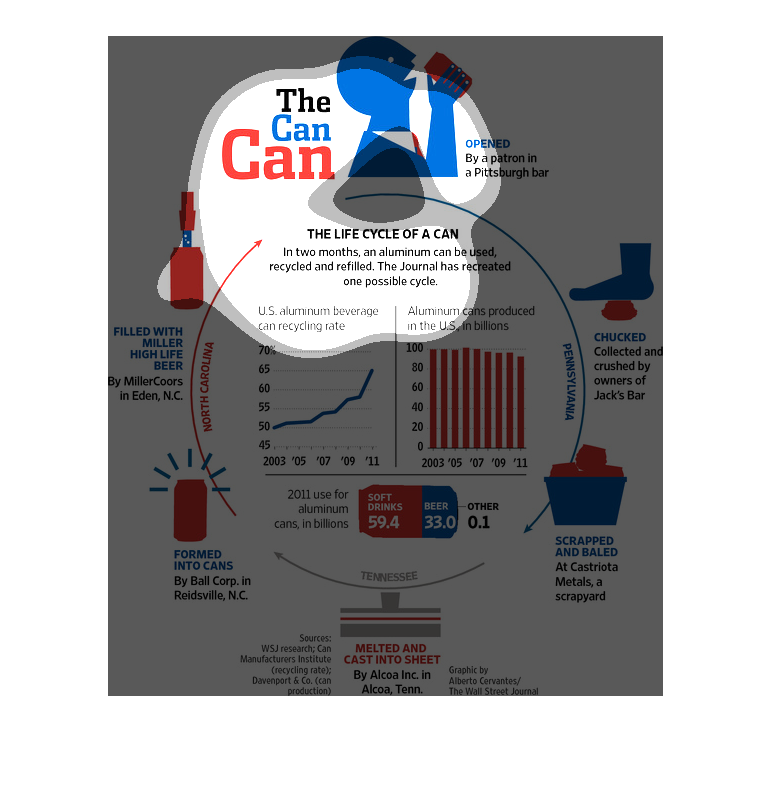
This is a color diagram showing a graphical representation of the life cycle of an aluminum
can from the point of a consumer opening the product to varying streams of disposal.
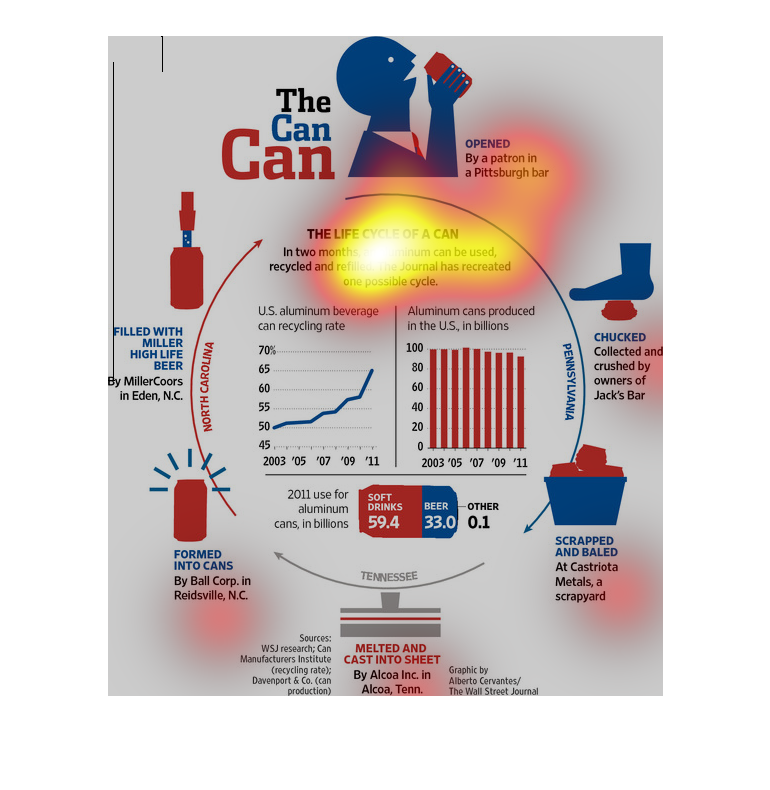
The image depicts the life cycle of an aluminum can. The image demonstrates a two month window
in which the can is used, recycled, and then refilled. This is one possible cycle of what
can occur.
This chart describes the life cycle of a can. Specifically, in two months, an aluminum can
be used, recycled and refilled. The journal has recreated one possible cycle.
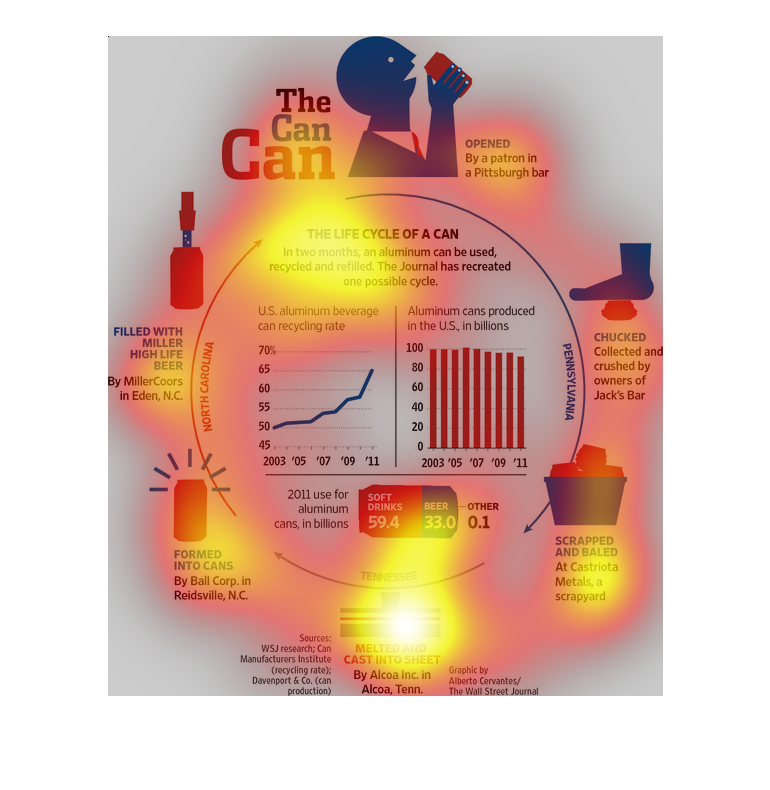
This graph illustrates the life cycle of a can. The graph goes on to illustrate things such
as where the can was made, to where it ended up. The graph is showing the importance of recycling.
This graph shows the life cycle of an aluminum can. It is by a store called The Can Can. It
lists the different ways an aluminum can will be recycled. The different objects it can become.
This is a graphic about aluminum cans that contains three charts. The charts describe the
recycling rate over the years, the production rates over the years, and the uses for the cans.
This chart describes the can can. Specifically, the life cycle of a can. In two months an
aluminum can, can be used recycled and filled. The journal has recreated one possible cycle.