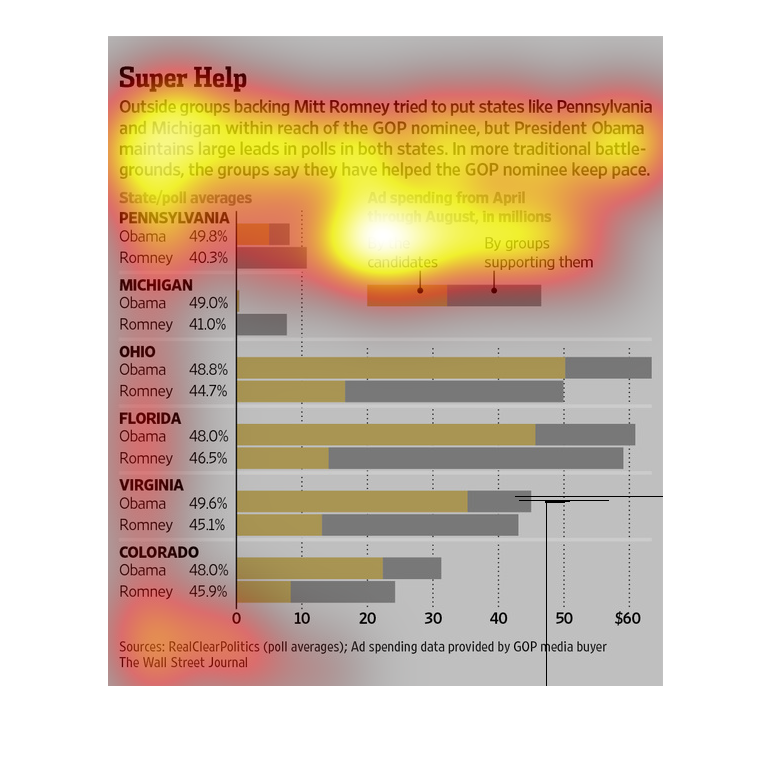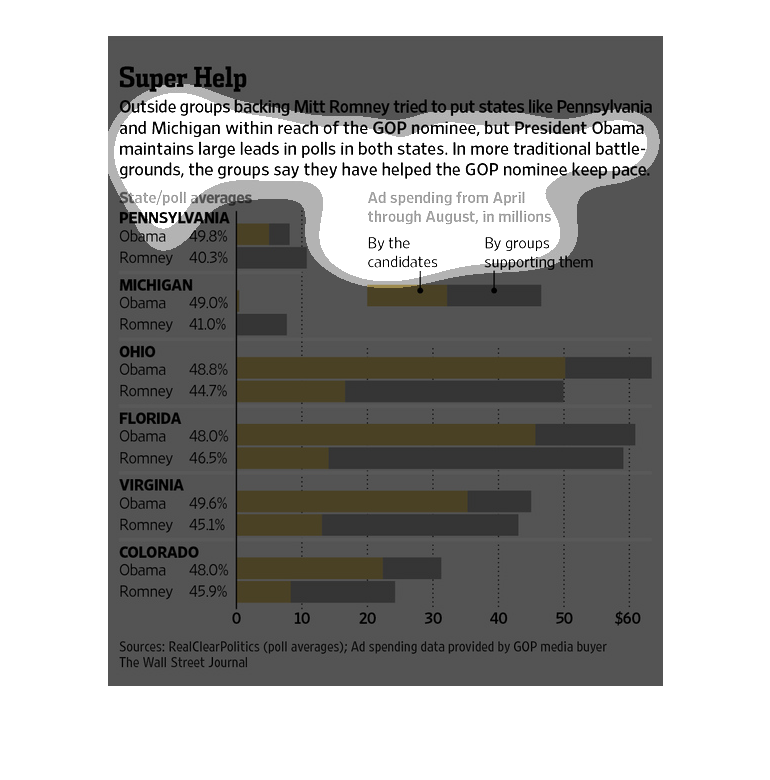
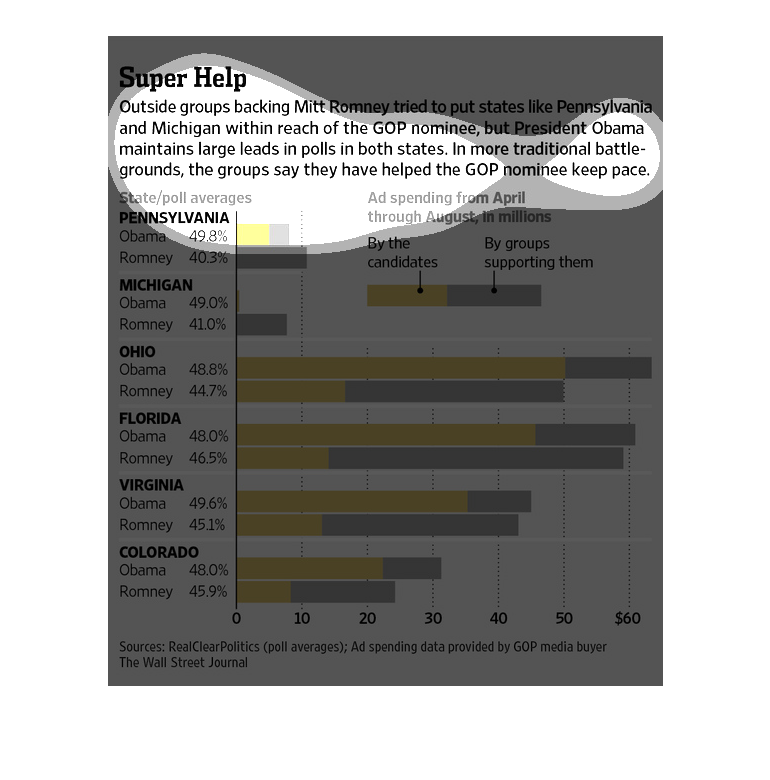
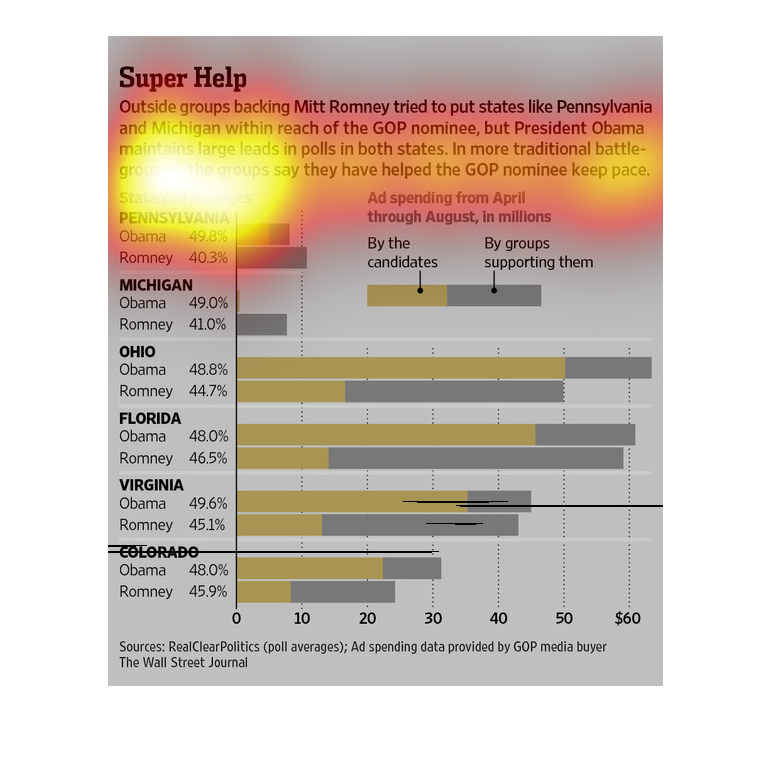
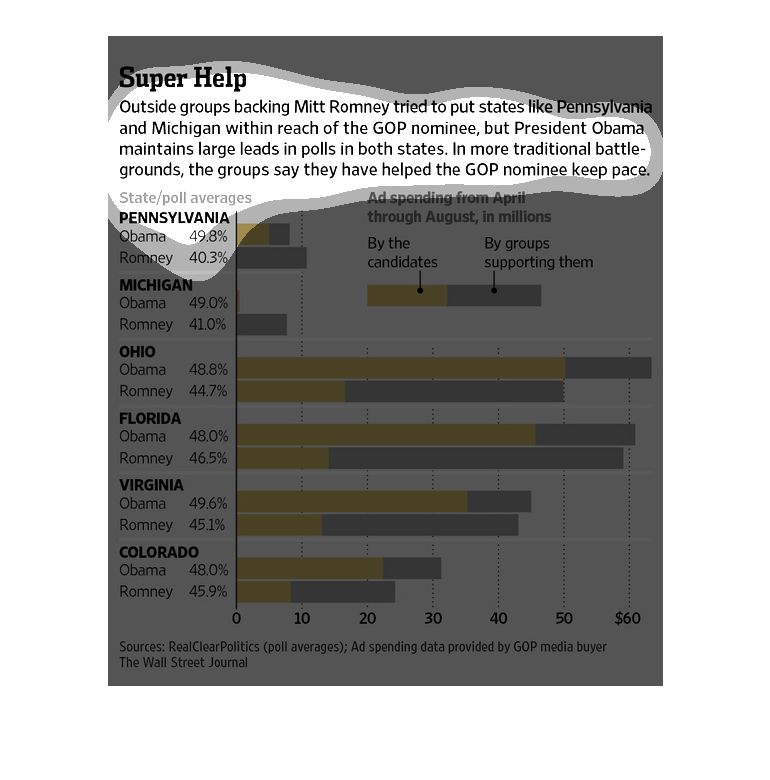
This chart describes super help. Specifically, outside groups backing Mitt Romney tried to
put states like Pennsylvania and Michigan within reach of the GOP.
An infographic of Obama vs Romney presidential election predictions in battle ground states
such as Pennsylvania and Ohio. Romney supporters failed to swing.
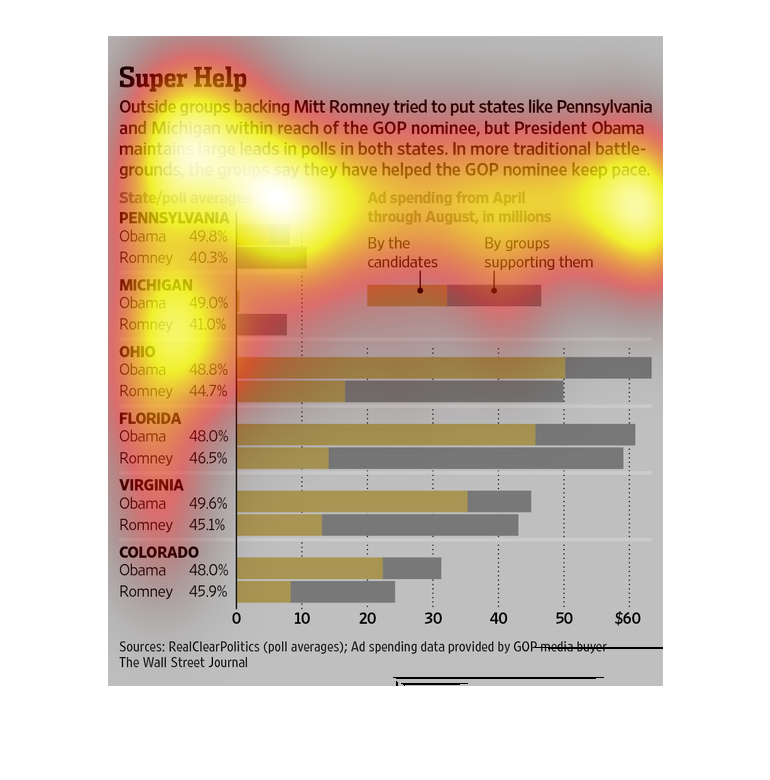
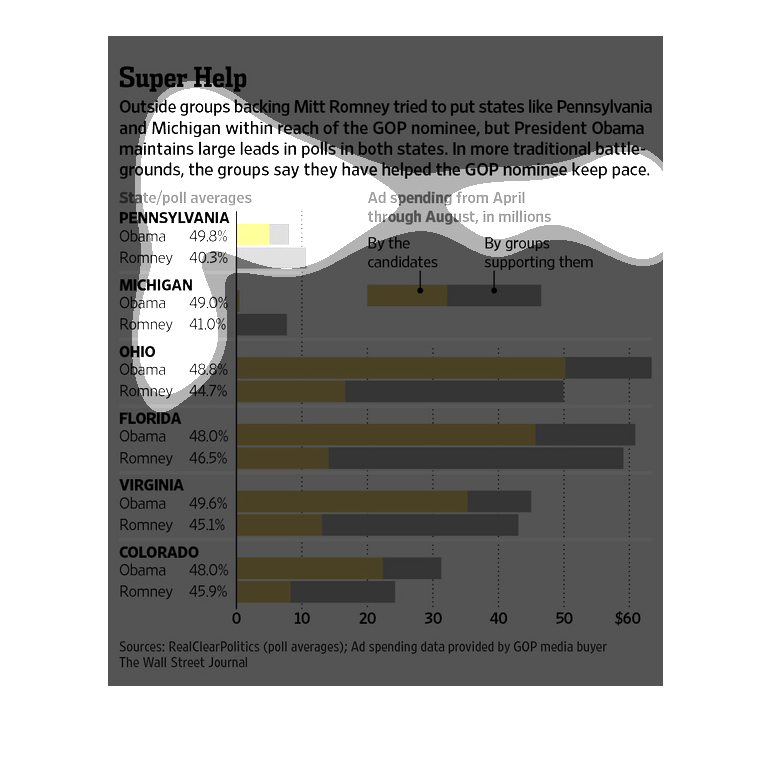
The chart shows the relationship between state voting averages in relation to the amount of
ad funding spent in those states to secure a GOP candidate.
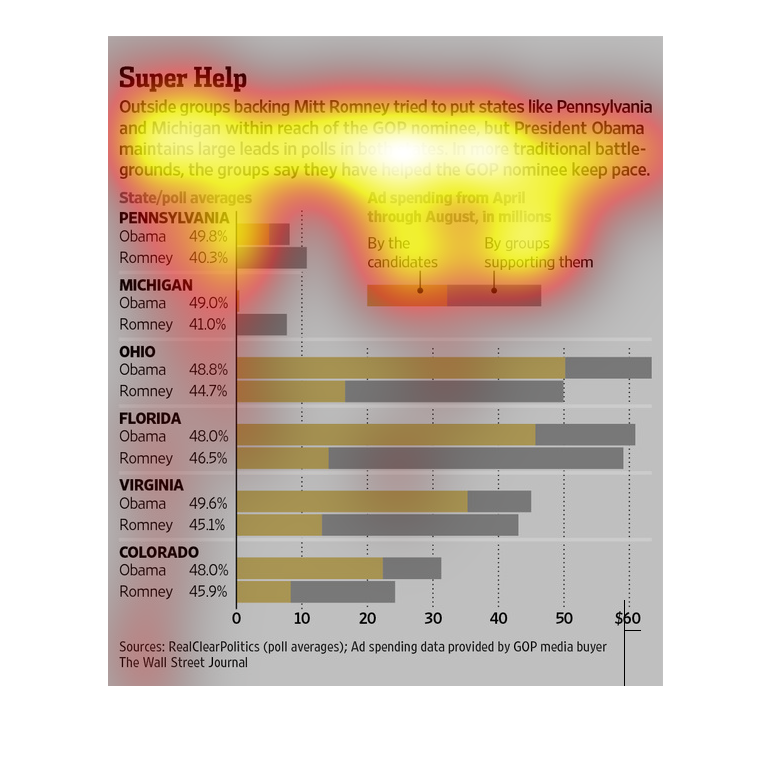
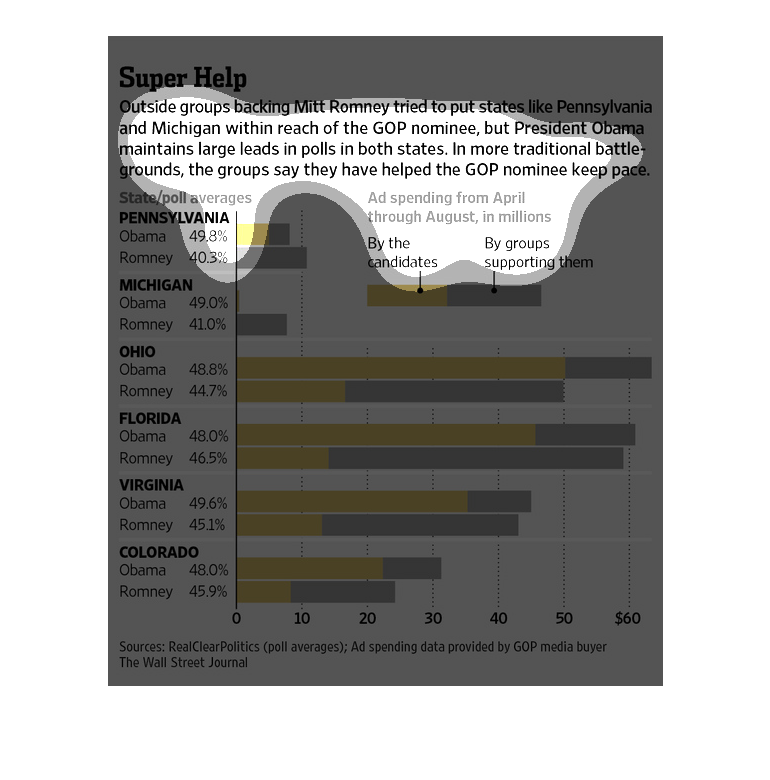
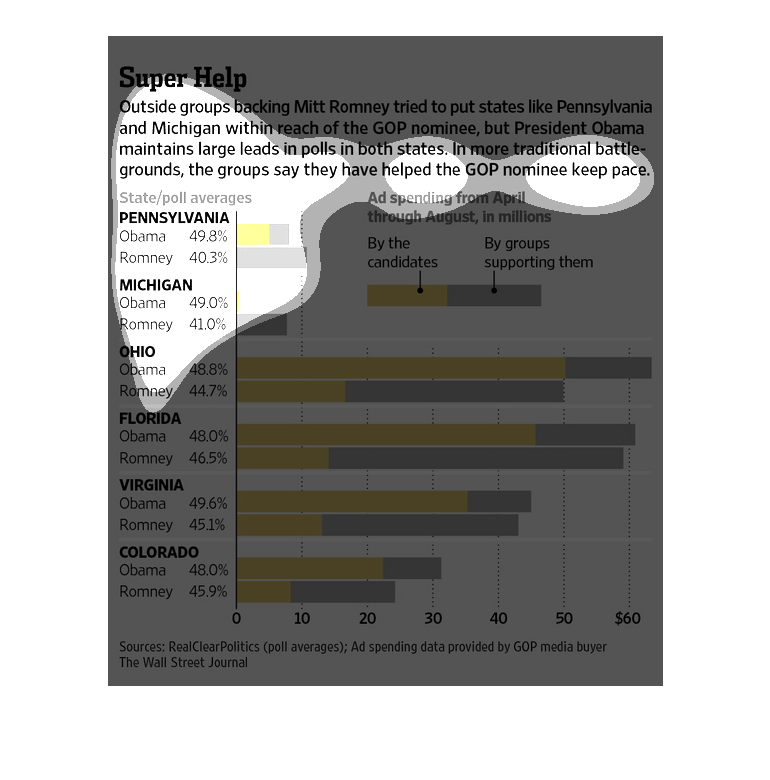
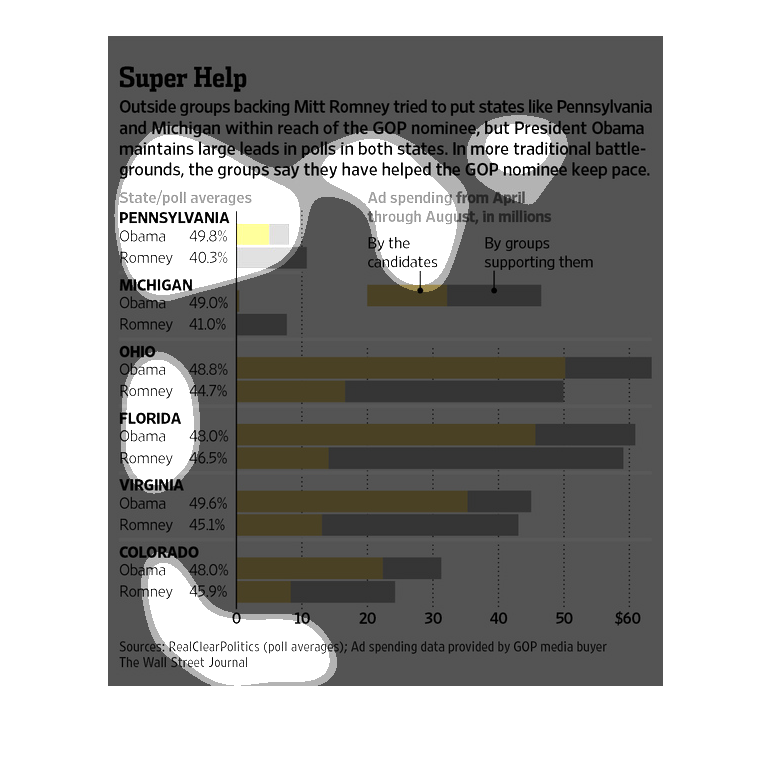
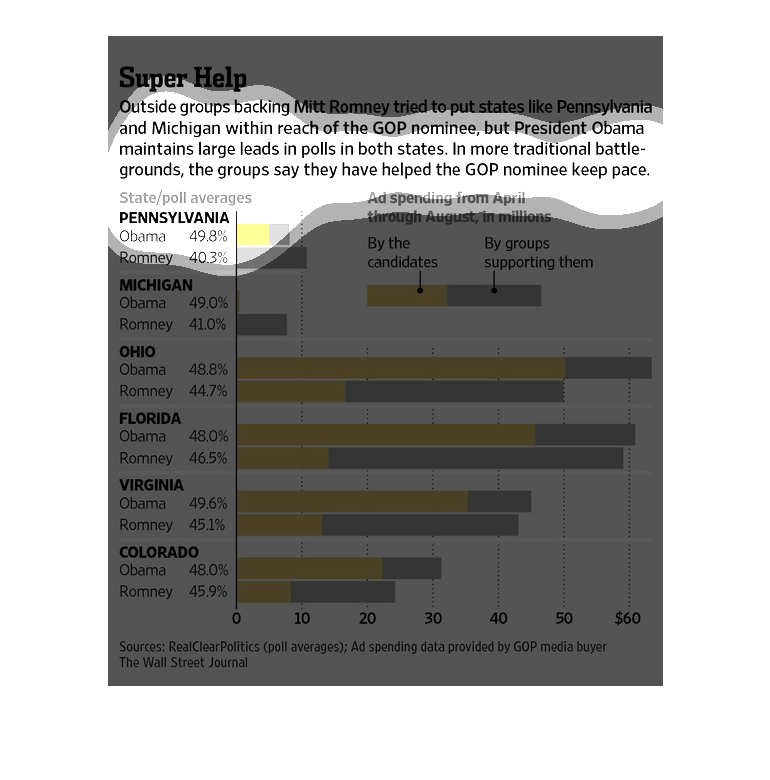
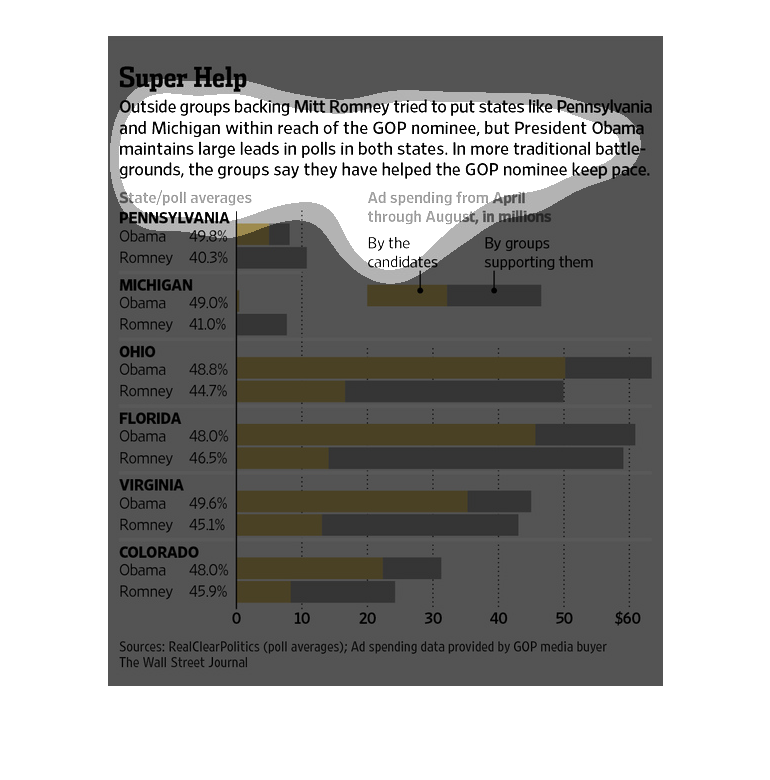
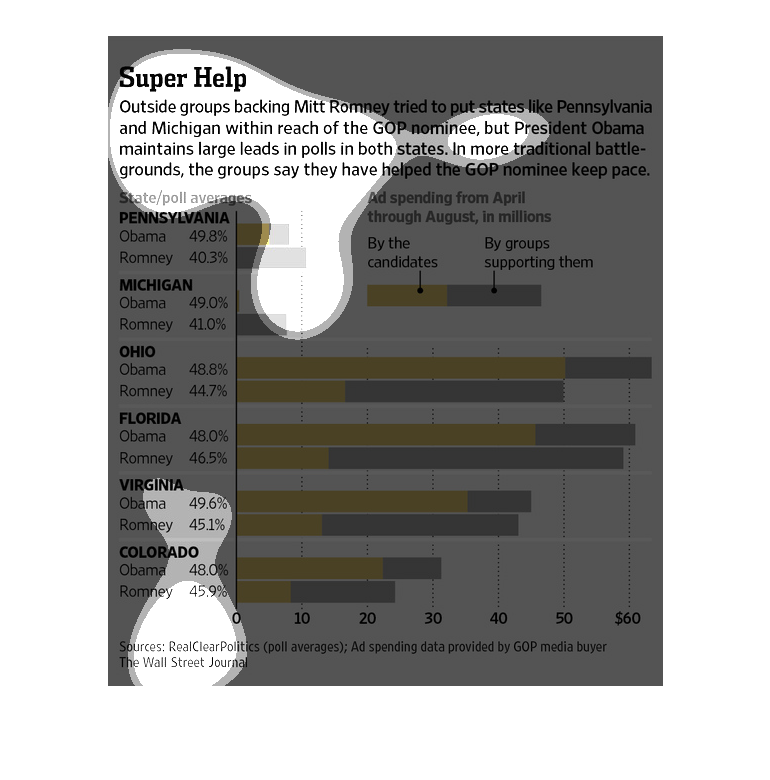
This graph is called Super Help, and it details different states and the amount of supporters
they each have for either Romney or Obama. The gold parts of the bars being "by the candidates"
and the purple parts for "groups supporting them".
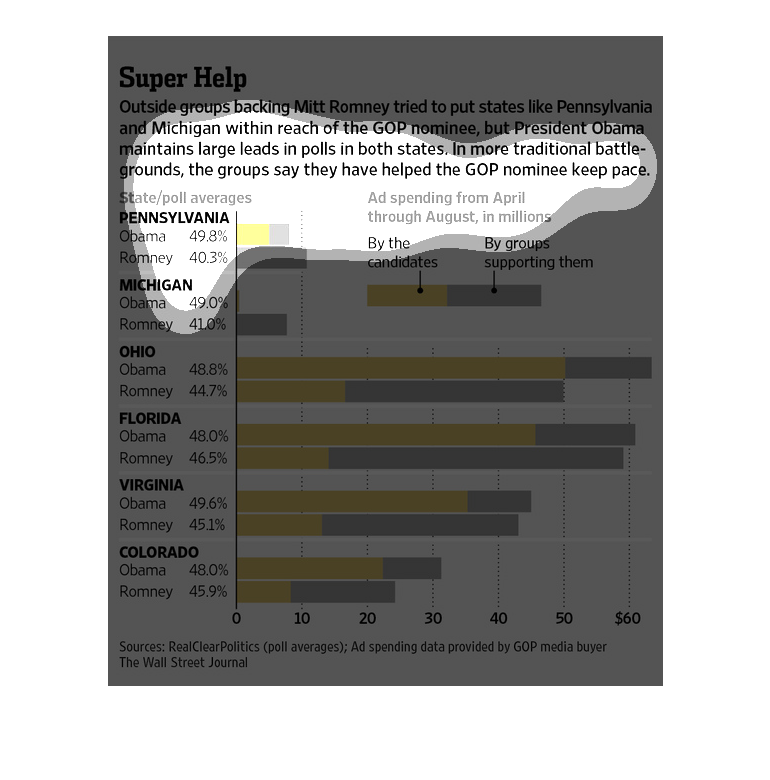
This chart describes the state poll averages for Mitt Romney vs. Obama for Michigan, Pennsylvania,
Ohio, Florida, Virginia & Colorado. From the looks of the graph, it is showing Obama taking
the lead over Romney.
This chart describes super help. Specifically, outside groups backing Mitt Romney tried to
pull states like Pennsylvania and Michigan within reach of  the GOP.
This chart compares money spend on advertising by Obama and Romney and the groups that support
them and their state poll averages and whether that spending has helped the candidates in
the race. In Pennsylvania, groups supporting Romney have spent around $10 million, and he's
polling at around 40% vs Obama's 49% for a total of around $6 million. In Florida Obama and
Romney are polling about the same with spending around $60 million total each.
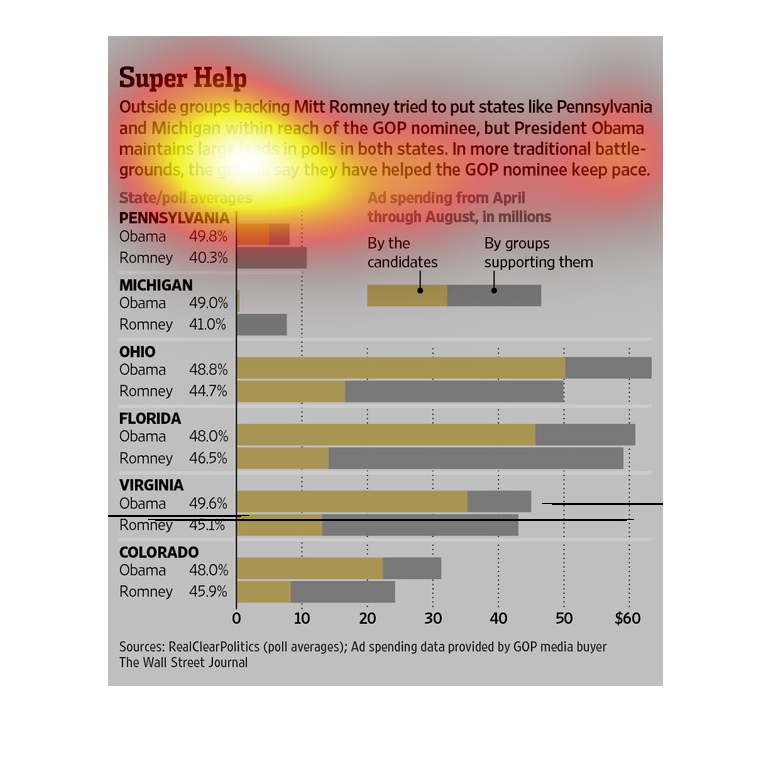
Super Help. We see important states in the presidential election and their backing support
mostly favoring Obama over Romney. Outside interest groups favoring Romney for some ungodly
reason.
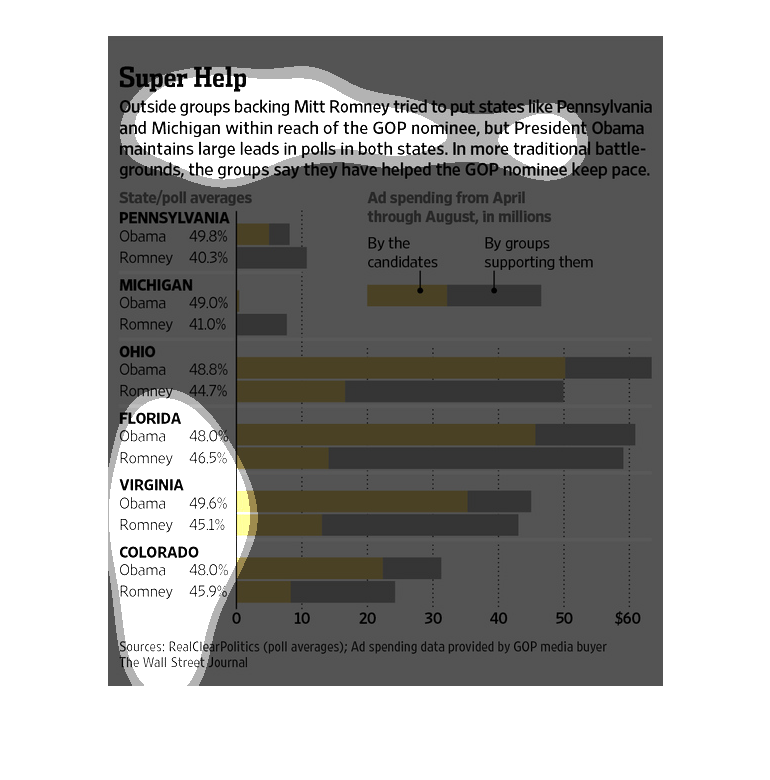
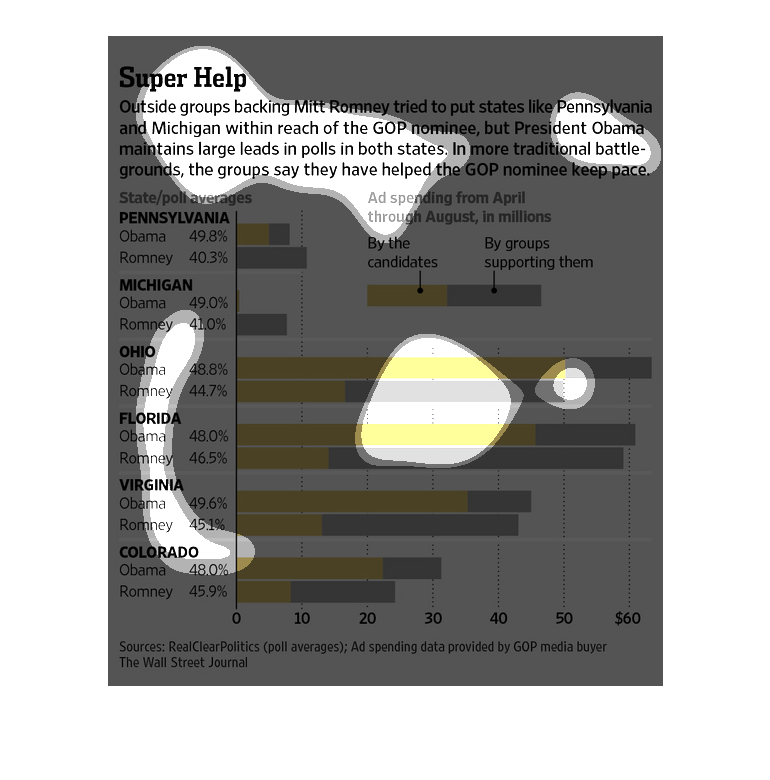
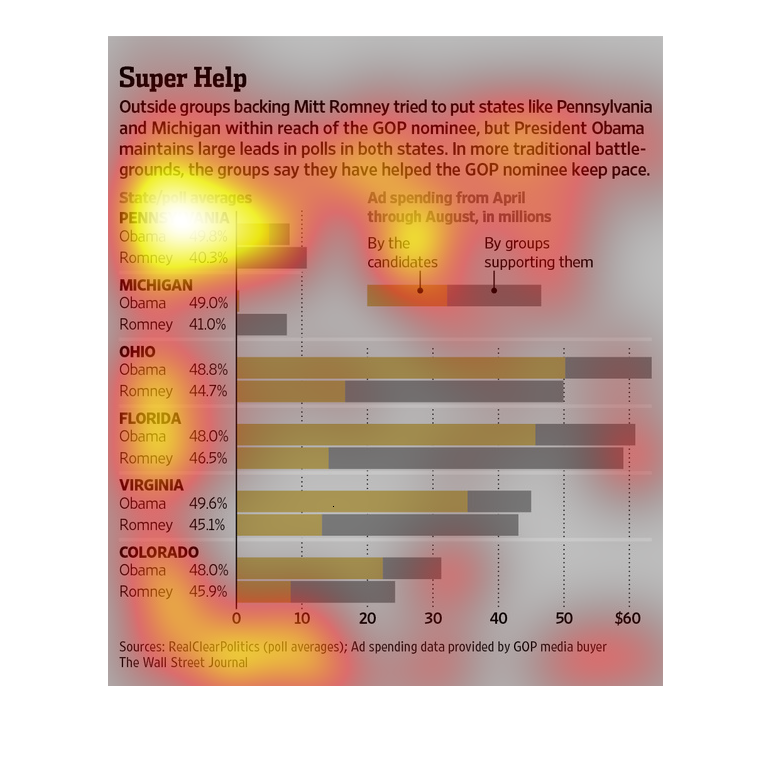
This is a series of color coded bar graphs depicting that despite large scale outside help
to put Mitt Romney ahead of Barak Obama, Obama maintained healthy leads in the election of
2012.
The chart is stating how some states tried to back Romney, but Obama was too far ahead. It
then goes on to show Obama in every poll, sometimes drastically beating Romney, other times
barely.
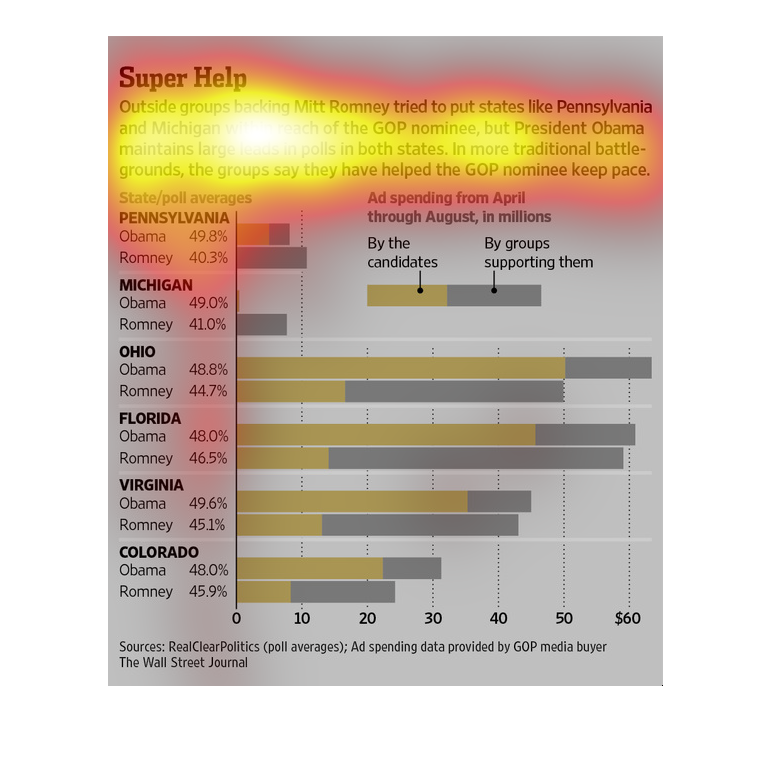
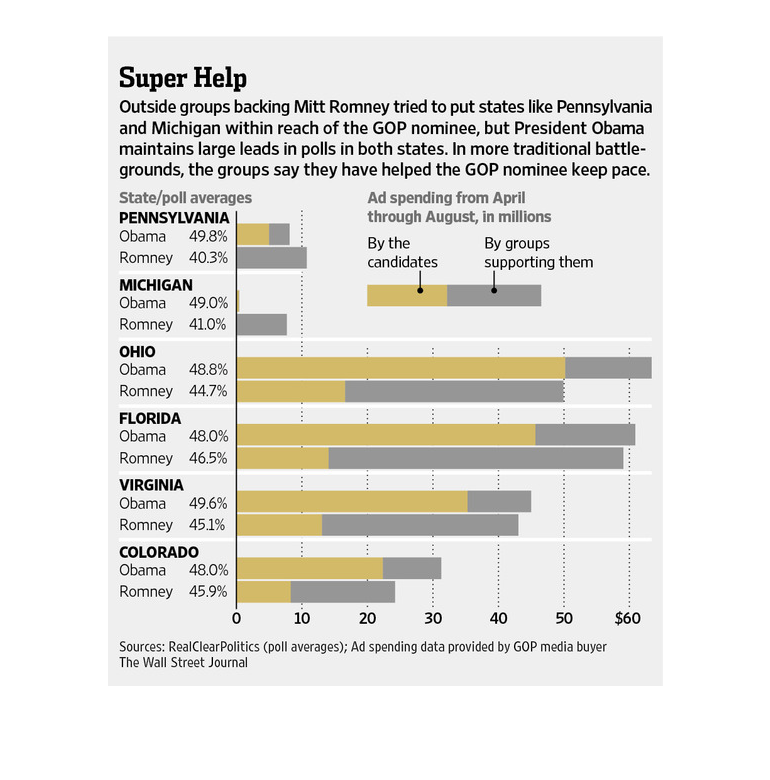
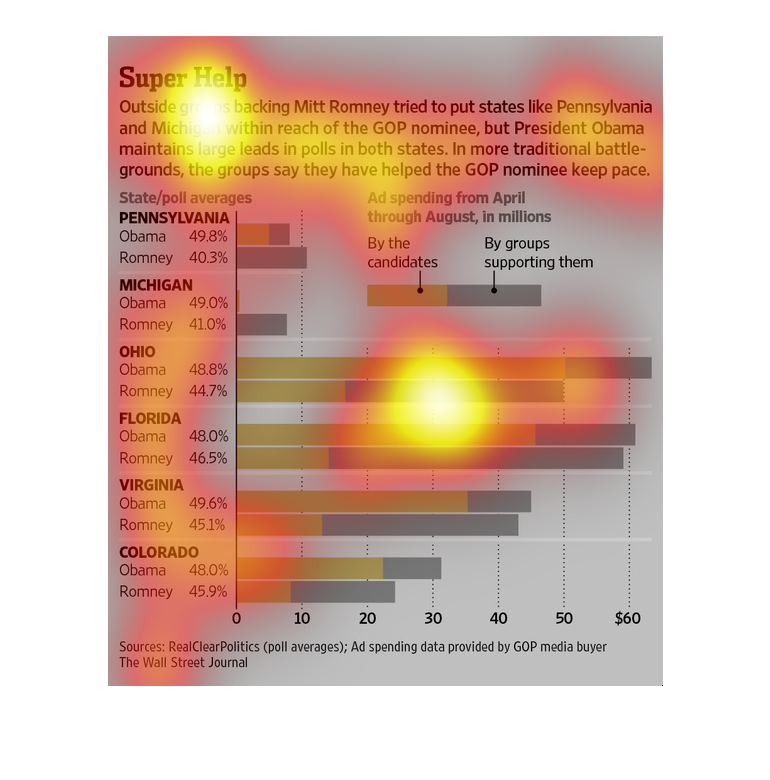
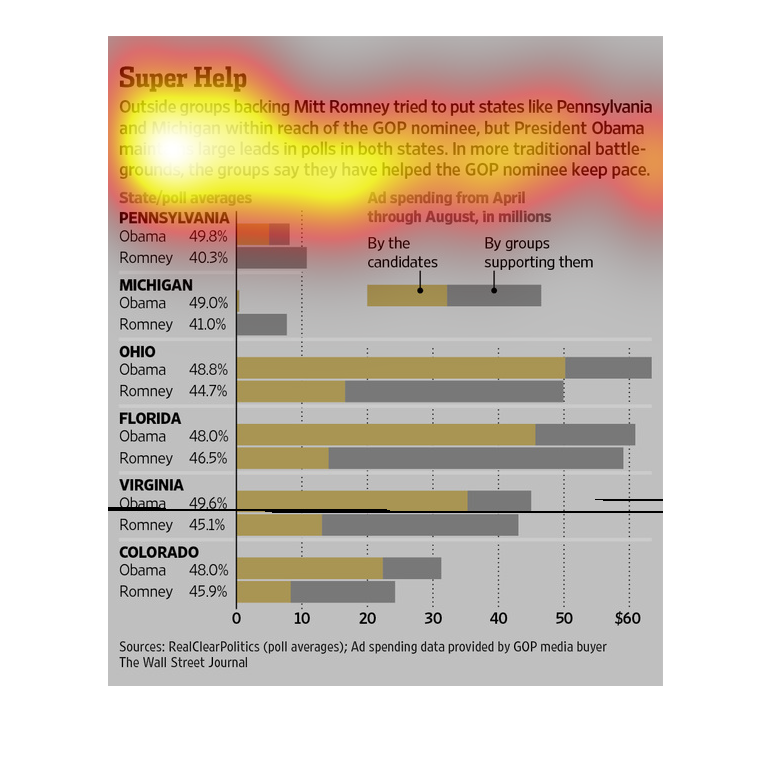
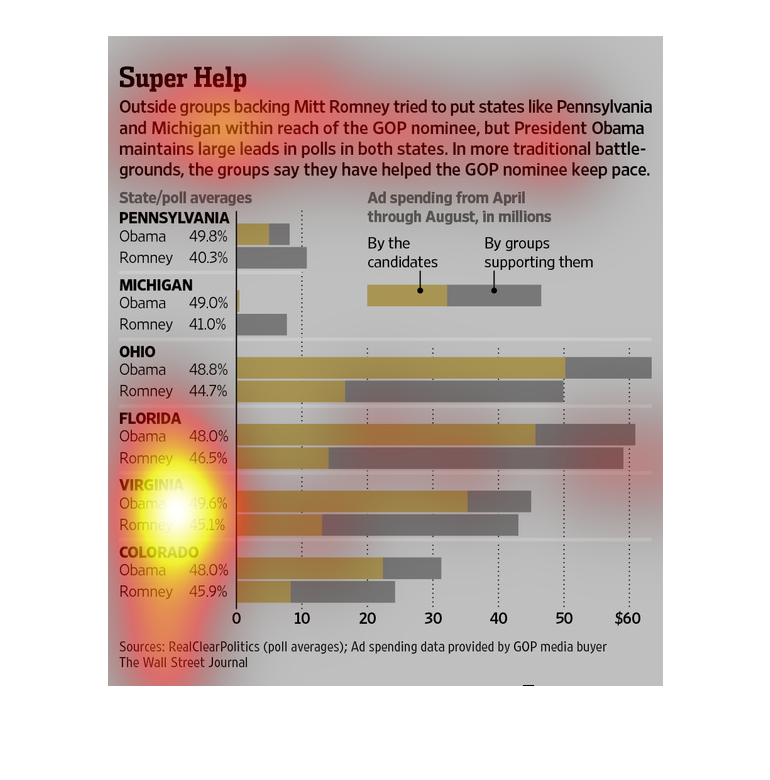
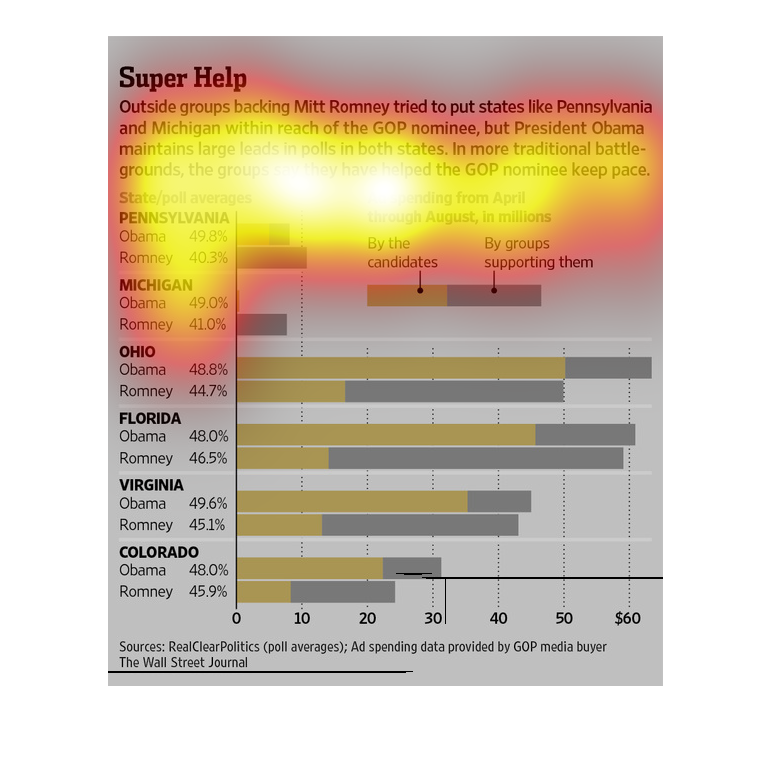
This chart shows the polls for several states for the presidential nominee and the dollars
spend on advertising by the candidates versus the groups supporting them.  Outside groups
backing Mitt Romney tried to put states like Pennsylvania and Michigan within reach of the
GOP nominee, but President Obama maintains large leads in these states. In more traditional
battleground states, the supporting groups say they have helped Romney keep pace.
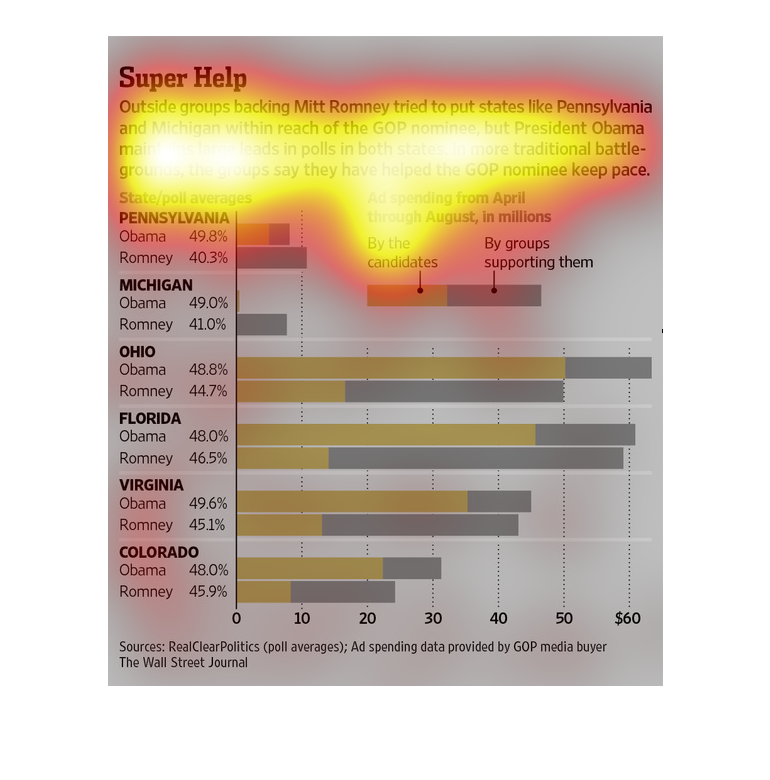
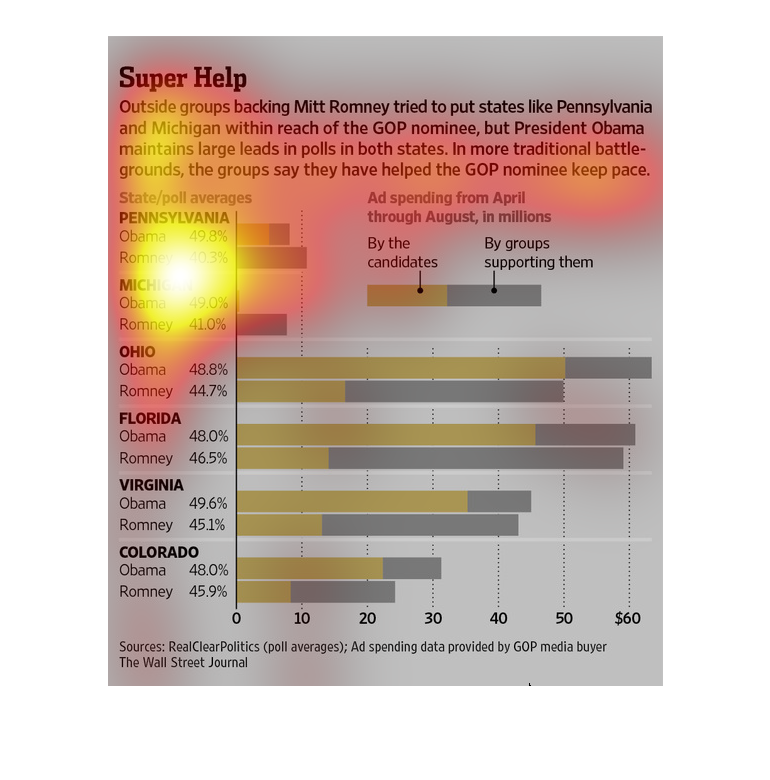
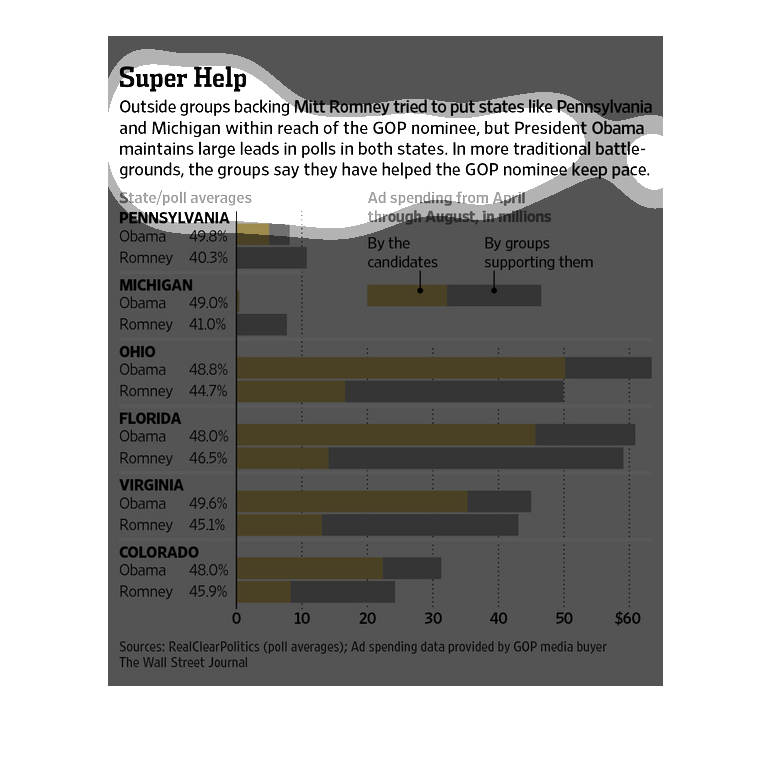
This graph is showing how Mitt Romneys attempts to get more backing in Pennsylvania and Michigan
are not having any effect on Barack Obamas campaign. But the groups are saying they are helping
Mitt Romney keep pace with Obama.
This study shows that there was a lot of support for Mit Rommey but they just could not withstand
the might of Barack Obama. This study is broken down by state and shows the Republican Candidate's
support.
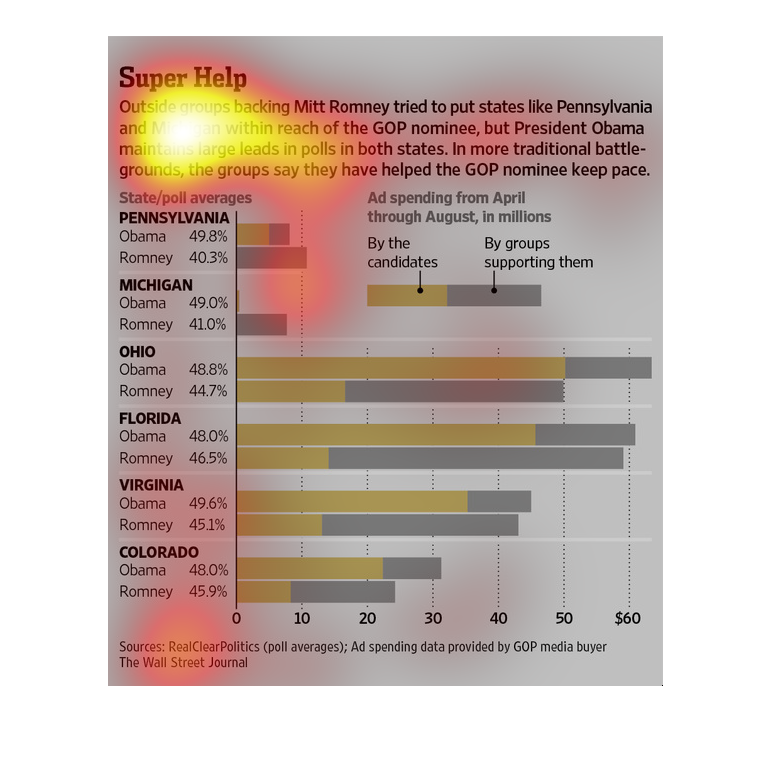
This graph represents the amount of money spent on ad campaigning for he GOP nominees and
how their spending can directly relate to their final nomination in the polls within the battle-ground
states.