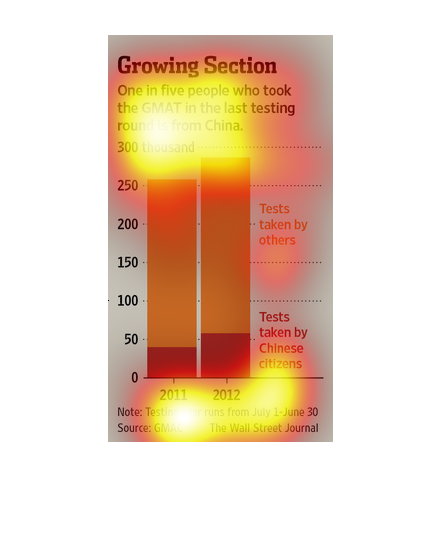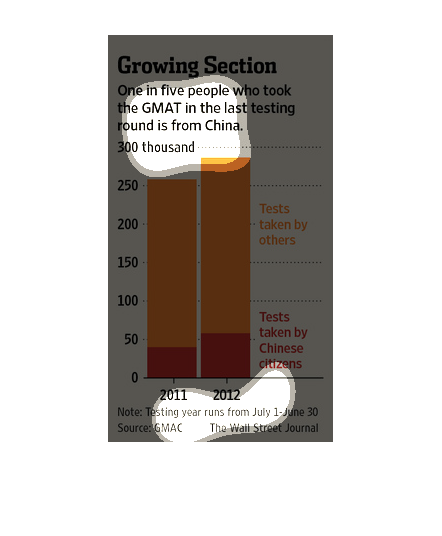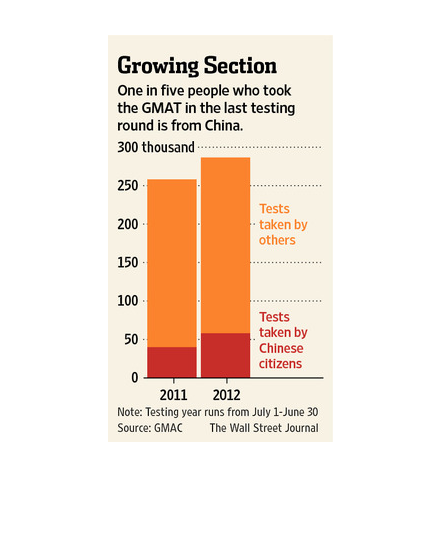
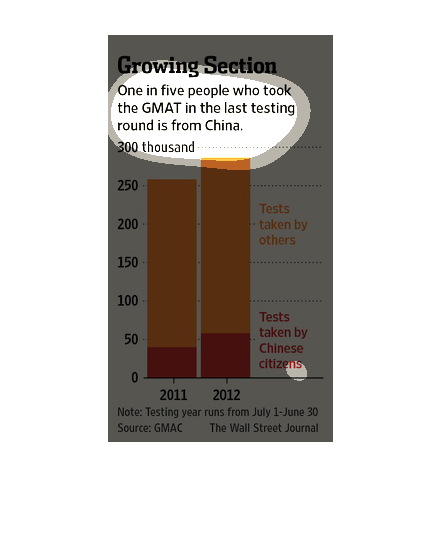
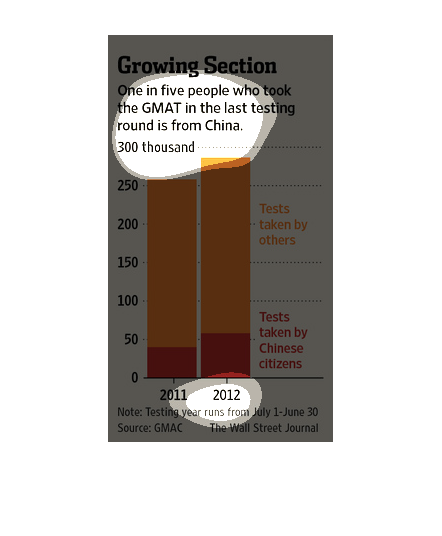
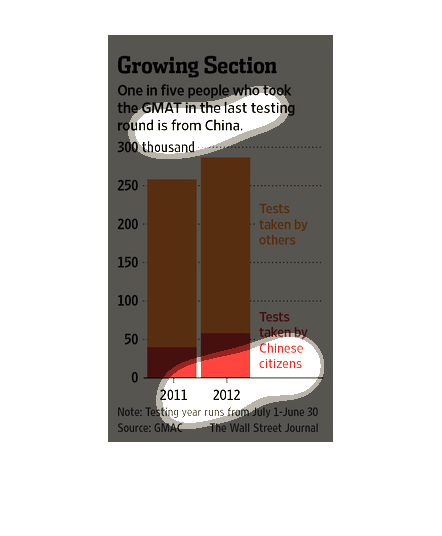
The following bar graph depicts that one out of five people that took the most recent GMAT
test were from the country of CHINA. The rest where from other countries.
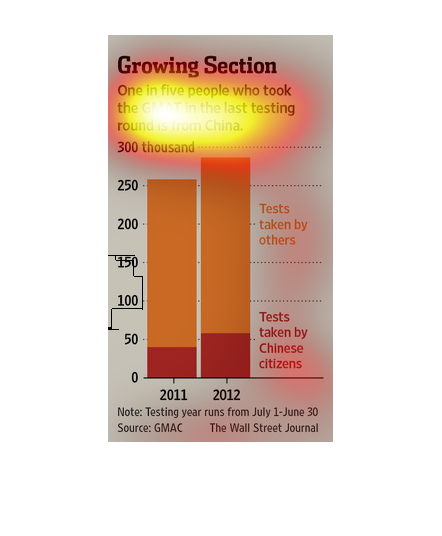
This image shows or depicts in statistical bar graph format data concerning growing section.
1 in 5 people who took the GMAT in the last testing round are from China.
growing section. one in five people who took the Gmat in the last testing round is from China.
Basically the Chinese are much more likely to take the Gmat, and this continues to grow as
seen by the two barred graph representing 2011 and 2012
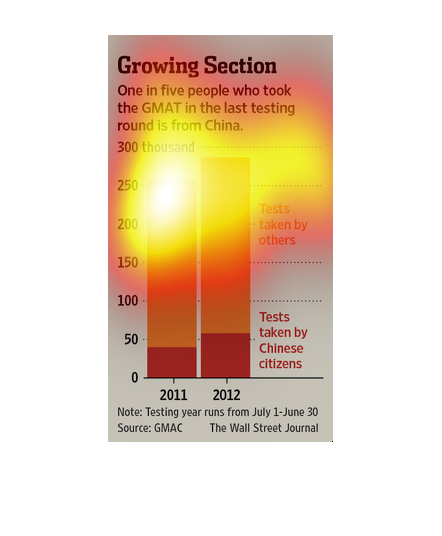
With the title of this graph being "Growing Section" I can't decipher the meaning of the graph.
In the description under the title I see it is showing data from a "GMAT". I have no knowledge
of what this is; possibly a test of some type. I can see this information is in correlation
with person's of China.
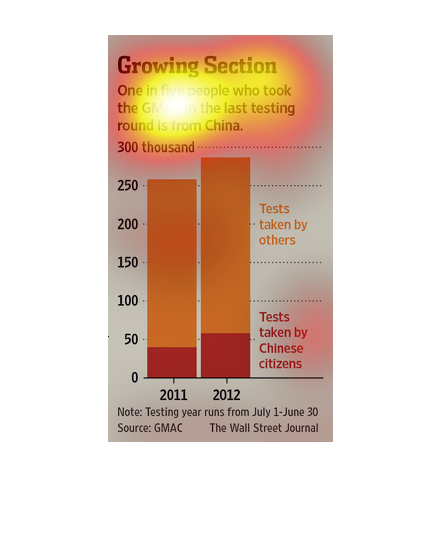
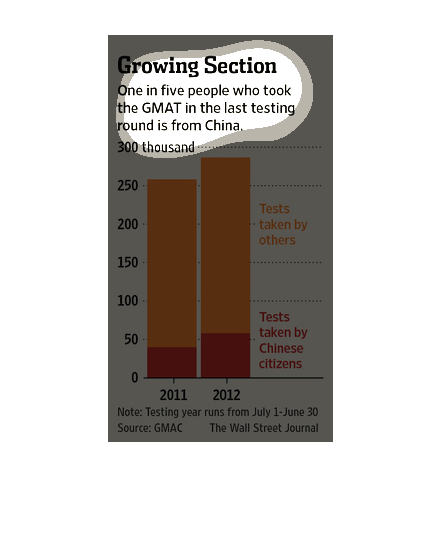
This is a simple bar graph depicting that one in five people who took the GMAT in the last
testing round were from China, which was a steady year over year increase.
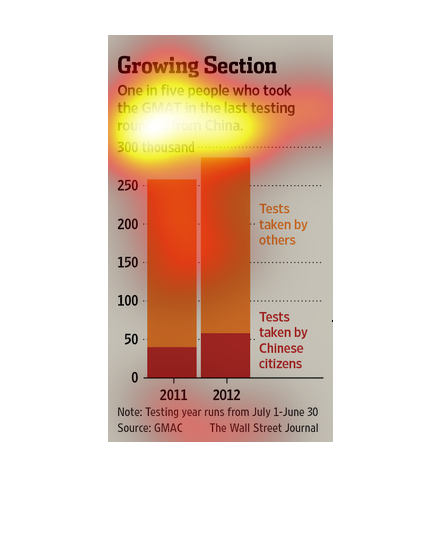
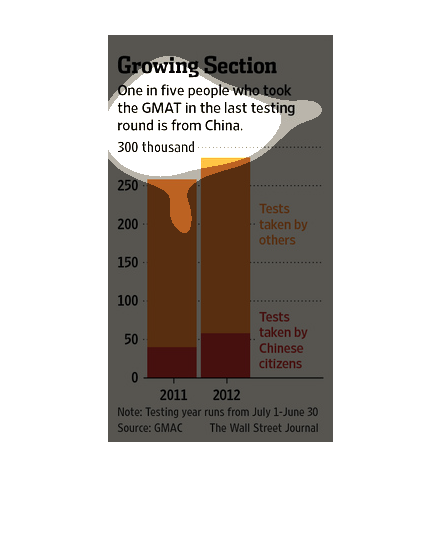
Growing section, one in five people who took the GMAT in the last is from China. It shows
a bar graph with user of tests taken by others and also people from China who took it.
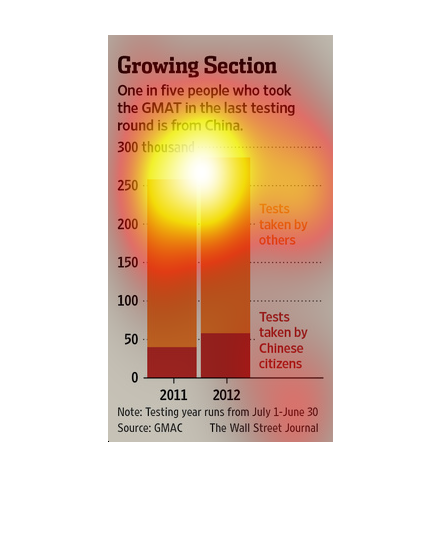
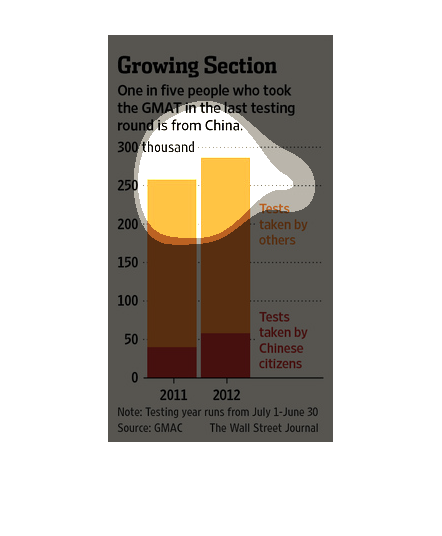
Growing Section. 1 in 5 people who took the GMAT in the last testing round is from China.
This chart is from the GMAC and was published in the Wall Street Journal and focuses on the
years 2011 and 2012 .
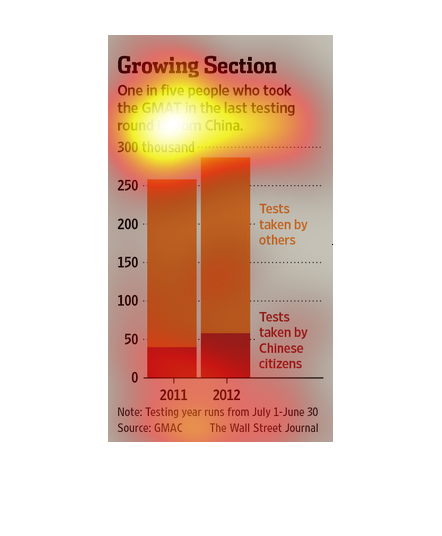
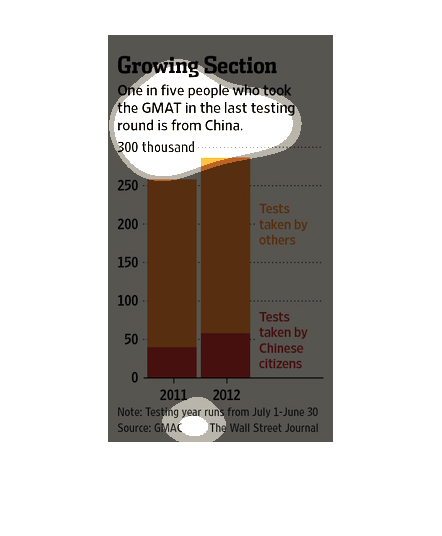
This graph illustrates that one out of five people who took the GMAT in the last testing round
is from China for the years 2011 and 2012 data of GMAT testing.
This chart describes growing section. Specifically, one in five people who took the GMAT in
the last testing round is from China. The chart is divided into two categories.
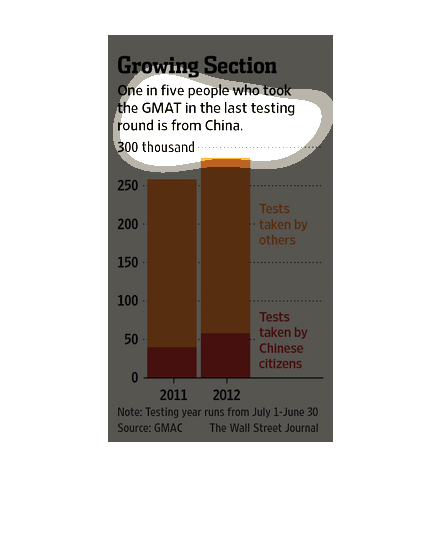
This chart describes growing section. Specifically, one in five people who took the GMAT in
the last testing round is from China. Different categories are represented by different colors.
This image shows that the GMAT test was taken by Chinese citizens at a rate of one to five
as shown by the bar graph.  The years compared are 2011 and 2012.
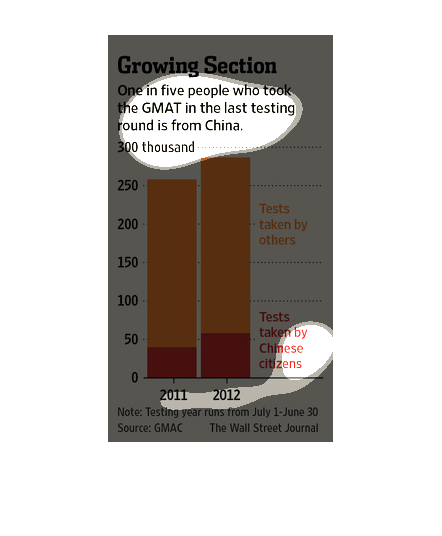
This is a graph of people who took the GMAT test in 2011 and 2012.  The chart shows how many
tests were taken by Chinese citizens compared to all others.  The number of Chinese citizens
increased from 2011 to 2012 with approximately 1 in 5 people taking the GMAT being a Chinese
citizen
The image depicts how one in five people who took the GMAT in the last testing round is from
China. Data appears to indicate that the number of Chinese has increased from 2011-2012.
This graph illustrates how many people, and nationalality of those people who took the GRE.
The graph depicts that 1 in 5 people who took the exam were from China.
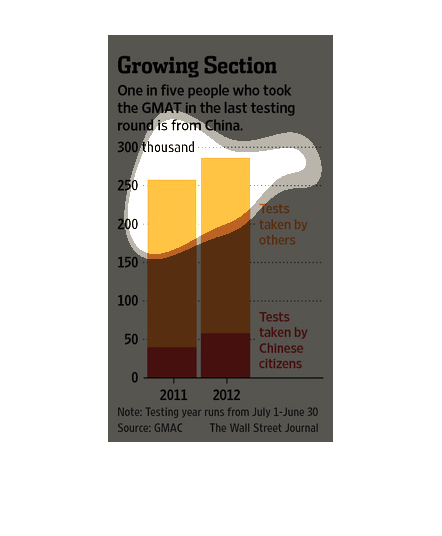
The caption for this bar graph is, "Growing Section, one in five people who took the GMAT
in the last testing round is from China".  The information dates back from 2011-2012 and graphs
the number of Chinese citizens who took the GMAT in relation to all other people who took
this test during this time period.