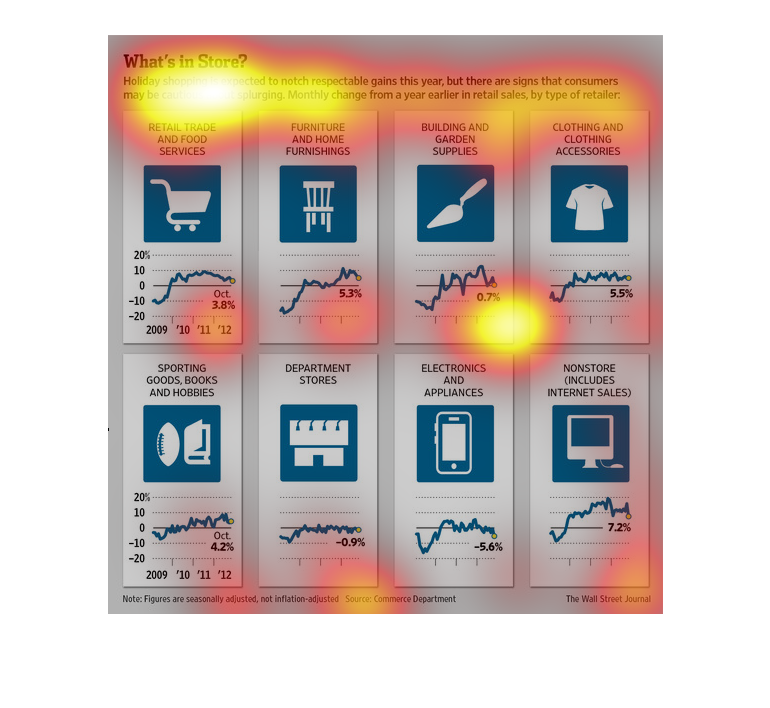
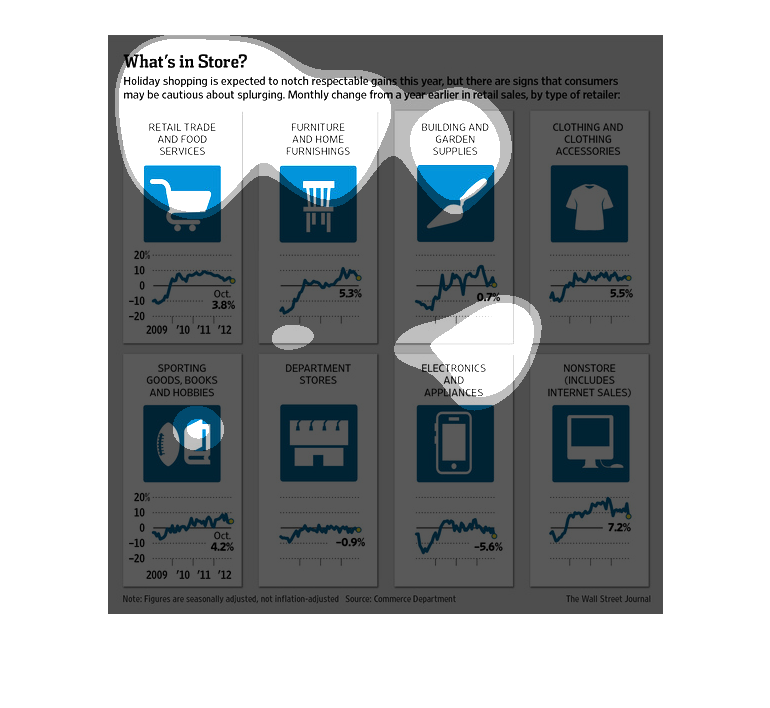
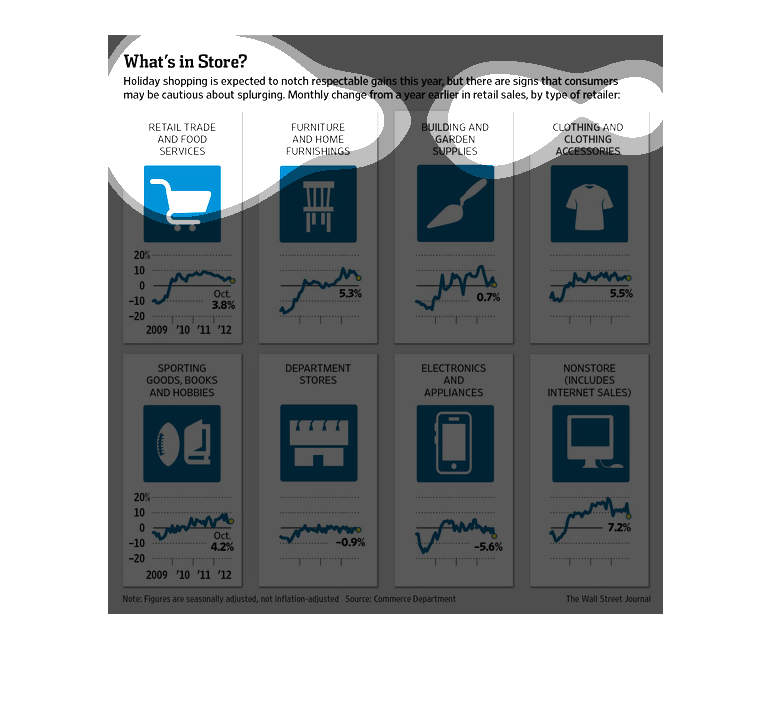
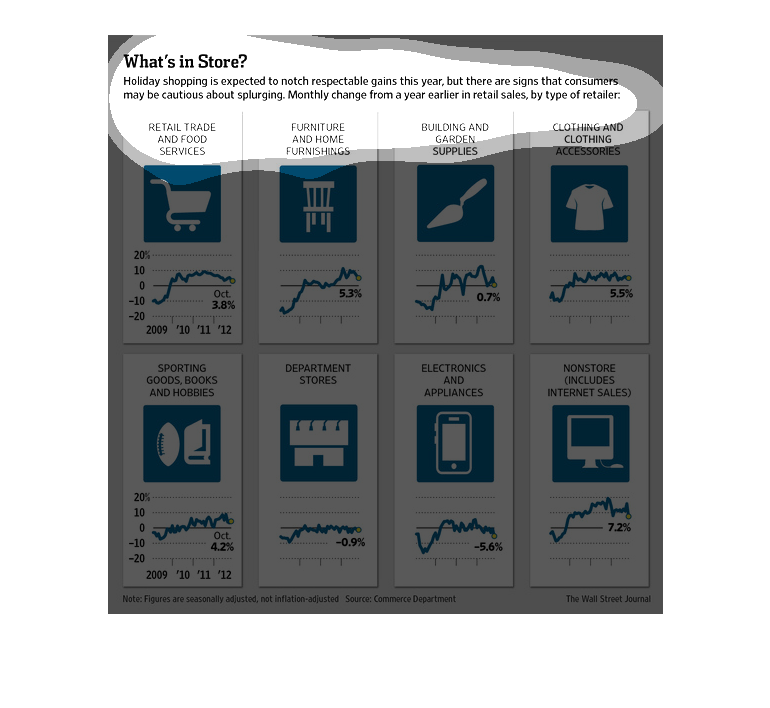
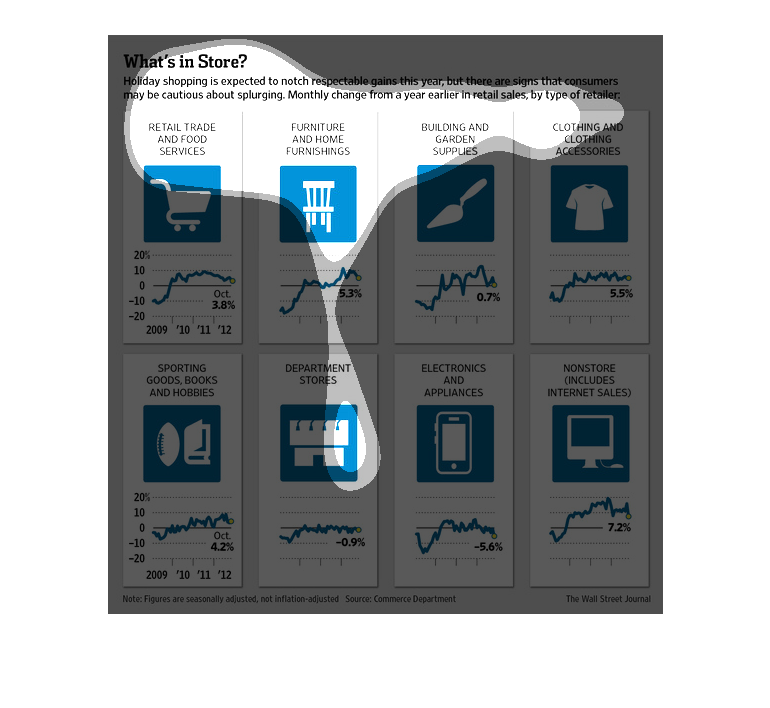
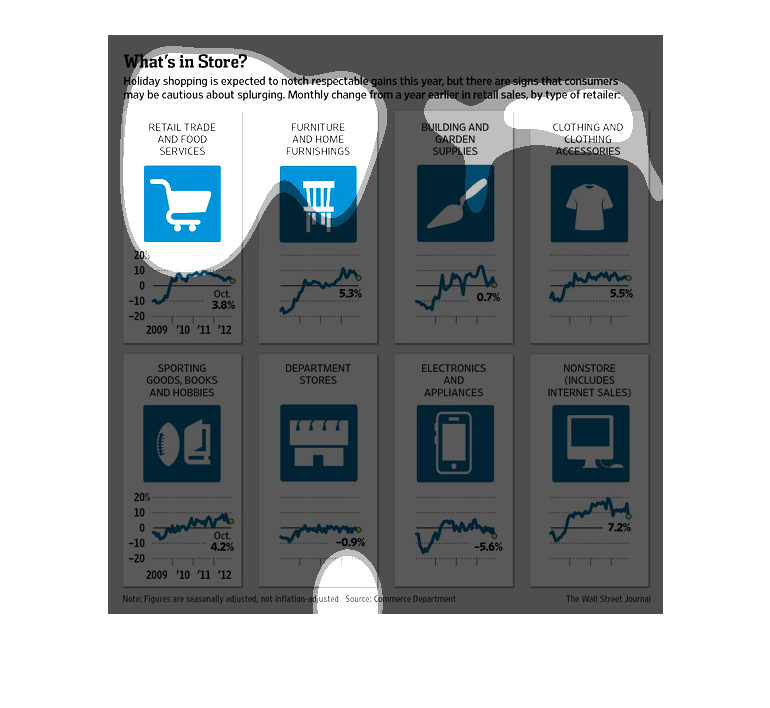
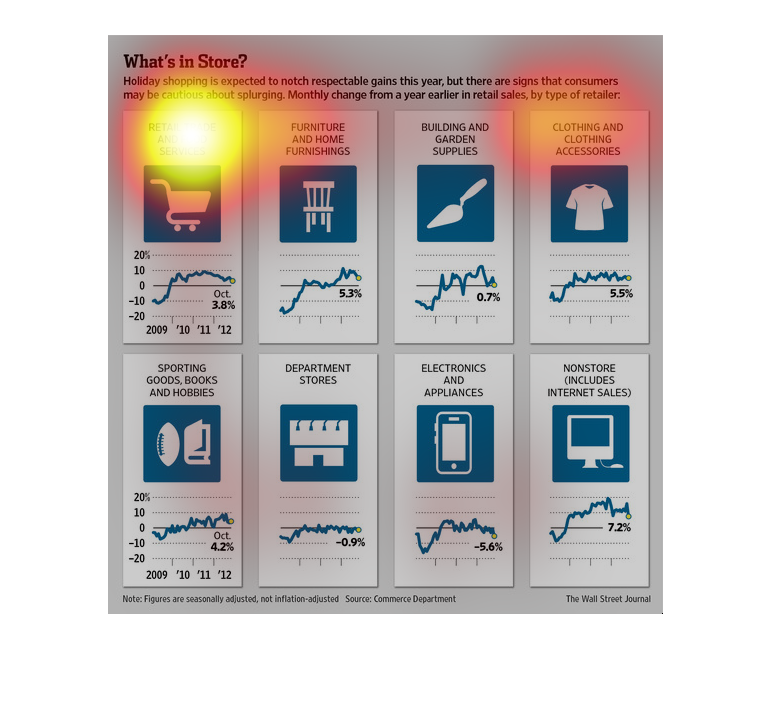
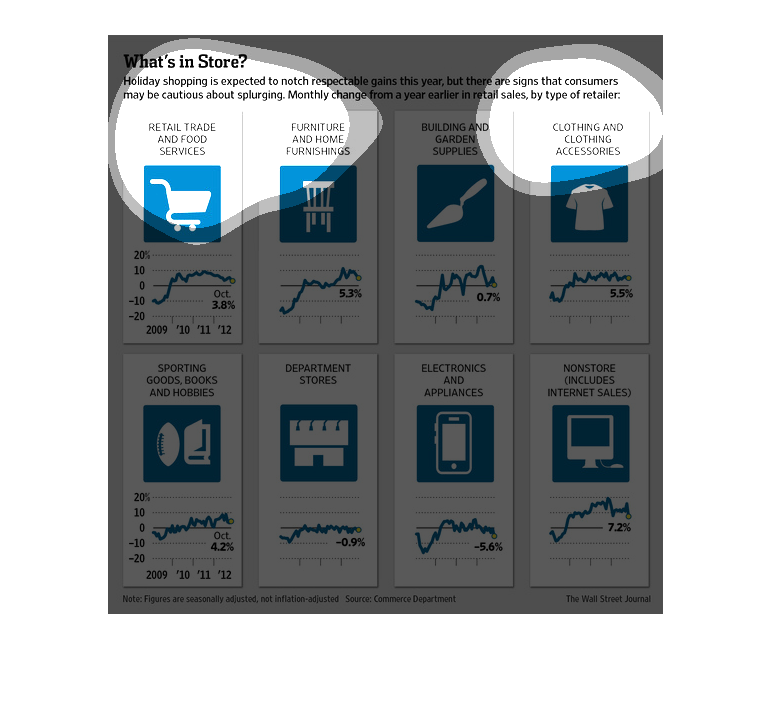
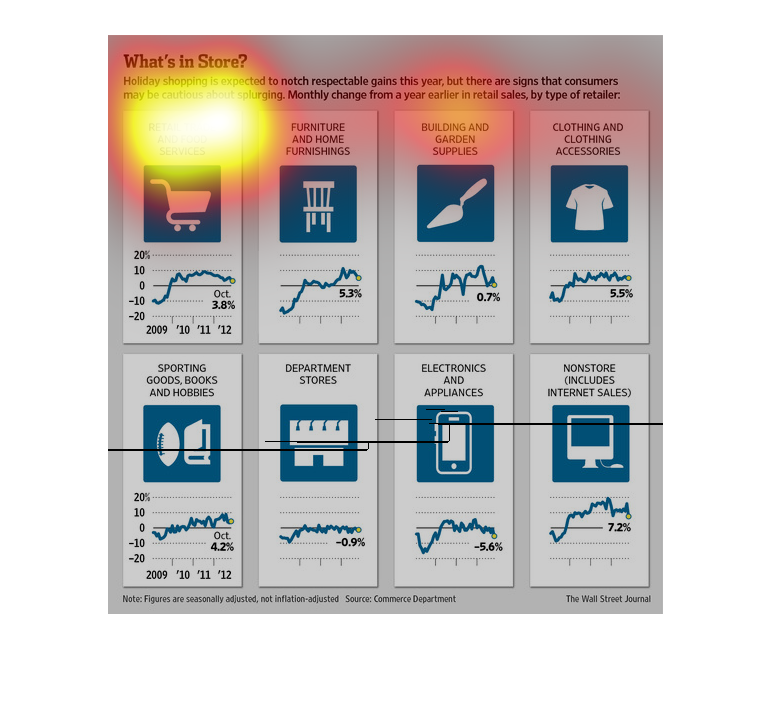
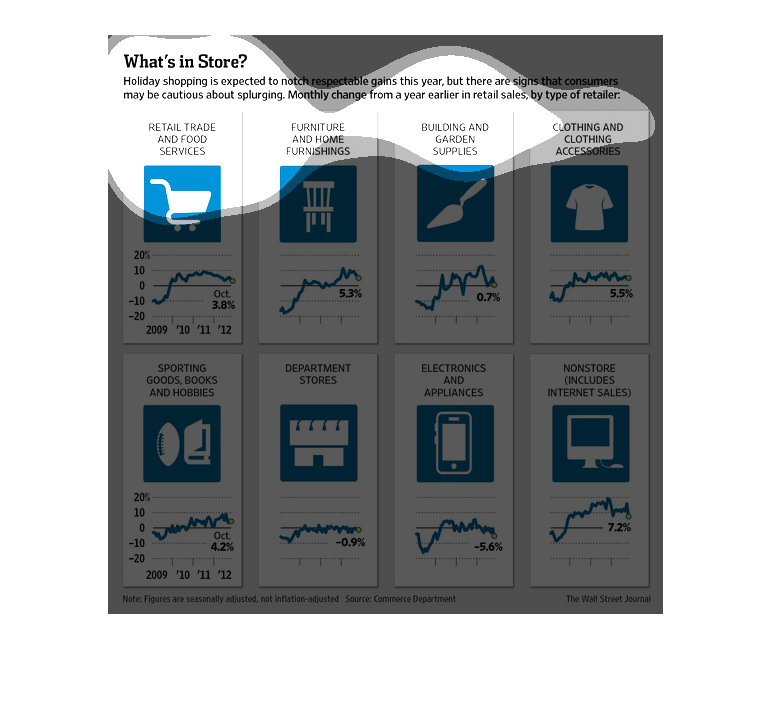
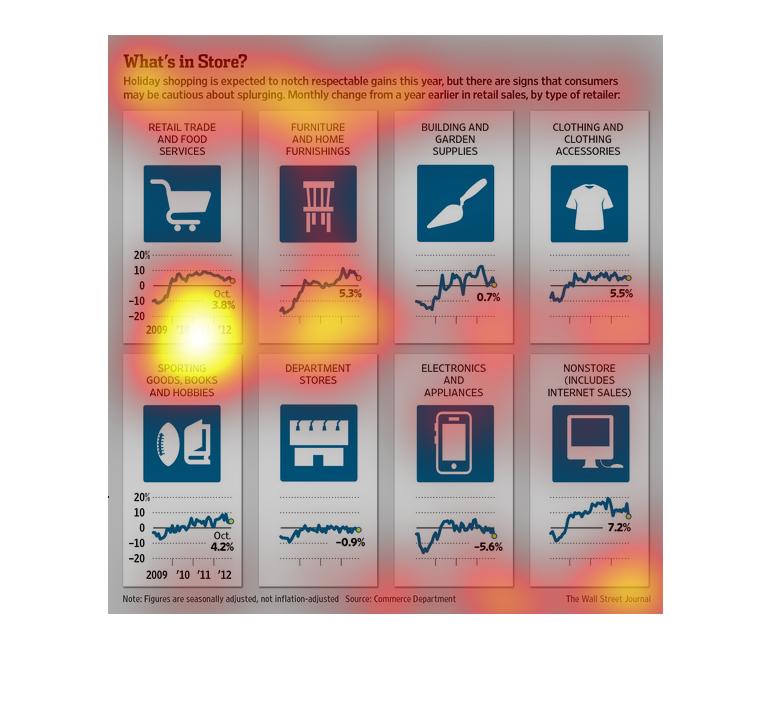
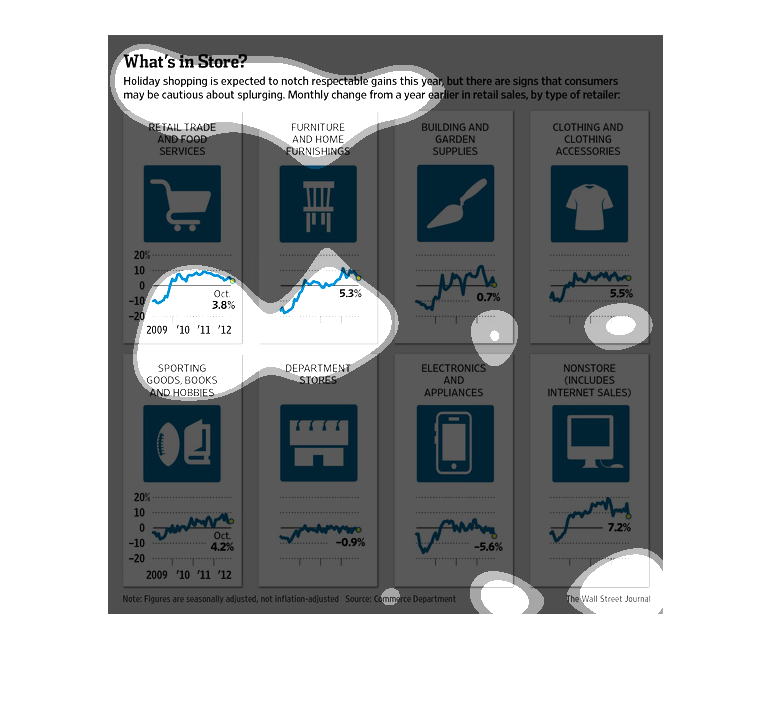
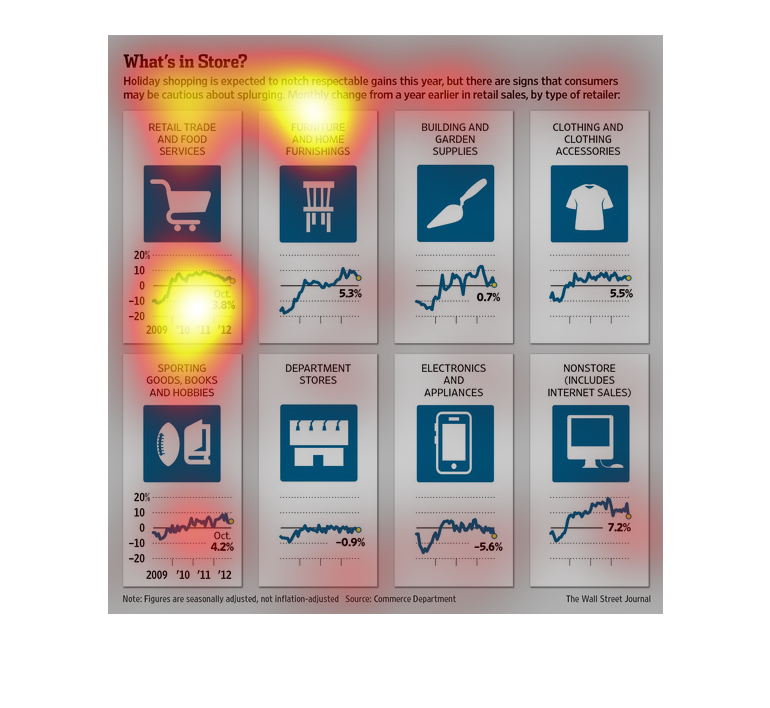
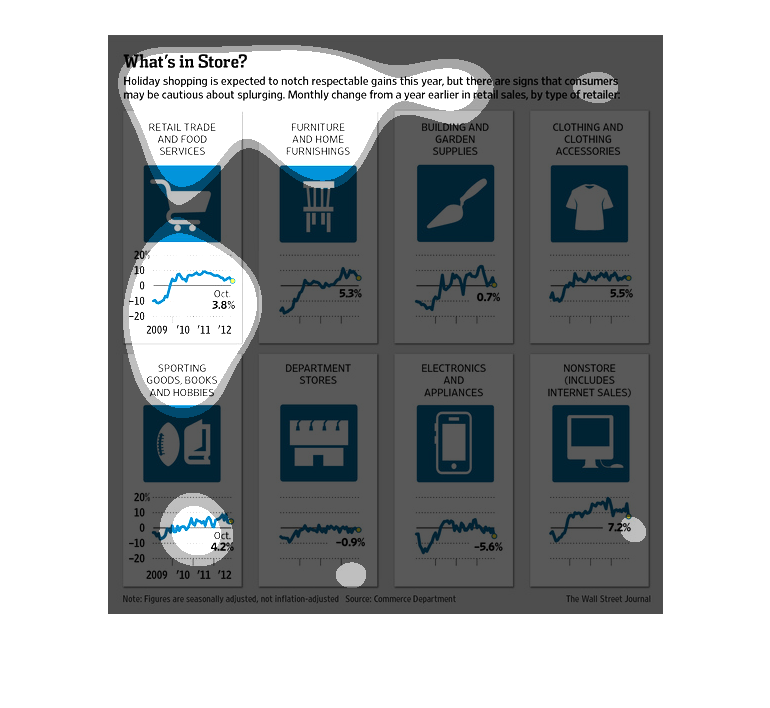
The caption for this graph is, "What's in Store?"  There are eight icons depicting different
segments of consumer shopping.  Below each of these different icons are small line graphs
charting the segments movement in the market.
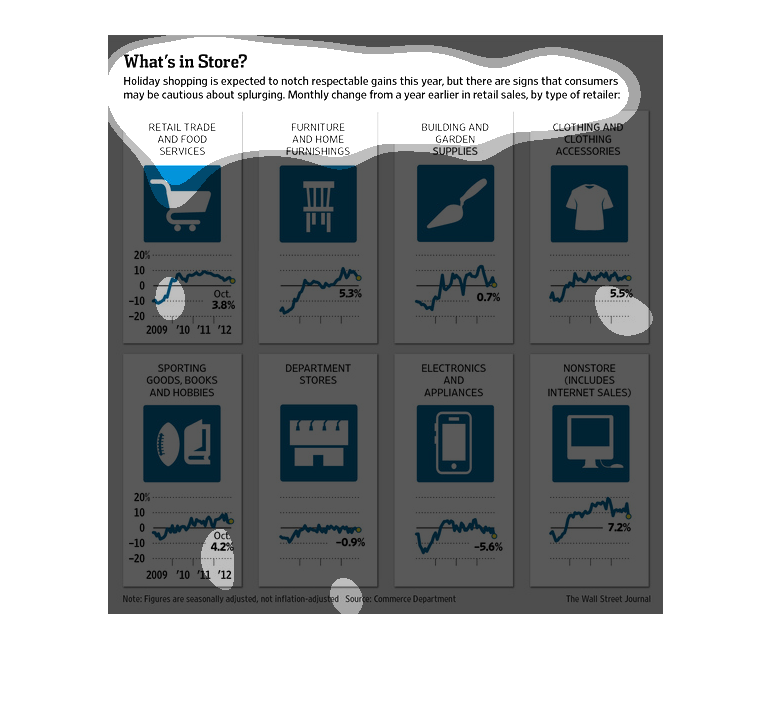
The image depicts how holiday shopping is expected to increase slightly in the year projected
year, although consumers may be weary of spending too much during the holiday season. The
data shows slight increase in different consumer goods sales in the US.
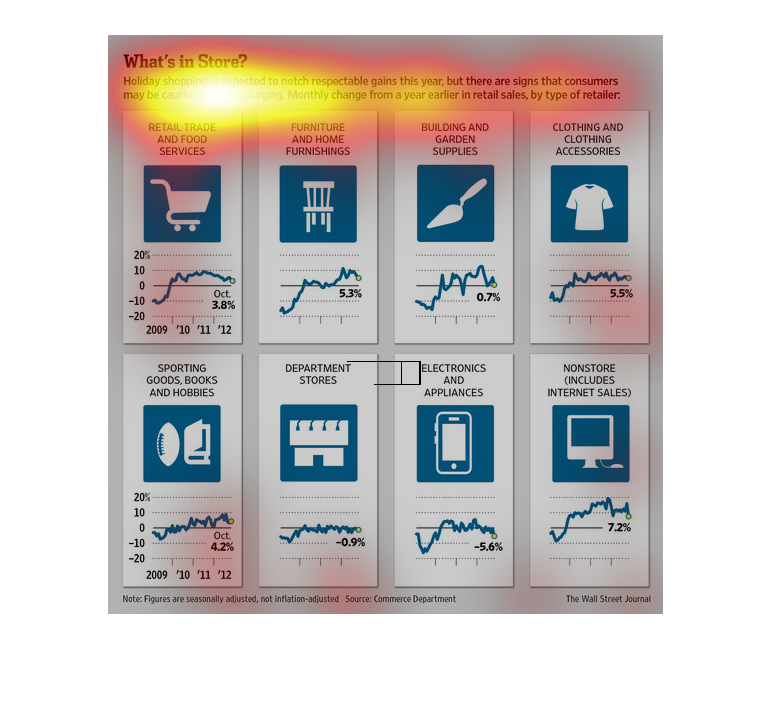
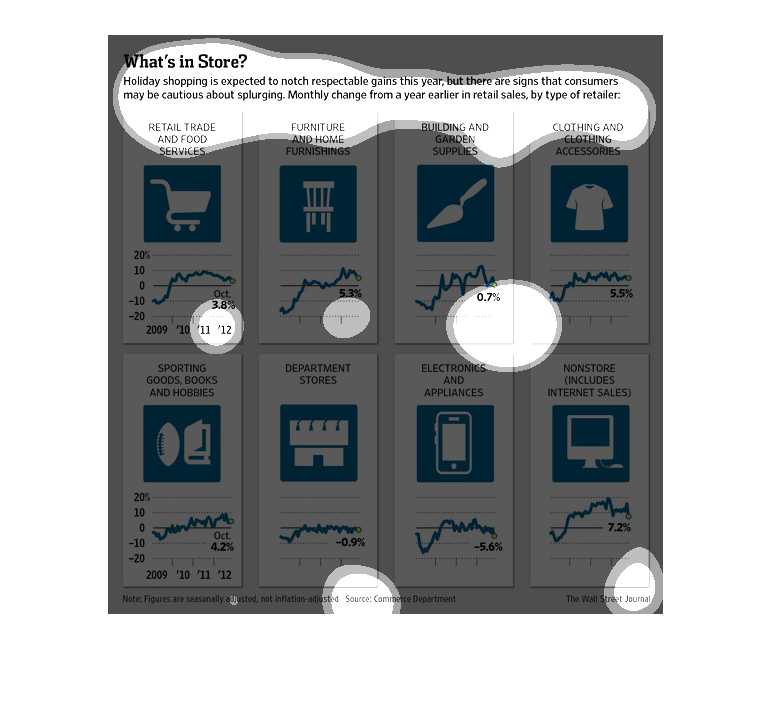
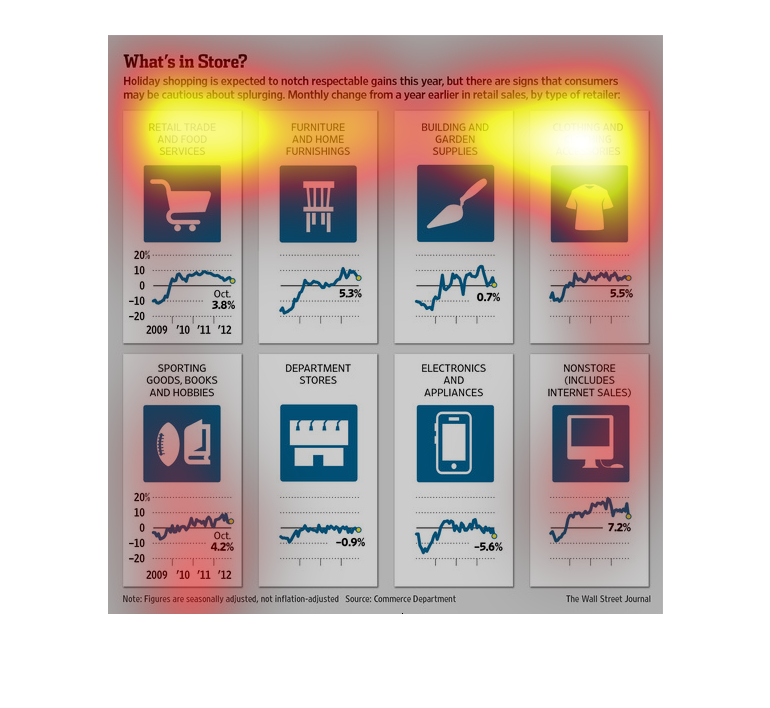
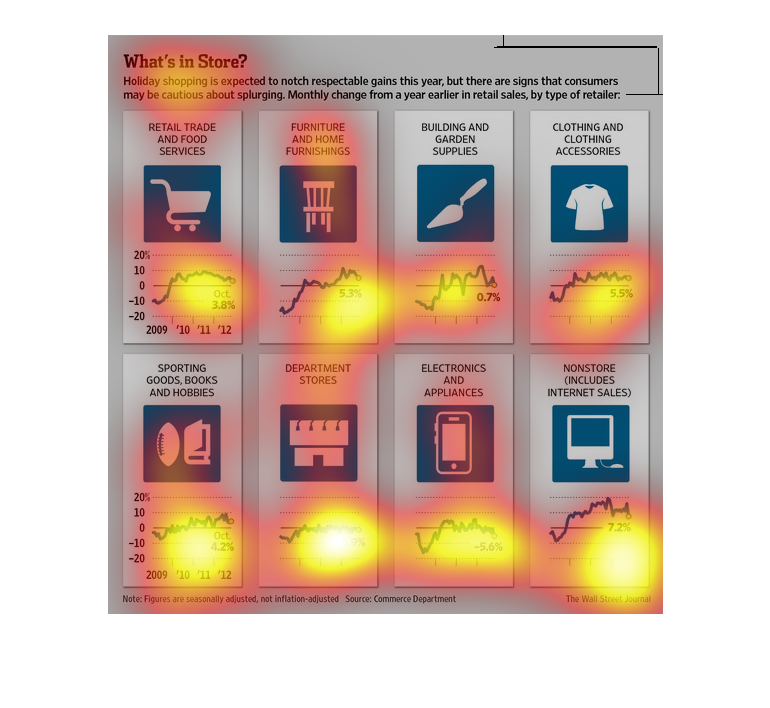
This chart describes what's in store. Specifically, holiday shopping is expected to notch
respectable this year, but there are signs that consumers may be cautious.
This graph shows the relationship between consumers spending habits over the past few years.
Each graph represent a different type of industry the consumer spent in.
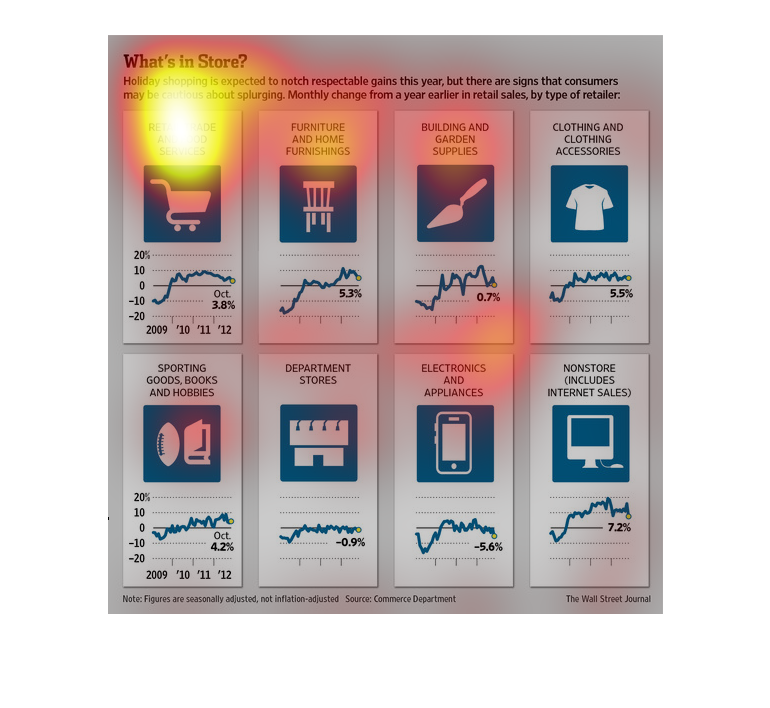
This image shows or depicts in statisitcal line graph format data concerning the anticipation
of retailers and stores having expected increases in sales for the holiday season. However,
consumers may be slow to splurge.
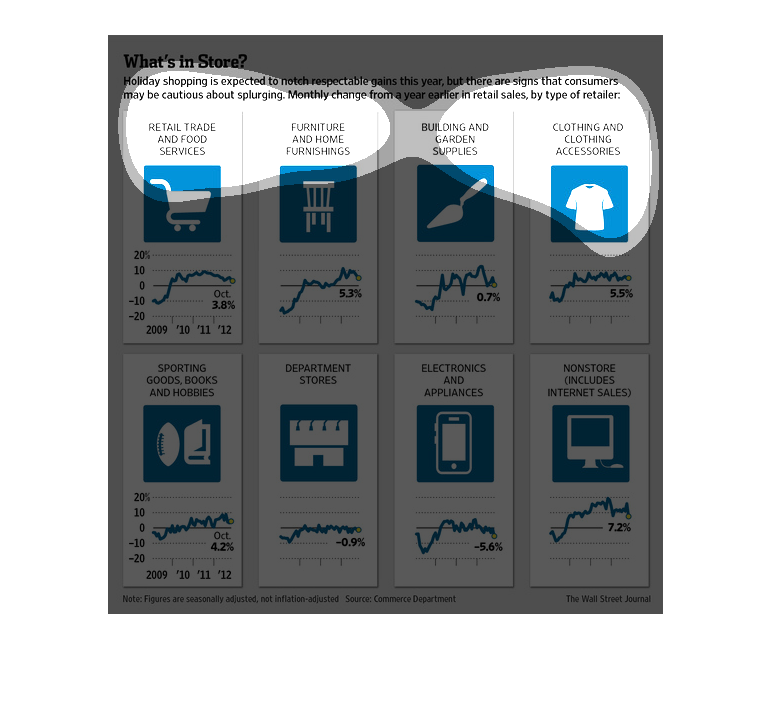
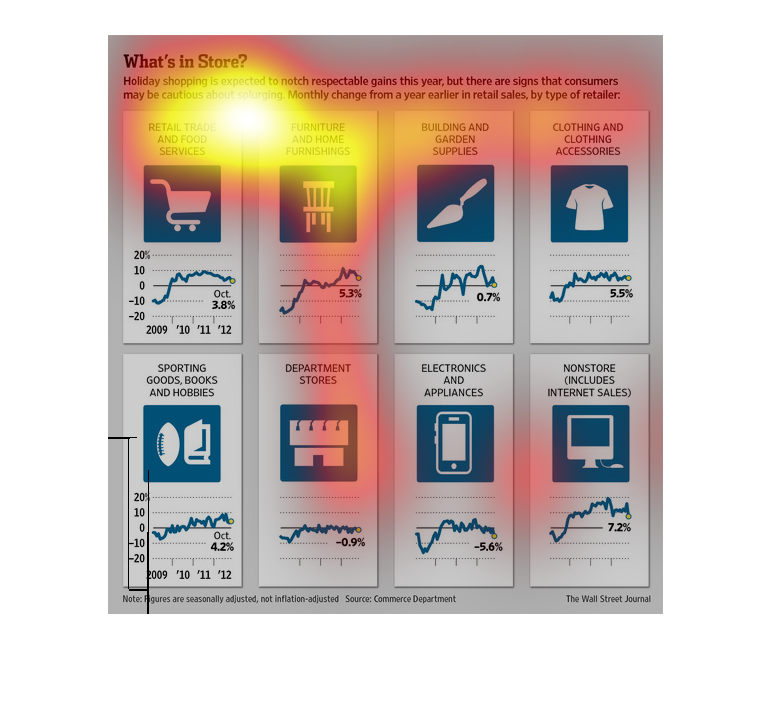
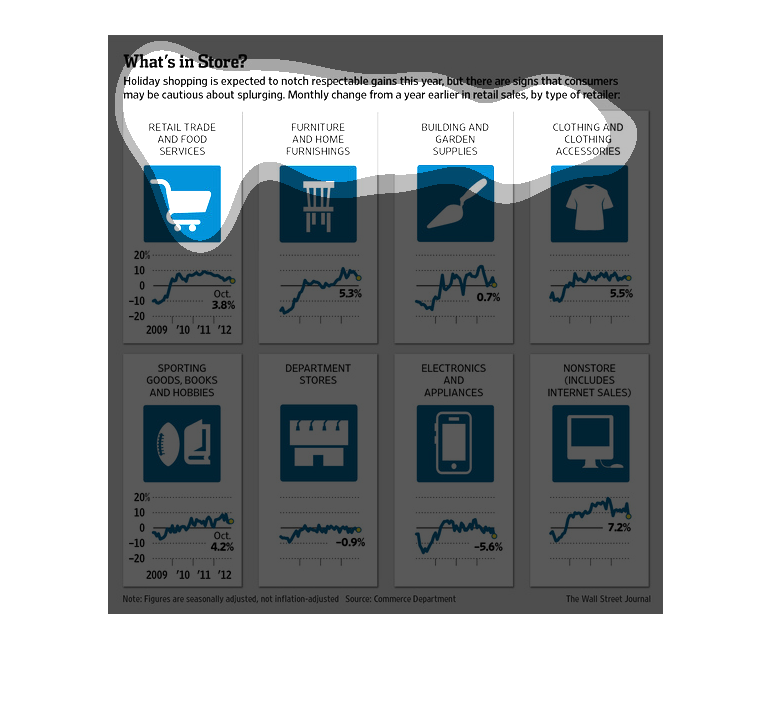
A chart showing what amounts of certain categories of items are carried in stores over a period
of 2009-2012. There are 8 different line graphs, many items spiked in 2011 and then dropped
dramatically.
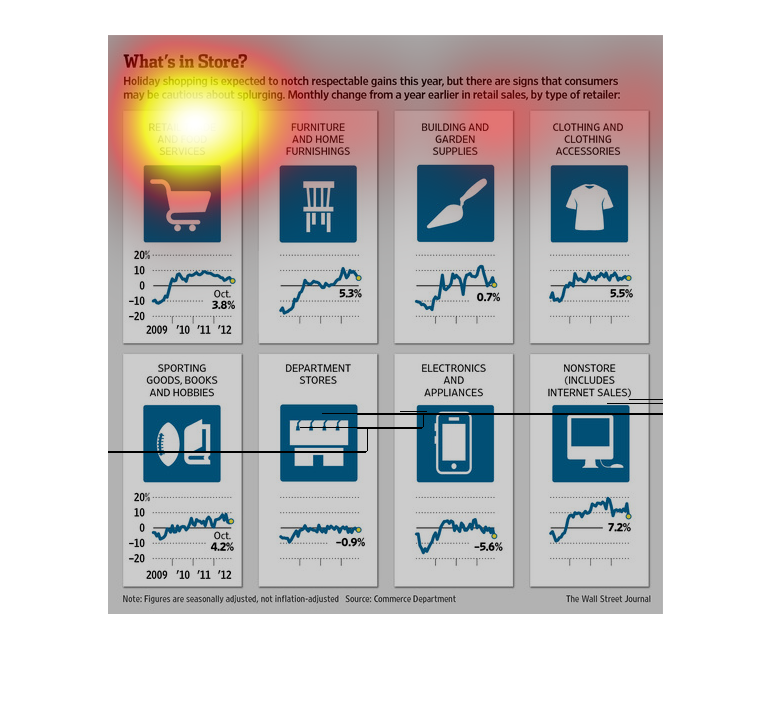
This chart shows how holiday shopping is expected to see increases this year. But, there are
signs that consumers are less likely to splurge than before. Most spending charts in different
categories are showing that there could be a drop in the stock price.
This chart/graph shows that during holiday season this year, consumers are much more likely
to be spending less this year, which is a concern for retailers.  It shows retailers, grocers,
and even internet sales.
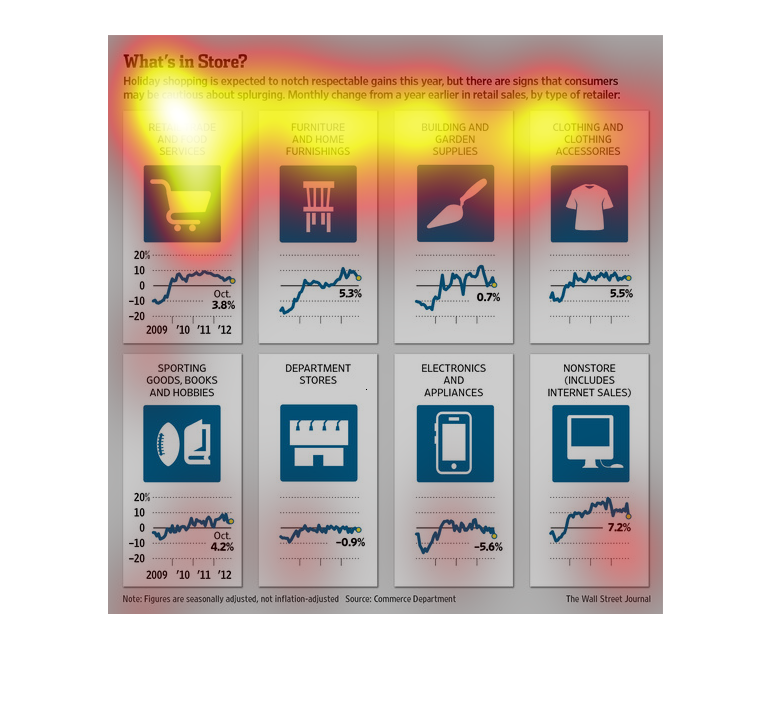
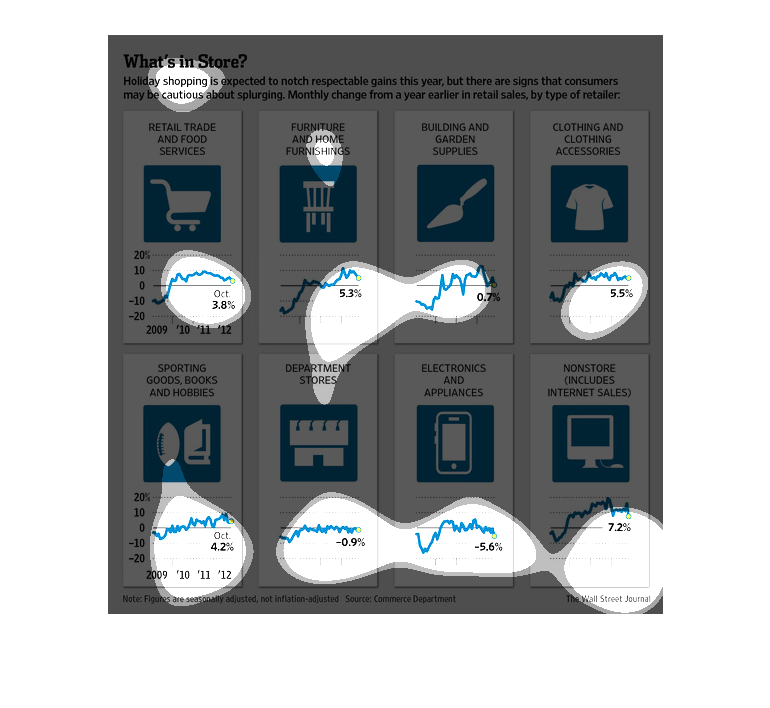
This shows anticipated holiday spending by categories such as furniture, building and garden
supplies, retail and food, clothing stores, sporting goods, electronics and appliances, department
stores, and wholesale.
This is a series of several charts depicting that holiday shopping is expected to get gains
but there were signs that consumers were being cautious to splurge.
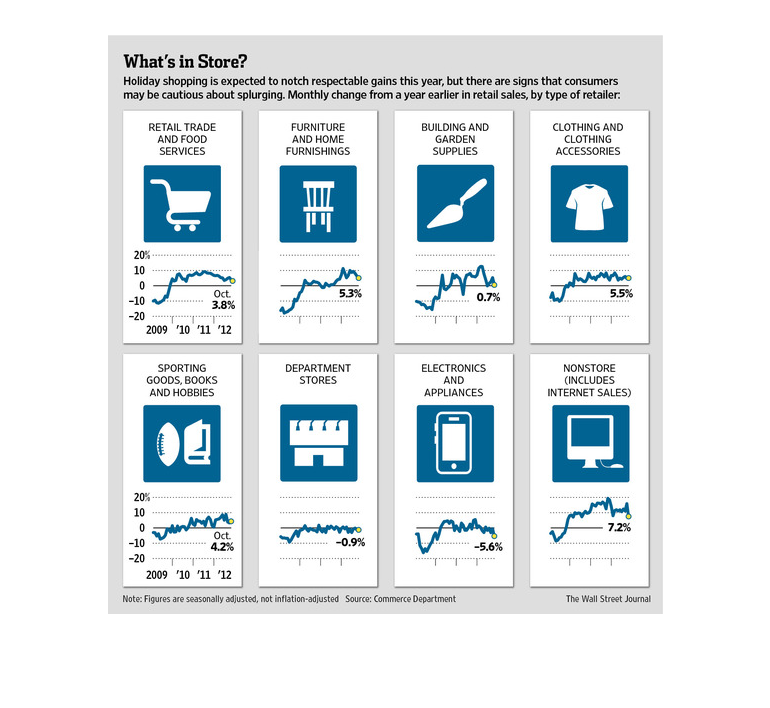
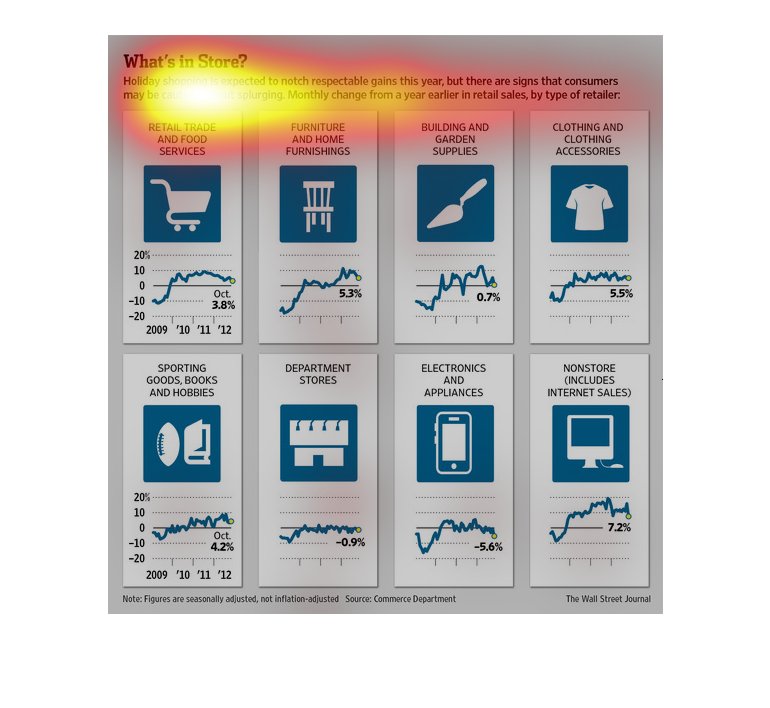
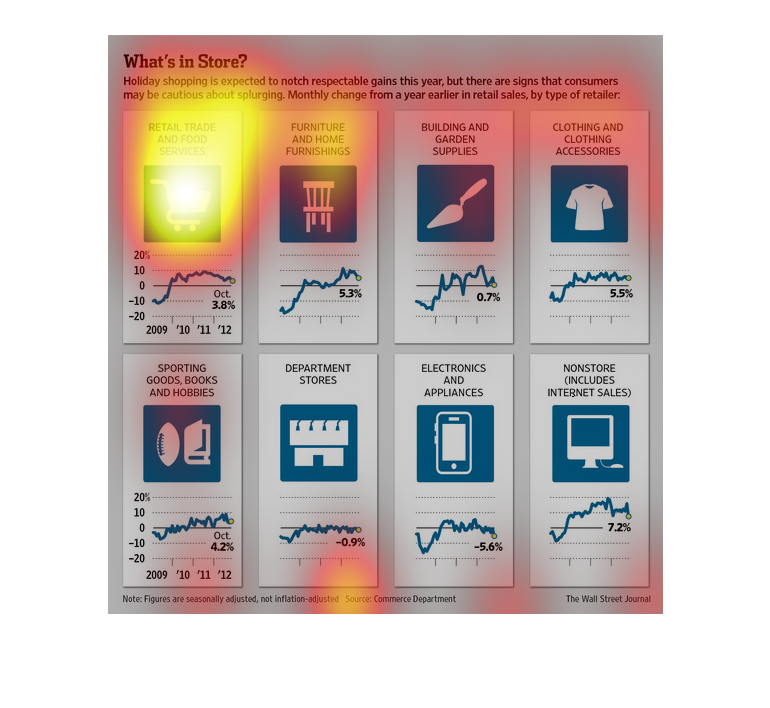
This chart describes what's in store. Specifically, holiday shopping is expected to notch
respectable gains this year, but there are signs that consumers may be cautious about splurging.
This is a series of statistics and related graphics depicting that holiday shopping was expected
to notch respectable gains that year, with signs that consumers may have been cautious about
splurging.
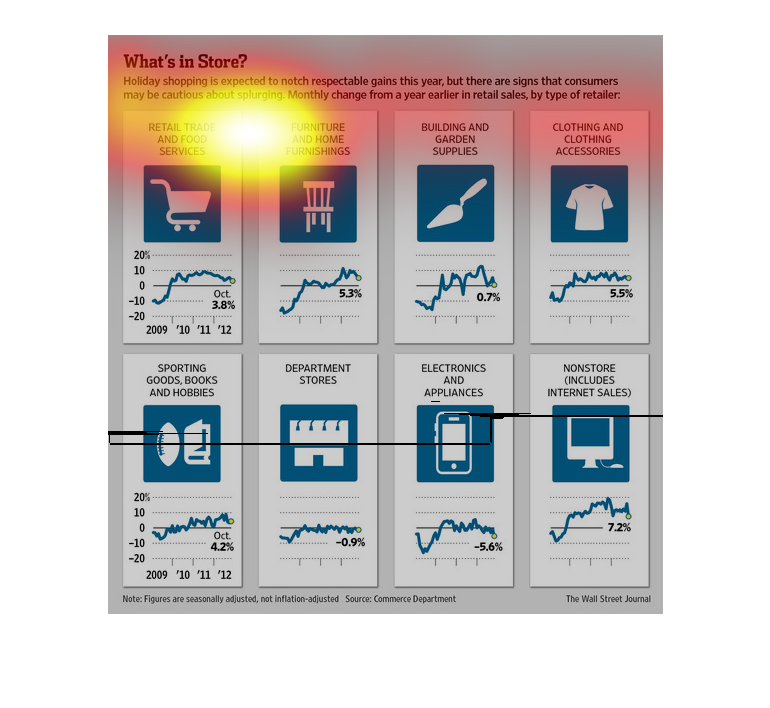
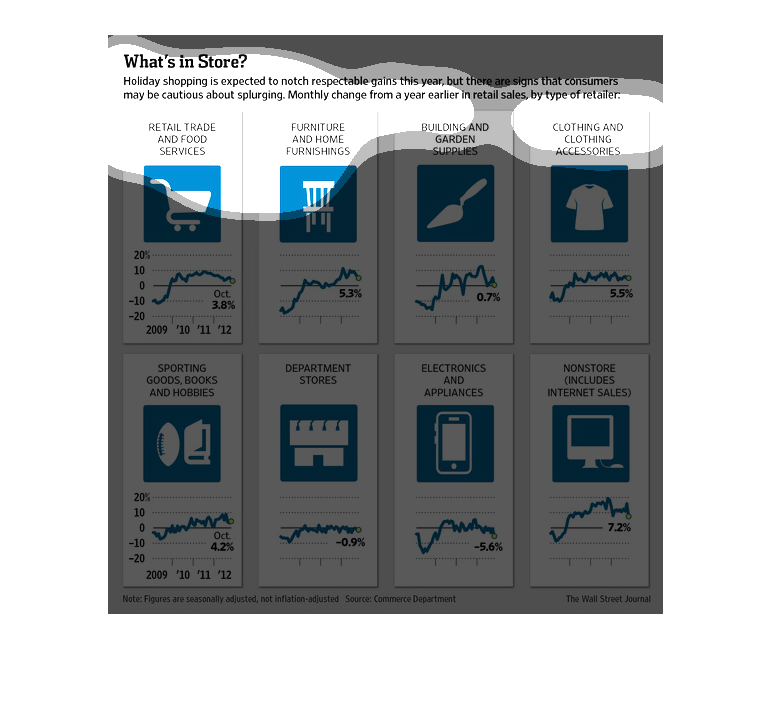
This chart shows monthly change in sales from a year earlier for different types of retailers
during the holiday season. Electronic and appliance sales decreased 5.6%, but internet sales
increased 7.2%. Most retailers had an increase in sales.
This chart shows monthly changes in sales across different departments in stores. The charts
generally show increased sales nearing Christmas in departments like furniture, sporting goods,
etc.
The image depicts expectation of holiday sales increase slightly, although consumers are careful
about spending too much. Different categories of consumer purchases are listed, with noticeable
increases almost across the board, showing slight increases.