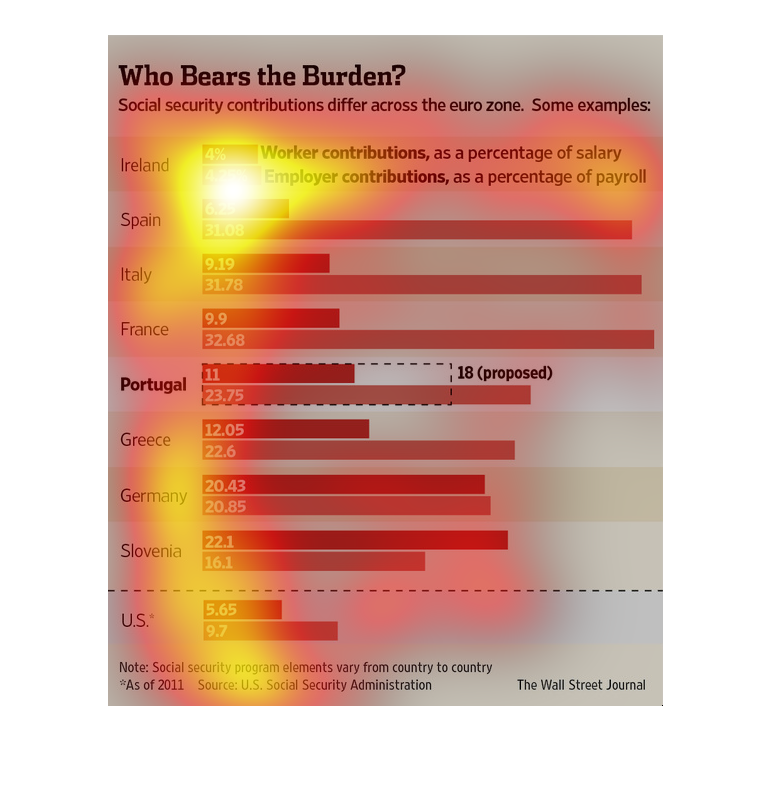
This image is detailing the burden of Social Security, or who is mostly responsible, workers,
or employers, for the financial compensation received after retirement. It includes 8 European
countries and the United States. Most countries show that the employer bears the majority
of the burden, but two countries, Ireland and Germany are very much equal.
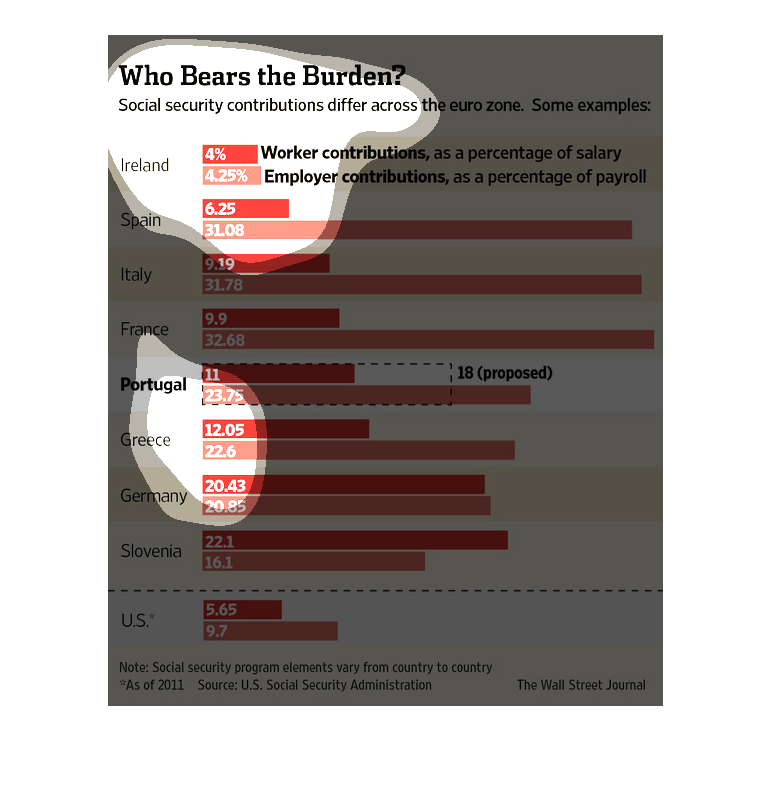
This chart breaks down the amount of Social Security contributions given by employees versus
the amount of contributions given by employers. It's broken down by country
The following chart is titles who bears the burden. It shows the different. It shows what
countries provide the most social security contributions across the Euro Zone.
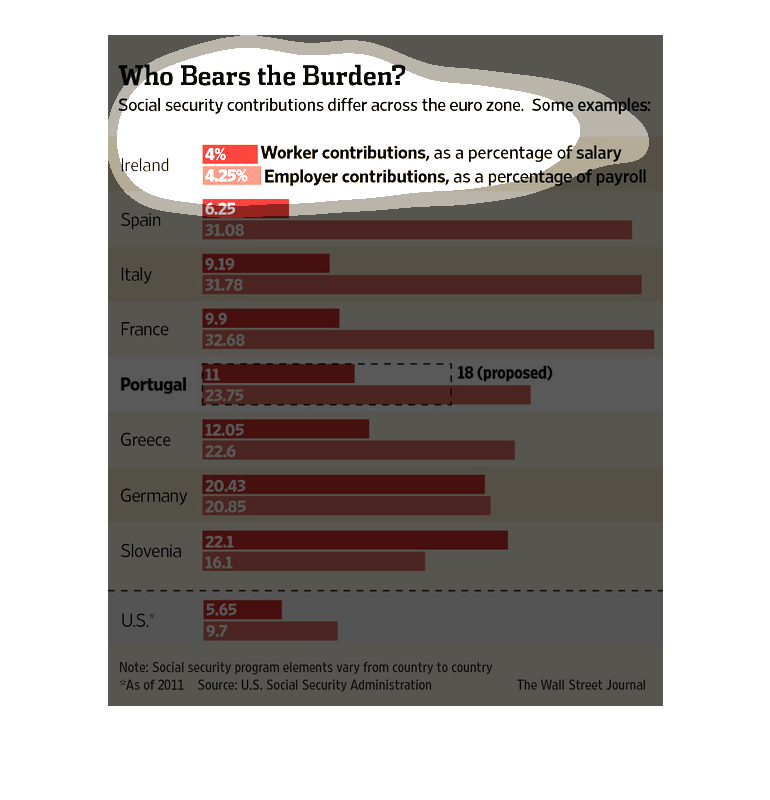
This shows the contrbution to the social security system in the euro zone. The contributions
from different nations in the euro zone are shown and compared in bar graph form.
This is a series of charts and related statistics depicting that social security contributions
differ across the euro zone and provides data from several selected countries.
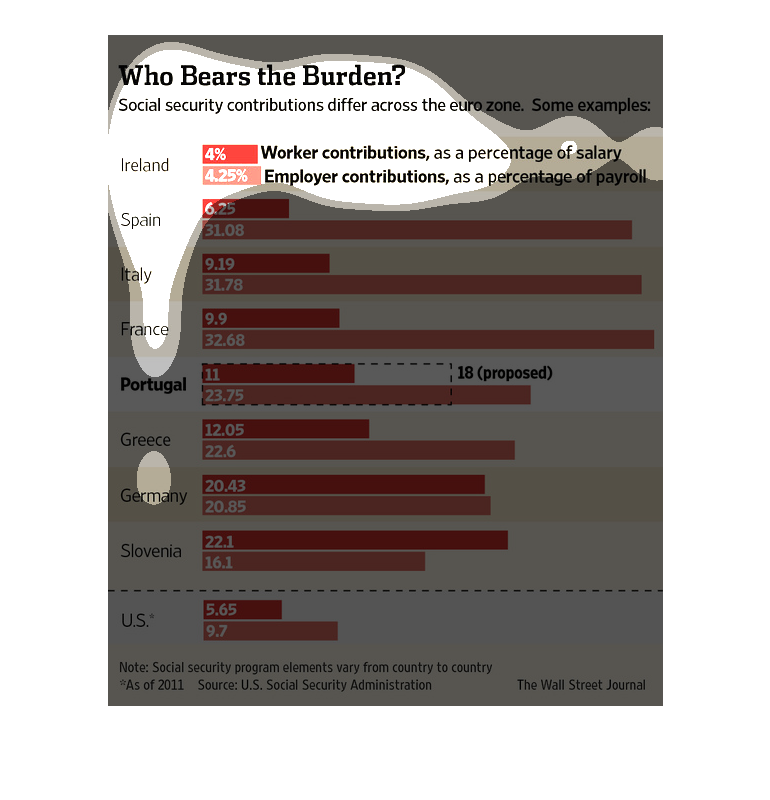
This chart compares who pays into social security, employers or employees across different
countries. France has the biggest employer contribution while Slovania relies more on the
individual employee than the company contribution.
This is a series of color coded bar graphs depicting that social security contributions differ
across the Euro Zone and give a selected group of countries as examples.
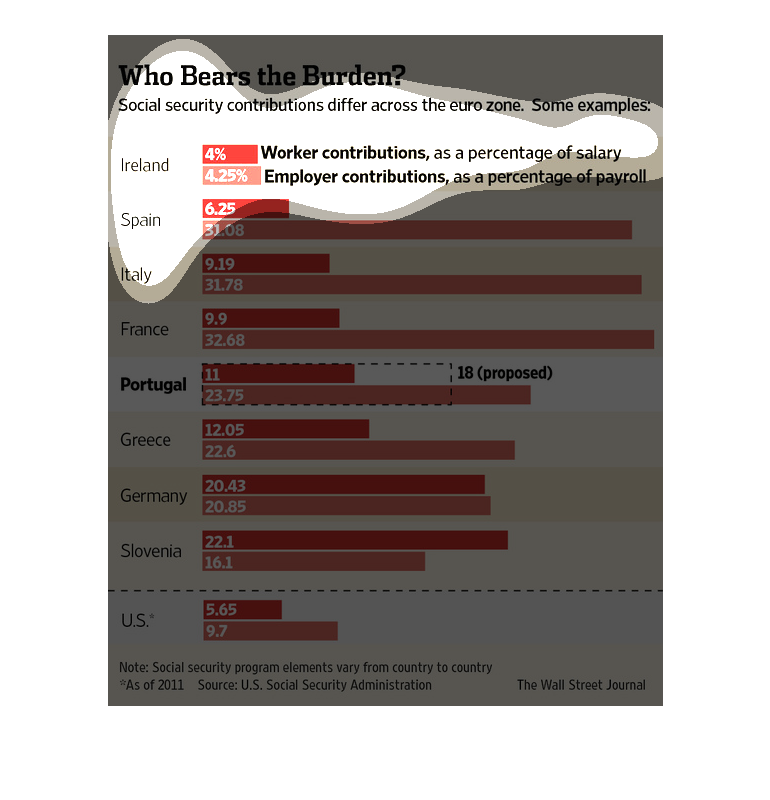
This chart describes who bears the burden. Countries on the chart include Ireland, Spain,
Italy, France, Portugal, Greece, Germany, Slovenia, and the U.S.
This is a bar chart that shows who pays the burden for social security in the euro zone. There
are various countries listed and the output is the worker and employer contribution as a percentage
of salary and payroll. It s then compared to the US.
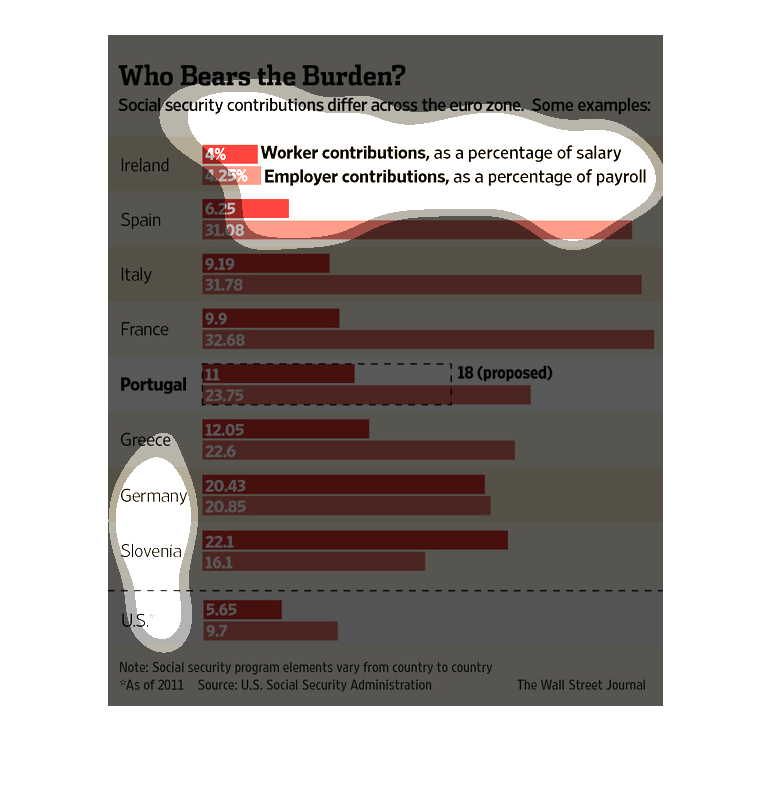
This chart describes who bears the burden. Specifically, social security contributions differ
across the euro zone. Countries on the chart include Ireland and Spain.
This graph compares social security contributions across the Eurozone. Workers in Ireland
contribute 4%  of their paychecks. Workers in Slovenia contribute 22% of their paycheck. In
France, Italy, and Spain, employers contribute significantly more that the workers.
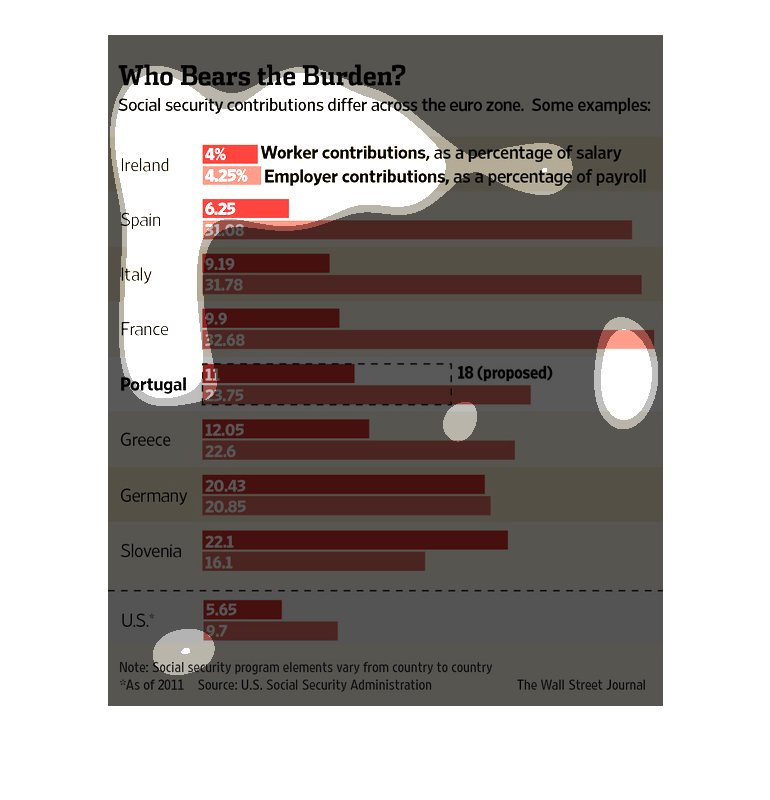
This graph shows the different Social Security contributions across the Euro zone. France
has the highest employer contributions while Ireland has the lowest. Slovenia has the highest
worker contributions while Ireland has the lowest again.
This is a Wall Street Journal article reporting how social security contributions differ across
the Euro Zone.  The graph indicates a worker's contribution as a percentage of his/her salary
and a company's contribution as a percentage of its payroll.  There are big differences between
the countries.
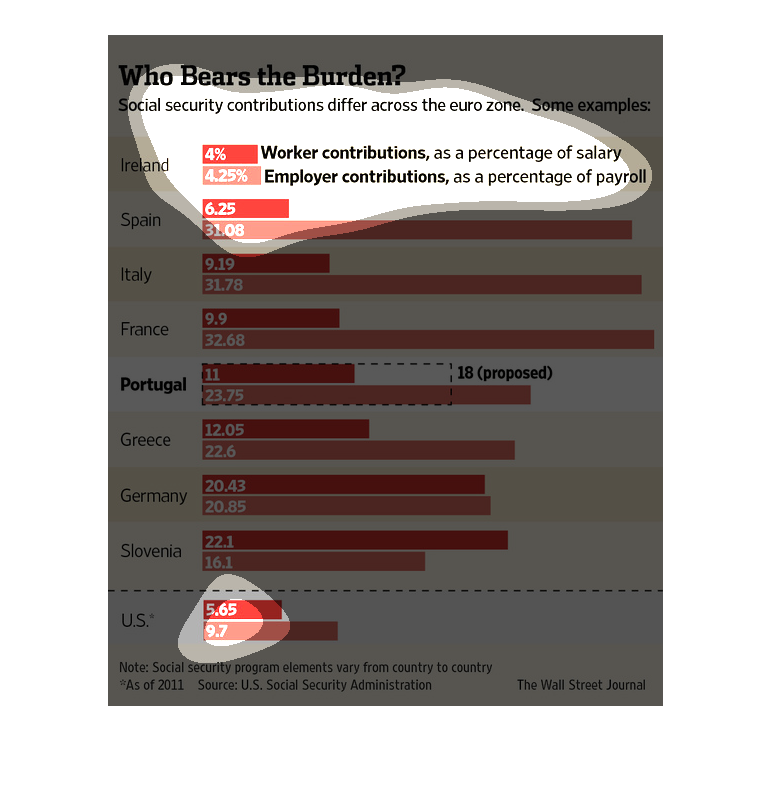
The image depicts social security contributions differing across the Eurozone. Ireland appears
to be contributing the least to social security within the EU, while France appears to be
contributing the most.
Across Europe, there are large discrepancies as to who pays social security costs: the employee
or the employer. In Ireland and Germany it's fairly equally distributed. In Slovenia, the
employee pays more. In Spain, Italy Greece and Portugal, similar to the United States, the
employer picks up most of the tab for social security.