This is a series of charts and related statistics depicting that Barak Obama had a lead over
Mitt Romney in three key battleground states in the election on 2012.
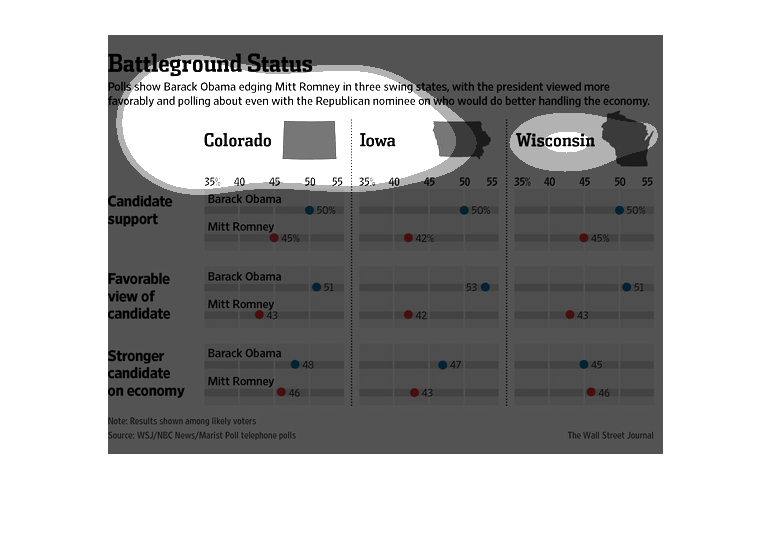
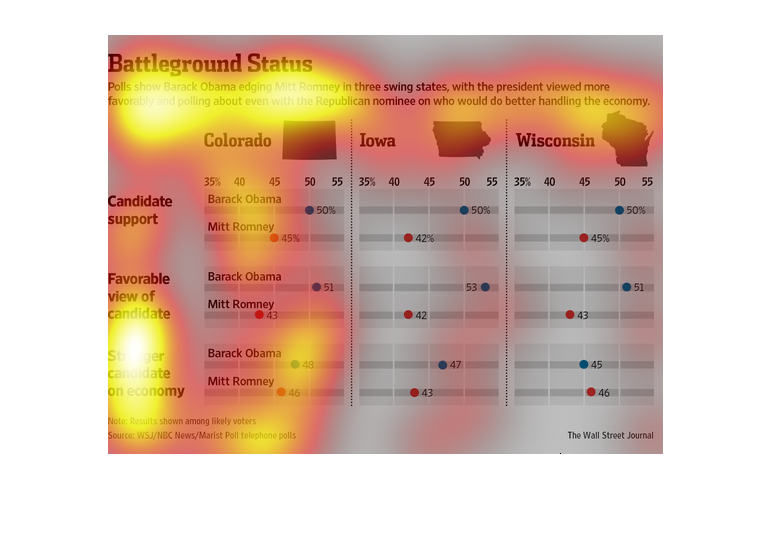
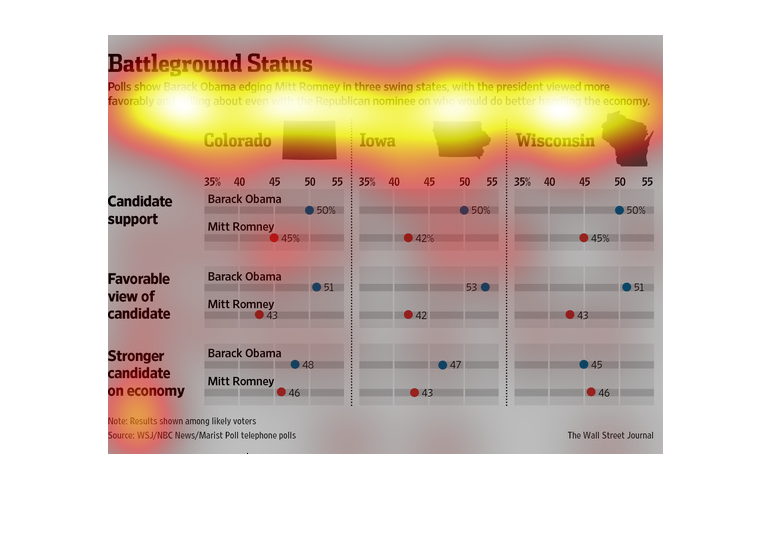
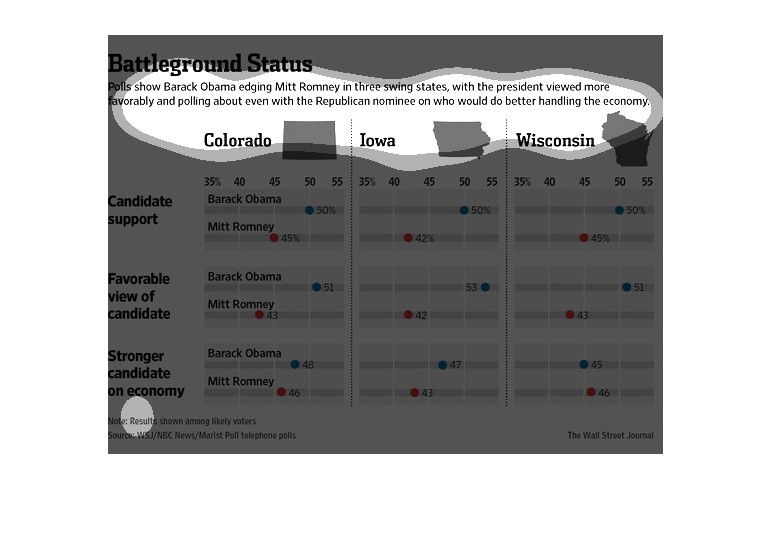
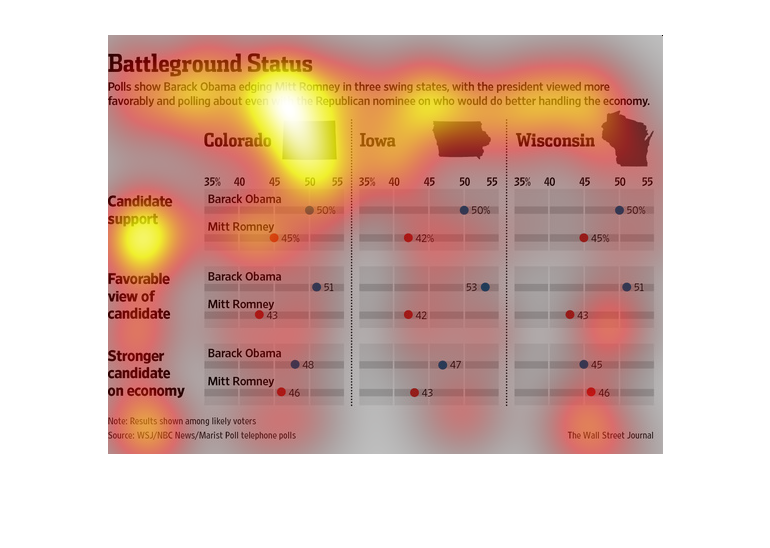
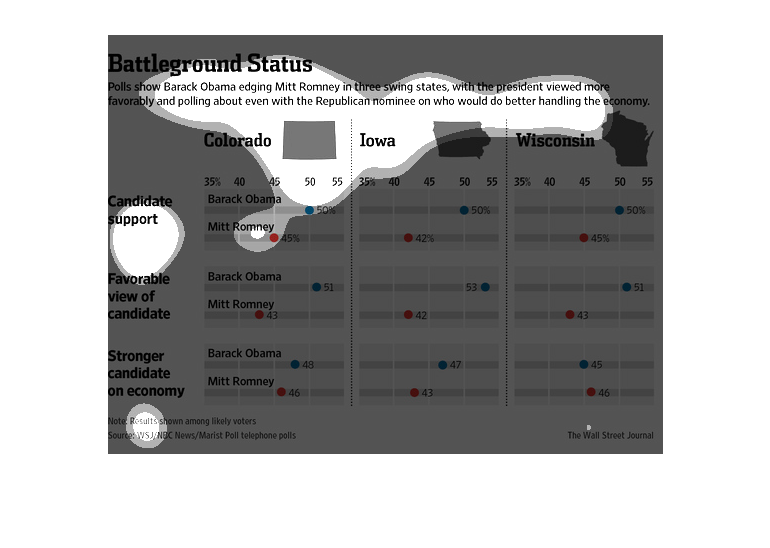
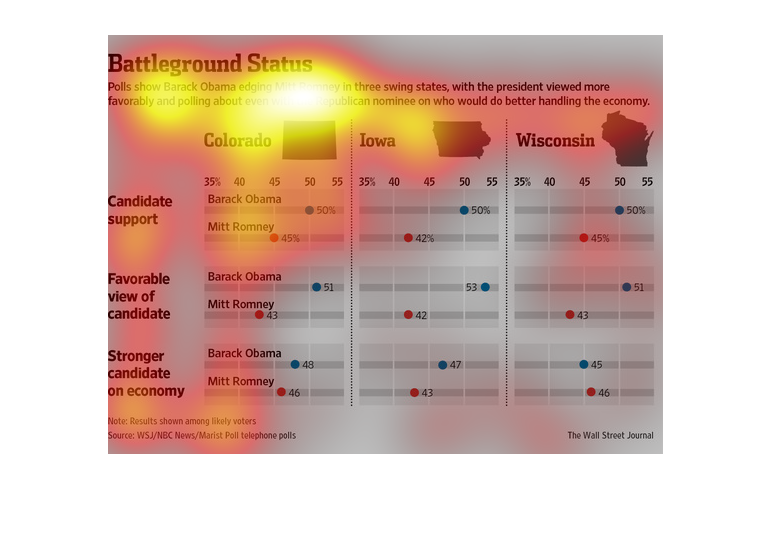
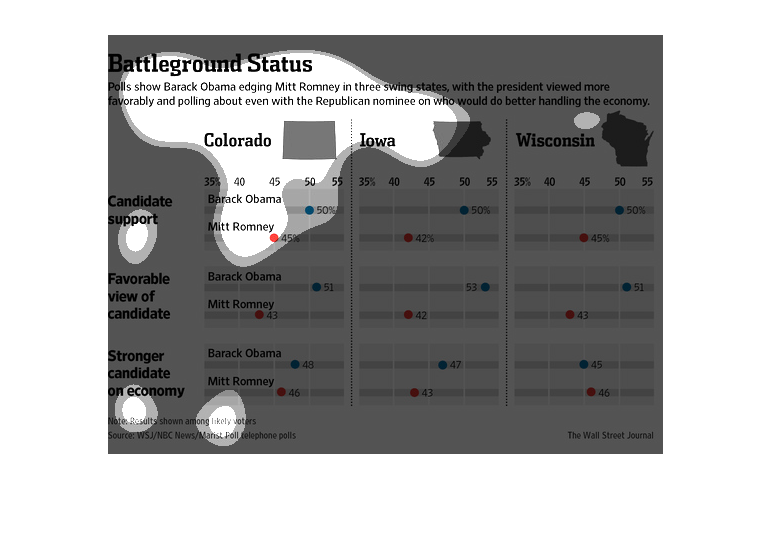
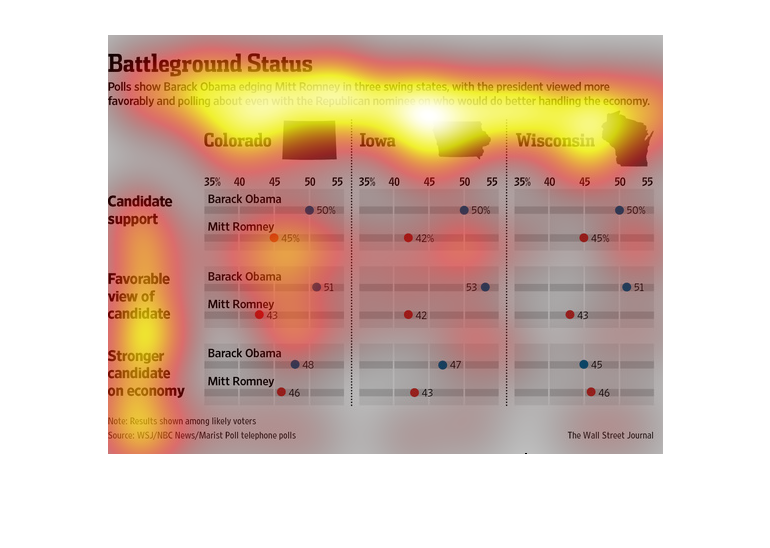
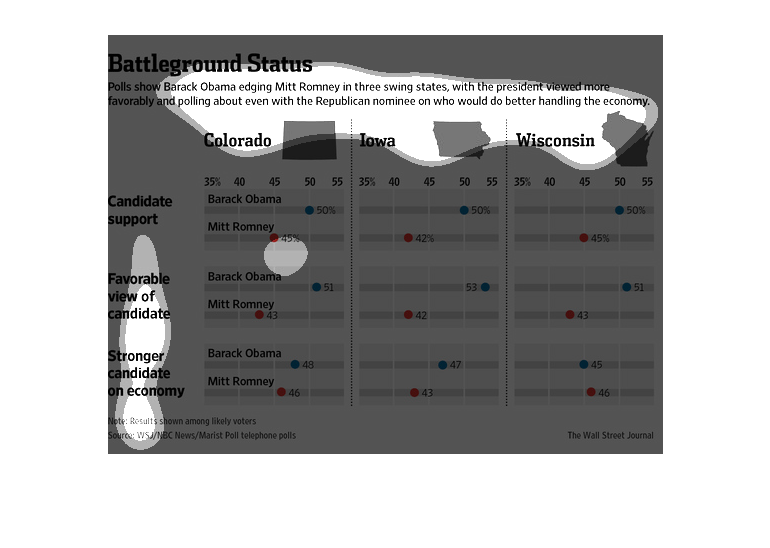
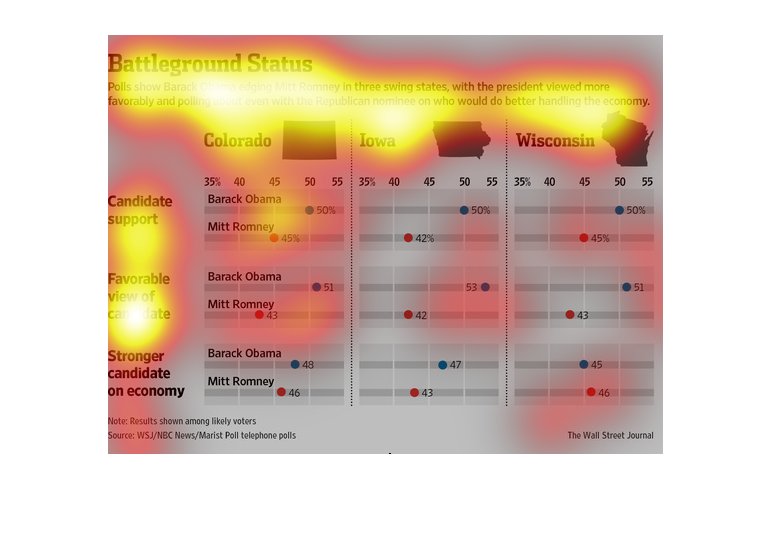
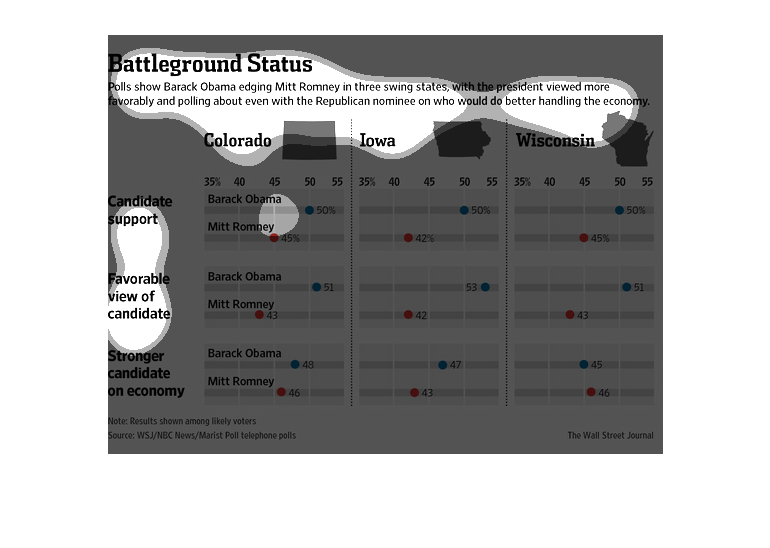
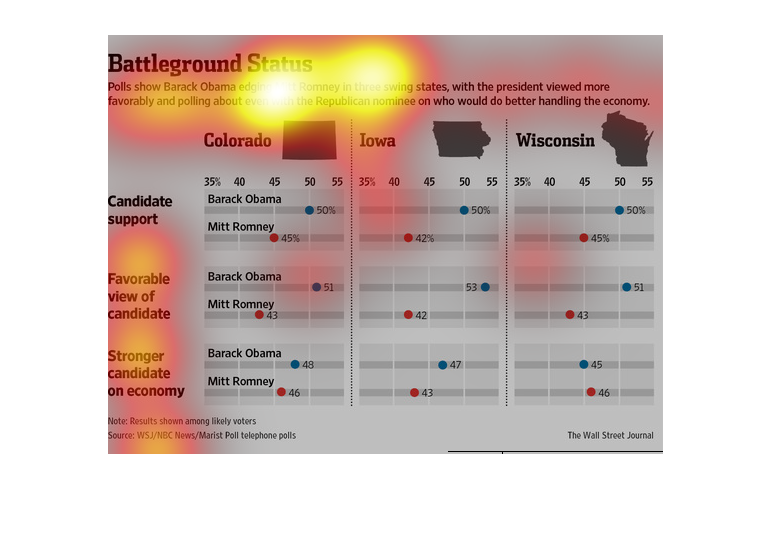
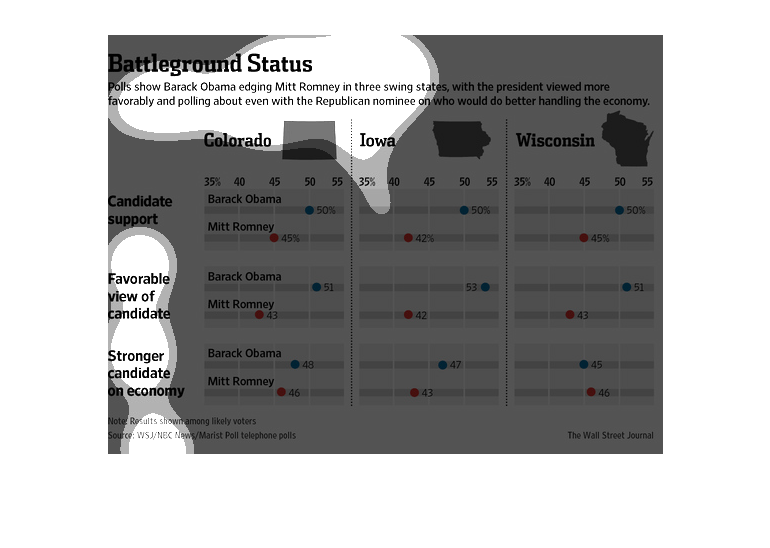
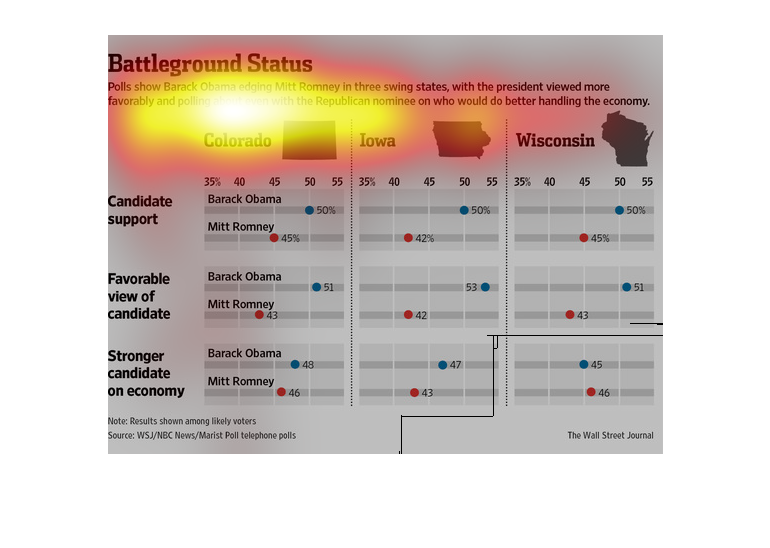
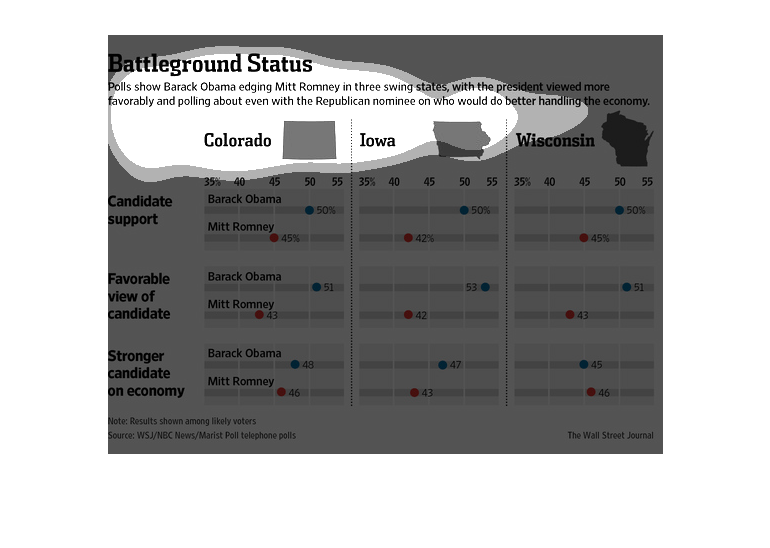
This chart describes battleground status. Specifically, polls show Barack Obama edging Mitt
Romney in three swing states, with the president viewed more favorably.
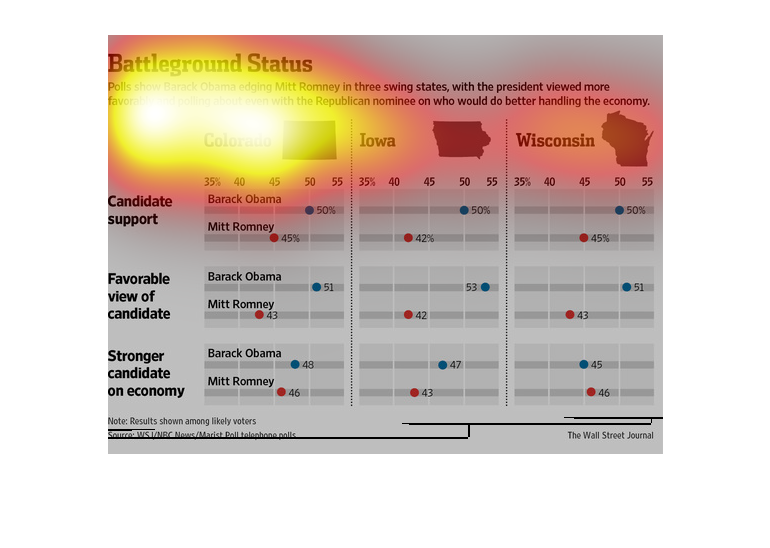
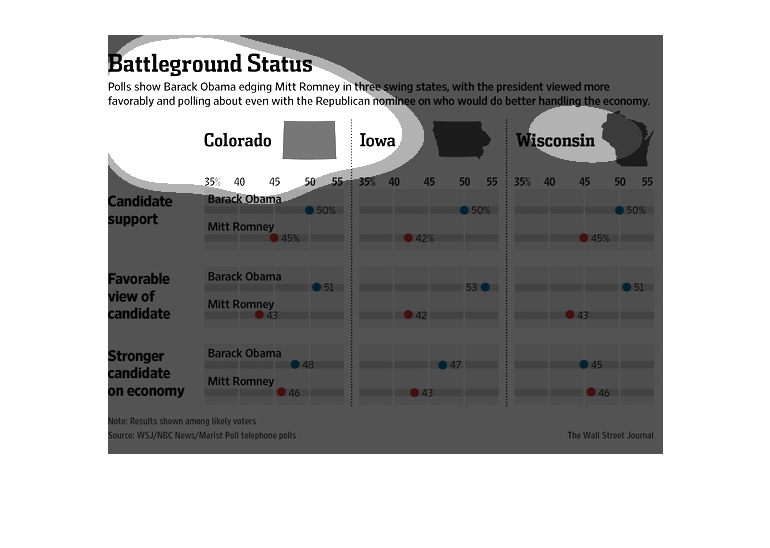
This chart depicts Obama beating Mitt Romney in the presidential election in several swing
states. His victories are implied even with Romney's supposed better handling and understanding
of the US economy. Obama's percentages hover around 48-51% whereas Romney's are in the mid
40's.
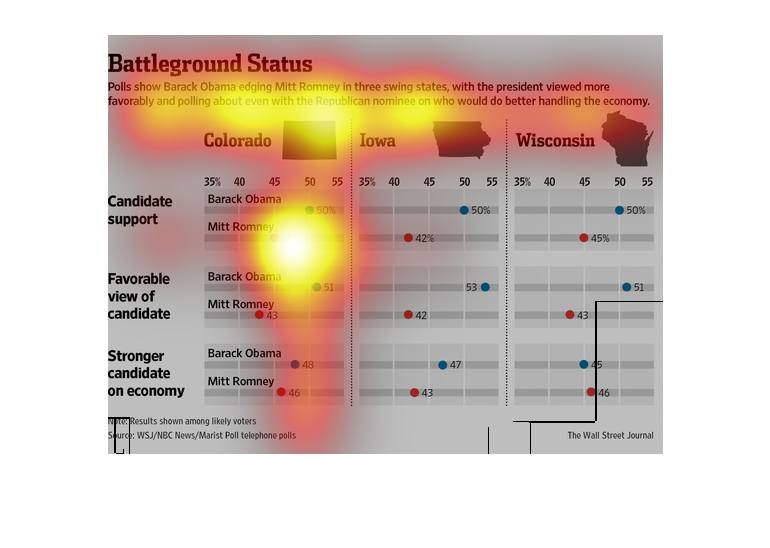
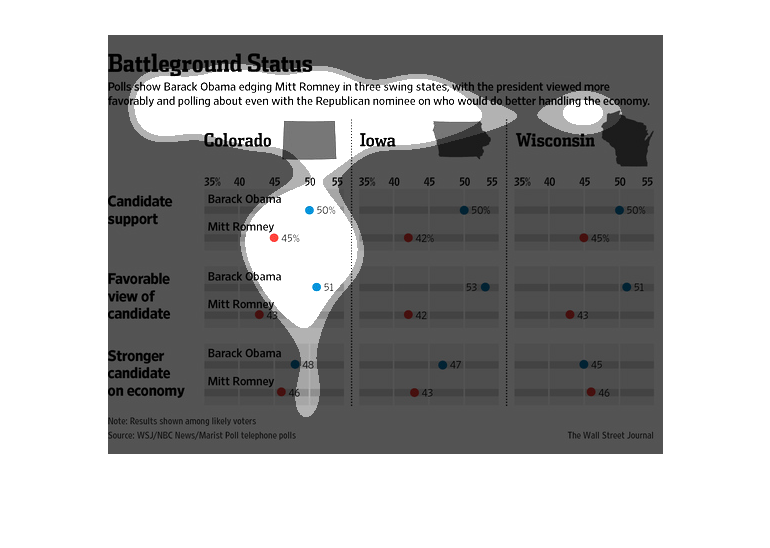
This is a table that shows three states that Obama was trying to get during his re-election;
Colorado, Iowa and Wisconsin. The table details how each state feels about him versus Romney.
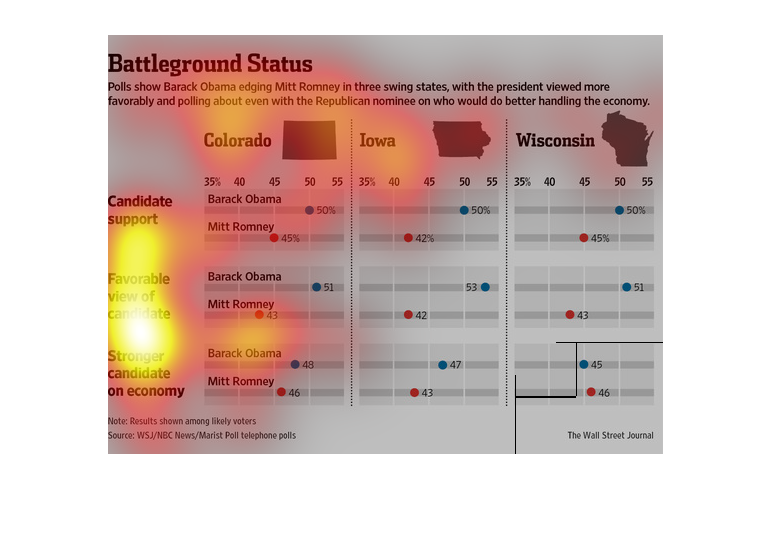
The following chart showed that Barrack Obama was edgining out candidate in three crucial
Swing States. Even when the issue on handling the economy came about Obama outscored him.
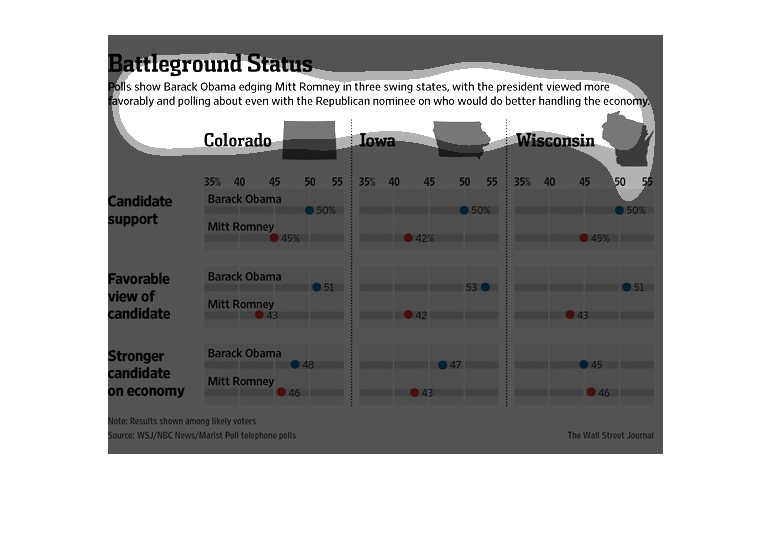
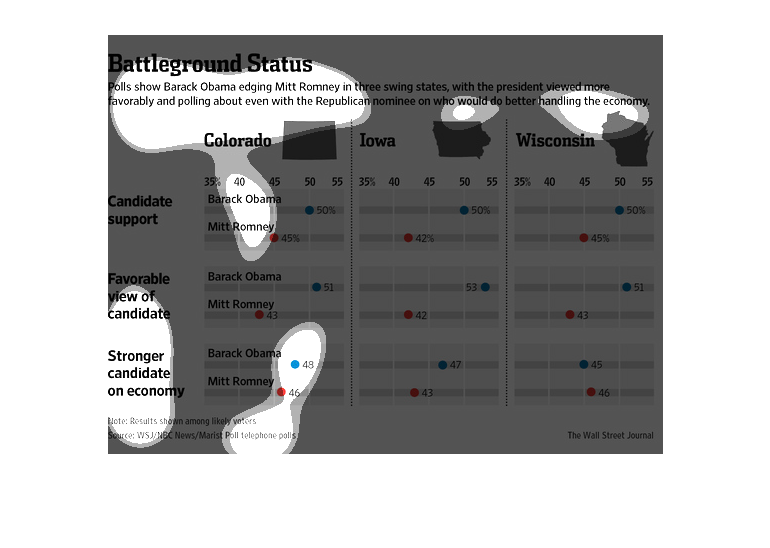
This inforgraphic shows that Barack Obama lead Mitt Romney in three swing states on the issues
of handling the economy. The 3 states are Wisconsin, Colorado, and Iowa. Obama had 50% support
while Romney only had 42-45% in these states. Obama had an overall higher favorability and
economy favorability rating.
This chart describes battleground status. Specifically, polls show Barack Obama edging Mitt
Romney in three swing states, with the president viewed more favorably.
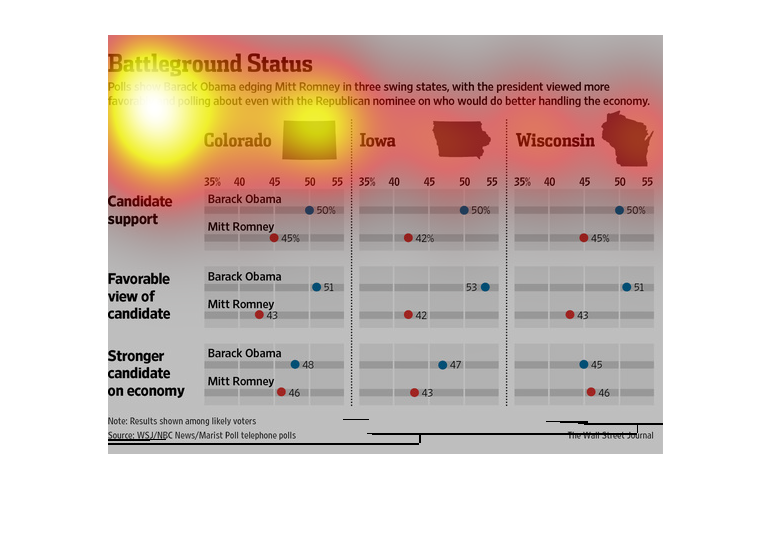
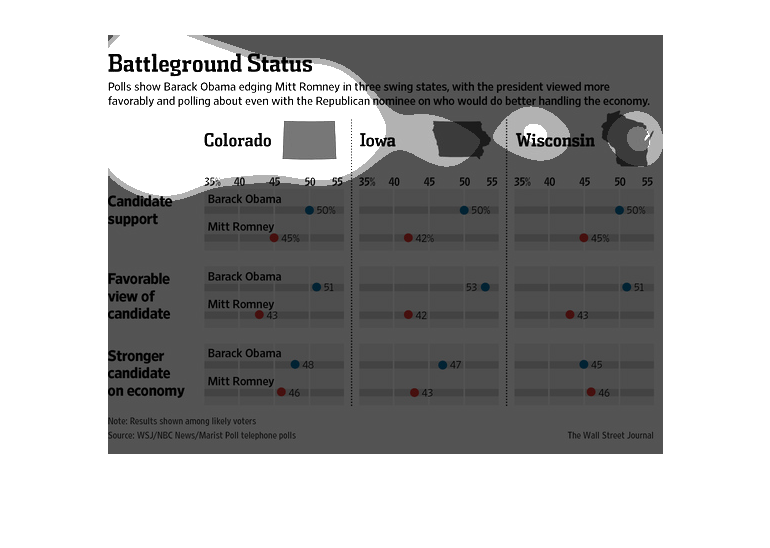
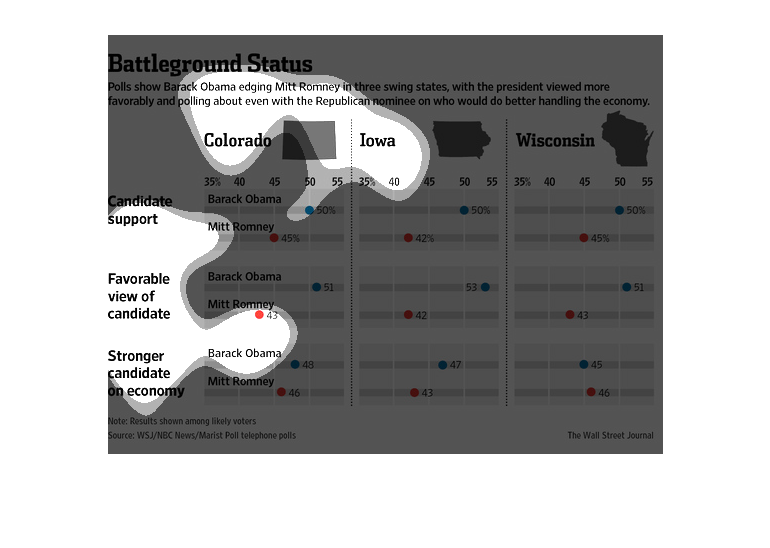
This chart compares opinions in swing states on who would better handle the economy, Barack
Obama or Mitt Romney. Obama had more support overall and people viewed him more favorably
in all three states. Voters in Colorado and Iowa thought he would do better on the economy,
but voters in Wisconsin thought Mitt Romney would do a better job handling the economy.
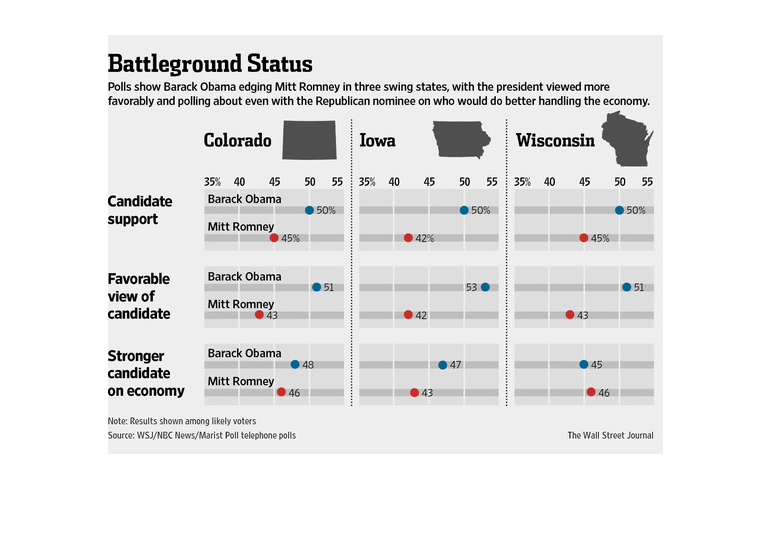
This graph gives three different topics. It shows the popularity of Barack Obama versus Mitt
Romney in 3 different states for EACH topic.  Three topics, three states, so there are 9 different
comparisons altogether.
The image describes the overall favorability and economic strength of presidential candidates,
Barack Obama and Mitt Romney in 3 battleground states during the 2012 Presidential Election.
Barack Obama led Mitt Romney in favorablity and public support in Colorado, Wisconsin, and
Iowa, but was they were almost even when it came to their strength in handling the economy.
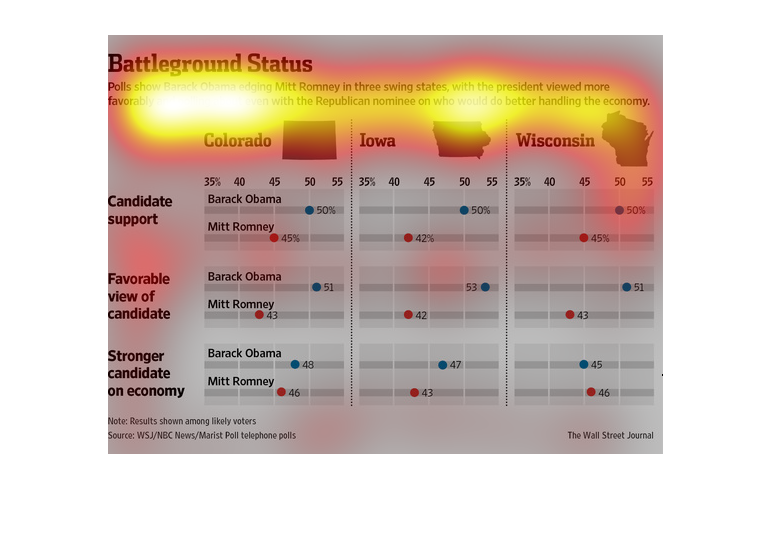
This chart compares Mitt Romney and Barack Obama in Colorado, Iowa, and Wisconsin. Obama has
more overall support and a more favorable view in all three states, but voters in Wisconsin
think Romney will do a better job handling the economy.
A graph of the 2012 Presidential Election between Mitt Romney and Barack Obama. Depicts the
candidate support, how favorable the candidate is, and their economic support.
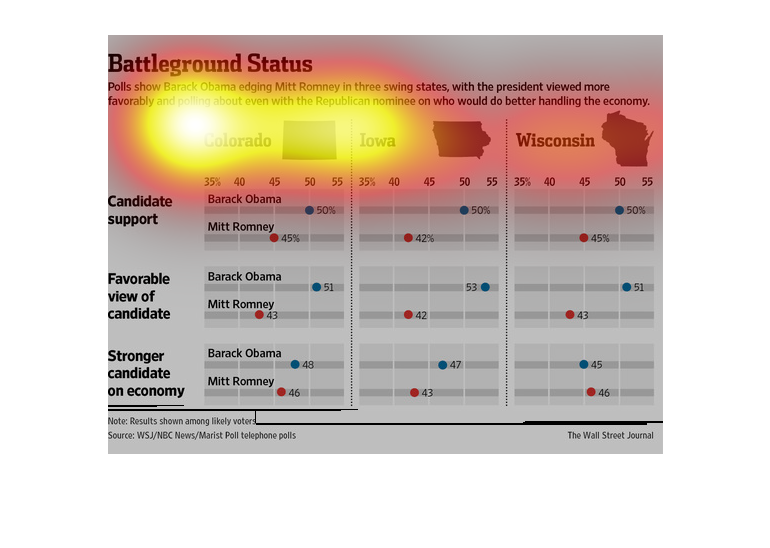
This chart deals with a poll about about who would do a better job handling the economy. The
two choices were between Barack Obama and Mitt Romney. Barack Obama edged out Romney.
This is a graph of political favorings between Barack Obama and Mitt Romney in Wisconsin,
Iowa, and Colorado. It is separated into 3 categories: How strong the candidate is in the
economy. A favorable view of the candidate. Candidate support. It is from the Wall Street
Journal.
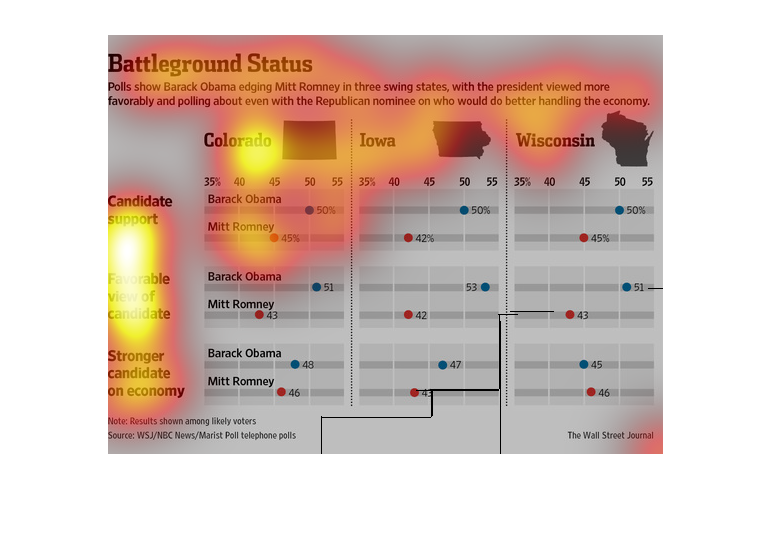
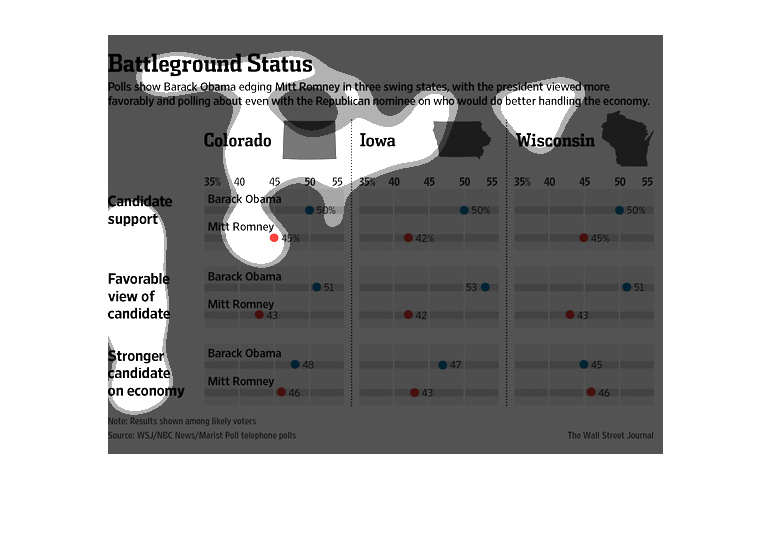
Battleground status. Graph discuss about the poll between barak obama and Mitt Romney, on
who would be better handling the economy.Poll was from three states which are Colorado, Iowa
and Wisconsin. Poll is divided into three parts which are candidate support, favorable view
of candidate and stronger candidate on economy. Obama have more polls compared to Mitt Romney
in all three states or they almost tie in most of the factor