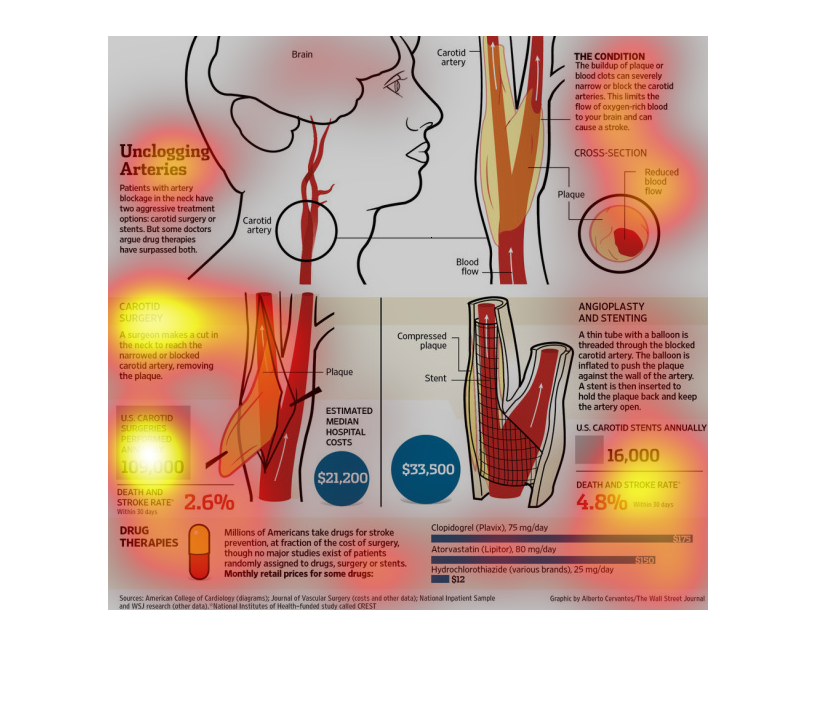
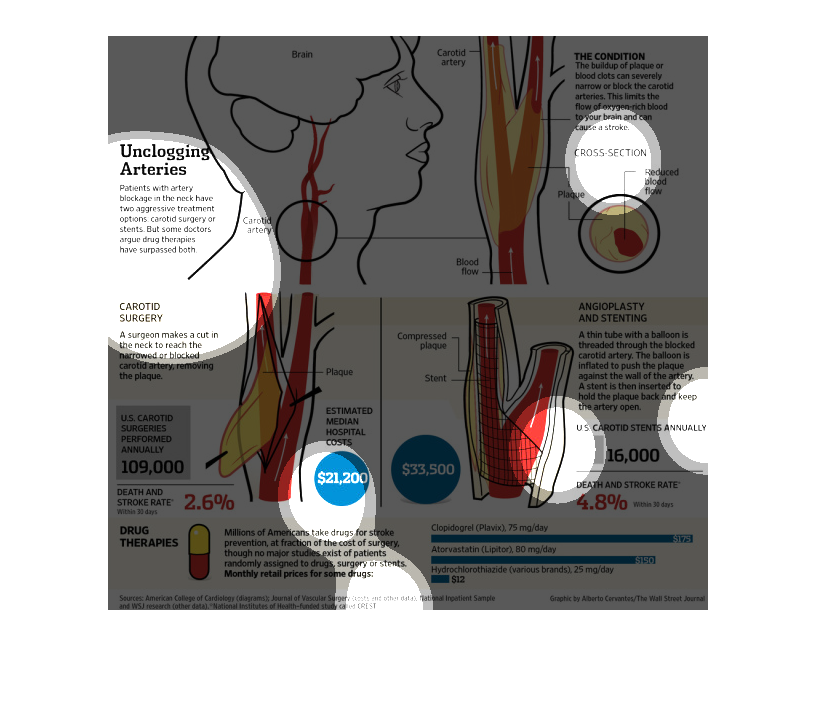
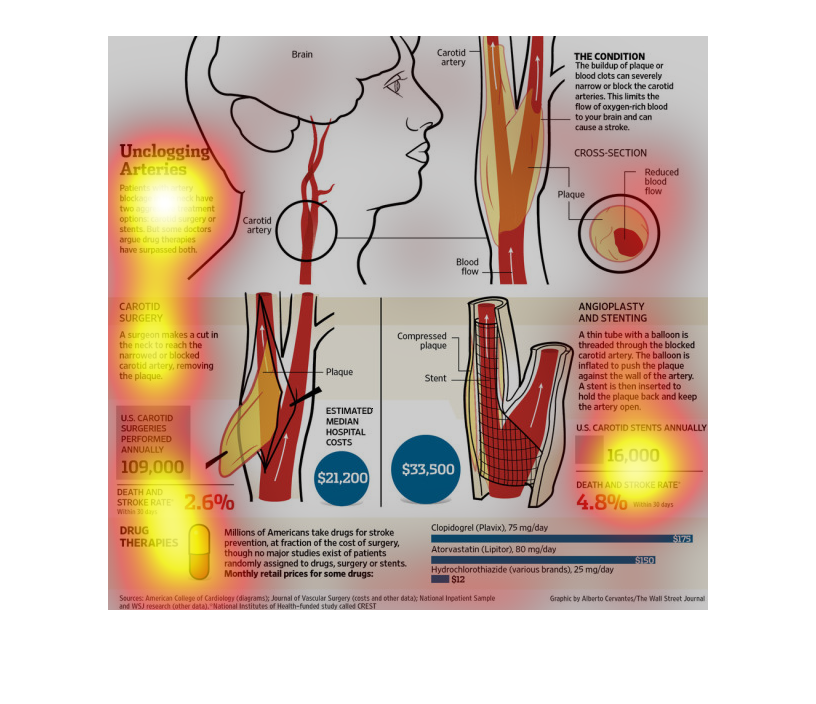
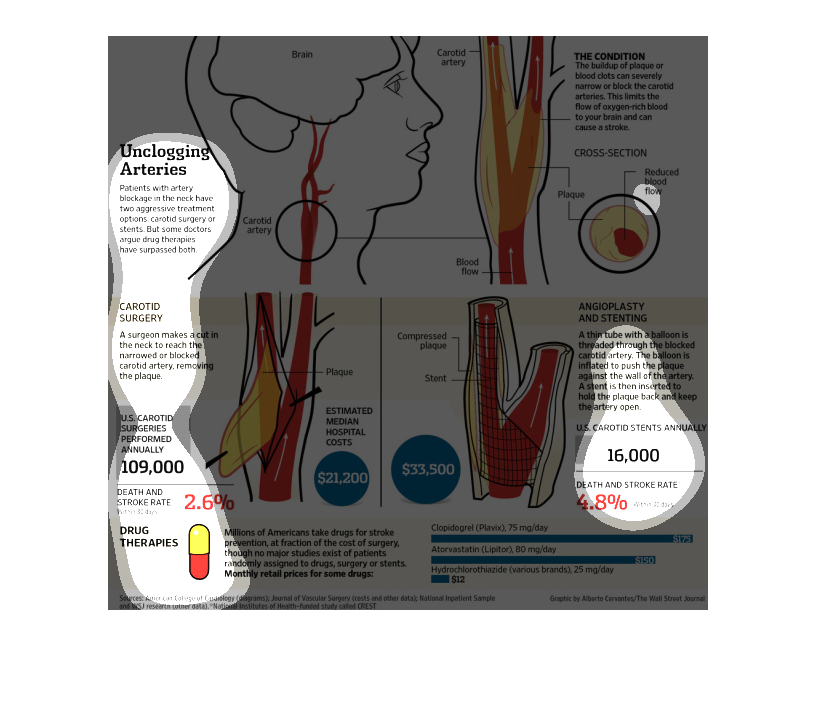
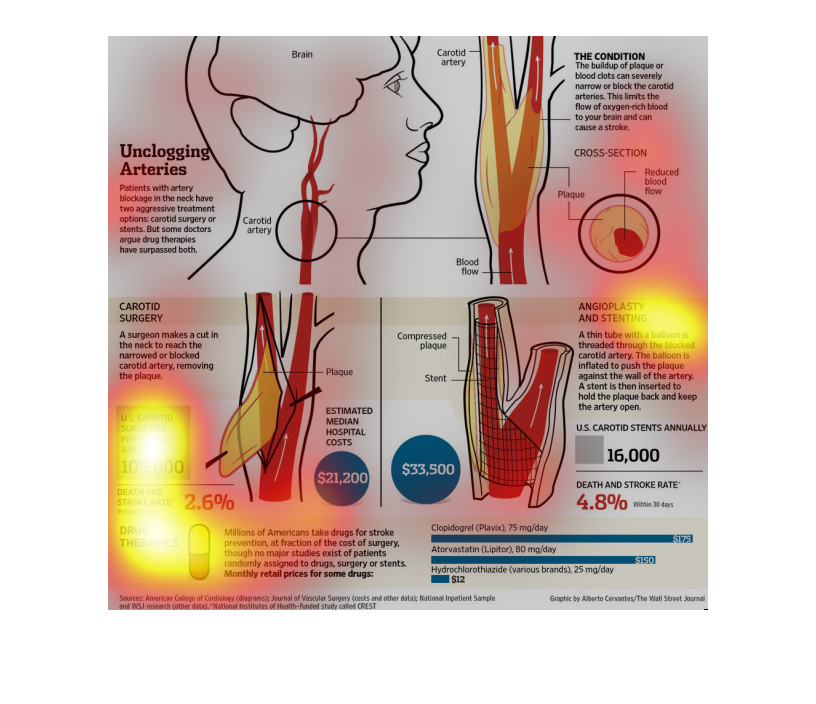
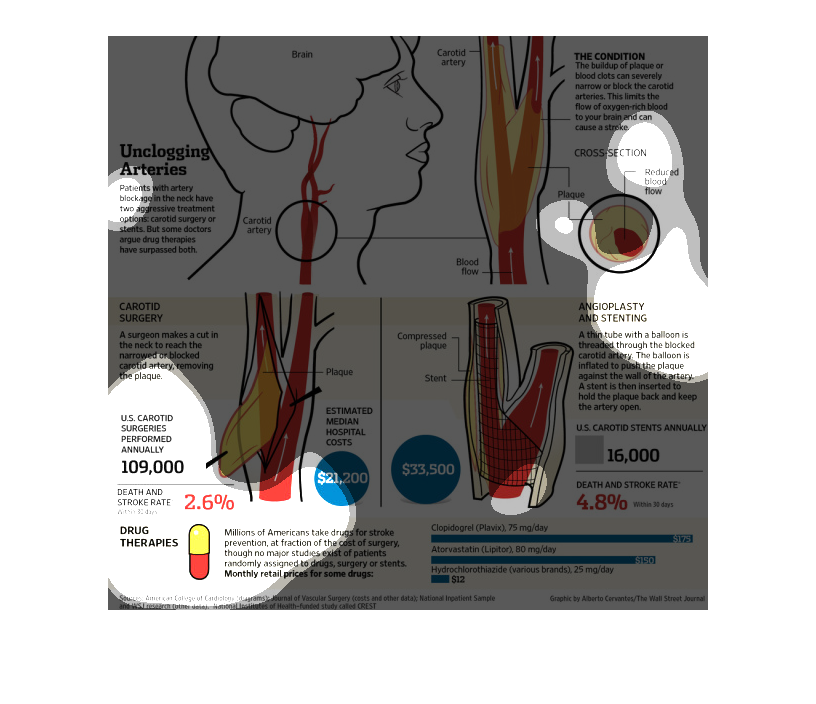
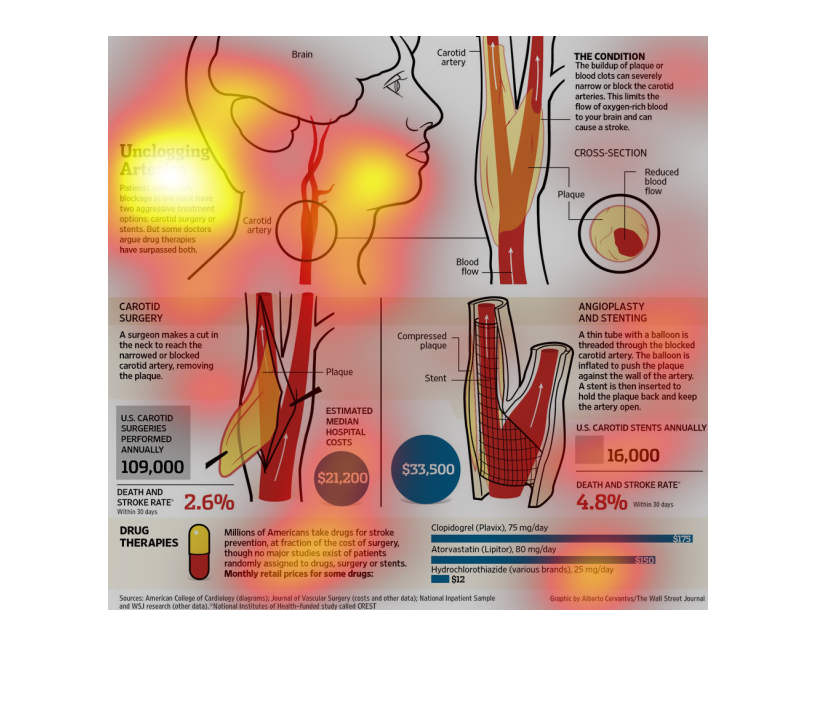
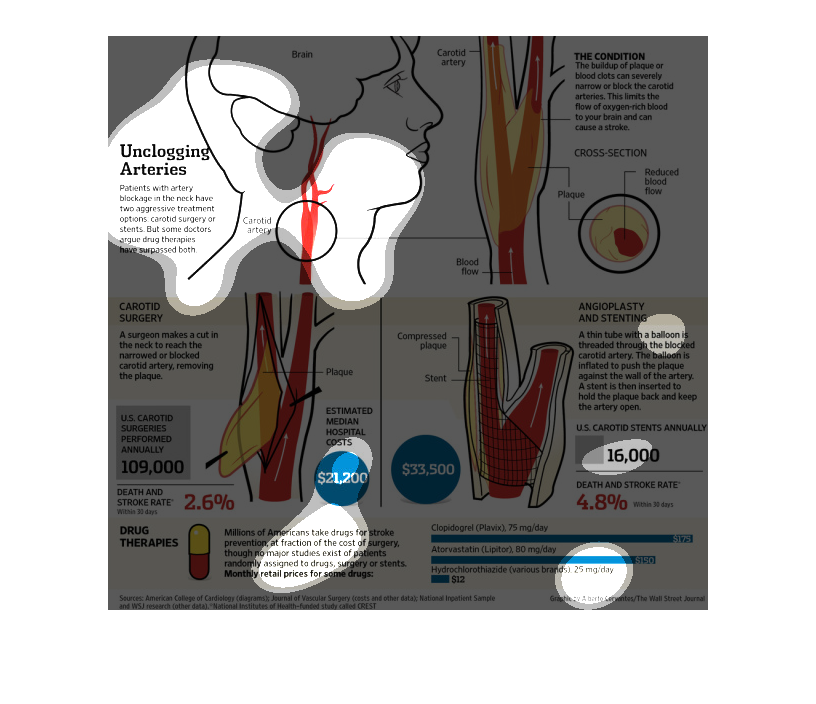
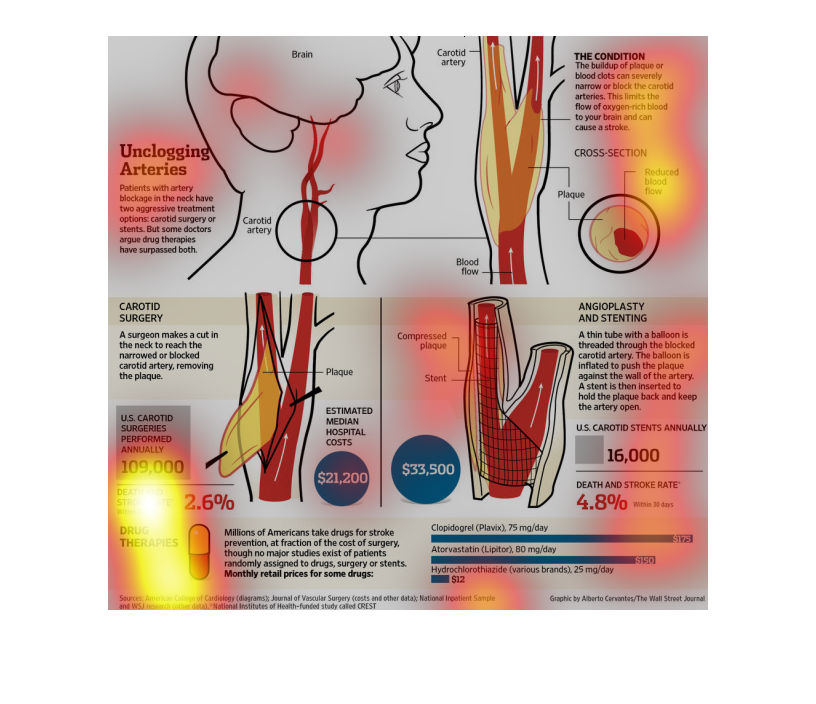
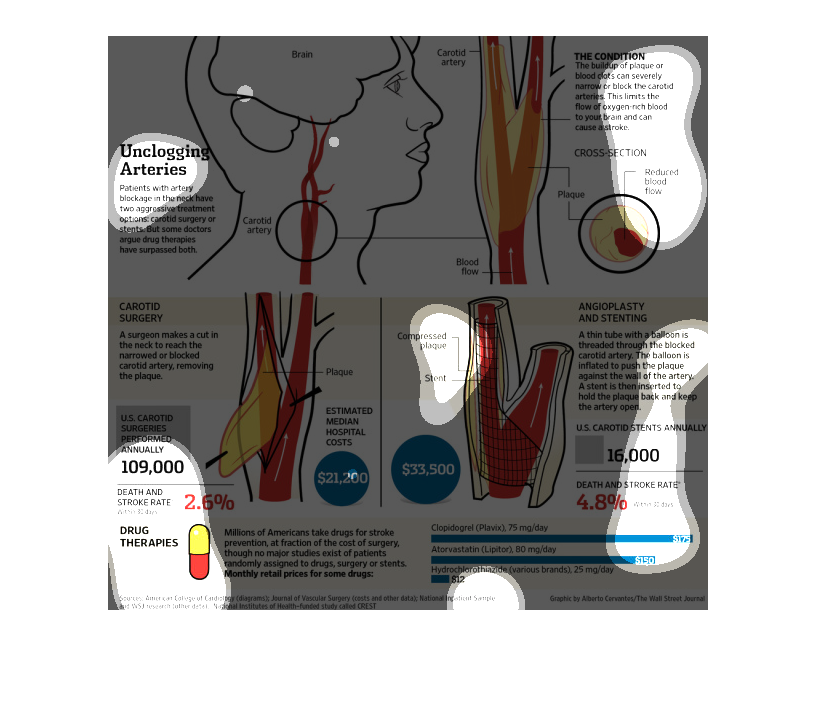
This chart describes unclogging arteries. Specifically, patients with artery blockage in the
neck have two aggressive treatment options. The chart includes illustrations.
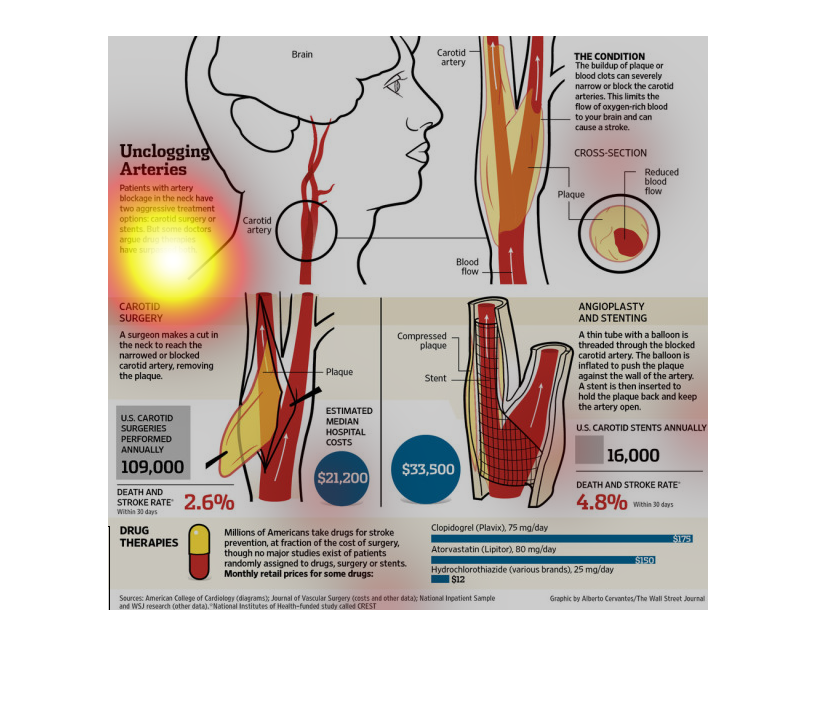
This chart describes unclogging arteries. Specifically, patients with artery blockage in the
neck have two aggressive treatment options. Categories represented by different colors.
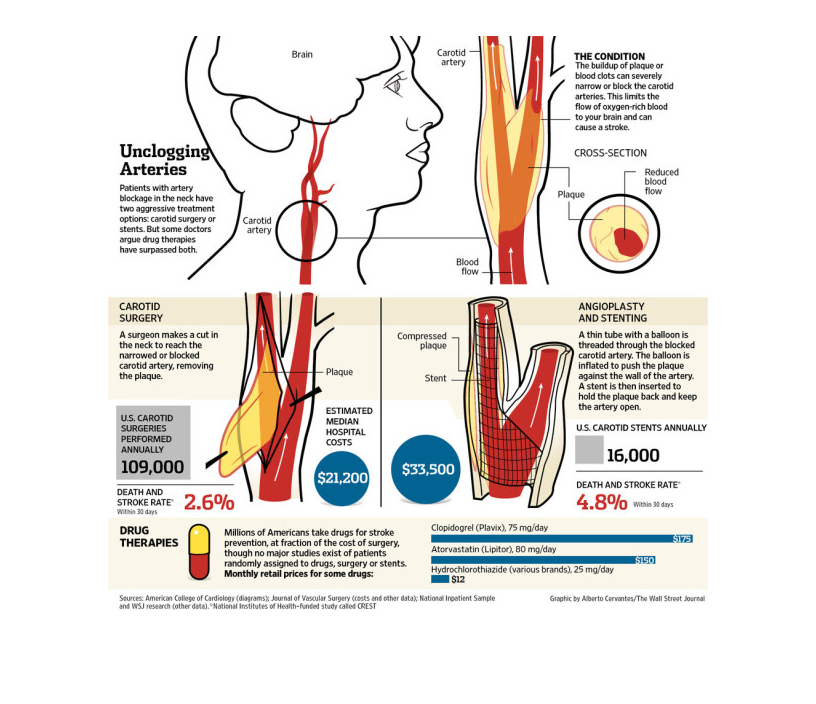
This is a colored diagram and associated statistics showing how the surgical process to unclog
heart arteries is done, and how different heart and stroke therapies work.
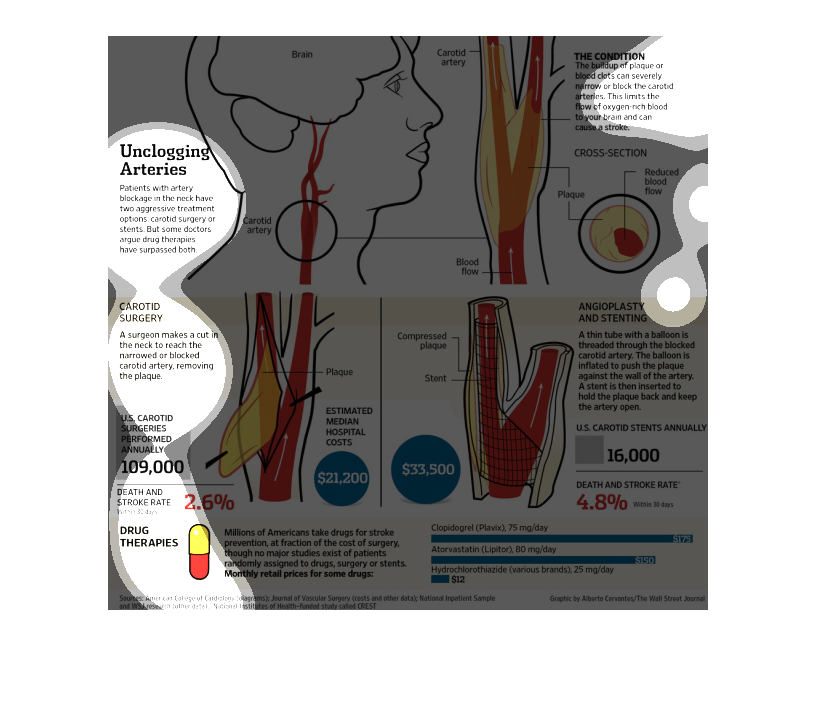
This is a exploded view diagram depicting how surgeons perform various procedures and the
drugs involved with the un clogging of arteries from plaque buildup.
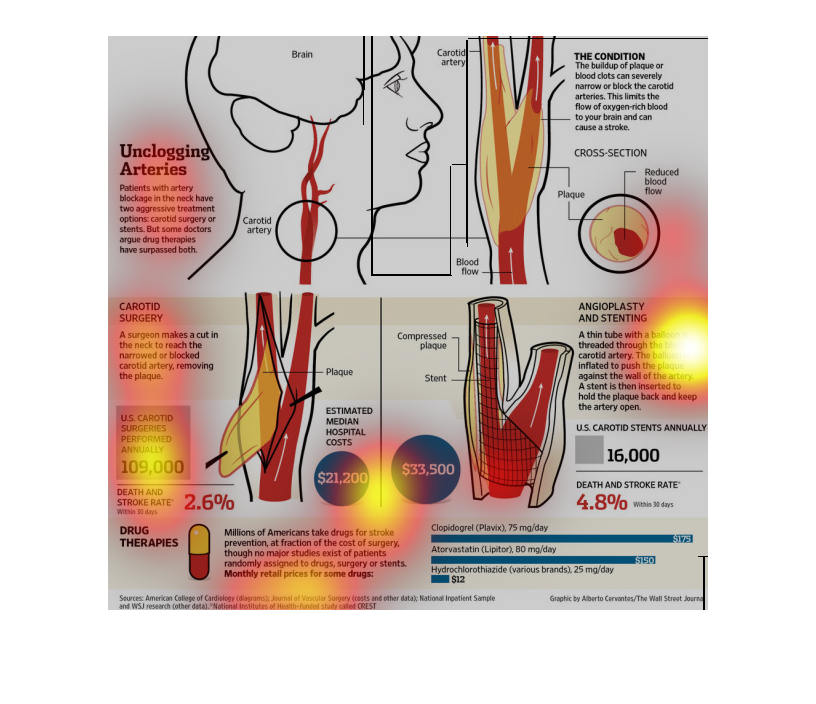
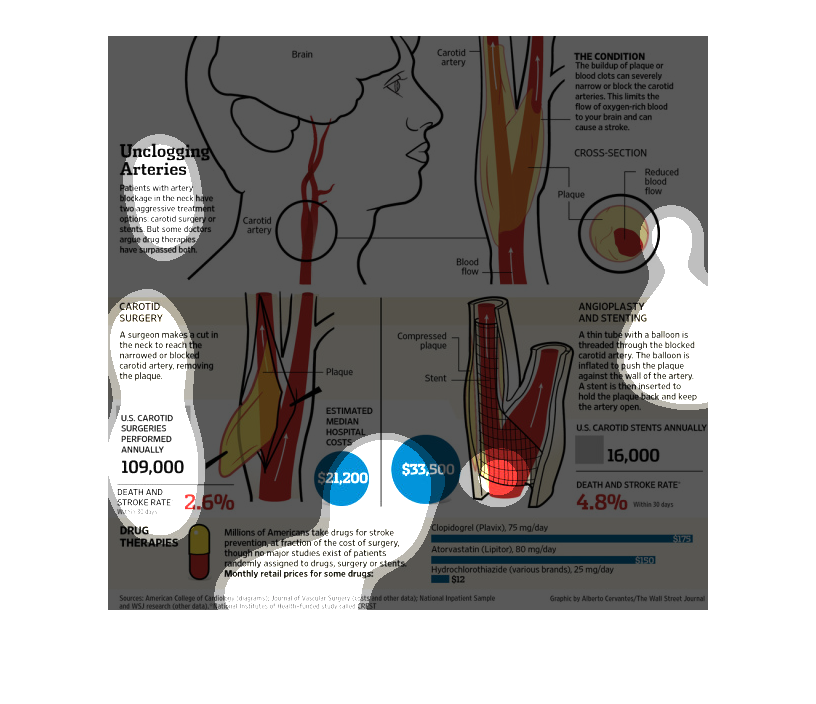
The following graph depicts the process to unclog arteries. It say that their are 109,000
Cartio Surgeries in the US each year. It also tells about the different medications that are
prescribed to these people.
The image depicts the benefits of unclogging arteries and living healthier, as it will eventually
benefit your health and/or decrease medical costs incurred by having surgery for complications
related to arteries.
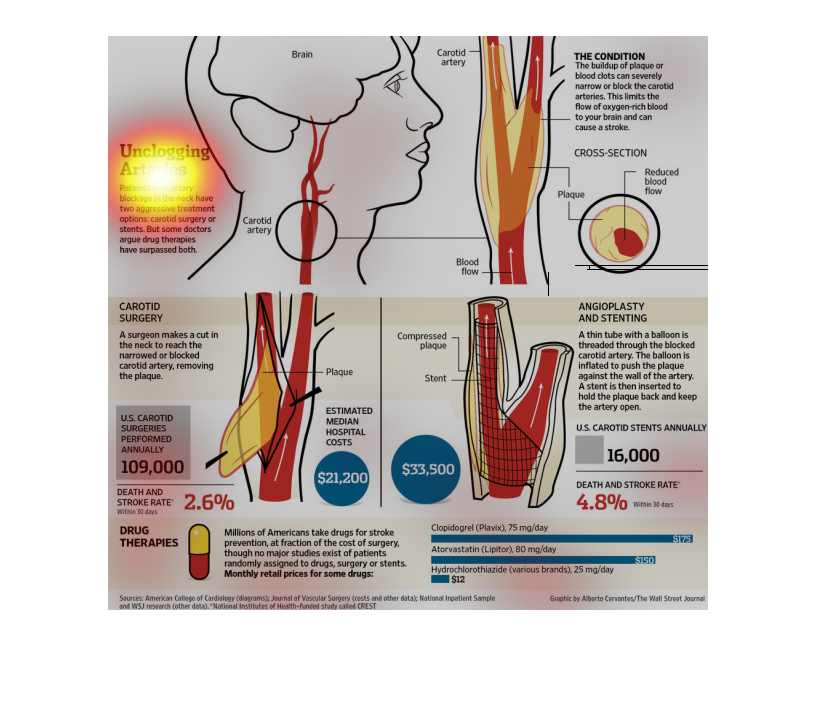
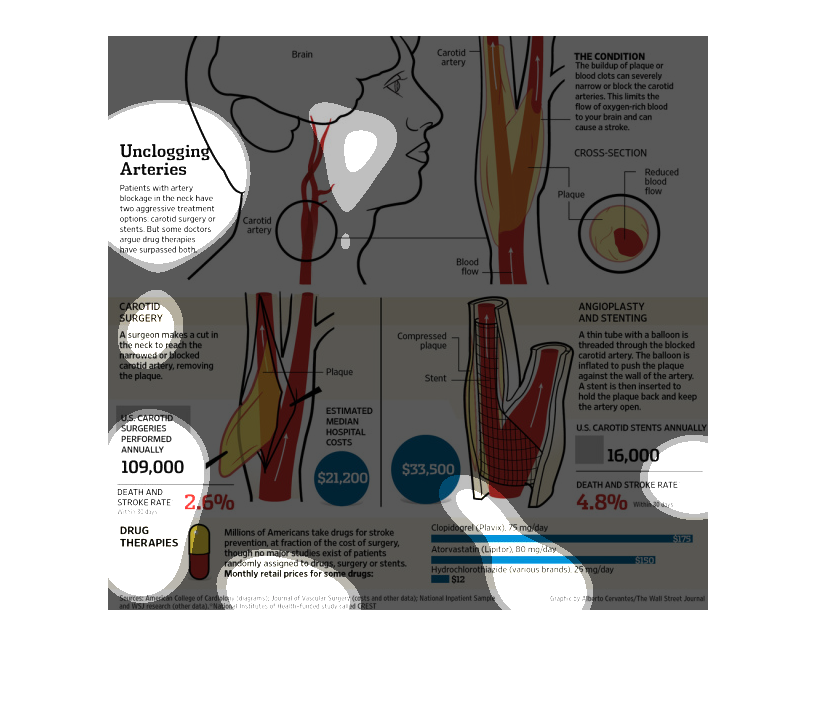
This is a paper about unclogging arteries using Carotid surgery, drug therapy, Angioplasty
and stents. There is also stated an estimate of 21.200 Hospital cost for procedures.
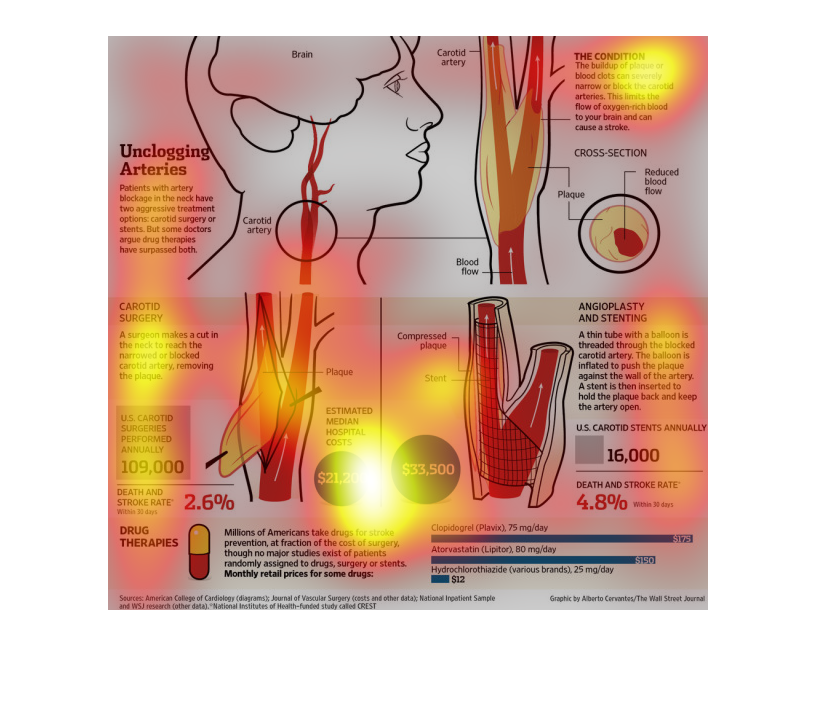
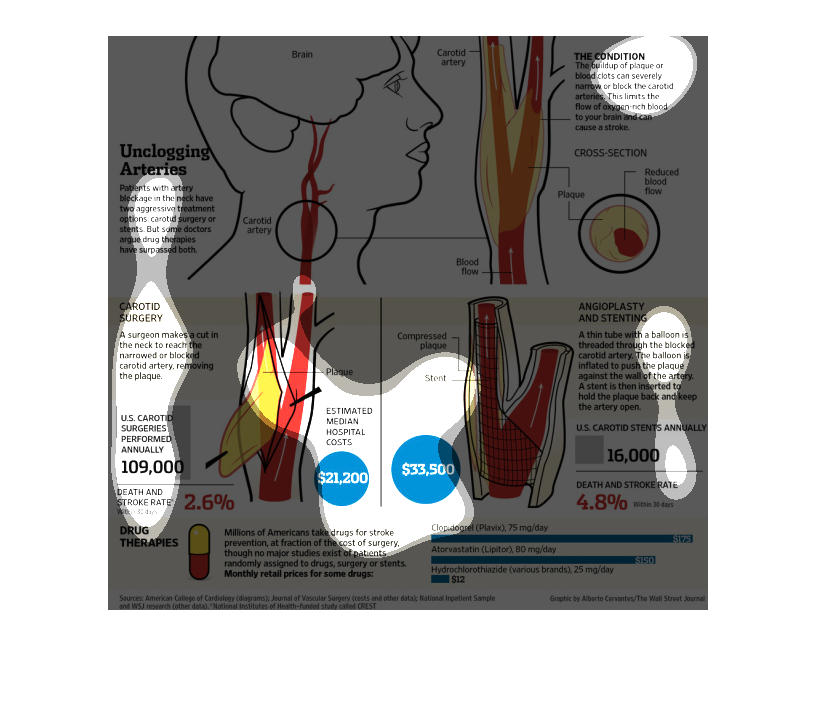
The chart deals with the topic of unclogging arteries, displaying a cross section of a clogged
human artery. The chart displays images of arteries with important statistics about the number
of carotid surgeries performed annually for Americans, along with listings of drug therapies.
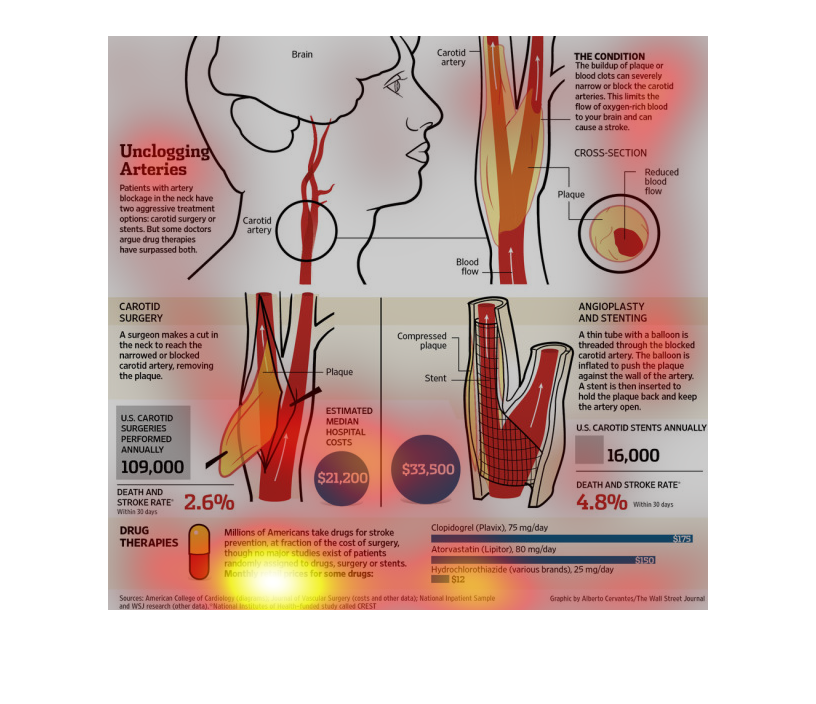
The chart provides detailed information about specific procedures pertaining to the unclogging
of arteries, including angioplasty and stenting.
Neither of these are actual graphs, but are instead detailed pictures on Unclogging Arteries.
Each one has different sections of information next to their respective body parts.
This is a diagram regarding statistics and data about the health of people's health regarding
their arteries and veins. It shows the median medical costs of certain problems.
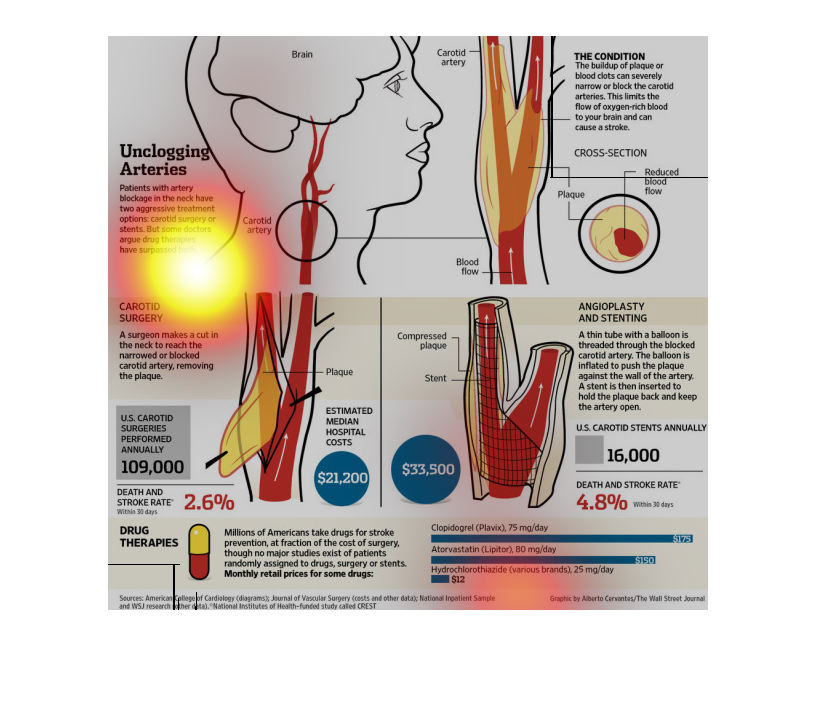
This is a chart about unclogging arteries. It displays different methods and the different
costs associated with those methods. This is a medical graph of the topic.
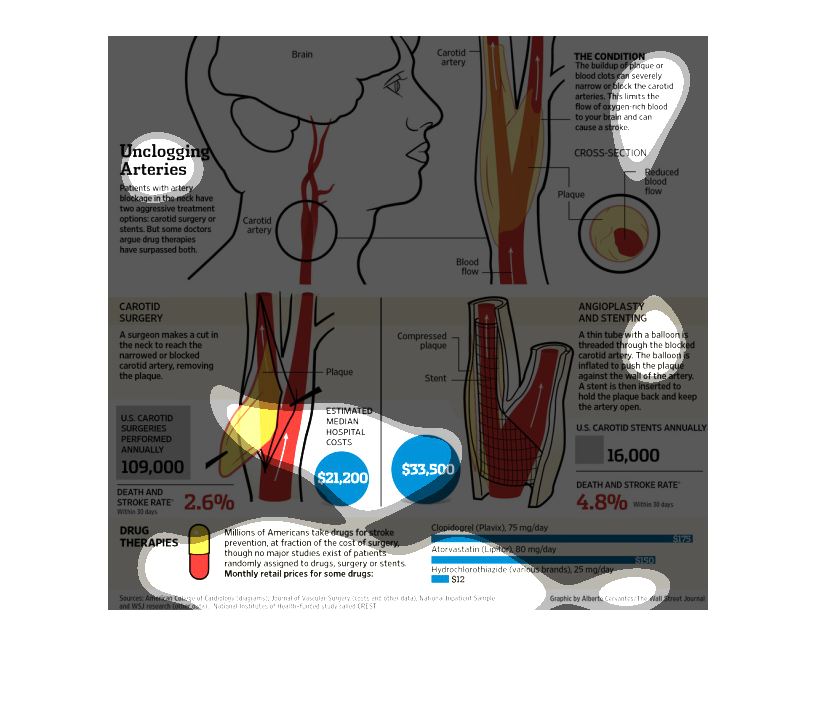
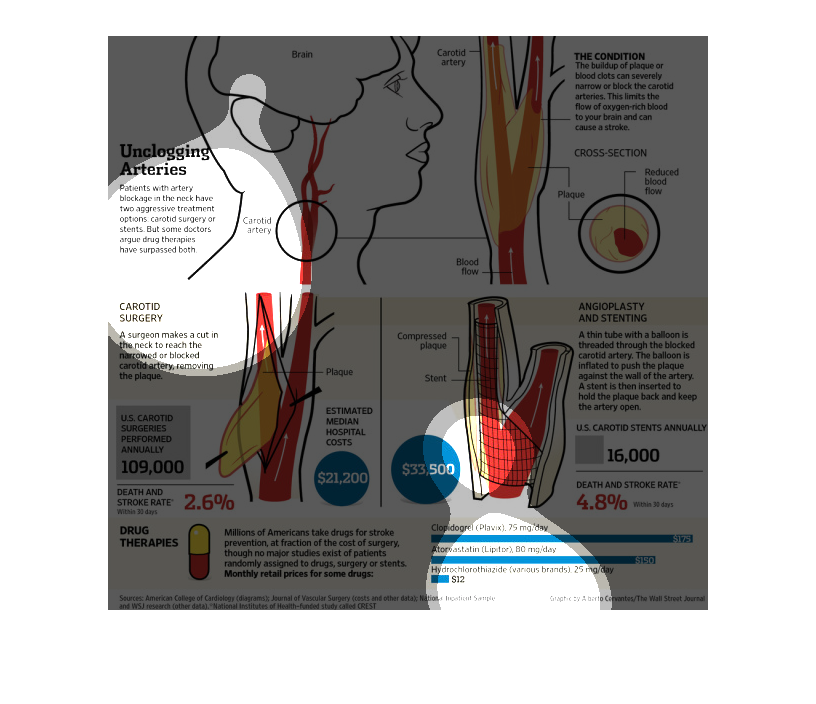
This chart is about unclogging arteries and details medical costs associated, cardio surgeries,
death and stroke rates, drug therapies, angioplasties and stinting, and a cross section of
an artery.
This chart depicts what happens within your body to cause a stroke. It is part informational
and part advertisement, because at the bottom there is a bar graph to show the cost of different
drugs to prevent stroke, one of them being significantly cheaper than the others.
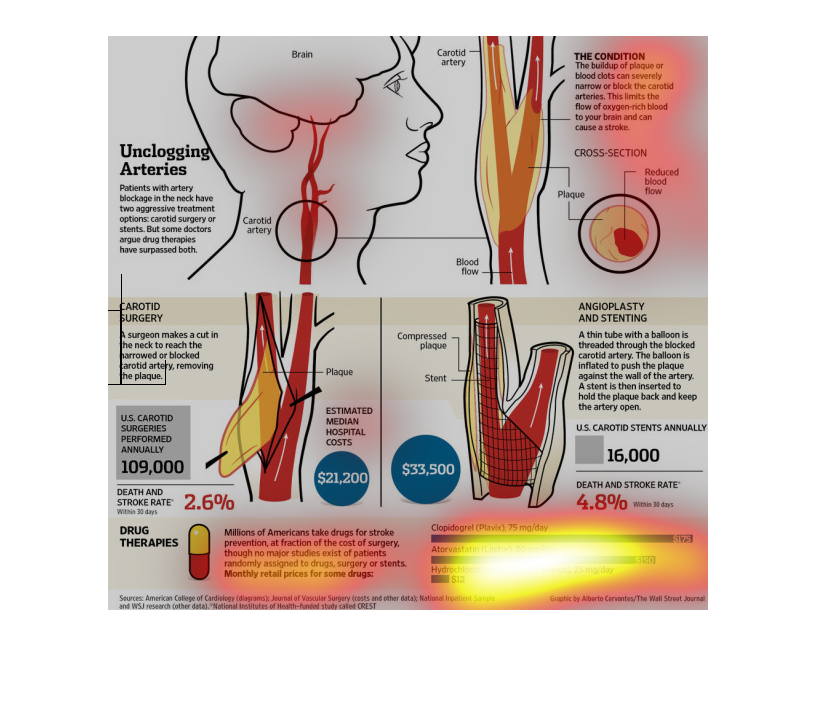
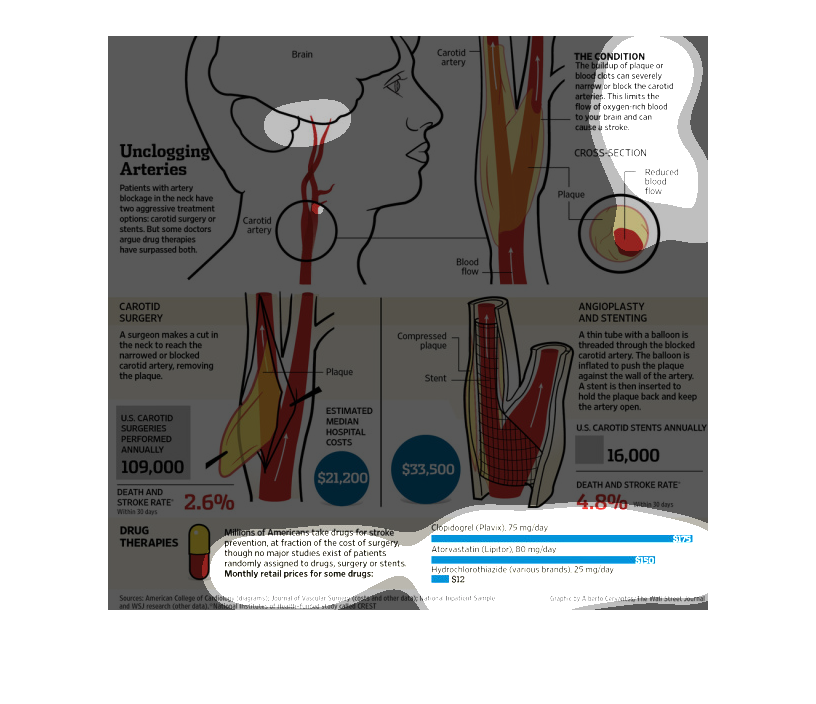
This graph shows the number of carotid surgeries that have been performed in the united states.
It also shows the number and cost of drugs that have been used in drug therapies. Lastly it
also shows the death rate