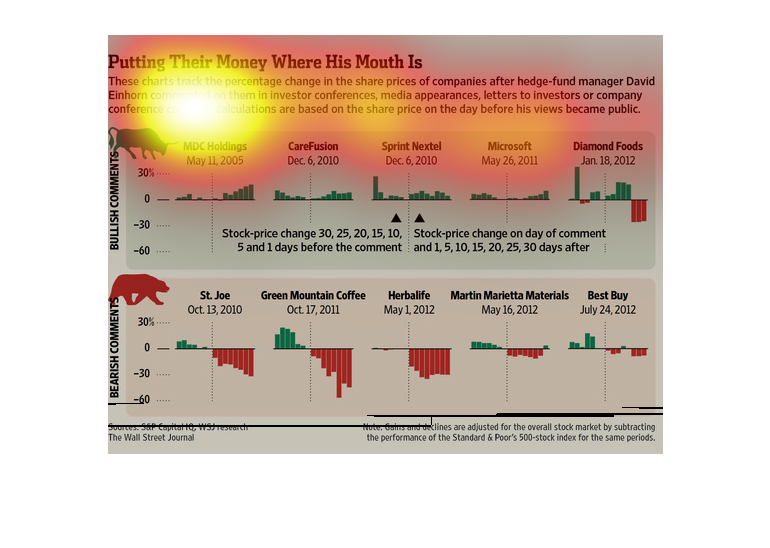
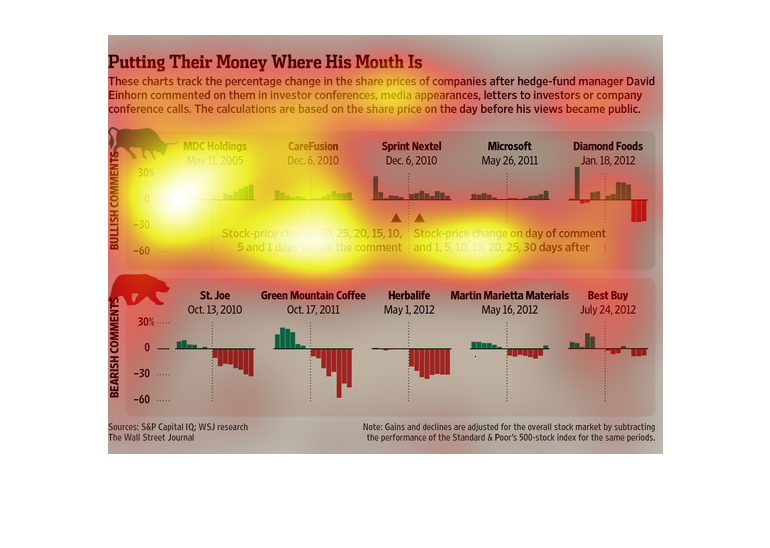
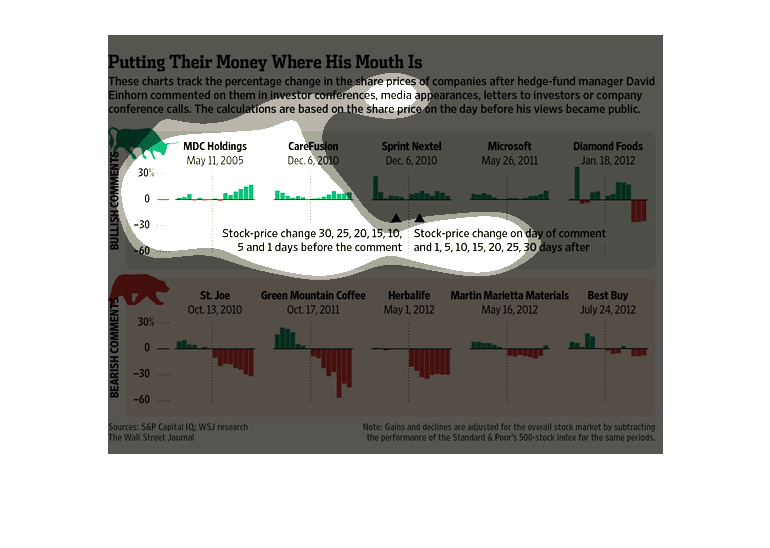
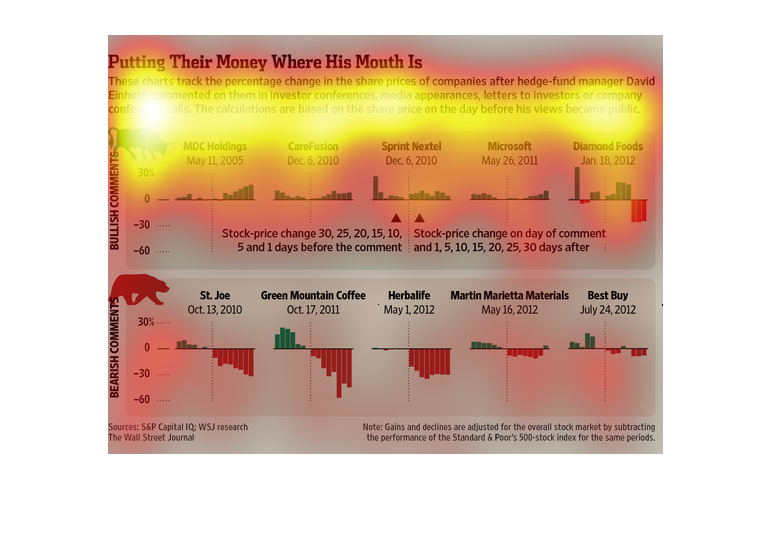
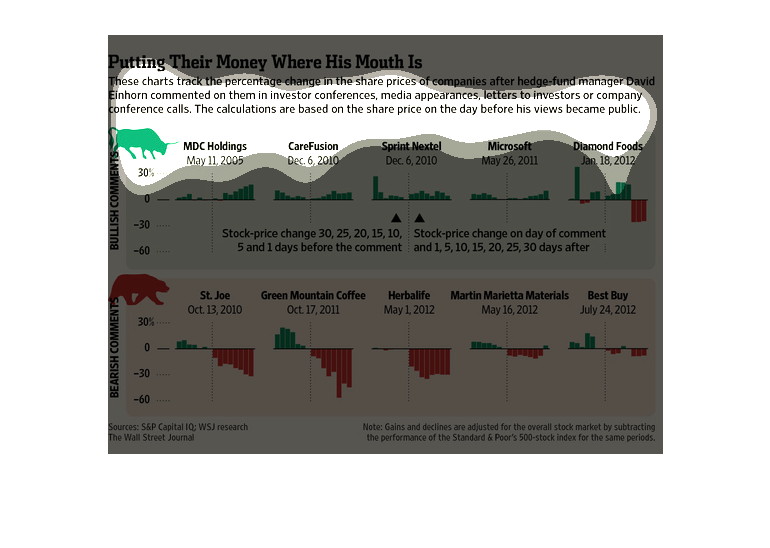
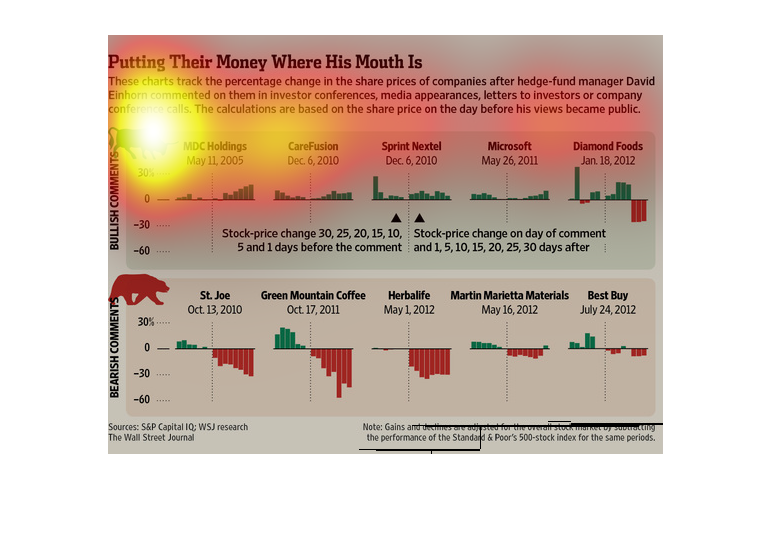
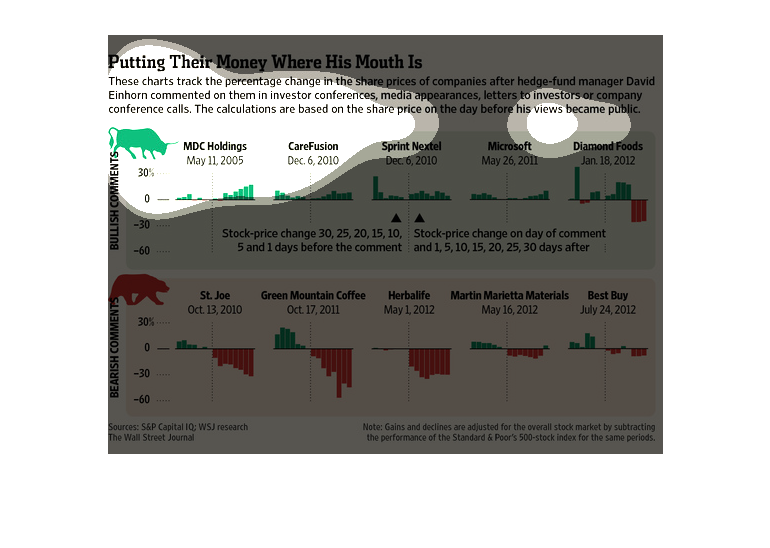
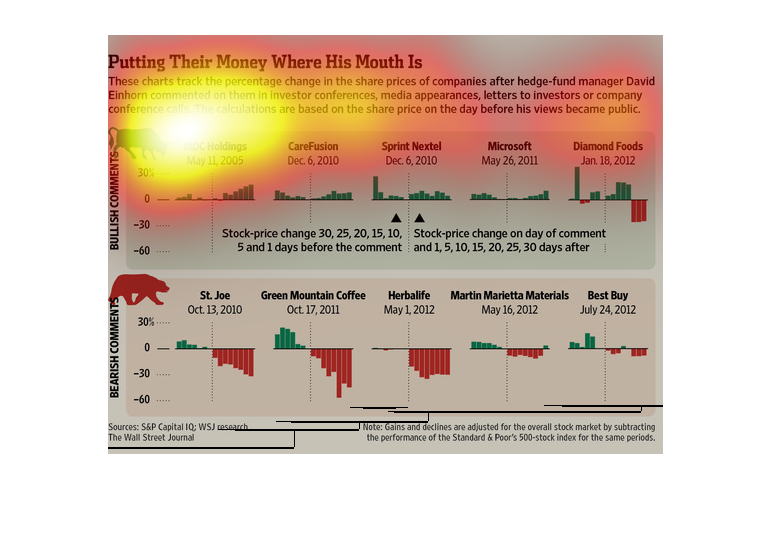
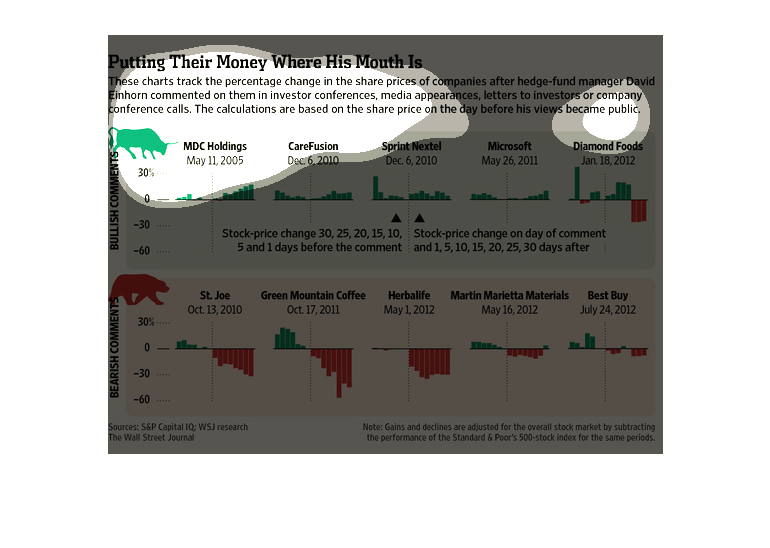
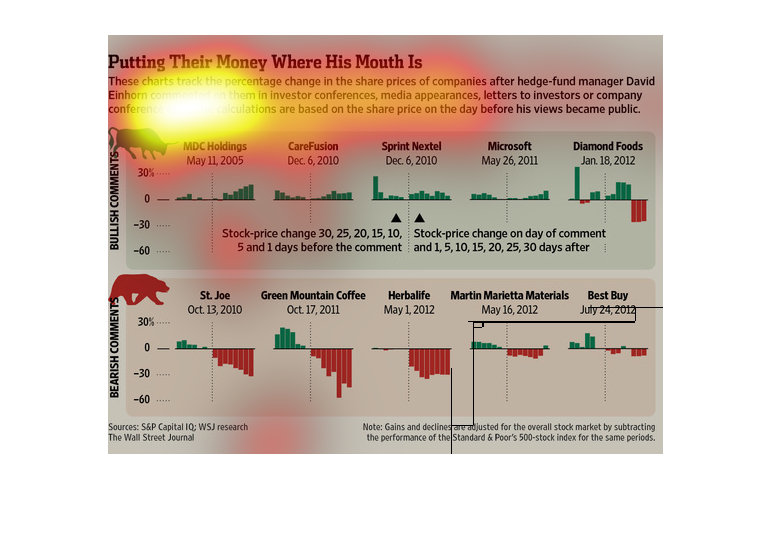
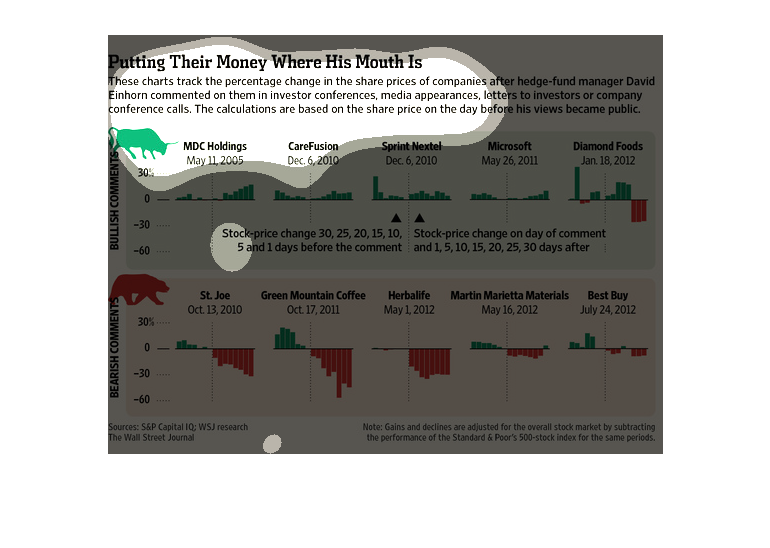
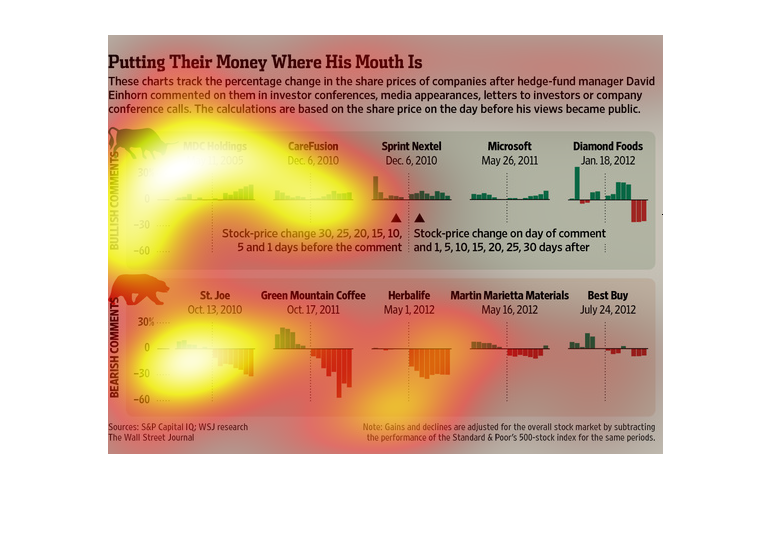
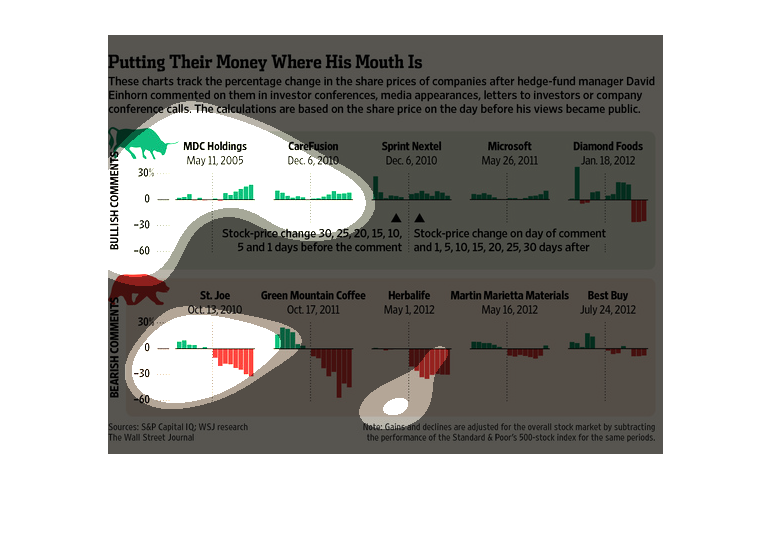
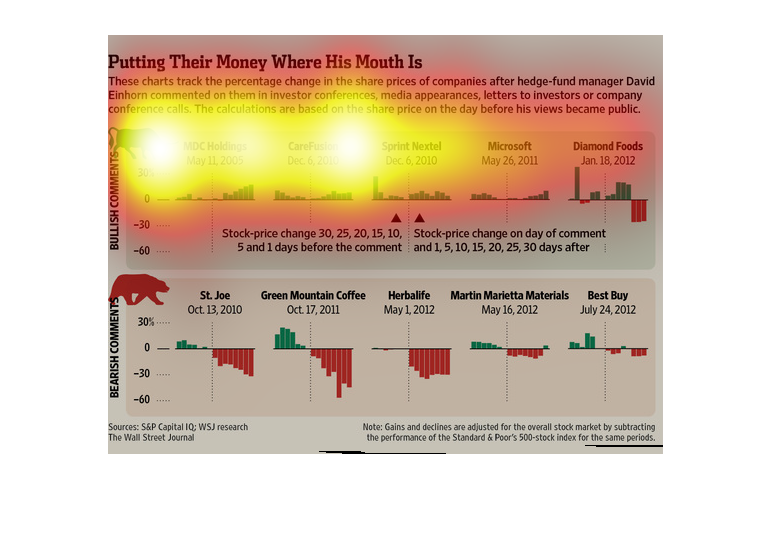
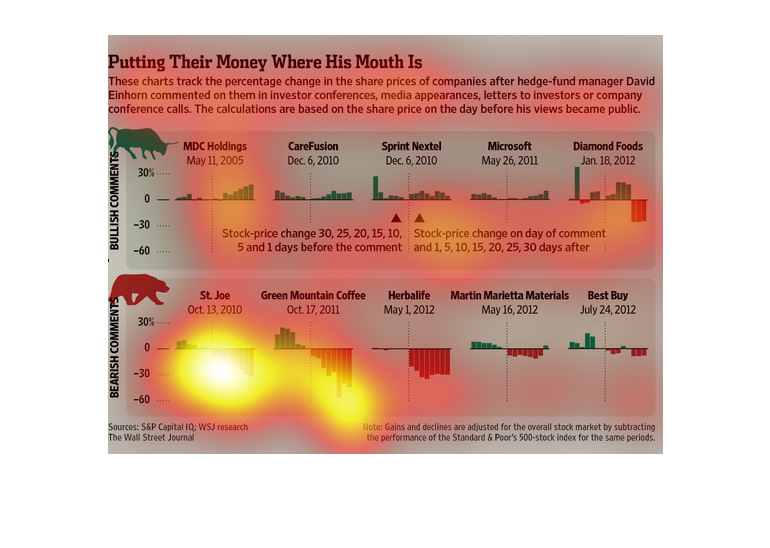
The image depicts charts tracking the percentage change in the share price of companies after
hedge-fund manager David Einhorn (known for the Einhorn effect) makes public comments about
them. The calculations are based on prices the day before the comments go public. The data
indicates that the "Einhorn Effect" (his sway over investors) is palpable.

These charts are showing the impact on companies share prices after David Einhorn in various
media appearances and meetings. Companies saw change as early as one day after his mentions.
The chart describes the effect of a hedge fund manager's comments on a variety of businesses.
 Some are bullish comments, and those tend to show a general increase in the companies' relative
values in the days proceeding the comments.  Bearish comments tend to hurt the companies,
such as Best Buy.
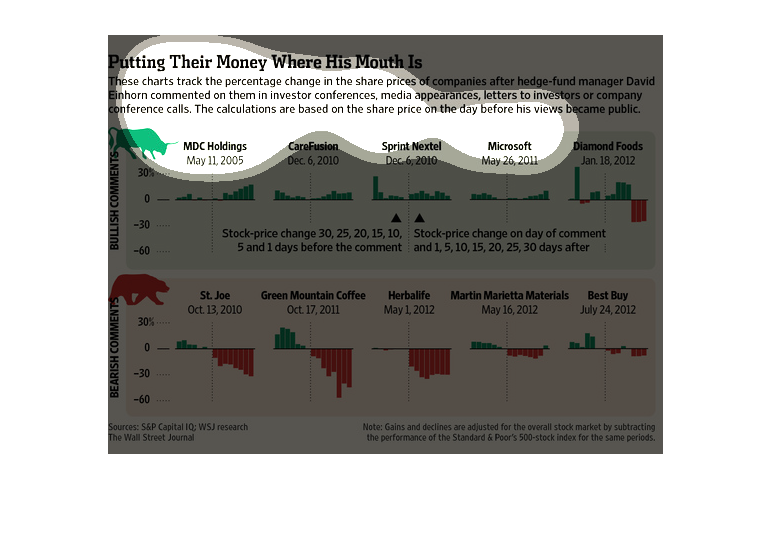
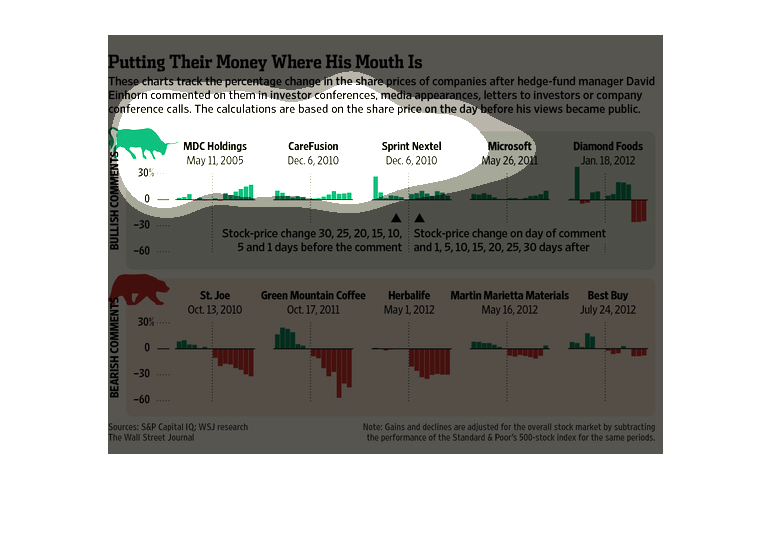
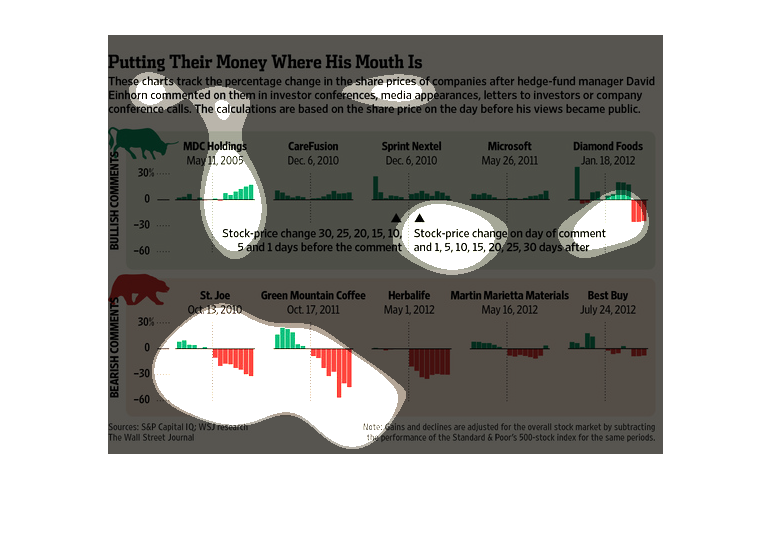
This page has charts tracking the percentage change in the share prices of companies after
hedge-fund manager David Einhorn commented on them in investor conferences, media appearances,
letters to investors or company conference calls.
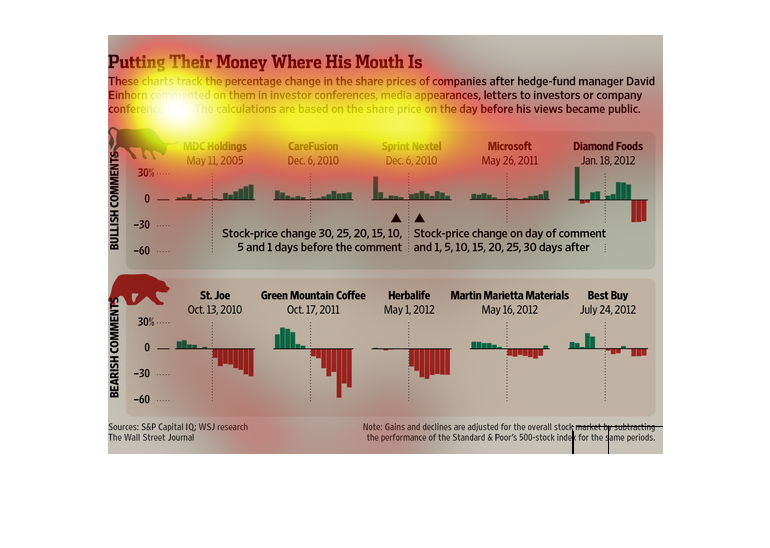
This chart describes putting their money where his mouth is. Specifically, these charts track
the percentage change in the share prices of companies after hedge fund manager David Einhorn
commented on them.
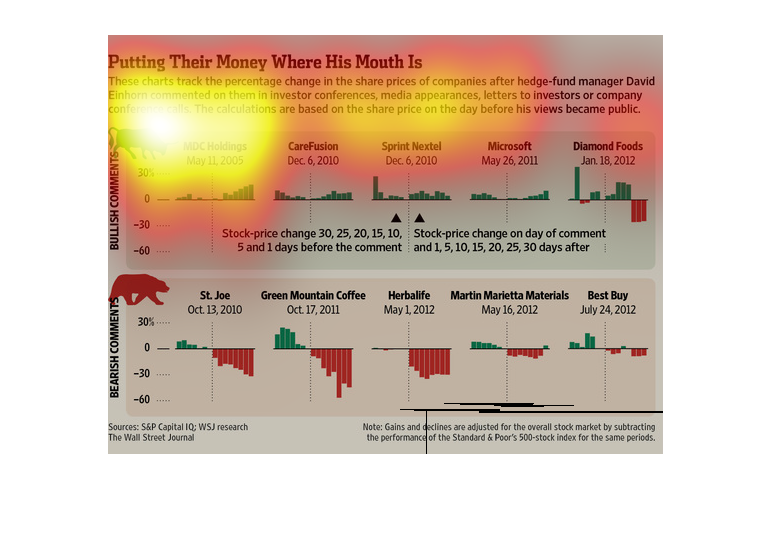
This is a series of graphs and charts depicting the percentage change in the share prices
of companies after hedge fund manager David Einhorn commented on them in investor conference,
media appearances etc.
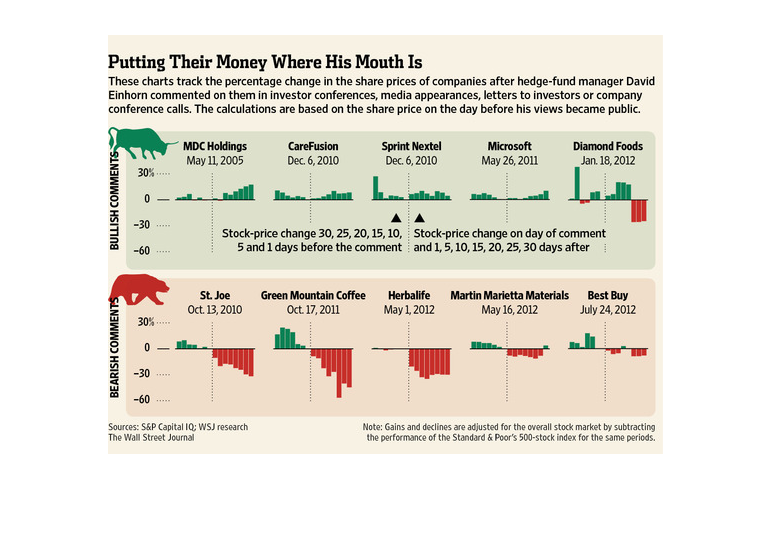
"Putting their money where his mouth is" is the title of these charts. The first one is a
bar graph concerning Bullish Comments that are mostly all green. The second is for Bearish
Comments that dip between red and green, with red representing negative numbers.
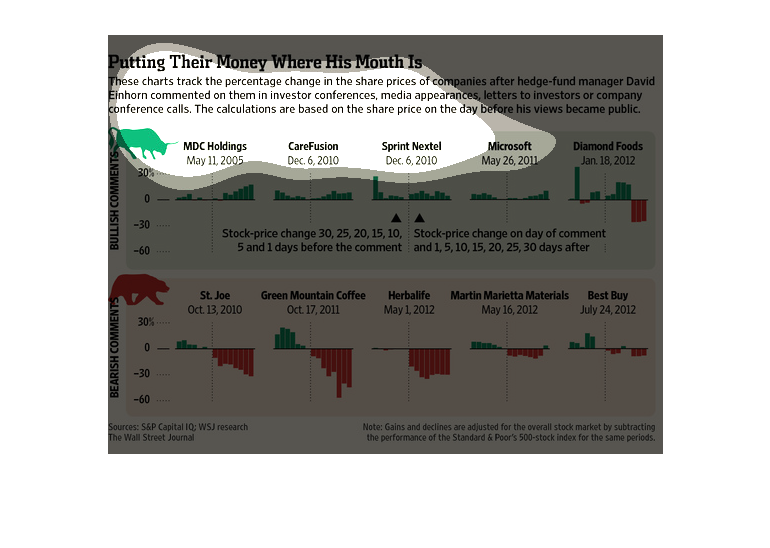
The image depicts David Einhorn's skill at manipulating stocks by simply discussing them publicly,
and by extension spurring speculators to follow his lead. Stock calculations are based on
the share price the day before his statements go public, and show how he skillfully manipulates
speculators and corporations themselves.
This is a graphical chart/timeline and related statistics depicting the relation of the share
price of some companies share prices after David Einhorn speaks about them.
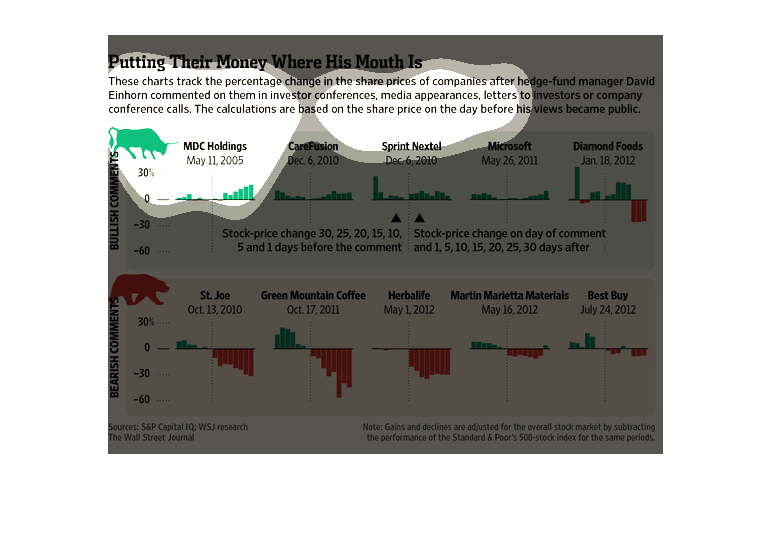
David Einhorn's opinions about a company's worth has a significant effect on that company's
stock prices. For about two weeks after a "tip" about a company's value, stock prices rise
or drop accordingly. This effect is more prominent when Einhorn says something negative about
a company, sometimes causing a drop of 60-80% of a stock's value.
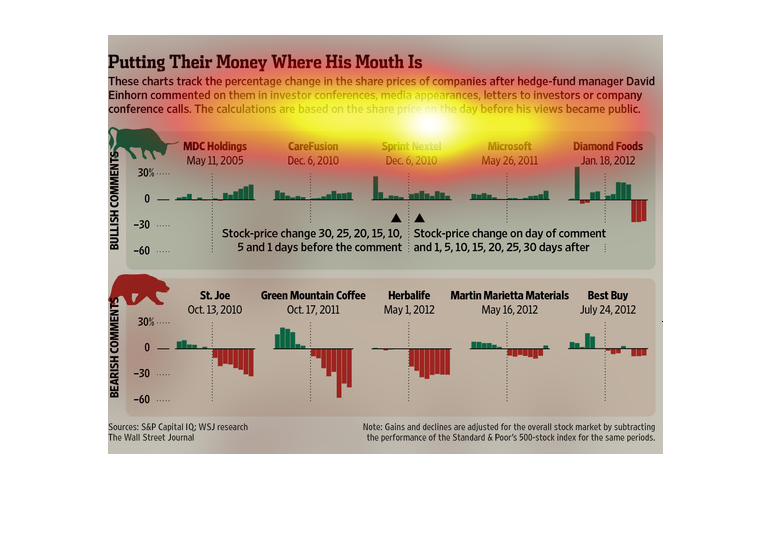
This graph shows the change in price of certain stocks after the firms are commented on by
a hedge fund manager. The changes are shown in percentage change.
This chart describes putting their money where his mouth is. Specifically, these charts track
the percentage change in the share prices or companies after hedge fund manager.